consolidated financial statements 2016 - … 4.2 notes to the consolidated financial statements...
TRANSCRIPT

1
CONSOLIDATED FINANCIAL STATEMENTS 2016
2
4.2 Notes to the consolidated financial statements
CONSOLIDATED FINANCIAL STATEMENTS 2016………………………………………………………….……………….1
4.2.1 Consolidated income statement ................................................................................................................................ 3
4.2.2 Consolidated comprehensive income ........................................................................................................................ 4
4.2.3 Consolidated financial position .................................................................................................................................. 5
4.2.4 Changes in shareholders’ equity ............................................................................................................................... 7
4.2.5 Consolidated cash flows .......................................................................................................................................... 8
4.2.6 Notes to the consolidated financial statement ........................................................................................................ 10
4.2.6.1 Information on operating segments and regions ............................................................................................... 10
A – Information by operating segment ........................................................................................................................ 11
A1 – Consolidated income statement by operating segment .................................................................................. 11 A2 – Consolidated financial position by operating segment .................................................................................... 12 A3 – Consolidated cash flows by operating segment .............................................................................................. 15 A4 – Other information for the automotive segments: net cash position or net financial indebtness and operational free cash flow ........................................................................................................................................................ 19
B – Information by region................................................................................................................................................
4.2.6.2 Accounting policies and scope of consolidation .............................................................................................. 21
Note 1 – Approval of the financial statements......................................................................................................... 21 Note 2 – Accounting policies .................................................................................................................................. 21 Note 3 – Changes in the scope of consolidation ..................................................................................................... 36
4.2.6.3 Income statement and comprehensive income ......................................................................................... 38
Note 4 – Revenues ................................................................................................................................................ 38 Note 5 – Operating margin: details of income and expenses by nature .................................................................. 39 Note 6 – Other operating income and expenses ..................................................................................................... 39 Note 7 – Financial income (expenses) ................................................................................................................... 41 Note 8 – Current and deferred taxes ...................................................................................................................... 41 Note 9 – Basic and diluted earnings per share ....................................................................................................... 44
4.2.6.4 Operating assets and liabilities, shareholders’ equity ...................................................................................... 44
Note 10 – Intangible assets and property, plant and equipment ............................................................................. 44 Note 11 – Impairment tests on fixed assets (other than leased assets) .................................................................. 47 Note 12 – Investment in Nissan .............................................................................................................................. 47 Note 13 – Investments in other associates and joint ventures ................................................................................ 52 Note 14 – Inventories ............................................................................................................................................. 57 Note 15 – Sales financing receivables .................................................................................................................... 57 Note 16 – Automotive receivables .......................................................................................................................... 59 Note 17 – Other current and non-current assets ..................................................................................................... 60 Note 18 – Shareholders' equity .............................................................................................................................. 60 Note 19 – Provisions for pensions and other long-term employee benefit obligations ............................................. 66 Note 20 – Change in provisions ............................................................................................................................. 70 Note 21 – Other current and non-current liabilities.................................................................................................. 71
4.2.6.5 Financial assets and liabilities, fair value and management of financial risks ............................................. 72
Note 22 – Financial assets – cash and cash equivalents ........................................................................................ 72 Note 23 – Financial liabilities and sales financing debts ......................................................................................... 73 Note 24 – Financial instruments by level, fair value and impact on net income ....................................................... 79 Note 25 – Derivatives and management of financial risks ....................................................................................... 85
4.2.6.6 Cash flows and other information .............................................................................................................. 92
Note 26 – Cash flows ............................................................................................................................................. 92 Note 27 – Related parties ....................................................................................................................................... 93 Note 28 – Off-balance sheet commitments and contingent assets and liabilities .................................................... 94 Note 29 – Fees paid to statutory auditors and their network ................................................................................... 95 Note 30 – Subsequent events ................................................................................................................................ 95 Note 31 – Consolidated companies ........................................................................................................................ 96
3
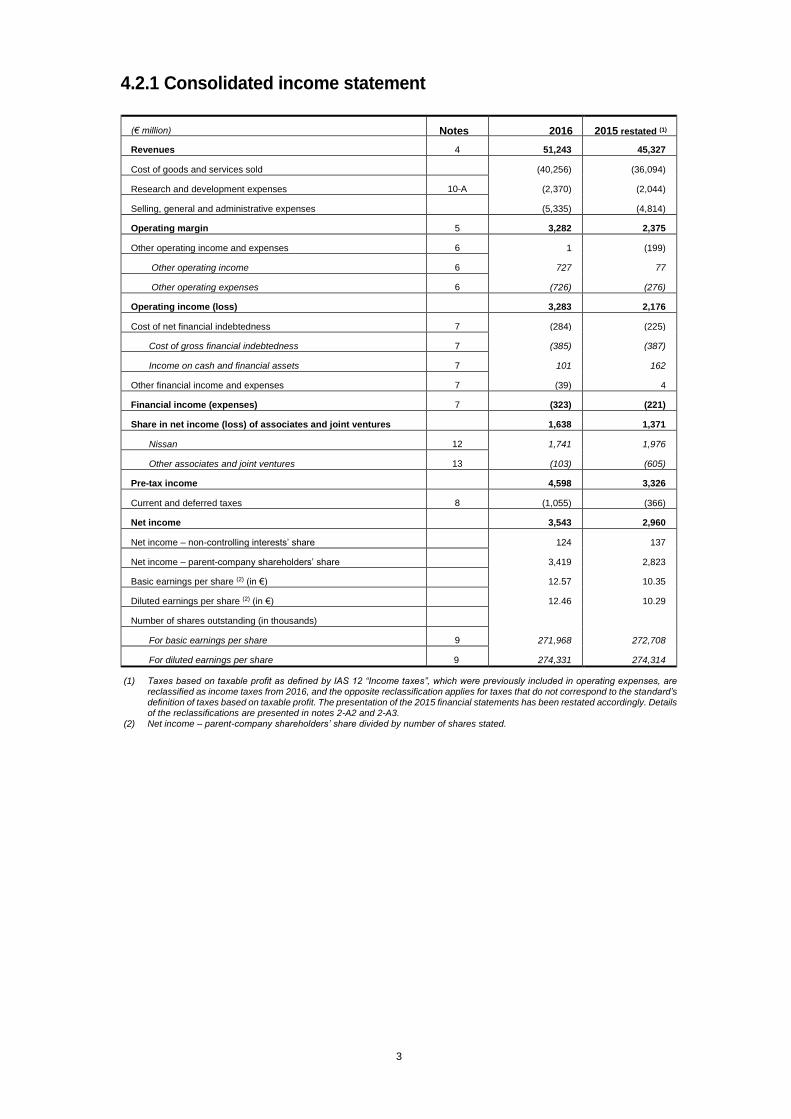
4.2.1 Consolidated income statement
(€ million) Notes 2016 2015 restated (1)
Revenues 4 51,243 45,327
Cost of goods and services sold (40,256) (36,094)
Research and development expenses 10-A (2,370) (2,044)
Selling, general and administrative expenses (5,335) (4,814)
Operating margin 5 3,282 2,375
Other operating income and expenses 6 1 (199)
Other operating income 6 727 77
Other operating expenses 6 (726) (276)
Operating income (loss) 3,283 2,176
Cost of net financial indebtedness 7 (284) (225)
Cost of gross financial indebtedness 7 (385) (387)
Income on cash and financial assets 7 101 162
Other financial income and expenses 7 (39) 4
Financial income (expenses) 7 (323) (221)
Share in net income (loss) of associates and joint ventures 1,638 1,371
Nissan 12 1,741 1,976
Other associates and joint ventures 13 (103) (605)
Pre-tax income 4,598 3,326
Current and deferred taxes 8 (1,055) (366)
Net income 3,543 2,960
Net income – non-controlling interests’ share 124 137
Net income – parent-company shareholders’ share 3,419 2,823
Basic earnings per share (2) (in €) 12.57 10.35
Diluted earnings per share (2) (in €) 12.46 10.29
Number of shares outstanding (in thousands)
For basic earnings per share 9 271,968 272,708
For diluted earnings per share 9 274,331 274,314
(1) Taxes based on taxable profit as defined by IAS 12 “Income taxes”, which were previously included in operating expenses, are reclassified as income taxes from 2016, and the opposite reclassification applies for taxes that do not correspond to the standard’s definition of taxes based on taxable profit. The presentation of the 2015 financial statements has been restated accordingly. Details of the reclassifications are presented in notes 2-A2 and 2-A3.
(2) Net income – parent-company shareholders’ share divided by number of shares stated.
4
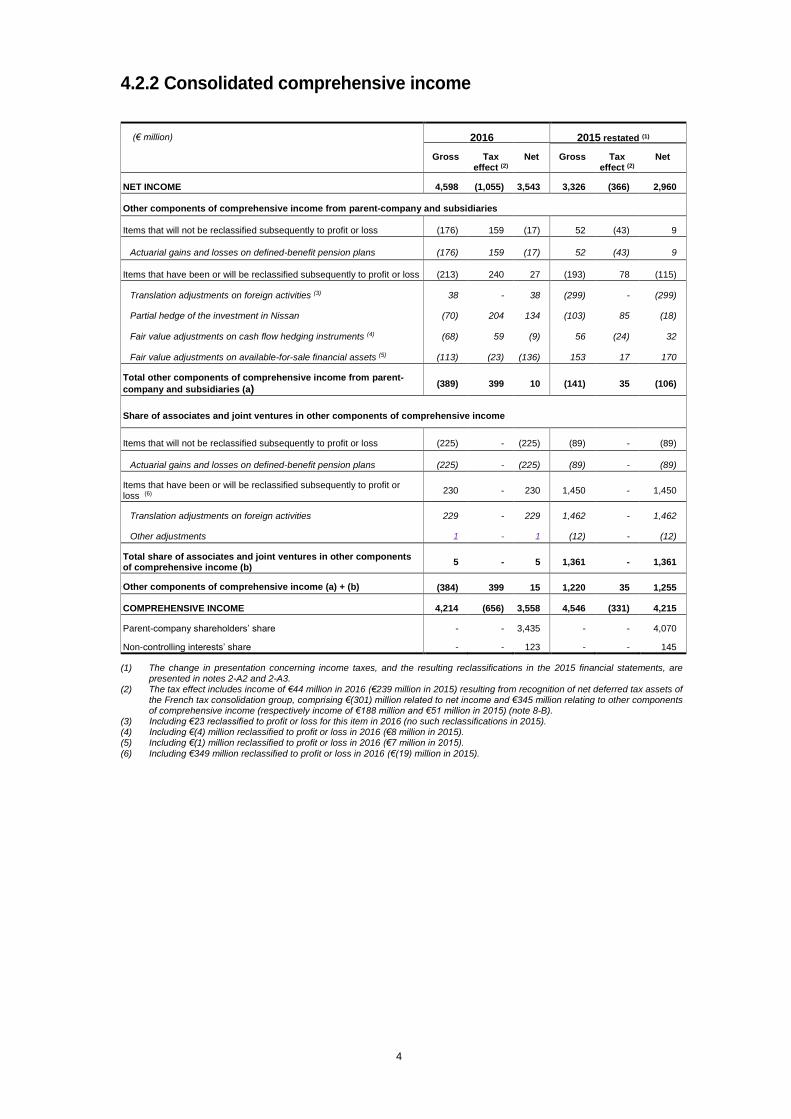
4.2.2 Consolidated comprehensive income
(€ million) 2016 2015 restated (1)
Gross Tax effect (2)
Net Gross Tax effect (2)
(1)
Net
NET INCOME 4,598 (1,055) 3,543 3,326 (366) 2,960
Other components of comprehensive income from parent-company and subsidiaries
Items that will not be reclassified subsequently to profit or loss (176) 159 (17) 52 (43) 9
Actuarial gains and losses on defined-benefit pension plans (176) 159 (17) 52 (43) 9
Items that have been or will be reclassified subsequently to profit or loss (213) 240 27 (193) 78 (115)
Translation adjustments on foreign activities (3) 38 - 38 (299) - (299)
Partial hedge of the investment in Nissan (70) 204 134 (103) 85 (18)
Fair value adjustments on cash flow hedging instruments (4) (68) 59 (9) 56 (24) 32
Fair value adjustments on available-for-sale financial assets (5) (113) (23) (136) 153 17 170
Total other components of comprehensive income from parent-
company and subsidiaries (a) (389) 399 10 (141) 35 (106)
Share of associates and joint ventures in other components of comprehensive income
Items that will not be reclassified subsequently to profit or loss (225) - (225) (89) - (89)
Actuarial gains and losses on defined-benefit pension plans (225) - (225) (89) - (89)
Items that have been or will be reclassified subsequently to profit or loss (6)
230 - 230 1,450 - 1,450
Translation adjustments on foreign activities 229 - 229 1,462 - 1,462
Other adjustments 1 - 1 (12) - (12)
Total share of associates and joint ventures in other components of comprehensive income (b)
5 - 5 1,361 - 1,361
Other components of comprehensive income (a) + (b) (384) 399 15 1,220 35 1,255
COMPREHENSIVE INCOME 4,214 (656) 3,558 4,546 (331) 4,215
Parent-company shareholders’ share
Non-controlling interests’ share
-
-
-
-
3,435
123
-
-
-
-
4,070
145
(1) The change in presentation concerning income taxes, and the resulting reclassifications in the 2015 financial statements, are presented in notes 2-A2 and 2-A3.
(2) The tax effect includes income of €44 million in 2016 (€239 million in 2015) resulting from recognition of net deferred tax assets of the French tax consolidation group, comprising €(301) million related to net income and €345 million relating to other components of comprehensive income (respectively income of €188 million and €51 million in 2015) (note 8-B).
(3) Including €23 reclassified to profit or loss for this item in 2016 (no such reclassifications in 2015). (4) Including €(4) million reclassified to profit or loss in 2016 (€8 million in 2015). (5) Including €(1) million reclassified to profit or loss in 2016 (€7 million in 2015).
(6) Including €349 million reclassified to profit or loss in 2016 (€(19) million in 2015).
5
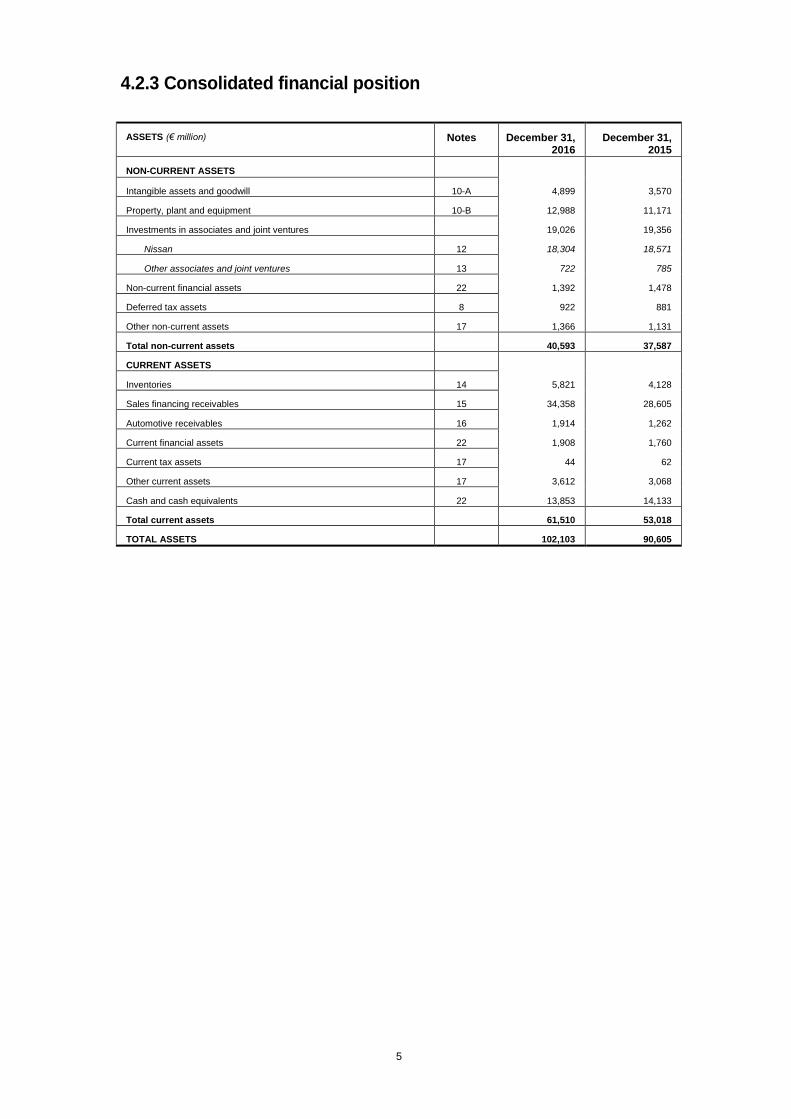
4.2.3 Consolidated financial position
ASSETS (€ million) Notes December 31, 2016
December 31, 2015
NON-CURRENT ASSETS
Intangible assets and goodwill 10-A 4,899 3,570
Property, plant and equipment 10-B 12,988 11,171
Investments in associates and joint ventures 19,026 19,356
Nissan 12 18,304 18,571
Other associates and joint ventures 13 722 785
Non-current financial assets 22 1,392 1,478
Deferred tax assets 8 922 881
Other non-current assets 17 1,366 1,131
Total non-current assets 40,593 37,587
CURRENT ASSETS
Inventories 14 5,821 4,128
Sales financing receivables 15 34,358 28,605
Automotive receivables 16 1,914 1,262
Current financial assets 22 1,908 1,760
Current tax assets 17 44 62
Other current assets 17 3,612 3,068
Cash and cash equivalents 22 13,853 14,133
Total current assets 61,510 53,018
TOTAL ASSETS 102,103 90,605
6
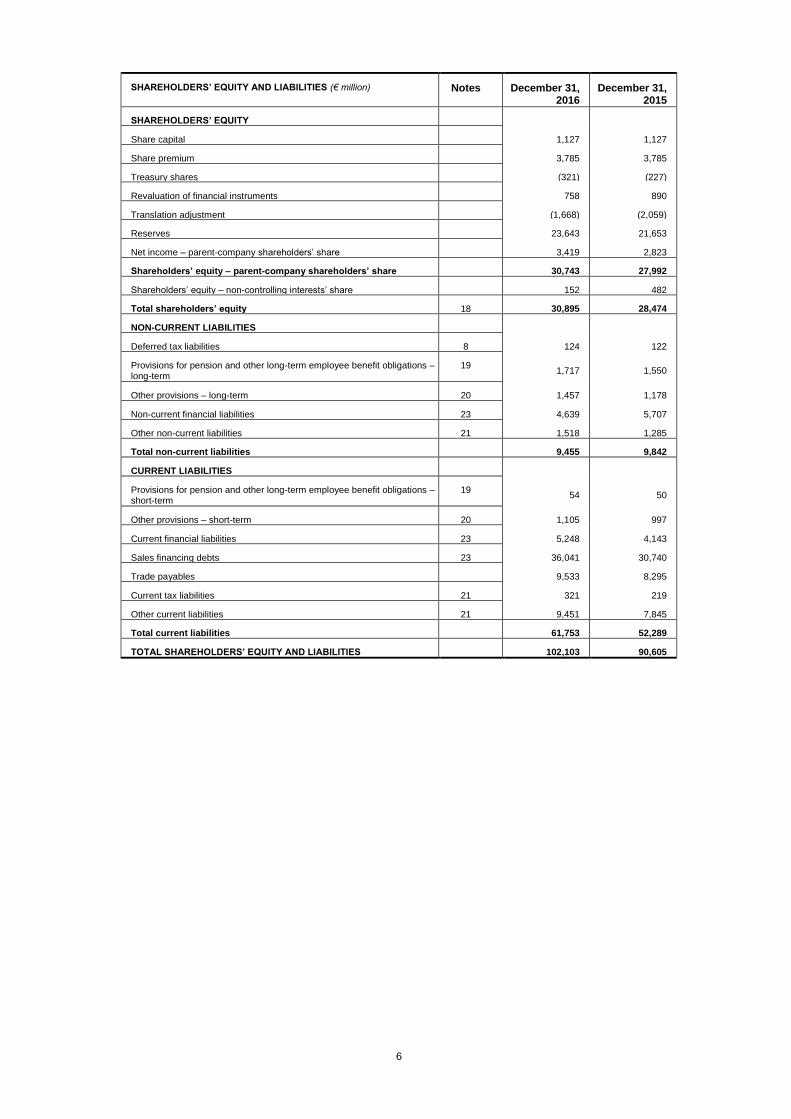
SHAREHOLDERS’ EQUITY AND LIABILITIES (€ million) Notes December 31, 2016
December 31, 2015
SHAREHOLDERS’ EQUITY
Share capital 1,127 1,127
Share premium 3,785 3,785
Treasury shares (321) (227)
Revaluation of financial instruments 758 890
Translation adjustment (1,668) (2,059)
Reserves 23,643 21,653
Net income – parent-company shareholders’ share 3,419 2,823
Shareholders’ equity – parent-company shareholders’ share 30,743 27,992
Shareholders’ equity – non-controlling interests’ share 152 482
Total shareholders’ equity 18 30,895 28,474
NON-CURRENT LIABILITIES
Deferred tax liabilities 8 124 122
Provisions for pension and other long-term employee benefit obligations – long-term
19 1,717 1,550
Other provisions – long-term 20 1,457 1,178
Non-current financial liabilities 23 4,639 5,707
Other non-current liabilities 21 1,518 1,285
Total non-current liabilities 9,455 9,842
CURRENT LIABILITIES
Provisions for pension and other long-term employee benefit obligations – short-term
19 54 50
Other provisions – short-term 20 1,105 997
Current financial liabilities 23 5,248 4,143
Sales financing debts 23 36,041 30,740
Trade payables 9,533 8,295
Current tax liabilities 21 321 219
Other current liabilities 21 9,451 7,845
Total current liabilities 61,753 52,289
TOTAL SHAREHOLDERS’ EQUITY AND LIABILITIES 102,103 90,605

7
4.2.4 Changes in shareholders’ equity
(€ million) Number of shares
(thousand)
Share capital
Share premium
Treasury shares
Revaluation
of financial instruments
Translation adjustment
Reserves Net income (parent-company
shareholders’ share)
Shareholders’ equity (parent-
company shareholders’
share)
Shareholders’ equity (non-controlling
entities’ share)
Total shareholders’
equity
Balance at December 31, 2014 as published
295,722 1,127 3,785 (134) 703 (3,276) 20,381 1,890 24,476 422 24,898
Restatement for application of IFRIC 21 (1)
39 39 39
AVTOVAZ restatement (2) 2 (27) 15 (10) (10)
Restated balance at December 31, 2014
295,722 1,127 3,785 (134) 703 (3,274) 20,393 1,905 24,505 422 24,927
2015 net income 2,823 2,823 137 2,960
Other components of comprehensive income (3)
187 1,138 (78) 1,247 8 1,255
2015 comprehensive income
187 1,138 (78) 2,823 4,070 145 4,215
Allocation of 2014 net income
1,905 (1,905)
Dividends (518) (518) (65) (583)
(Acquisitions) / disposals of treasury shares and impact of capital increases
(93) (93) (93)
Changes in ownership interests (4)
77 (80) (3) (20) (23)
Cost of share-based payments
31 31 31
Balance at December 31, 2015
295,722 1,127 3,785 (227) 890 (2,059) 21,653 2,823 27,992 482 28,474
2016 net income 3,419 3,419 124 3,543
Other components of comprehensive income (3)
(132) 391 (243) 16 (1) 15
2016 comprehensive income
(132) 391 (243) 3,419 3,435 123 3,558
Allocation of 2015 net income
2,823 (2,823)
Dividends (655) (655) (109) (764)
(Acquisitions) / disposals of treasury shares and impact of capital increases
(94) (94) (94)
Changes in ownership interests (4)
9 9 (344) (335)
Cost of share-based payments
56 56 56
Balance at December 31, 2016
295,722 1,127 3,785 (321) 758 (1,668) 23,643 3,419 30,743 152 30,895
(1) The restatement resulting from retrospective application of IFRIC 21 "Levies" is presented in note 2 to the 2015 consolidated financial statements. (2) For the purposes of the Renault consolidation, given the existing time constraints for production of financial information, the AVTOVAZ accounts were
previously consolidated with a 3-month time-lag. This practice ended as of December 31, 2015 (note 13-A to the 2015 consolidated financial statements). (3) Changes in reserves correspond to actuarial gains and losses net of tax on defined-benefit pension plans during the period. (4) Changes in ownership interests comprise the effect of acquisitions and disposals of investments, and commitments for buyouts of non-controlling interests.
In 2015, they include a €79 million reclassification between translation adjustments and reserves concerning the foreign exchange effect of transactions undertaken in previous years.
Details of changes in consolidated shareholders’ equity in 2016 are given in note 18.
8
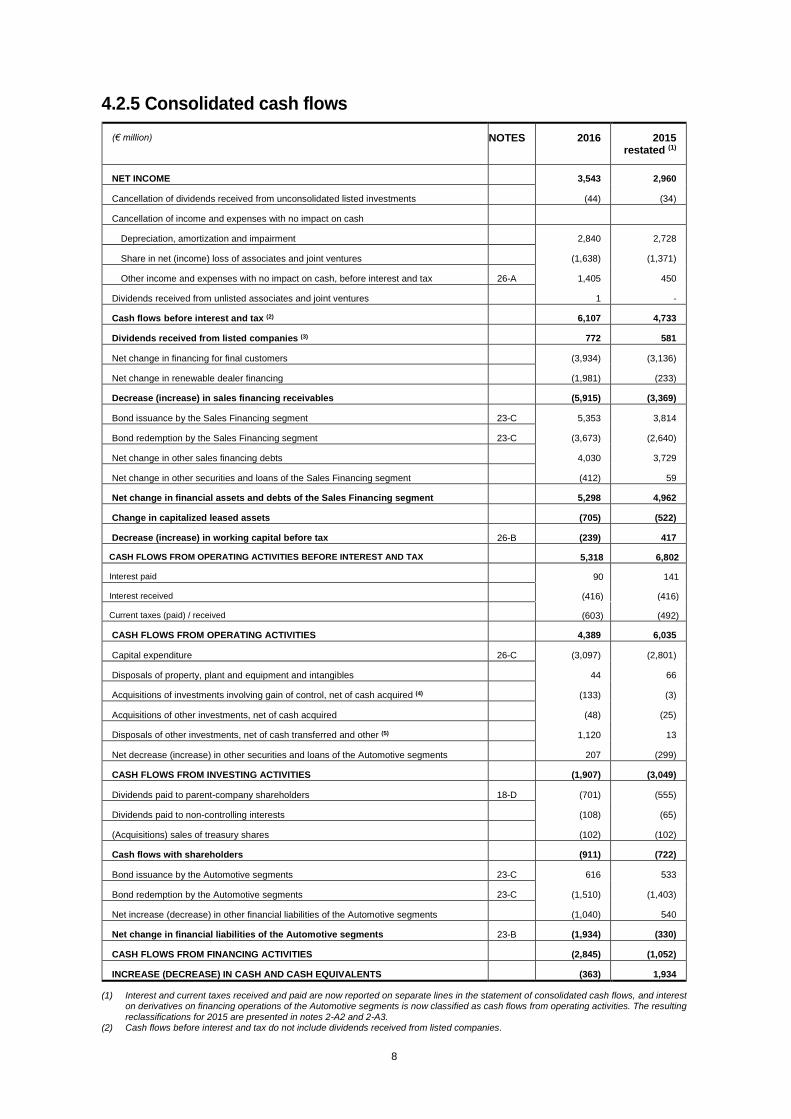
4.2.5 Consolidated cash flows
(€ million) NOTES 2016 2015
restated (1)
NET INCOME 3,543 2,960
Cancellation of dividends received from unconsolidated listed investments (44) (34)
Cancellation of income and expenses with no impact on cash
Depreciation, amortization and impairment 2,840 2,728
Share in net (income) loss of associates and joint ventures (1,638) (1,371)
Other income and expenses with no impact on cash, before interest and tax 26-A 1,405 450
Dividends received from unlisted associates and joint ventures 1 -
Cash flows before interest and tax (2) 6,107 4,733
Dividends received from listed companies (3) 772 581
Net change in financing for final customers (3,934) (3,136)
Net change in renewable dealer financing (1,981) (233)
Decrease (increase) in sales financing receivables (5,915) (3,369)
Bond issuance by the Sales Financing segment 23-C 5,353 3,814
Bond redemption by the Sales Financing segment 23-C (3,673) (2,640)
Net change in other sales financing debts 4,030 3,729
Net change in other securities and loans of the Sales Financing segment (412) 59
Net change in financial assets and debts of the Sales Financing segment 5,298 4,962
Change in capitalized leased assets (705) (522)
Decrease (increase) in working capital before tax 26-B (239) 417
CASH FLOWS FROM OPERATING ACTIVITIES BEFORE INTEREST AND TAX 5,318 6,802
Interest paid 90 141
Interest received (416) (416)
Current taxes (paid) / received (603) (492)
CASH FLOWS FROM OPERATING ACTIVITIES 4,389 6,035
Capital expenditure 26-C (3,097) (2,801)
Disposals of property, plant and equipment and intangibles 44 66
Acquisitions of investments involving gain of control, net of cash acquired (4) (133) (3)
Acquisitions of other investments, net of cash acquired (48) (25)
Disposals of other investments, net of cash transferred and other (5) 1,120 13
Net decrease (increase) in other securities and loans of the Automotive segments 207 (299)
CASH FLOWS FROM INVESTING ACTIVITIES (1,907) (3,049)
Dividends paid to parent-company shareholders 18-D (701) (555)
Dividends paid to non-controlling interests (108) (65)
(Acquisitions) sales of treasury shares (102) (102)
Cash flows with shareholders (911) (722)
Bond issuance by the Automotive segments 23-C 616 533
Bond redemption by the Automotive segments 23-C (1,510) (1,403)
Net increase (decrease) in other financial liabilities of the Automotive segments (1,040) 540
Net change in financial liabilities of the Automotive segments 23-B (1,934) (330)
CASH FLOWS FROM FINANCING ACTIVITIES (2,845) (1,052)
INCREASE (DECREASE) IN CASH AND CASH EQUIVALENTS (363) 1,934
(1) Interest and current taxes received and paid are now reported on separate lines in the statement of consolidated cash flows, and interest on derivatives on financing operations of the Automotive segments is now classified as cash flows from operating activities. The resulting
reclassifications for 2015 are presented in notes 2-A2 and 2-A3. (2) Cash flows before interest and tax do not include dividends received from listed companies.
9
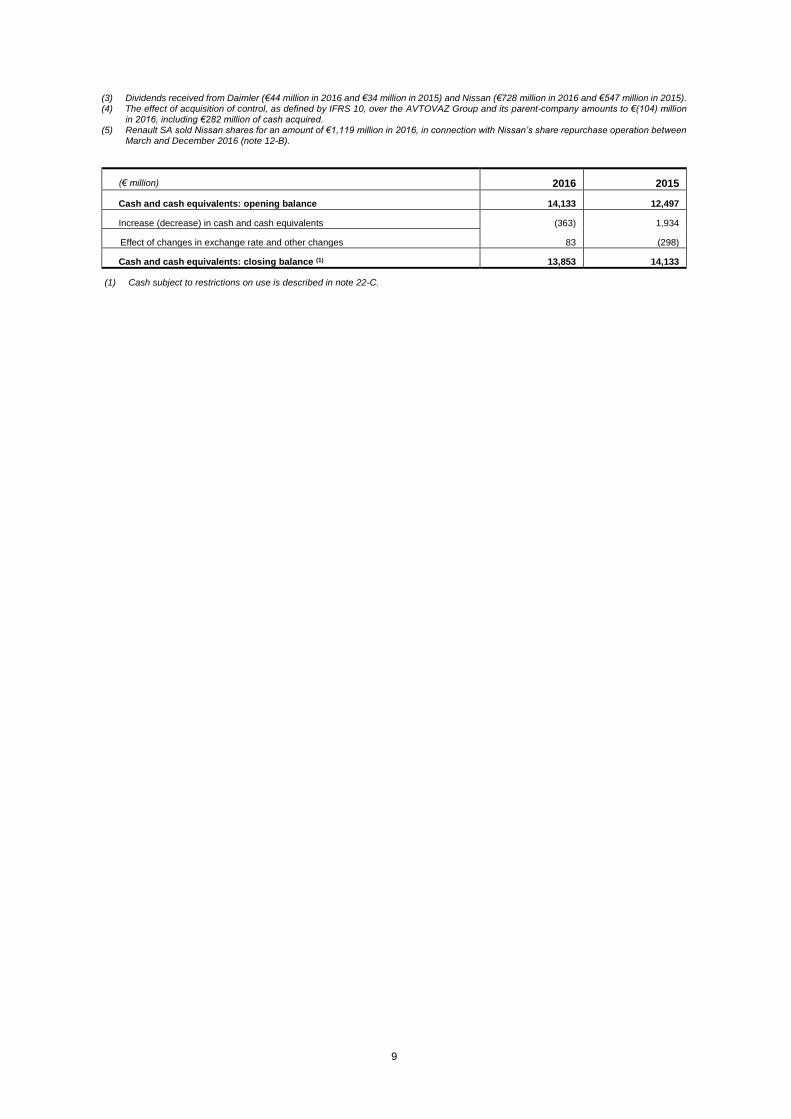
(3) Dividends received from Daimler (€44 million in 2016 and €34 million in 2015) and Nissan (€728 million in 2016 and €547 million in 2015). (4) The effect of acquisition of control, as defined by IFRS 10, over the AVTOVAZ Group and its parent-company amounts to €(104) million
in 2016, including €282 million of cash acquired. (5) Renault SA sold Nissan shares for an amount of €1,119 million in 2016, in connection with Nissan’s share repurchase operation between
March and December 2016 (note 12-B).
(€ million) 2016 2015
Cash and cash equivalents: opening balance 14,133 12,497
Increase (decrease) in cash and cash equivalents (363) 1,934
Effect of changes in exchange rate and other changes 83 (298)
Cash and cash equivalents: closing balance (1) 13,853 14,133
(1) Cash subject to restrictions on use is described in note 22-C.
10
4.2.6 Notes to the consolidated financial statement
4.2.6.1 Information on operating segments and regions
The number of Renault operating segments increased from two to three in late 2016 following the acquisition of control, as defined by IFRS 10, over the joint venture Alliance Rostec Auto B.V. and the AVTOVAZ Group, which took place in late December 2016 and is described in notes 3-B and 13-A.
The segment comprising the Group’s automotive activities, as they existed until Renault acquired control of the AVTOVAZ Group under IFRS 10, is now called “Automotive (excluding AVTOVAZ)”. This segment comprises the production, sales, and distribution subsidiaries for passenger and light commercial vehicles, automobile service subsidiaries for the Renault, Dacia and Samsung brands, and the subsidiaries in charge of the segment’s cash management. It also includes investments in automotive-sector associates and joint ventures, mainly Nissan, and AVTOVTAZ (until December 28, 2016).
The Sales Financing segment, which the Group considers as an operating activity in its own right, carried out for the distribution network and final customers by RCI Banque, its subsidiaries and its investments in associates and joint ventures, is unchanged.
From the date of acquisition of control, as defined by IFRS 10, over Alliance Rostec Auto B.V. and the AVTOVAZ Group in December 2016, the Group has a third operating segment called “AVTOVAZ”, which consists of the Russian automotive subgroup and its parent-company. Details of this operation are given in notes 3-B and 13–A.
As the acquisition of control, as defined by IFRS 10, took place on December 28, 2016, the figures for the Automotive (excluding AVTOVAZ) segment and the AVTOVAZ segment are established as follows:
The net income of Alliance Rostec Auto B.V. and the AVTOVAZ Group for 2016 is still included by the equity method in the Automotive (excluding AVTOVAZ) segment, as in 2015.
The income generated by the acquisition of control under IFRS 10 is included in the net income of the Automotive (excluding AVTOVAZ) segment (see note 6-B).
As the impact of full consolidation of Alliance Rostec Auto B.V. and the AVTOVAZ Group on the fully consolidated entities’ net income and changes in cash between December 28, 2016 and December 31, 2016 is judged non-significant, full consolidation is applied from December 31, 2016.
The year-end balance sheet figures at December 31, 2016 for Alliance Rostec Auto B.V. and the AVTOVAZ Group are included in the consolidated financial position of the new AVTOVAZ segment at December 31, 2016. In the tables presenting balance sheet figures for 2016, the first consolidation of these entities is presented in changes in the scope of consolidation.
The Automotive (excluding AVTOVAZ) segment includes transactions between the Automotive (excluding AVTOVAZ) segment and AVTOVAZ in 2016 as in 2015.

11
A – Information by operating segment
A1 – CONSOLIDATED INCOME STATEMENT BY OPERATING SEGMENT
Automotive (excluding
AVTOVAZ) (1)
Sales Financing Intersegment transactions
Consolidated total
2016 (2)
Sales of goods 46,993 28 - 47,021
Sales of services 2,002 2,220 - 4,222
External sales 48,995 2,248 - 51,243
Intersegment sales (430) 464 (34) -
Sales by segment 48,565 2,712 (34) 51,243
Operating margin (3) 2,327 896 59 3,282
Operating income (loss) 2,326 898 59 3,283
Financial income (expenses) (323) - - (323)
Share in net income (loss) of associates and joint ventures
1,631 7 - 1,638
Pre-tax income 3,634 905 59 4,598
Current and deferred taxes (754) (285) (16) (1,055)
Net income 2,880 620 43 3,543
2015 restated (4)
Sales of goods 41,180 31 - 41,211
Sales of services 1,928 2,188 - 4,116
External sales 43,108 2,219 - 45,327
Intersegment sales (364) 412 (48) -
Sales by segment 42,744 2,631 (48) 45,327
Operating margin (3) 1,535 829 11 2,375
Operating income (loss) 1,338 827 11 2,176
Financial income (expenses) (5) (72) - (149) (221)
Share in net income (loss) of associates and joint ventures
1,367 4 - 1,371
Pre-tax income 2,633 831 (138) 3,326
Current and deferred taxes (85) (277) (4) (366)
Net income 2,548 554 (142) 2,960
(1) In 2015 and 2016 the Automotive (excluding AVTOVAZ) segment includes transactions between the Automotive (excluding AVTOVAZ) segment and AVTOVAZ, and the net income of the AVTOVAZ Group and its parent-company, accounted for by the equity method (see 4.2.6.1).
(2) As the impact of the AVTOVAZ Group and its parent-company on the net income between December 28, 2016 and December 31, 2016 is judged non-significant, full consolidation is applied from December 31, 2016 (note 3-B).
(3) Details of depreciation, amortization and impairment are provided in the consolidated cash flow statements by operating segment. (4) The change in presentation concerning income taxes and the resulting reclassifications in the 2015 financial statements are presented
in notes 2-A2 and 2-A3. (5) Sales financing dividends are included in the Automotive (excluding AVTOVAZ) segment's financial income and eliminated as an
intersegment transaction.
12
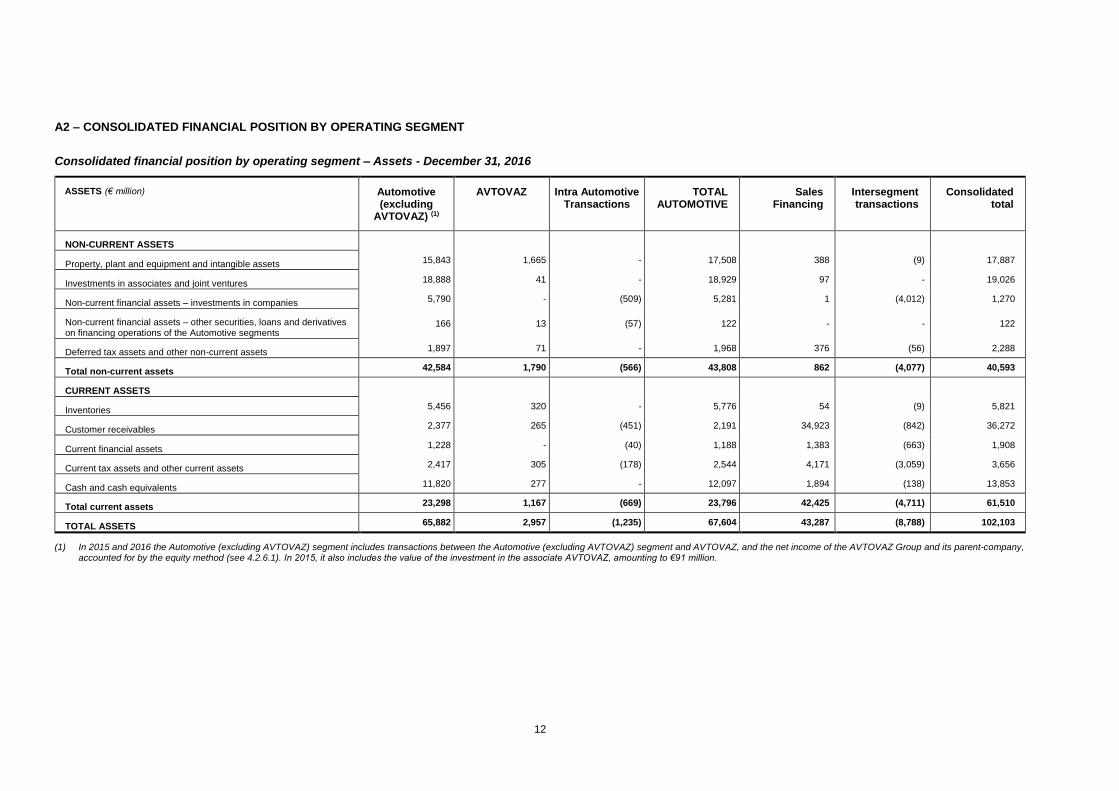
A2 – CONSOLIDATED FINANCIAL POSITION BY OPERATING SEGMENT
Consolidated financial position by operating segment – Assets - December 31, 2016
ASSETS (€ million) Automotive (excluding
AVTOVAZ) (1)
AVTOVAZ Intra Automotive Transactions
TOTAL AUTOMOTIVE
Sales Financing
Intersegment transactions
Consolidated total
NON-CURRENT ASSETS
Property, plant and equipment and intangible assets 15,843 1,665 - 17,508 388 (9) 17,887
Investments in associates and joint ventures 18,888 41 - 18,929 97 - 19,026
Non-current financial assets – investments in companies 5,790 - (509) 5,281 1 (4,012) 1,270
Non-current financial assets – other securities, loans and derivatives on financing operations of the Automotive segments
166 13 (57) 122 - - 122
Deferred tax assets and other non-current assets 1,897 71 - 1,968 376 (56) 2,288
Total non-current assets 42,584 1,790 (566) 43,808 862 (4,077) 40,593
CURRENT ASSETS
Inventories 5,456 320 - 5,776 54 (9) 5,821
Customer receivables 2,377 265 (451) 2,191 34,923 (842) 36,272
Current financial assets 1,228 - (40) 1,188 1,383 (663) 1,908
Current tax assets and other current assets 2,417 305 (178) 2,544 4,171 (3,059) 3,656
Cash and cash equivalents 11,820 277 - 12,097 1,894 (138) 13,853
Total current assets 23,298 1,167 (669) 23,796 42,425 (4,711) 61,510
TOTAL ASSETS 65,882 2,957 (1,235) 67,604 43,287 (8,788) 102,103
(1) In 2015 and 2016 the Automotive (excluding AVTOVAZ) segment includes transactions between the Automotive (excluding AVTOVAZ) segment and AVTOVAZ, and the net income of the AVTOVAZ Group and its parent-company, accounted for by the equity method (see 4.2.6.1). In 2015, it also includes the value of the investment in the associate AVTOVAZ, amounting to €91 million.

13
Consolidated financial position by operating segment – Shareholders’ equity and liability - December 31, 2016
SHAREHOLDERS’ EQUITY AND LIABILITIES (€ million) Automotive (excluding
AVTOVAZ) (1)
AVTOVAZ Intra Automotive
Transactions
TOTAL AUTOMOTIVE
Sales Financing
Intersegment transactions
Consolidated total
SHAREHOLDERS’ EQUITY 31,098 (11) (330) 30,757 4,028 (3,890) 30,895
NON-CURRENT LIABILITIES
Long-term provisions 2,700 10 - 2,710 464 - 3,174
Non-current financial liabilities 3,851 1,011 (235) 4,627 12 - 4,639
Deferred tax liabilities and other non-current liabilities 945 83 - 1,028 614 - 1,642
Total non-current liabilities 7,496 1,104 (235) 8,365 1,090 - 9,455
CURRENT LIABILITIES
Short-term provisions 1,055 78 - 1,133 26 - 1,159
Current financial liabilities 5,343 746 (40) 6,049 - (801) 5,248
Trade payables and sales financing debts 9,260 754 (416) 9,598 36,760 (784) 45,574
Current tax liabilities and other current liabilities 11,630 286 (214) 11,702 1,383 (3,313) 9,772
Total current liabilities 27,288 1,864 (670) 28,482 38,169 (4,898) 61,753
TOTAL SHAREHOLDERS’ EQUITY AND LIABILITIES 65,882 2,957 (1,235) 67,604 43,287 (8,788) 102,103
(1) In 2015 and 2016 the Automotive (excluding AVTOVAZ) segment includes transactions between the Automotive (excluding AVTOVAZ) segment and AVTOVAZ, and the net income of the AVTOVAZ Group and its parent-company, accounted for by the equity method (see 4.2.6.1).
14
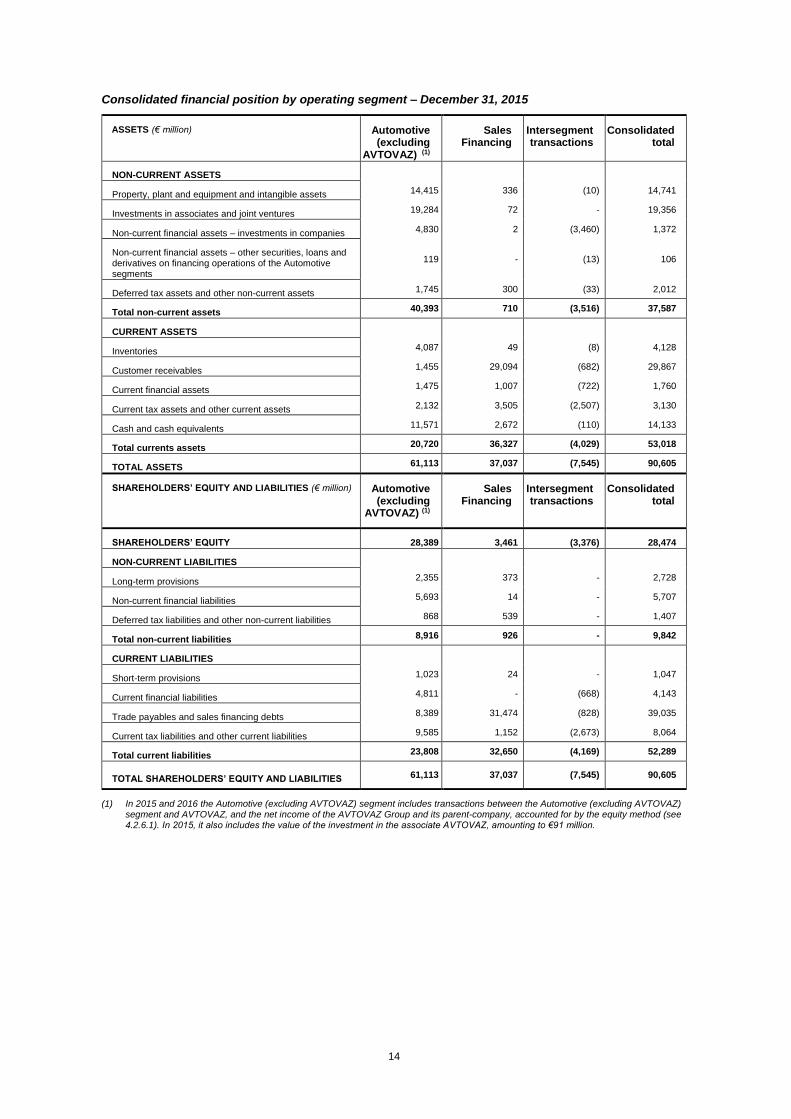
Consolidated financial position by operating segment – December 31, 2015
ASSETS (€ million) Automotive (excluding
AVTOVAZ) (1)
Sales Financing
Intersegment transactions
Consolidated total
NON-CURRENT ASSETS
Property, plant and equipment and intangible assets 14,415 336 (10) 14,741
Investments in associates and joint ventures 19,284 72 - 19,356
Non-current financial assets – investments in companies 4,830 2 (3,460) 1,372
Non-current financial assets – other securities, loans and derivatives on financing operations of the Automotive segments
119 - (13) 106
Deferred tax assets and other non-current assets 1,745 300 (33) 2,012
Total non-current assets 40,393 710 (3,516) 37,587
CURRENT ASSETS
Inventories 4,087 49 (8) 4,128
Customer receivables 1,455 29,094 (682) 29,867
Current financial assets 1,475 1,007 (722) 1,760
Current tax assets and other current assets 2,132 3,505 (2,507) 3,130
Cash and cash equivalents 11,571 2,672 (110) 14,133
Total currents assets 20,720 36,327 (4,029) 53,018
TOTAL ASSETS 61,113 37,037 (7,545) 90,605
SHAREHOLDERS’ EQUITY AND LIABILITIES (€ million) Automotive (excluding
AVTOVAZ) (1)
Sales Financing
Intersegment transactions
Consolidated total
SHAREHOLDERS’ EQUITY 28,389 3,461 (3,376) 28,474
NON-CURRENT LIABILITIES
Long-term provisions 2,355 373 - 2,728
Non-current financial liabilities 5,693 14 - 5,707
Deferred tax liabilities and other non-current liabilities 868 539 - 1,407
Total non-current liabilities 8,916 926 - 9,842
CURRENT LIABILITIES
Short-term provisions 1,023 24 - 1,047
Current financial liabilities 4,811 - (668) 4,143
Trade payables and sales financing debts 8,389 31,474 (828) 39,035
Current tax liabilities and other current liabilities 9,585 1,152 (2,673) 8,064
Total current liabilities 23,808 32,650 (4,169) 52,289
TOTAL SHAREHOLDERS’ EQUITY AND LIABILITIES 61,113 37,037 (7,545) 90,605
(1) In 2015 and 2016 the Automotive (excluding AVTOVAZ) segment includes transactions between the Automotive (excluding AVTOVAZ) segment and AVTOVAZ, and the net income of the AVTOVAZ Group and its parent-company, accounted for by the equity method (see 4.2.6.1). In 2015, it also includes the value of the investment in the associate AVTOVAZ, amounting to €91 million.
15
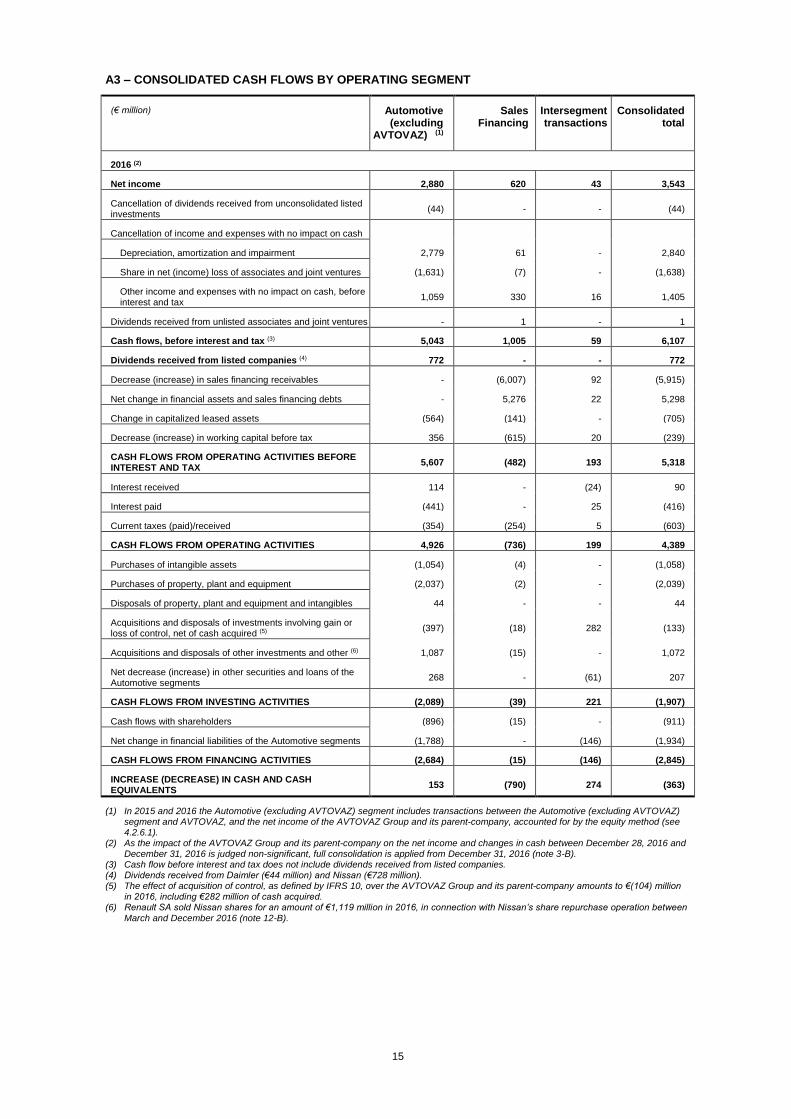
A3 – CONSOLIDATED CASH FLOWS BY OPERATING SEGMENT
(€ million) Automotive (excluding
AVTOVAZ) (1)
Sales Financing
Intersegment transactions
Consolidated total
2016 (2)
Net income 2,880 620 43 3,543
Cancellation of dividends received from unconsolidated listed investments
(44) - - (44)
Cancellation of income and expenses with no impact on cash
Depreciation, amortization and impairment 2,779 61 - 2,840
Share in net (income) loss of associates and joint ventures (1,631) (7) - (1,638)
Other income and expenses with no impact on cash, before interest and tax
1,059 330 16 1,405
Dividends received from unlisted associates and joint ventures - 1 - 1
Cash flows, before interest and tax (3) 5,043 1,005 59 6,107
Dividends received from listed companies (4) 772 - - 772
Decrease (increase) in sales financing receivables - (6,007) 92 (5,915)
Net change in financial assets and sales financing debts - 5,276 22 5,298
Change in capitalized leased assets (564) (141) - (705)
Decrease (increase) in working capital before tax 356 (615) 20 (239)
CASH FLOWS FROM OPERATING ACTIVITIES BEFORE INTEREST AND TAX
5,607 (482) 193 5,318
Interest received 114 - (24) 90
Interest paid (441) - 25 (416)
Current taxes (paid)/received (354) (254) 5 (603)
CASH FLOWS FROM OPERATING ACTIVITIES 4,926 (736) 199 4,389
Purchases of intangible assets (1,054) (4) - (1,058)
Purchases of property, plant and equipment (2,037) (2) - (2,039)
Disposals of property, plant and equipment and intangibles 44 - - 44
Acquisitions and disposals of investments involving gain or loss of control, net of cash acquired (5)
(397) (18) 282 (133)
Acquisitions and disposals of other investments and other (6) 1,087 (15) - 1,072
Net decrease (increase) in other securities and loans of the Automotive segments
268 - (61) 207
CASH FLOWS FROM INVESTING ACTIVITIES (2,089) (39) 221 (1,907)
Cash flows with shareholders (896) (15) - (911)
Net change in financial liabilities of the Automotive segments (1,788) - (146) (1,934)
CASH FLOWS FROM FINANCING ACTIVITIES (2,684) (15) (146) (2,845)
INCREASE (DECREASE) IN CASH AND CASH EQUIVALENTS
153 (790) 274 (363)
(1) In 2015 and 2016 the Automotive (excluding AVTOVAZ) segment includes transactions between the Automotive (excluding AVTOVAZ) segment and AVTOVAZ, and the net income of the AVTOVAZ Group and its parent-company, accounted for by the equity method (see 4.2.6.1).
(2) As the impact of the AVTOVAZ Group and its parent-company on the net income and changes in cash between December 28, 2016 and December 31, 2016 is judged non-significant, full consolidation is applied from December 31, 2016 (note 3-B).
(3) Cash flow before interest and tax does not include dividends received from listed companies. (4) Dividends received from Daimler (€44 million) and Nissan (€728 million). (5) The effect of acquisition of control, as defined by IFRS 10, over the AVTOVAZ Group and its parent-company amounts to €(104) million
in 2016, including €282 million of cash acquired. (6) Renault SA sold Nissan shares for an amount of €1,119 million in 2016, in connection with Nissan’s share repurchase operation between
March and December 2016 (note 12-B).
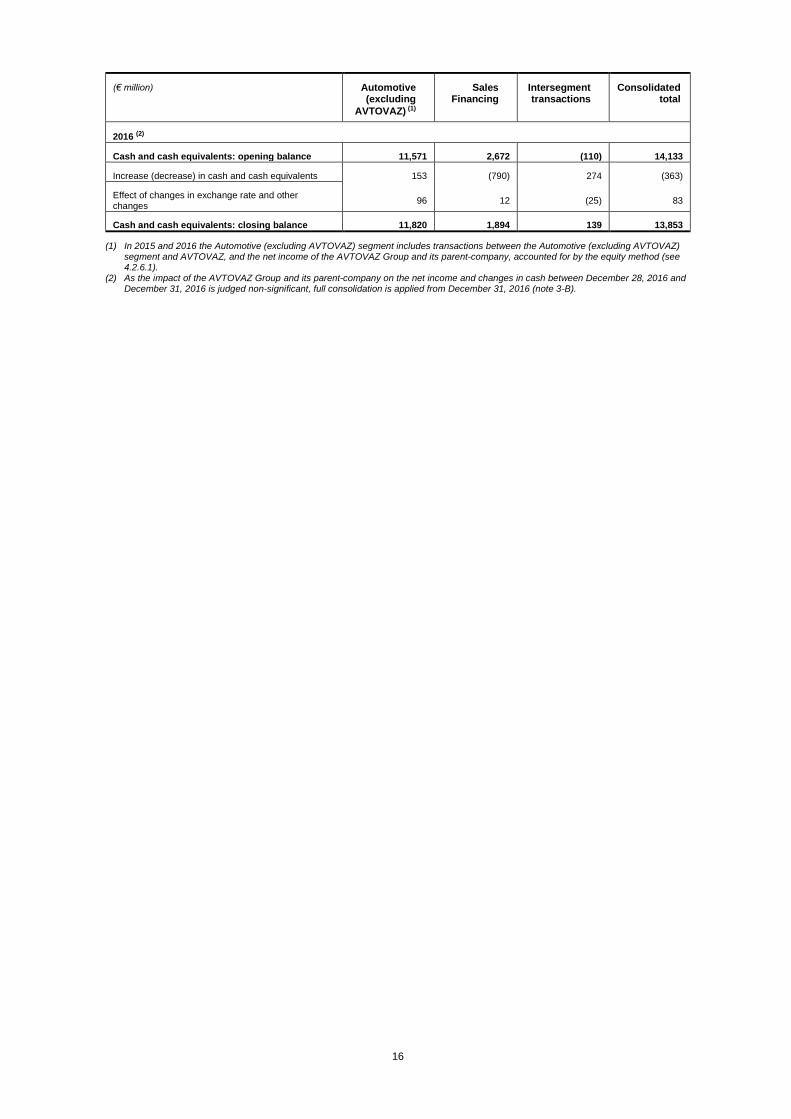
16
(€ million) Automotive (excluding
AVTOVAZ) (1)
Sales Financing
Intersegment transactions
Consolidated total
2016 (2)
Cash and cash equivalents: opening balance 11,571 2,672 (110) 14,133
Increase (decrease) in cash and cash equivalents 153 (790) 274 (363)
Effect of changes in exchange rate and other changes
96 12 (25) 83
Cash and cash equivalents: closing balance 11,820 1,894 139 13,853
(1) In 2015 and 2016 the Automotive (excluding AVTOVAZ) segment includes transactions between the Automotive (excluding AVTOVAZ) segment and AVTOVAZ, and the net income of the AVTOVAZ Group and its parent-company, accounted for by the equity method (see 4.2.6.1).
(2) As the impact of the AVTOVAZ Group and its parent-company on the net income and changes in cash between December 28, 2016 and December 31, 2016 is judged non-significant, full consolidation is applied from December 31, 2016 (note 3-B).
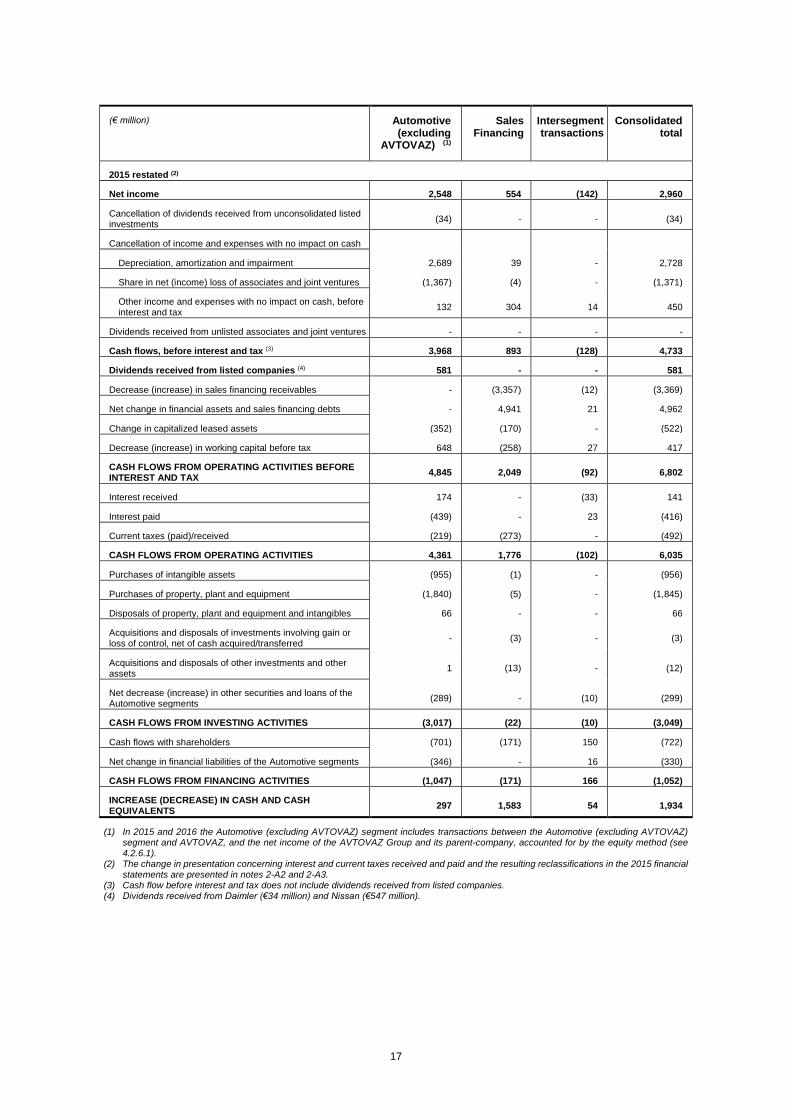
17
(€ million) Automotive (excluding
AVTOVAZ) (1)
Sales Financing
Intersegment transactions
Consolidated total
2015 restated (2)
Net income 2,548 554 (142) 2,960
Cancellation of dividends received from unconsolidated listed investments
(34) - - (34)
Cancellation of income and expenses with no impact on cash
Depreciation, amortization and impairment 2,689 39 - 2,728
Share in net (income) loss of associates and joint ventures (1,367) (4) - (1,371)
Other income and expenses with no impact on cash, before interest and tax
132 304 14 450
Dividends received from unlisted associates and joint ventures - - - -
Cash flows, before interest and tax (3) 3,968 893 (128) 4,733
Dividends received from listed companies (4) 581 - - 581
Decrease (increase) in sales financing receivables - (3,357) (12) (3,369)
Net change in financial assets and sales financing debts - 4,941 21 4,962
Change in capitalized leased assets (352) (170) - (522)
Decrease (increase) in working capital before tax 648 (258) 27 417
CASH FLOWS FROM OPERATING ACTIVITIES BEFORE INTEREST AND TAX
4,845 2,049 (92) 6,802
Interest received 174 - (33) 141
Interest paid (439) - 23 (416)
Current taxes (paid)/received (219) (273) - (492)
CASH FLOWS FROM OPERATING ACTIVITIES 4,361 1,776 (102) 6,035
Purchases of intangible assets (955) (1) - (956)
Purchases of property, plant and equipment (1,840) (5) - (1,845)
Disposals of property, plant and equipment and intangibles 66 - - 66
Acquisitions and disposals of investments involving gain or loss of control, net of cash acquired/transferred
- (3) - (3)
Acquisitions and disposals of other investments and other assets
1 (13) - (12)
Net decrease (increase) in other securities and loans of the Automotive segments
(289) - (10) (299)
CASH FLOWS FROM INVESTING ACTIVITIES (3,017) (22) (10) (3,049)
Cash flows with shareholders (701) (171) 150 (722)
Net change in financial liabilities of the Automotive segments (346) - 16 (330)
CASH FLOWS FROM FINANCING ACTIVITIES (1,047) (171) 166 (1,052)
INCREASE (DECREASE) IN CASH AND CASH EQUIVALENTS
297 1,583 54 1,934
(1) In 2015 and 2016 the Automotive (excluding AVTOVAZ) segment includes transactions between the Automotive (excluding AVTOVAZ) segment and AVTOVAZ, and the net income of the AVTOVAZ Group and its parent-company, accounted for by the equity method (see 4.2.6.1).
(2) The change in presentation concerning interest and current taxes received and paid and the resulting reclassifications in the 2015 financial statements are presented in notes 2-A2 and 2-A3.
(3) Cash flow before interest and tax does not include dividends received from listed companies. (4) Dividends received from Daimler (€34 million) and Nissan (€547 million).

18
(€ million) Automotive (excluding
AVTOVAZ) (1)
Sales Financing
Intersegment transactions
Consolidated total
2015
Cash and cash equivalents: opening balance 11,591 1,102 (196) 12,497
Increase (decrease) in cash and cash equivalents 297 1,583 54 1,934
Effect of changes in exchange rate and other changes (317) (13) 32 (298)
Cash and cash equivalents: closing balance 11,571 2,672 (110) 14,133
(1) In 2015 and 2016 the Automotive (excluding AVTOVAZ) segment includes transactions between the Automotive (excluding AVTOVAZ) segment and AVTOVAZ, and the net income of the AVTOVAZ Group and its parent-company, accounted for by the equity method (see 4.2.6.1).
19
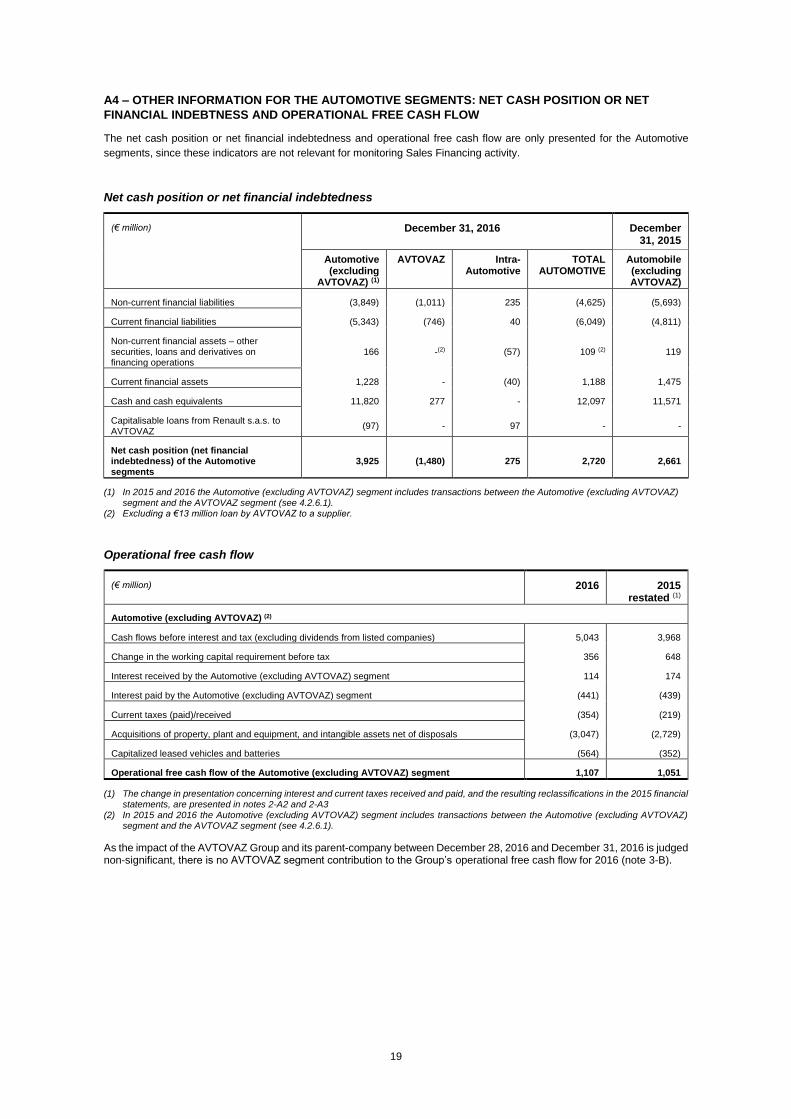
A4 – OTHER INFORMATION FOR THE AUTOMOTIVE SEGMENTS: NET CASH POSITION OR NET
FINANCIAL INDEBTNESS AND OPERATIONAL FREE CASH FLOW
The net cash position or net financial indebtedness and operational free cash flow are only presented for the Automotive
segments, since these indicators are not relevant for monitoring Sales Financing activity.
Net cash position or net financial indebtedness
(€ million) December 31, 2016 December 31, 2015
Automotive (excluding
AVTOVAZ) (1)
AVTOVAZ Intra-Automotive
TOTAL AUTOMOTIVE
Automobile (excluding AVTOVAZ)
Non-current financial liabilities (3,849) (1,011) 235 (4,625) (5,693)
Current financial liabilities (5,343) (746) 40 (6,049) (4,811)
Non-current financial assets – other securities, loans and derivatives on financing operations
166 -(2) (57) 109 (2) 119
Current financial assets 1,228 - (40) 1,188 1,475
Cash and cash equivalents 11,820 277 - 12,097 11,571
Capitalisable loans from Renault s.a.s. to AVTOVAZ
(97) - 97 - -
Net cash position (net financial indebtedness) of the Automotive segments
3,925 (1,480) 275 2,720 2,661
(1) In 2015 and 2016 the Automotive (excluding AVTOVAZ) segment includes transactions between the Automotive (excluding AVTOVAZ) segment and the AVTOVAZ segment (see 4.2.6.1).
(2) Excluding a €13 million loan by AVTOVAZ to a supplier.
Operational free cash flow
(€ million) 2016 2015 restated (1)
Automotive (excluding AVTOVAZ) (2)
Cash flows before interest and tax (excluding dividends from listed companies) 5,043 3,968
Change in the working capital requirement before tax 356 648
Interest received by the Automotive (excluding AVTOVAZ) segment 114 174
Interest paid by the Automotive (excluding AVTOVAZ) segment (441) (439)
Current taxes (paid)/received (354) (219)
Acquisitions of property, plant and equipment, and intangible assets net of disposals (3,047) (2,729)
Capitalized leased vehicles and batteries (564) (352)
Operational free cash flow of the Automotive (excluding AVTOVAZ) segment 1,107 1,051
(1) The change in presentation concerning interest and current taxes received and paid, and the resulting reclassifications in the 2015 financial statements, are presented in notes 2-A2 and 2-A3
(2) In 2015 and 2016 the Automotive (excluding AVTOVAZ) segment includes transactions between the Automotive (excluding AVTOVAZ) segment and the AVTOVAZ segment (see 4.2.6.1).
As the impact of the AVTOVAZ Group and its parent-company between December 28, 2016 and December 31, 2016 is judged non-significant, there is no AVTOVAZ segment contribution to the Group’s operational free cash flow for 2016 (note 3-B).
20
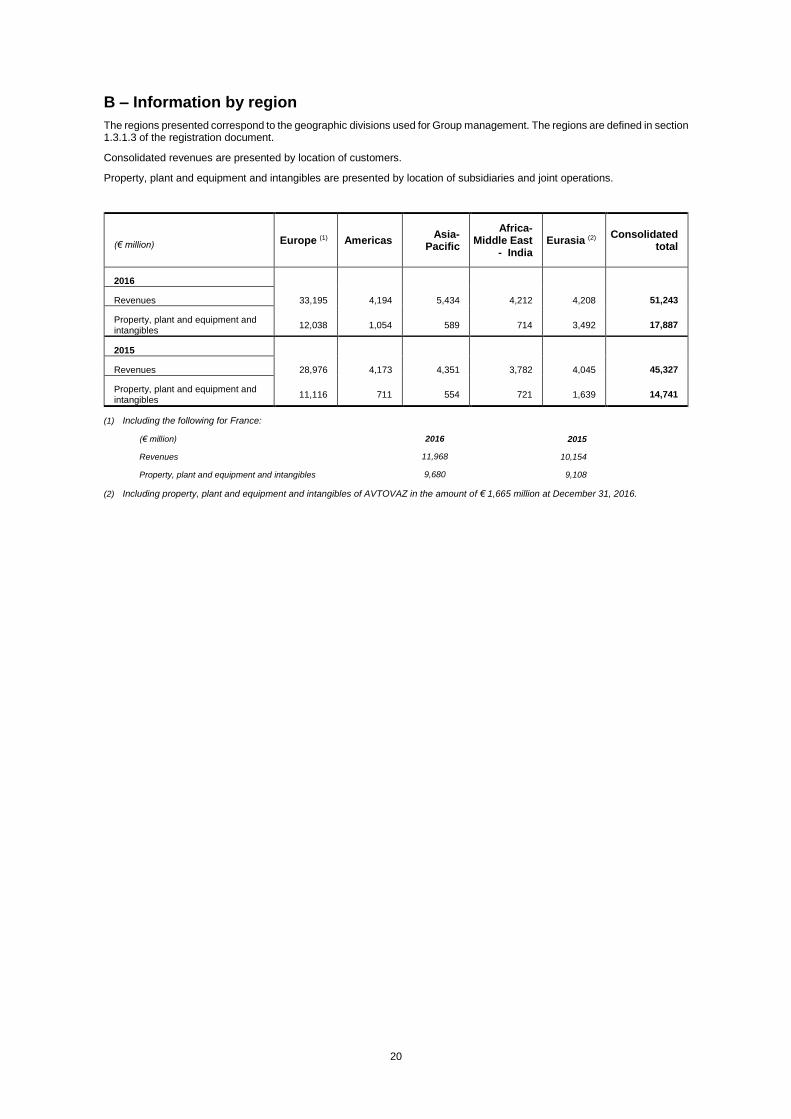
B – Information by region
The regions presented correspond to the geographic divisions used for Group management. The regions are defined in section 1.3.1.3 of the registration document.
Consolidated revenues are presented by location of customers.
Property, plant and equipment and intangibles are presented by location of subsidiaries and joint operations.
(€ million) Europe (1) Americas Asia-
Pacific
Africa- Middle East
- India Eurasia (2)
Consolidated total
2016
Revenues 33,195 4,194 5,434 4,212 4,208 51,243
Property, plant and equipment and intangibles
12,038 1,054 589 714 3,492 17,887
2015
Revenues 28,976 4,173 4,351 3,782 4,045 45,327
Property, plant and equipment and intangibles
11,116 711 554 721 1,639 14,741
(1) Including the following for France:
(€ million)
Revenues
Property, plant and equipment and intangibles
2016
11,968
9,680
2015
10,154
9,108
(2) Including property, plant and equipment and intangibles of AVTOVAZ in the amount of € 1,665 million at December 31, 2016.
21
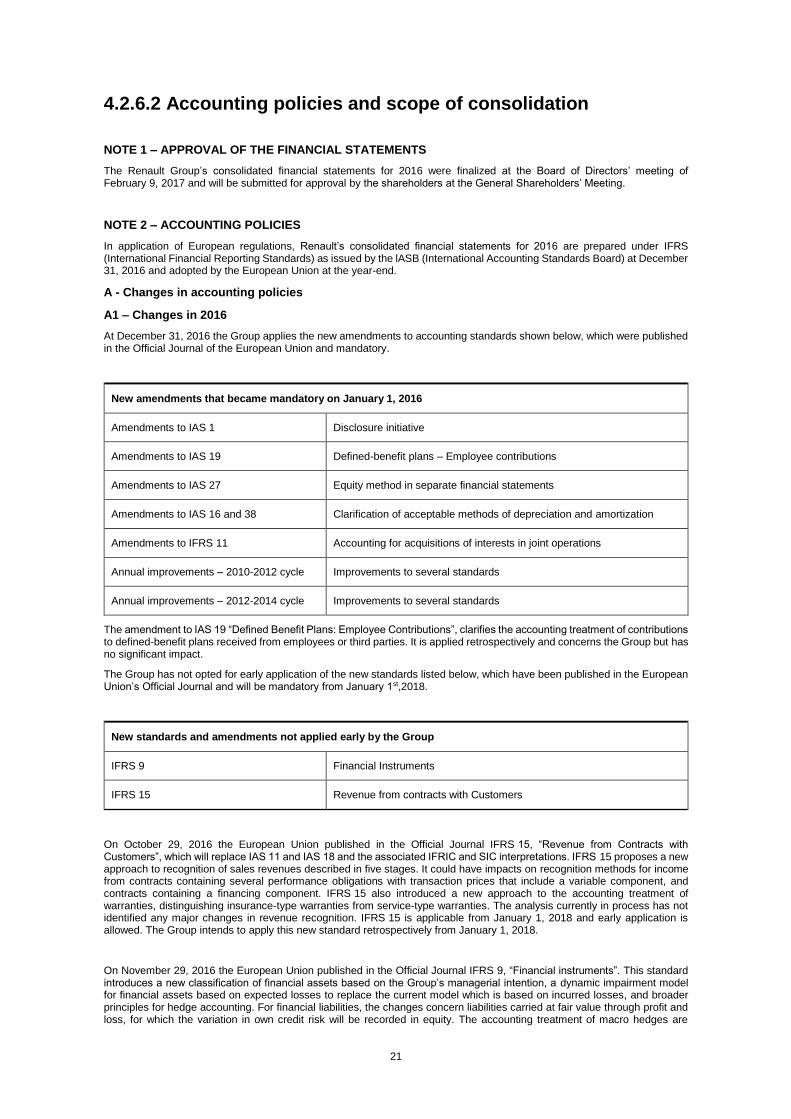
4.2.6.2 Accounting policies and scope of consolidation
NOTE 1 – APPROVAL OF THE FINANCIAL STATEMENTS
The Renault Group’s consolidated financial statements for 2016 were finalized at the Board of Directors’ meeting of February 9, 2017 and will be submitted for approval by the shareholders at the General Shareholders’ Meeting.
NOTE 2 – ACCOUNTING POLICIES
In application of European regulations, Renault’s consolidated financial statements for 2016 are prepared under IFRS (International Financial Reporting Standards) as issued by the lASB (International Accounting Standards Board) at December 31, 2016 and adopted by the European Union at the year-end.
A - Changes in accounting policies
A1 – Changes in 2016
At December 31, 2016 the Group applies the new amendments to accounting standards shown below, which were published in the Official Journal of the European Union and mandatory.
New amendments that became mandatory on January 1, 2016
Amendments to IAS 1 Disclosure initiative
Amendments to IAS 19 Defined-benefit plans – Employee contributions
Amendments to IAS 27 Equity method in separate financial statements
Amendments to IAS 16 and 38 Clarification of acceptable methods of depreciation and amortization
Amendments to IFRS 11 Accounting for acquisitions of interests in joint operations
Annual improvements – 2010-2012 cycle Improvements to several standards
Annual improvements – 2012-2014 cycle Improvements to several standards
The amendment to IAS 19 “Defined Benefit Plans: Employee Contributions”, clarifies the accounting treatment of contributions to defined-benefit plans received from employees or third parties. It is applied retrospectively and concerns the Group but has no significant impact.
The Group has not opted for early application of the new standards listed below, which have been published in the European Union’s Official Journal and will be mandatory from January 1st,2018.
New standards and amendments not applied early by the Group
IFRS 9 Financial Instruments
IFRS 15 Revenue from contracts with Customers
On October 29, 2016 the European Union published in the Official Journal IFRS 15, “Revenue from Contracts with Customers”, which will replace IAS 11 and IAS 18 and the associated IFRIC and SIC interpretations. IFRS 15 proposes a new approach to recognition of sales revenues described in five stages. It could have impacts on recognition methods for income from contracts containing several performance obligations with transaction prices that include a variable component, and contracts containing a financing component. IFRS 15 also introduced a new approach to the accounting treatment of warranties, distinguishing insurance-type warranties from service-type warranties. The analysis currently in process has not identified any major changes in revenue recognition. IFRS 15 is applicable from January 1, 2018 and early application is allowed. The Group intends to apply this new standard retrospectively from January 1, 2018.
On November 29, 2016 the European Union published in the Official Journal IFRS 9, “Financial instruments”. This standard introduces a new classification of financial assets based on the Group’s managerial intention, a dynamic impairment model for financial assets based on expected losses to replace the current model which is based on incurred losses, and broader principles for hedge accounting. For financial liabilities, the changes concern liabilities carried at fair value through profit and loss, for which the variation in own credit risk will be recorded in equity. The accounting treatment of macro hedges are
22
unchanged by the new standard. The Group is currently examining the implementation of this new standard and its impact in the financial statements.
The Group is currently reviewing all of its financial asset portfolios, to define an accounting classification in compliance with IFRS 9. In particular, the accounting classification of the Daimler shares acquired as part of the strategic partnership, which are currently included in available-for-sale financial assets, is under review and will be adjusted to meet the new requirements of IFRS 9. The Group has also begun developing a new methodology for provisions on receivables, based on prospective assessment of the credit risk at the inception of the receivable and its deterioration over time.
The principal impacts of application of IFRS 9 concern the Sales Financing segment. Initial analyses during the first half of 2016 essentially concerned the classification and measurement principles, a review of the financial instruments currently in use in the light of the principles laid down by IFRS 9, and establishment of the methodology for the new provisions model.
The financial asset portfolio review continued during the second half of 2016 to determine future classifications and measurement approaches under IFRS 9. Work to adjust and validate the methodological framework defining the rules for assessing the deterioration in credit risks and determination of expected losses on a one-year horizon and at maturity is also being finalised for the final customers and distribution network activity. The group has decided to base its approach on existing concepts and devices (particularly the Basel rules) for exposures where the credit risk equity requirement is calculated under the IRBA (internal ratings-based approach) methodology, which is the case of the great majority of customer credits. The same approach will apply, in a more simplified form, to portfolios where the credit risk equity requirement is calculated under the standard methodology. Specific IFRS 9 provisions will be applied in addition to the Basel rules, notably the inclusion of prospective information.
Scoping studies for the adaptation of information systems and processes are also continuing, and work has begun on certain IT developments. The operational rollout of the project is due in the first half of 2017.
At this stage of the IFRS 9 implementation project, it is not possible to reasonably estimate the impacts of its application.
This standard is applicable from January 1, 2018 and early application is possible. The group has not yet finalised the transition measures it will apply.
The Group also studies the new standard IFRS 16 “Leases”, which should be adopted by the European Union during 2017.
New standard not adopted by the European Union Effective date set by IASB
IFRS 16 Leases January 1, 2019
On January 16, 2016 the IASB released IFRS 16 “Leases”, which will replace IAS 17 and the associated IFRIC and SIC interpretations and will eliminate the previous distinction between operating leases and finance leases. Under IFRS 16, a lessee recognizes an asset related to the right of use and a financial liability that represents the lease obligation. The right-of-use asset is amortized and the lease liability is initially recognized at the present value of lease payments over the expected term of the lease. The present value is computed using the implicit interest rate of the lease agreement if it can be readily determined, or at the incremental borrowing rate otherwise.
Due to specificities in lease contracts allowing penalty-free withdrawal before the end of the contract, irrevocable lease commitments reported in note 28 A1 to the 2016 financial statements are not fully representative of the financial liability that should be recognized in application of IFRS 16. The negative impact of this standard’s application on the financial liability, and the positive effects on the operating margin and cash flows from operating activities, are currently being analysed.
However, IFRS 16 is very similar to the existing standard as regards the treatment of leases by the lessor.
This standard is applicable at January 1, 2019 and early application is allowed.
A2 – Changes of presentation
The Group has made two changes of presentation in 2016. They concern:
- Classification of taxes that correspond to the definition of income taxes based on a taxable profit according to IAS 12 “Income taxes”, as current taxes in the income statement and the statement of financial position,
- Presentation of interest and taxes paid and received on separate lines of the statement of cash flows.
These changes have been analysed as changes of method, leading to modifications of the prior period financial statements so that the figures for each period are comparable. The restated financial statements are presented in sections 4.2.1 to 4.2.5. As the tables of restatements to the 2015 financial statements in notes 2-A2 and 2-A3 show, the impact of these changes in presentation is not significant at Group level.
23
A21. Classification of taxes based on a taxable profit according to IAS 12 “Income taxes”
Taxes based on a taxable profit according to IAS 12 “Income taxes”, which were previously included in operating expenses,
are now classified as current and deferred taxes. This reclassification concerns the French business contribution on value
added (CVAE). It results in a more homogeneous treatment with similar types of tax in Europe (such as Italy’s Regional Tax
on Production Activity (IRAP) and the Gewerbesteuer in Germany), and improves comparability with competitors in the
Automotive sector.
Conversely, withholding taxes, which are not based on a taxable profit according to IAS 12 “Income taxes” and which were
previously included in current taxes to offset the potential tax saving for the company benefiting from the underlying, are now
classified as operating expenses. When the amounts withheld from this type of gross operating income are credited by the
beneficiaries against their income tax payable, income of an equivalent amount is recognized in current taxes. These
treatments harmonize the classification of taxes in the Group’s consolidated financial statements, according to whether or not
they are based on a taxable profit according to IAS 12.
A22. Presentation of interest and taxes paid and received in the statement of cash flows
Interest received, interest paid and net current taxes paid are now presented on separate lines of the statement of cash flows, clarifying their impact on cash flows from operating activities. Consequently, the cash flow is presented before interest and current taxes and the change in working capital before current taxes.
Taxes paid are presented without deduction of tax credits whose recovery is not conditional on reporting a taxable profit, consistent with the presentation used in the balance sheet and income statement (Note 2-I). The principal tax credits concerned are France’s “CIR” Research Tax Credit and “CICE” Tax Credit for Competitivity and Employment.
Interest on derivatives on financing operations of the Automotive segments are now classified as cash flows from operating activities, whereas it was previously classified as cash flows from financing activities. This change harmonizes the classification of interest on financial liabilities of the Automotive segments and the related hedging instruments for determination of the cash flows from operations.
A3. 2015 consolidated financial statements, restated
The two changes of presentation in 2016 presented above are applied retrospectively. Details of the impacts of the corresponding restatements on the key items of the published consolidated financial statements for 2015 are presented in the tables below.
24
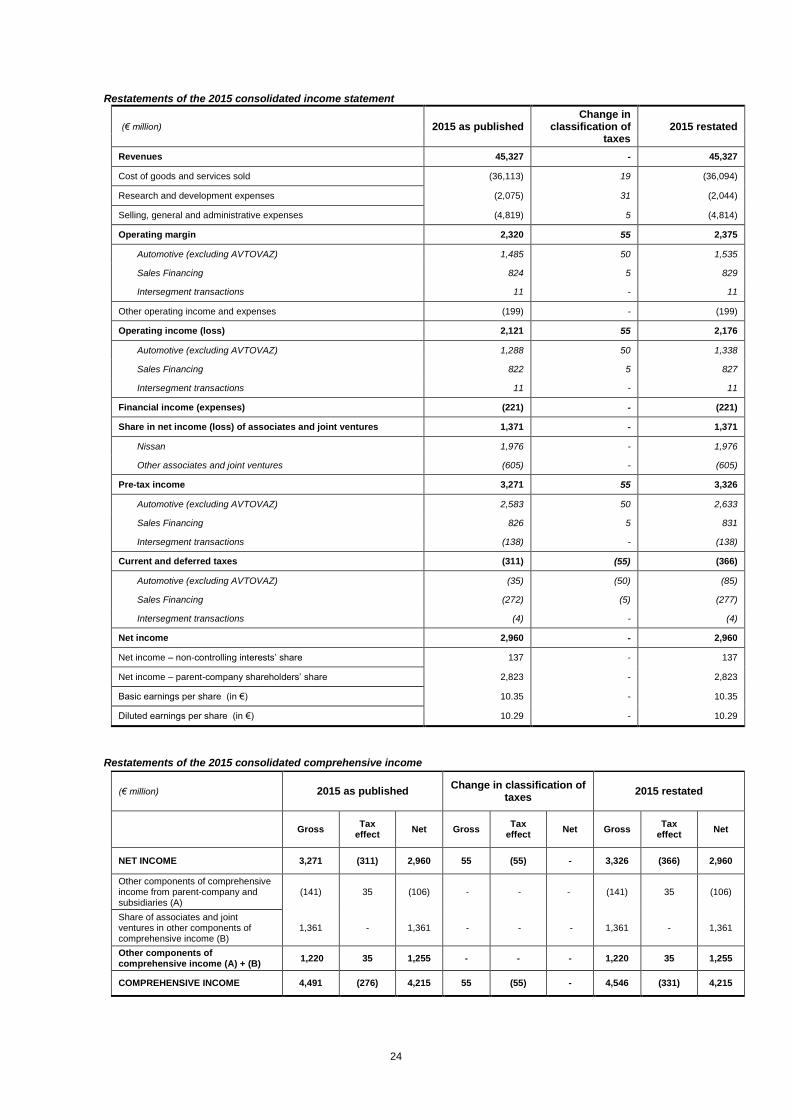
Restatements of the 2015 consolidated income statement
(€ million) 2015 as published Change in
classification of taxes
2015 restated
Revenues 45,327 - 45,327
Cost of goods and services sold (36,113) 19 (36,094)
Research and development expenses (2,075) 31 (2,044)
Selling, general and administrative expenses (4,819) 5 (4,814)
Operating margin 2,320 55 2,375
Automotive (excluding AVTOVAZ) 1,485 50 1,535
Sales Financing 824 5 829
Intersegment transactions 11 - 11
Other operating income and expenses (199) - (199)
Operating income (loss) 2,121 55 2,176
Automotive (excluding AVTOVAZ) 1,288 50 1,338
Sales Financing 822 5 827
Intersegment transactions 11 - 11
Financial income (expenses) (221) - (221)
Share in net income (loss) of associates and joint ventures 1,371 - 1,371
Nissan 1,976 - 1,976
Other associates and joint ventures (605) - (605)
Pre-tax income 3,271 55 3,326
Automotive (excluding AVTOVAZ) 2,583 50 2,633
Sales Financing 826 5 831
Intersegment transactions (138) - (138)
Current and deferred taxes (311) (55) (366)
Automotive (excluding AVTOVAZ) (35) (50) (85)
Sales Financing (272) (5) (277)
Intersegment transactions (4) - (4)
Net income 2,960 - 2,960
Net income – non-controlling interests’ share 137 - 137
Net income – parent-company shareholders’ share 2,823 - 2,823
Basic earnings per share (in €) 10.35 - 10.35
Diluted earnings per share (in €) 10.29 - 10.29
Restatements of the 2015 consolidated comprehensive income
(€ million) 2015 as published Change in classification of
taxes 2015 restated
Gross Tax
effect Net Gross
Tax effect
Net Gross Tax
effect Net
NET INCOME 3,271 (311) 2,960 55 (55) - 3,326 (366) 2,960
Other components of comprehensive income from parent-company and subsidiaries (A)
(141) 35 (106) - - - (141) 35 (106)
Share of associates and joint ventures in other components of comprehensive income (B)
1,361 - 1,361 - - - 1,361 - 1,361
Other components of comprehensive income (A) + (B)
1,220 35 1,255 - - - 1,220 35 1,255
COMPREHENSIVE INCOME 4,491 (276) 4,215 55 (55) - 4,546 (331) 4,215

25
Restatements of the 2015 consolidated cash flows
(€ million)
2015 as published
Change in classification
of taxes
Presentation of taxes
(paid)/received
Presentation of interest
(paid)/received
2015 restated
NET INCOME 2,960 - - - 2,960
Cancellation of dividends received from unconsolidated listed investments
(34) - - - (34)
Cancellation of income and expenses with no impact on cash
- Depreciation, amortization and impairment
2,728 - - - 2,728
- Share in net (income) loss of associates and joint ventures
(1,371) - - - (1,371)
- Other income and expenses with no impact on cash
(375) 55 485 285 450
Cash flows [before interest and tax] 3,908 55 485 285 4,733
Automotive (excluding AVTOVAZ) 3,451 50 192 275 3,968
Sales Financing 595 5 293 - 893
Intersegment transactions (138) - - 10 (128)
Dividends received from listed companies
581 - - - 581
Decrease (increase) in sales financing receivables
(3,369) - - - (3,369)
Net change in financial assets and debts of the Sales Financing segment
4,962 - - - 4,962
Change in capitalized leased assets (522) - - - (522)
Decrease (increase) in working capital [before tax]
457 - (48) 8 417
Automotive (excluding AVTOVAZ) 663 - (23) 8 648
Sales Financing (233) - (25) - (258)
Intersegment transactions 27 - - - 27
Interest received - - - 141 141
Interest paid - - - (416) (416)
Current taxes (paid) / received - (55) (437) - (492)
Total interest and taxes (paid) / received
- (55) (437) (275) (767)
Automotive (excluding AVTOVAZ) - (50) (169) (265) (484)
Sales Financing - (5) (268) - (273)
Intersegment transactions - - - (10) (10)
Cash flows from operating activities 6,017 - - 18 6,035
Automotive (excluding AVTOVAZ) 4,343 - - 18 4,361
Sales Financing 1,776 - - - 1,776
Intersegment transactions (102) - - - (102)
Cash flows from investing activities (3,049) - - - (3,049)
Cash flows with shareholders (722) - - - (722)
Bond issuance by the Automotive segments
533 - - - 533
Bond redemption by the Automotive segments
(1,403) - - - (1,403)
Net increase (decrease) in other financial liabilities of the Automotive segments
558 - - (18) 540
Net change in financial liabilities of the Automotive segments
(312) - - (18) (330)
Cash flows from financing activities (1,034) - - (18) (1,052)
INCREASE (DECREASE) IN CASH AND CASH EQUIVALENTS
1,934 - - - 1,934
26
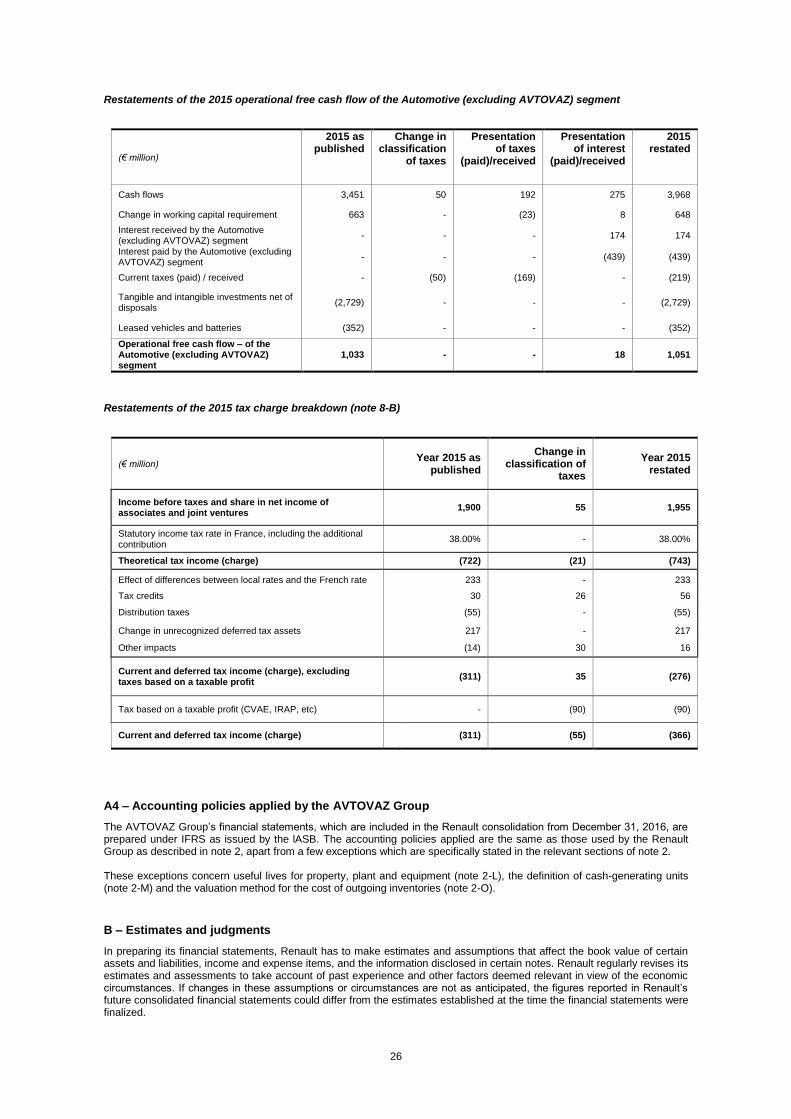
Restatements of the 2015 operational free cash flow of the Automotive (excluding AVTOVAZ) segment
(€ million)
2015 as published
Change in classification
of taxes
Presentation of taxes
(paid)/received
Presentation of interest
(paid)/received
2015 restated
Cash flows 3,451 50 192 275 3,968
Change in working capital requirement 663 - (23) 8 648
Interest received by the Automotive (excluding AVTOVAZ) segment
- - - 174 174
Interest paid by the Automotive (excluding AVTOVAZ) segment
- - - (439) (439)
Current taxes (paid) / received - (50) (169) - (219)
Tangible and intangible investments net of disposals
(2,729) - - - (2,729)
Leased vehicles and batteries (352) - - - (352)
Operational free cash flow – of the Automotive (excluding AVTOVAZ) segment
1,033 - - 18 1,051
Restatements of the 2015 tax charge breakdown (note 8-B)
(€ million) Year 2015 as
published
Change in classification of
taxes
Year 2015 restated
Income before taxes and share in net income of associates and joint ventures
1,900 55 1,955
Statutory income tax rate in France, including the additional
contribution 38.00% - 38.00%
Theoretical tax income (charge) (722) (21) (743)
Effect of differences between local rates and the French rate 233 - 233
Tax credits 30 26 56
Distribution taxes (55) - (55)
Change in unrecognized deferred tax assets 217 - 217
Other impacts (14) 30 16
Current and deferred tax income (charge), excluding taxes based on a taxable profit
(311) 35 (276)
Tax based on a taxable profit (CVAE, IRAP, etc) - (90) (90)
Current and deferred tax income (charge) (311) (55) (366)
A4 – Accounting policies applied by the AVTOVAZ Group
The AVTOVAZ Group’s financial statements, which are included in the Renault consolidation from December 31, 2016, are prepared under IFRS as issued by the lASB. The accounting policies applied are the same as those used by the Renault Group as described in note 2, apart from a few exceptions which are specifically stated in the relevant sections of note 2. These exceptions concern useful lives for property, plant and equipment (note 2-L), the definition of cash-generating units (note 2-M) and the valuation method for the cost of outgoing inventories (note 2-O).
B – Estimates and judgments
In preparing its financial statements, Renault has to make estimates and assumptions that affect the book value of certain assets and liabilities, income and expense items, and the information disclosed in certain notes. Renault regularly revises its estimates and assessments to take account of past experience and other factors deemed relevant in view of the economic circumstances. If changes in these assumptions or circumstances are not as anticipated, the figures reported in Renault’s future consolidated financial statements could differ from the estimates established at the time the financial statements were finalized.
27
The main items in the consolidated financial statements that are sensitive to estimates and judgments at December 31, 2016 are the following:
Capitalization of research and development expenses and their amortization period (notes 2-K and 10-A),
Any impairment on fixed assets (notes 2-M and 11), and operating receivables (notes 16 and 17),
The recoverable value of leased vehicles classified as property, plant and equipment or in inventories (notes 2-G, 10-B and 14),
Investments in associates, notably Nissan (notes 2-M, 12 and 13);
Sales financing receivables (notes 2-G and 15);
Recognition of deferred taxes (notes 2-I and 8);
Provisions, particularly vehicle and battery warranty provisions (note 2-G), provisions for pensions and other long-term employee benefit obligations (notes 2-S and 19) and provisions for workforce adjustment measures (notes 2-T and 6-A) and provisions for legal and tax risks (note 20);
The value of assets in Iran, mainly comprising shares, a shareholder loan and commercial receivables (note 6-D) and in general the value of Group assets located in all areas concerned by country risks.
C – Consolidation principles
The consolidated financial statements include the financial statements of all companies controlled exclusively by the Group either directly or indirectly (subsidiaries). Jointly controlled companies are accounted for under the equity method when they are classified as joint ventures and consolidated on the basis of the percentage share specific to each balance sheet and income statement item when they are classified as joint operations.
Companies in which the Group exercises significant influence (associates) are included in the financial statements on an equity basis.
Significant intercompany transactions and unrealized internal profits are eliminated.
Non-consolidated companies are recorded as other non-current assets even when they fulfil the above criteria.
None of these companies' individual contributions to consolidated figures exceeds the following:
revenues €20 million
inventories €20 million
Their consolidation would have a negligible impact on the consolidated financial statements, since they are Group-financed entities whose losses, if any, are recognized via impairment losses, and which:
acquire almost all their purchases from Group companies or
carry out almost all their sales transactions with Group companies.
Put options on non-controlling interests are carried at fair value and classified in other non-current liabilities in the consolidated financial position, with a corresponding adjustment to equity.
D – Presentation of the consolidated financial statements
Valuation basis
The consolidated financial statements are established under the historical cost convention, except for certain categories of assets and liabilities, in compliance with IFRS rules. The categories concerned are detailed in the following notes.
Operating income and operating margin
Operating income includes all revenues and costs directly related to the Group’s activities, whether recurrent or resulting from non-recurring decisions or operations, such as restructuring costs. The operating margin corresponds to the operating income before other operating income and expenses, which are by nature unusual or significant and could affect comparability of the margin. Other operating income and expenses cover:
restructuring costs relating to discontinued activities and workforce adjustment costs;
gains or losses on partial or total disposal of businesses or operating entities, gains or losses on total or partial disposals of investments in associates and joint ventures, other gains and losses relating to changes in the scope of consolidation such as acquisitions of control, as defined by IFRS 10, over entities previously accounted for under the equity method, and direct acquisition costs for entities that are fully consolidated or consolidated on a line-by-line percentage of interest basis;
gains or losses on disposal of property, plant and equipment or intangible assets (except leased assets sales);
impairment on property, plant and equipment or intangible assets and goodwill (excluding goodwill of associates or joint ventures);
unusual items, i.e. income and charges that are unusual in their frequency, nature or amount, relating to significant litigation or impairment of operating receivables.
28
Share in net income of associates and joint ventures
The share in net income of associates and joint ventures reported in the Group’s consolidated income statement comprises
the share in these entities’ profits or losses, and impairment and recoveries of impairment relating to these entities (note 2-
M). The impairment booked are limited to the net book value of the investment, unless an additional commitment has been
made.
The gain or loss resulting from the sale or loss of significant influence or joint control over associates and joint ventures accounted for by the equity method, and the gain or loss on acquisition of control, as defined by IFRS 10 “Consolidated financial statements”, over companies that were already consolidated but not controlled, is reported in other operating income and expenses in the Group’s consolidated income statement. This includes transfers of accumulated translation adjustments during the period the entity was accounted for by the equity method.
The Group recognizes a deferred tax liability on dividend distributions for all differences between the book and tax values of its investments in associates and joint ventures (note 2-I). This tax is included in current and deferred taxes in the Group’s income statement.
Goodwill relating to associates and joint ventures is included in the value of the relevant entities as stated in the assets in the consolidated statement of financial position. In the event of impairment, an impairment loss is booked and included in the consolidated income statement via the share in net income (loss) of associates and joint ventures (note 2-J).
Acquisition expenses related to investments in associates and joint ventures are included in the initial acquisition cost for
these investments.
Cross-investments between a consolidated entity and an associate are neutralized in measuring the investment in the
associate as stated in the assets of the statement of financial position. Renault’s 15% stake in Nissan is therefore neutralized
in valuing the investment in Nissan shown in the assets of the consolidated statement of financial position (note 12).
Dividends received from unlisted associates and joint ventures are included in the Automotive operational free cash flow,
while dividends received from listed associates and joint ventures, i.e. Nissan, are excluded from the operational free cash
flow of the Automotive (excluding AVTOVAZ) segment
Reporting by operating segment
The information by operating segment is based on internal reporting to the Group Executive Committee, identified as the “Chief Operating Decision-Maker”. This information is prepared under the IFRSs applicable to the consolidated financial statements. All Group financial data are assigned to the operating segments. The “Intersegment transactions” and “Intra-Automotive” columns are reserved for transactions between the segments, which are carried out on near-market terms. Dividends paid by the Sales Financing segment to the Automotive (excluding AVTOVAZ) segment are included in the Automotive (excluding AVTOVAZ) segment’s financial income.
The indicator used to evaluate segment performance is the operating margin.
Apart from taxes and the associates’ share in net income, income and expenses relating to sales financing are recorded as operating items. The tax effect inherent to the French consolidated taxation system is included in the tax expense of the Automotive (excluding AVTOVAZ) segment.
Assets and liabilities are specific to each segment. Receivables assigned by the Automotive (excluding AVTOVAZ) segment to the sales financing companies are treated as operating assets by the assignee when the risks and benefits are substantially transferred. These receivables are mostly receivables on the dealership network.
Vehicles and batteries for which the Automotive (excluding AVTOVAZ) segment has a repurchase commitment are included in the segment’s assets. When these assets are financed by the Sales Financing segment, the Sales Financing segment recognises a receivable on the Automotive (excluding AVTOVAZ) segment.
Current and non-current assets and liabilities
Sales financing receivables, other securities, derivatives, loans and financial liabilities of the Sales Financing segment (other than redeemable shares and subordinated loans) are considered as current assets and liabilities, because they are used in this operating segment’s normal business cycle.
For the Automotive segments, in addition to items directly related to the business cycle, all assets and liabilities maturing within one year are classified as current.
E– Translation of the financial statements of foreign companies
The Group’s presentation currency is the Euro.
For foreign companies, the functional currency is generally the local currency. In cases where most transactions are carried out in a different currency, that is adopted as the functional currency.
To determine whether a country is in hyperinflation, the Group refers to the list published by the AICPA (American Institute of Certified Public Accountants) International Task Force. None of the countries where Renault has significant business activity was on this list in 2016.
29
Foreign companies’ accounts are established in their functional currency, and subsequently translated into the Group’s presentation currency as follows:
financial position items other than components of shareholders’ equity, which are stated at historical value, are translated at the closing exchange rate;
income statement items are translated at the average exchange rate for the period;
the translation adjustment is one of the other components of comprehensive income, and therefore has no impact on net income.
Goodwill generated by a business combination with a foreign company is treated as an asset or liability of the entity acquired, as appropriate. It is therefore expressed in the relevant entity's functional currency, and translated into Euros at the closing rate.
When a foreign company is sold, the accumulated translation adjustments on its assets and liabilities are transferred to other operating income and expenses in the income statement.
F – Translation of foreign currency transactions
Transactions undertaken in a currency other than the functional currency of the entity concerned are initially translated to and recorded in the functional currency, using the rate applicable at the transaction date.
For financial reporting purposes, monetary assets and liabilities in currencies other than the functional currency are translated at the closing rate. All resulting foreign exchange differences are recognized in the income statement, except for foreign exchange gains and losses on financial instruments designated as hedges of a net investment in a foreign entity (note 2-X).
The following impacts are therefore recorded in net income:
translation adjustments related to financial operations by the Automotive segments are included in the net financial income;
other translation adjustments are included in the operating margin.
Derivatives are measured and recorded as described in note 2-X.
G – Revenues and margin
Revenues comprise all proceeds from sales of the Group’s automotive goods, services related to these sales, and the various sales financing products marketed by the Group’s companies to their customers.
Sales of goods and services and margin recognition
Sales and margin recognition
Sales of automotive goods are recognized when the goods are made available to the distribution network in the case of non-Group dealers, or upon delivery to the end-user in the case of direct sales. The margin on sales is recognized immediately for normal sales by the Automotive segments, including sales with associated financing contracts (credit or finance lease). However, no sale is recognized when an automotive item (vehicle or electric car battery) is covered by an operating lease from a Group finance company or the Group has made a buy-back commitment with a high probability of application, if the term of the contract covers an insufficient portion of the item’s useful life.
In such cases, the transactions are recorded as operating leases and included in sales of services. The difference between the price paid by the customer and the buy-back price is treated as rental income, and spread over the period the automotive item is at the customer’s disposal. The production cost for the new automotive item concerned is recorded in inventories for contracts of less than one year, or included in property, plant and equipment under fixed assets leased to customers when the contracts exceed one year. The sale of the automotive item as second-hand at the end of the lease gives rise to recognition of sales revenue and the related margin. The forecast resale value takes account of recent known developments on the second-hand automotive market but also future anticipated developments over the period in which the automotive goods will be sold, which may be influenced by factors both external (economic situation, taxation) and internal (changes in the range or the manufacturer’s pricing strategy). As soon as a loss is expected on the resale, a provision (if the automotive item is in inventories) or additional depreciation (if the automotive item is included in property, plant and equipment) is recognized to cover the loss. When the overall position of the lease contract (rental income and income on resale) shows a loss, an additional provision is also recorded immediately to cover the future loss.
Sales incentive programmes
When based on the volume or price of the products sold, the cost of these programmes is deducted from revenues when the corresponding sales are recorded. Otherwise, the cost is included in selling, general and administrative expenses. If programmes are approved after the sales, a provision is established when the decision is made.
The Group sometimes organizes promotional campaigns offering reduced-interest loans to end-users. The cost of these operations is recognized immediately when the rates offered cannot cover refinancing and administration costs, and charged to sales financing revenues over the duration of the loan otherwise.
Warranty
The estimated or incurred costs relating to manufacturer’s product or part warranties not covered by insurance are charged to expenses when the sales are recorded. Provisions for costs to be borne by Renault are valued on the basis of observed data by model and engine, i.e. the level of costs, and their distribution over the periods covered by the manufacturer’s warranty. In the event of product recalls following incidents that come to light after the vehicle has been put on the market, provisions are established to cover the costs involved as soon as the decision to undertake the recall campaign has been made. Amounts claimed from suppliers are deducted from the warranty expense when it is considered practically certain they will be recovered.
30
Services related to sales of automotive products
Renault offers its customers extended warranty and maintenance contracts, the income and margin on which are recognized over the period covered by the contract.
Sales financing revenues and operating margin recognition
Sales financing revenues
Sales financing revenues are generated by financing operations for sales of vehicles to dealers and end-users. These financing operations take the form of loans from the Sales Financing segment companies, and are carried in the balance sheet at amortized cost under the effective interest rate method, less any impairment. Income on these contracts is calculated so as to give a constant interest rate over the period, and is included in sales revenues.
Sales financing costs
The costs of sales financing are considered as operating expenses and included in the operating margin. They mainly comprise interest incurred by Sales financing companies to refinance their customer loan transactions, other costs and revenues directly related to administration of this type of refinancing (temporary investments, hedging and management of exchange and interest rate risks), and the cost of risks unrelated to refinancing of receivables. Refinancing comes from diversified sources: public and private bond issues, public and private securitization backed by Automotive segments loans, negotiable debt instruments, savings collected and financing from credit institutions and assimilates.
Commissions payable to business intermediaries
Commissions are treated as external distribution costs, and therefore deferred as contract acquisition costs, so as to give a constant interest rate over the term of the financing contracts.
Impairment of receivables
Impairment for incurred credit risk is recognized to cover the risk of non-recovery of receivables. Impairment is determined on an individual basis (using a statistical or case-by-case approach as appropriate) for sales financing receivables, and on a collective basis for dealer financing. Any receivable that shows objective evidence of a risk of partial or total non-recovery is classified as a doubtful receivable (if overdue by more than three months) or a compromised doubtful receivable (if the debtor’s financial position has significantly deteriorated), and impairment is recorded accordingly.
Impairment for country risk is determined based on the credit risk to which debtors in a given country are exposed in the event of long-term continuous decline in the economic environment. Impairment is always recognized in respect of non-Euro-zone countries rated lower than BBB+ by Standard & Poor’s. Impairment for country risk is based on a forecast default risk (probability of default) and a rate of loss caused by default. The calculation may also be adjusted based on expert assessment.
H – Financial income (expenses)
The cost of net financial indebtedness comprises the cost of gross financial indebtedness less income associated with cash, cash equivalents and financial assets of the Automotive segments. The cost of gross financial indebtedness consists of income and expenses generated by the Automotive segments’ financial indebtedness during the period, including the impact of the effective portion of the related interest rate hedges.
Other financial income and expenses mainly include changes in the fair value of Renault SA redeemable shares, the net interest on provisions for pensions, and dividends and impairment of companies that are neither controlled nor under significant influence by the Group.
I – Income tax
The Group recognizes deferred taxes for all temporary differences between the tax and book values of assets and liabilities in the consolidated statement of financial position. Deferred taxes are calculated at the latest tax rate enacted at the closing date applicable to the period when temporary differences are reversed. Each individual fiscal entity (legal entity, establishment or group of entities that pays tax to the tax administration) that is authorized to offset its current tax assets and liabilities reports deferred tax assets and liabilities net. Recognition of deferred tax assets depends on the probability of future recovery.
For associates and joint ventures, a deferred tax liability on dividend distributions is booked for all differences between the book value and tax value of shares held.
Tax credits that can only be used against a taxable profit are recorded as a deduction from the income tax payable. Tax credits that are recoverable regardless of whether the company makes a taxable profit are set against the relevant nature of expense.
The presentation of taxes based on a taxable profit, as defined in IAS 12, Income taxes, in the income statement and statement of cash flow is described in notes 2-A2 and A3.
J - Goodwill
Non-controlling interests (formerly called “minority interests”) are carried at fair value (the full goodwill method) or at their share in the fair value of assets acquired and liabilities transferred (the partial goodwill method). To date Renault has only recognized goodwill valued under the partial goodwill method. The choice of which method to use is made for each individual case.
Goodwill is not amortized, but impairment tests are carried out at least annually or whenever there is evidence of loss of value. After initial recognition, goodwill is stated at cost less any accumulated impairment.
31
Goodwill relating to associates and joint ventures is included in the value of the entities concerned as reported in the assets in the statement of financial position. In the event of impairment, an impairment loss is booked and included in the consolidated income statement via the share in net income (loss) of associates and joint ventures.
Acquisitions of additional investments concerning non-controlling interests in companies controlled by the Group are treated as equity transactions. The positive or negative difference between the cost of acquiring shares and the book value of the non-controlling interests acquired is recorded in shareholders’ equity.
K - Research and development expenses
Development expenses incurred between the decision to begin development and implement production facilities for a new vehicle or component (e.g. engine or gearbox) and the subsequent approval of the design for mass production are capitalized as intangible assets. They are amortized on a straight-line basis from the date of approval for production, over the expected market life of the vehicle or part, which is initially no longer than seven years. Market lives are regularly reviewed and subsequently adjusted if there is a significant difference from the initial estimate. Capitalized development expenses mainly comprise the cost of prototypes, the cost of studies invoiced by external firms, the cost of personnel assigned to the project and a share of overheads dedicated exclusively to development activities.
Borrowing costs directly attributable to the development of a project requiring at least 12 months of preparation before commissioning are included in the gross value of the asset, which is a “qualifying asset”. The capitalization rate for borrowing costs is limited such that capitalized borrowing costs do not exceed the total borrowing costs borne during the year. When a project is financed through a specific borrowing, the capitalization rate is equal to the interest rate on the borrowing.
Expenses incurred before the decision to begin product development are recorded as costs in the period they are incurred, in the same way as research expenses. Expenses incurred after the start of mass production are treated as production costs.
L – Property, plant and equipment
The gross value of property, plant and equipment corresponds to historical acquisition or production cost.
Design and preparation expenses are included in the asset’s production cost.
The production cost for property, plant and equipment also includes financing costs borne during the construction phase, under the same method as for intangible assets. When a project is financed through a specific borrowing, the capitalization rate is equal to the interest rate on the borrowing.
Investment subsidies received are deducted from the gross value of the assets concerned.
Subsequent expenses for property, plant and equipment, except those incurred to increase productivity or prolong the life of an asset, are charged to expenses as incurred.
Assets used by the Group under finance leases are treated as assets financed by credit.
Fixed assets leased to customers are vehicles and batteries under a lease of more than one year from a Group finance company, for which the Group has a repurchase commitment, or vehicles sold under an agreement including a buy-back clause (note 2-G).
Depreciation
Depreciation is calculated on a straight-line basis over the following estimated useful lives:
Buildings(1) 15 to 30 years
Specific tools 2 to 7 years
Machinery and other tools (other than press lines) 5 to 15 years
Press lines 20 to 30 years
Other tangible assets(2) 4 to 6 years
(1) Buildings in use before 1987 are depreciated over a period of up to 40 years. (2) Except for leased batteries, which are depreciated over periods of 8 to 10 years depending on the models.
Useful lives are regularly reviewed, and accelerated depreciation is recorded when an asset's useful life becomes shorter than the initially expected period of use, particularly when it is decided to withdraw a vehicle or component from the market.
Depreciation for the AVTOVAZ segment is calculated on a straight-line basis over useful lives that may be longer than those used in other Renault Group companies, up to a maximum of 80 years for buildings, 17 years for specific tools, 20 years for machinery and other tools and 13 years for other tangible assets.
M – Impairment
Impairment of fixed assets (other than leased assets)
Fixed assets are subjected to impairment tests as soon as there is any indication of a loss of value, such as significant adverse changes in the market in which the company operates, or changes affecting the circumstances and manner of use of the assets.
32
For the Automotive (excluding AVTOVAZ) segment, impairment tests are carried out at two levels:
At the level of vehicle-specific and component-specific assets
Vehicle-specific and component-specific assets consist of capitalized development expenses and tools. Impairment tests are carried out by comparing the net book value of the assets with the recoverable value, calculated based on discounted future cash flows related to the vehicle or component.
At the level of other cash-generating units
A cash-generating unit is defined as a coherent subset that generates largely independent cash flows. Other cash-generating units may represent an economic entity (plant or subsidiary) or the whole Automotive (excluding AVTOVAZ) segment. Net fixed assets related to cash-generating units notably include goodwill, specific assets and capacity assets, and components of working capital.
For each of the two levels, impairment tests are carried out by comparing the net book value with the recoverable value. Recoverable value is defined as the higher of value in use or fair value less selling costs. Value in use is the present value of estimated future cash flows expected to arise from the use of an asset. Future cash flows derive from the business plan drawn up and validated by the Management, plus a terminal value based on discounted normative cash flows after application of a growth rate to infinity. They also include the dividends paid by the Sales Financing segment to the Automotive (excluding AVTOVAZ) segment; these dividends represent, in cash form, the Sales Financing segment’s contribution as taken into consideration in internal assessments of project profitability. The assumptions underlying the business plan include estimates of market developments in countries in which the Group operates and its share of those markets, changes in the sale price of products and the prices of purchased components and commodities. The pre-tax discount rate used is the weighted average cost of capital as determined by the company. When the recoverable value is lower than the net book value, impairment equivalent to the difference is recorded against the assets concerned. For the Sales Financing segment, an impairment test is carried out at least once a year or whenever there is an indication of loss of value, by comparing the book value and recoverable value of assets. Recoverable value is defined as the higher of fair value (less selling costs) and value in use. Value in use is the present value of future cash flows as determined in the most recent 5-year forecasts for each cash-generating unit group, consisting of legal entities or groups of legal entities in a given country. The same discount rate is used for all cash-generating units tested: a risk-free 10-year rate increased by the average risk premium for the sector in which the cash-generating units operate.
For AVTOVAZ, impairment tests are also carried out at two levels (on specific assets and cash-generating units).The
AVTOVAZ Group as a whole is considered as one cash-generating unit, and no tests are conducted for individual factories or
economic entities.
Impairment of investments in associates and joint ventures
Impairment tests of the value of investments in associates and joint ventures are carried out as soon as there is any indication of a loss of value, essentially significant adverse changes in the markets in which the company operates, or a major or long-term decline in stock market value.
Impairment tests are carried out in compliance with IAS 28 and IAS 36, by comparing the book value of the investment in the associate or joint venture with the recoverable value, which is the higher of value in use and fair value, less selling costs. The value in use is equal to the share of the present value of future estimated cash flows expected by the associate or joint venture. If the associate or joint venture is listed, the fair value is its stock market value. When the recoverable value is lower than the book value, impairment equivalent to the difference is recorded against the relevant investment in an associate or joint venture, and included in the Group’s income statement via the share in net income (loss) of associates and joint ventures.
N – Non-current assets or groups of assets held for sale
Assets held for sale are non-current assets or groups of assets that are available for immediate sale and have a high probability of being sold.
Non-current assets or groups of assets considered to be held for sale are measured and recorded at the lower of net book value or fair value less selling costs. No further amortization is recorded once an asset is classified as held for sale (or included in a group of assets held for sale). These assets are reported on a specific line of the consolidated financial position.
O – Inventories
Inventories are stated at the lower of cost or net realisable value. Cost corresponds to acquisition cost or production cost, which includes direct and indirect production expenses, and a share of manufacturing overheads based on a normal level of activity. The normal level of activity is assessed site by site, in order to determine the share of fixed costs to be excluded in the event of below-normal activity.
Inventories of the Automotive (excluding AVTOVAZ) segment and the Sales Financing segment are valued under the FIFO (First In First Out) method. Inventories of AVTOVAZ are valued at weighted average cost.
When the net realisable value is lower than the financial position value, impairment equal to the difference is recorded.
33
P – Assignment of receivables
Receivables assigned to third parties (through securitization or discounting) are removed from Group assets when the associated risks and benefits are also substantially transferred to the third parties in question.
The same treatment applies to assignments between the Automotive (excluding Avtovaz) and Sales Financing segments.
Q – Treasury shares
Treasury shares are shares held for the purposes of stock option plans and performance share plans awarded to Group managers and executives. They are recorded at acquisition cost and deducted from Group shareholders’ equity until the date of sale.
When these shares are sold, the sale price is directly included in consolidated shareholders’ equity. Consequently, no gain or loss on treasury shares is included in the net income for the period.
R – Stock option plans / Performance share attribution plans and other share-based payments
agreements
The Group awards stock option plans (purchase and subscription options), performance share attribution plans and other share-based payments, all for Renault shares. The grant date is the date at which beneficiaries are informed of the decision to grant these options or performance shares, and the terms of the relevant plans. For plans subject to performance conditions, an estimate of achievement of those conditions is taken into account in determining the number of options or shares attributed. This estimate is reviewed annually based on changes in the probability of performance condition achievement. The final fair value of services rendered in return for attribution of options or shares is measured by reference to the fair value of those options or shares at their grant date, using a suitable binomial mathematical model that assumes exercise of the options is spread over the exercise period on a straight-line basis. Entitlements to attribution of performance shares are valued based on the share value at grant date less dividends expected during the vesting period. Where relevant, a discount is applied to reflect the fact that the shares must be held for a certain period. The share price volatility factor applied is implicit volatility at the grant date. The expected dividend used is determined by reference to the dividend payout schedule announced at the time each plan is valued.
The total fair value calculated in this way is spread on a straight-line basis over the vesting period for the relevant plan. The cost is included in personnel expenses, with a corresponding adjustment to consolidated reserves. When the option is exercised, the cash amount received by the Group in settlement of the exercise price is booked in cash and cash equivalents, with a corresponding adjustment to consolidated reserves.
S - Pensions and other long-term employee benefit obligations
The Group’s payments for defined-contribution benefit plans are recorded as expenses for the relevant period.
For defined-benefit plans concerning post-employment benefits, the Group uses the Projected Unit Credit Method to determine the present value of its obligations. Under this method, benefits are attributed to periods of service according to the plan's benefit formula, principally on a straight-line basis over the years of service.
The future payments for employee benefits are measured on the basis of future salary increases, retirement age, mortality and length of employment with the company, and are discounted at a rate determined by reference to yields on long-term high quality corporate bonds of a duration corresponding to the estimated average duration of the benefit plan concerned.
The actuarial gains and losses resulting from revisions of the underlying assumptions and experience-based adjustments are included in other components of comprehensive income.
The net expense for the year, corresponding to the current period service cost plus the past service cost where relevant, is charged to the operating margin. The interest expense on the net defined-benefit liability (asset) is recorded in the net financial income and expenses.
T – Workforce adjustment measures
The estimated cost of workforce adjustment measures, which for accounting purposes is treated as an employee benefit, is covered by a provision over the estimated residual employment period of the employees concerned.
The estimated cost of termination indemnities is recognized as soon as a detailed plan has either been announced or is in progress.
U – Financial assets
The Group recognizes a financial asset when it becomes a party to the contractual provisions of the instrument.
Financial assets comprise investments in non-controlled companies in which Renault does not exercise significant influence, marketable securities, negotiable debt instruments, loans, and derivative assets related to financial transactions (note 2-X).
These instruments are presented as non-current assets, apart from those maturing within 12 months of the closing date, which are classified as current assets.
34
Investments in non-controlled companies in which Renault does not have significant influence
Investments in non-controlled companies in which Renault does not have significant influence are classified as “available-for-sale” assets. The fair values of such financial assets are determined in priority by reference to the market price. If this is not possible, the Group uses a valuation method that is not based on market data.
Changes in the fair value of “available-for-sale” assets are included in other components of comprehensive income. If there is a significant or prolonged decrease in the fair value such that it falls below the acquisition price, impairment is recorded in the income statement. A decrease is considered significant if it exceeds 40% of the amount and prolonged if it is observed in more than four successive published financial reports.
Marketable securities and negotiable debt instruments
Short-term investments in the form of marketable securities and negotiable debt instruments are undertaken for the management of cash surpluses, but do not meet the requirements to qualify as cash equivalents.
These instruments are classified as “available-for-sale” assets and carried at fair value.
Loans
Loans essentially include loans for investment of cash surpluses and loans to associates.
They are initially recognized at fair value, plus directly attributable transaction costs.
Loans are valued at amortized cost. Impairment is recognized in the income statement when there is objective evidence of depreciation in value caused by an event arising after the initial recognition of the asset.
V – Cash and cash equivalents
Cash includes cash on hand, current accounts and other demand deposits, with the exception of bank overdrafts, which are included in financial liabilities. These instruments are stated at amortized cost.
Cash equivalents are investments held for the purpose of meeting short-term cash commitments. For an investment to qualify as a cash equivalent, it must be readily convertible for a known amount of cash and be subject to an insignificant risk of change in value. Fixed or variable-income instruments that are not listed on an active market are stated at amortized cost. Other instruments are carried at fair value.
Bank accounts subject to restrictions due to sector-specific regulations (for example, banking regulations) or bank accounts allocated to increasing credit on securitized receivables are included in cash and cash equivalents.
W – Financial liabilities of the Automotive segments and sales financing debts
The Group recognizes a financial liability (for the Automotive segments) or a sales financing debt when it becomes a party to the contractual provisions of the instrument.
Financial liabilities and sales financing debts comprise redeemable shares, bonds, other debts represented by a certificate, borrowings from credit institutions, other interest-bearing borrowings and derivative liabilities related to financial transactions (note 2-X).
Redeemable shares
In accordance with IAS 39, the Group considers that the variable interest on redeemable shares is an embedded derivative which cannot be valued separately. Consequently, the Group states all its redeemable shares at fair value, which is equal to market value.
Changes in the fair value of Automotive (excluding AVTOVAZ) segment redeemable shares are recorded in financial income and expenses, while changes in the fair value of Sales Financing segment redeemable shares are recorded in the operating margin.
Bonds, other debts represented by a certificate, borrowings from credit institutions and other interest-bearing
borrowings
Bonds, other debts represented by a certificate, borrowings from credit institutions and other interest-bearing borrowings are initially stated at fair value, less any directly attributable transaction costs.
At each reporting date, apart from specific hedge accounting methods (note 2-X), these financial liabilities are generally restated at amortized cost using the effective interest rate method. The financial expense calculated in this way includes issuance expenses and issuance or redemption premiums, together with the impact of debt renegotiations when the old and new terms are not substantially different.
35
X – Derivatives and hedge accounting
Measurement and presentation
Derivatives are initially stated at fair value. This fair value is subsequently reviewed at each closing date.
The fair value of forward exchange contracts is based on market conditions. The fair value of currency swaps is determined by discounting future cash flows, using closing-date market rates (exchange and interest rates).
The fair value of interest rate derivatives is the amount the Group would receive (or pay) to settle outstanding contracts at the closing date, taking into account any unrealized gains or losses based on interest rates and the quality of the counterparty to each contract at the closing date. This fair value includes accrued interest.
The fair value of commodity derivatives is based on market conditions.
The Automotive segments’ derivatives are reported in the financial position as current if they mature within 12 months and non-current otherwise. All Sales Financing segment derivatives are reported in the financial position as current.
Hedge accounting
The treatment of derivatives designated as hedging instruments depends on the type of hedging relationship:
fair value hedge;
cash flow hedge;
hedge of a net investment in a foreign operation.
The Group identifies the hedging instrument and the hedged item as soon as the hedge is set up, and documents the hedging relationship, stating the hedging strategy, the risk hedged and the method used to assess the hedge’s effectiveness. This documentation is subsequently updated, such that the effectiveness of the designated hedge can be demonstrated.
Hedge accounting uses specific measurement and recognition methods for each category of hedge.
Fair value hedges: the hedged item is adjusted to fair value in view of the risk hedged and the hedging instrument is recorded at fair value. As changes in these items are recorded in the income statement simultaneously, only the ineffective portion of the hedge has an impact on net income. It is recorded in the same income statement item as changes in the fair value of the hedged item and the hedging instrument.
Cash flow hedges: no adjustment is made to the value of the hedged item; only the hedging instrument is adjusted to fair value. Following this adjustment, the effective portion of the change in fair value attributable to the hedged risk is recorded, net of taxes, in other components of comprehensive income, while the ineffective portion is included in net income. The cumulative amount included in shareholders’ equity is transferred to the income statement when the hedged item has an impact on net income.
Hedge of a net investment in a foreign operation: the hedging instrument is adjusted to fair value. Following this adjustment, the effective portion of the change in fair value attributable to the hedged exchange risk is recorded, net of taxes, in other components of comprehensive income, while the ineffective portion is included in net income. The cumulative amount included in shareholders’ equity is transferred to net income at the date of liquidation or sale of the investment. The interest rate component of financial instruments used to hedge the investment in Nissan (forward sales and fixed/fixed cross-currency swaps) is treated as an ineffective portion and consequently recorded directly in financial income and expenses.
Derivatives not designated as hedges
Changes in the fair value of derivatives not designated as hedges are recognized directly in financial income, except in the case of derivatives entered into exclusively for reasons closely related to business operations. In this case, changes in the fair value of derivatives are included in the operating margin.
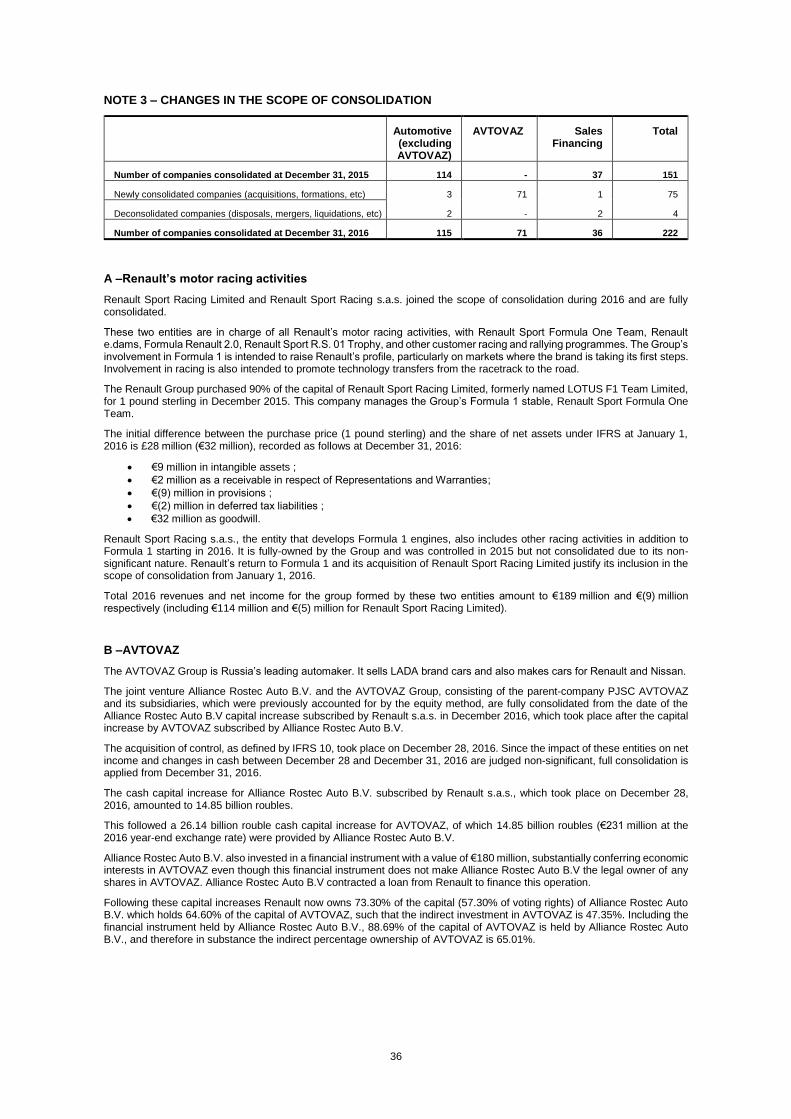
36
NOTE 3 – CHANGES IN THE SCOPE OF CONSOLIDATION
Automotive (excluding AVTOVAZ)
AVTOVAZ Sales Financing
Total
Number of companies consolidated at December 31, 2015 114 - 37 151
Newly consolidated companies (acquisitions, formations, etc) 3 71 1 75
Deconsolidated companies (disposals, mergers, liquidations, etc) 2 - 2 4
Number of companies consolidated at December 31, 2016 115 71 36 222
A –Renault’s motor racing activities
Renault Sport Racing Limited and Renault Sport Racing s.a.s. joined the scope of consolidation during 2016 and are fully consolidated.
These two entities are in charge of all Renault’s motor racing activities, with Renault Sport Formula One Team, Renault e.dams, Formula Renault 2.0, Renault Sport R.S. 01 Trophy, and other customer racing and rallying programmes. The Group’s involvement in Formula 1 is intended to raise Renault’s profile, particularly on markets where the brand is taking its first steps. Involvement in racing is also intended to promote technology transfers from the racetrack to the road.
The Renault Group purchased 90% of the capital of Renault Sport Racing Limited, formerly named LOTUS F1 Team Limited, for 1 pound sterling in December 2015. This company manages the Group’s Formula 1 stable, Renault Sport Formula One Team.
The initial difference between the purchase price (1 pound sterling) and the share of net assets under IFRS at January 1, 2016 is £28 million (€32 million), recorded as follows at December 31, 2016:
€9 million in intangible assets ;
€2 million as a receivable in respect of Representations and Warranties;
€(9) million in provisions ;
€(2) million in deferred tax liabilities ;
€32 million as goodwill.
Renault Sport Racing s.a.s., the entity that develops Formula 1 engines, also includes other racing activities in addition to Formula 1 starting in 2016. It is fully-owned by the Group and was controlled in 2015 but not consolidated due to its non-significant nature. Renault’s return to Formula 1 and its acquisition of Renault Sport Racing Limited justify its inclusion in the scope of consolidation from January 1, 2016.
Total 2016 revenues and net income for the group formed by these two entities amount to €189 million and €(9) million respectively (including €114 million and €(5) million for Renault Sport Racing Limited).
B –AVTOVAZ
The AVTOVAZ Group is Russia’s leading automaker. It sells LADA brand cars and also makes cars for Renault and Nissan.
The joint venture Alliance Rostec Auto B.V. and the AVTOVAZ Group, consisting of the parent-company PJSC AVTOVAZ and its subsidiaries, which were previously accounted for by the equity method, are fully consolidated from the date of the Alliance Rostec Auto B.V capital increase subscribed by Renault s.a.s. in December 2016, which took place after the capital increase by AVTOVAZ subscribed by Alliance Rostec Auto B.V.
The acquisition of control, as defined by IFRS 10, took place on December 28, 2016. Since the impact of these entities on net income and changes in cash between December 28 and December 31, 2016 are judged non-significant, full consolidation is applied from December 31, 2016.
The cash capital increase for Alliance Rostec Auto B.V. subscribed by Renault s.a.s., which took place on December 28, 2016, amounted to 14.85 billion roubles.
This followed a 26.14 billion rouble cash capital increase for AVTOVAZ, of which 14.85 billion roubles (€231 million at the 2016 year-end exchange rate) were provided by Alliance Rostec Auto B.V.
Alliance Rostec Auto B.V. also invested in a financial instrument with a value of €180 million, substantially conferring economic interests in AVTOVAZ even though this financial instrument does not make Alliance Rostec Auto B.V the legal owner of any shares in AVTOVAZ. Alliance Rostec Auto B.V contracted a loan from Renault to finance this operation.
Following these capital increases Renault now owns 73.30% of the capital (57.30% of voting rights) of Alliance Rostec Auto B.V. which holds 64.60% of the capital of AVTOVAZ, such that the indirect investment in AVTOVAZ is 47.35%. Including the financial instrument held by Alliance Rostec Auto B.V., 88.69% of the capital of AVTOVAZ is held by Alliance Rostec Auto B.V., and therefore in substance the indirect percentage ownership of AVTOVAZ is 65.01%.
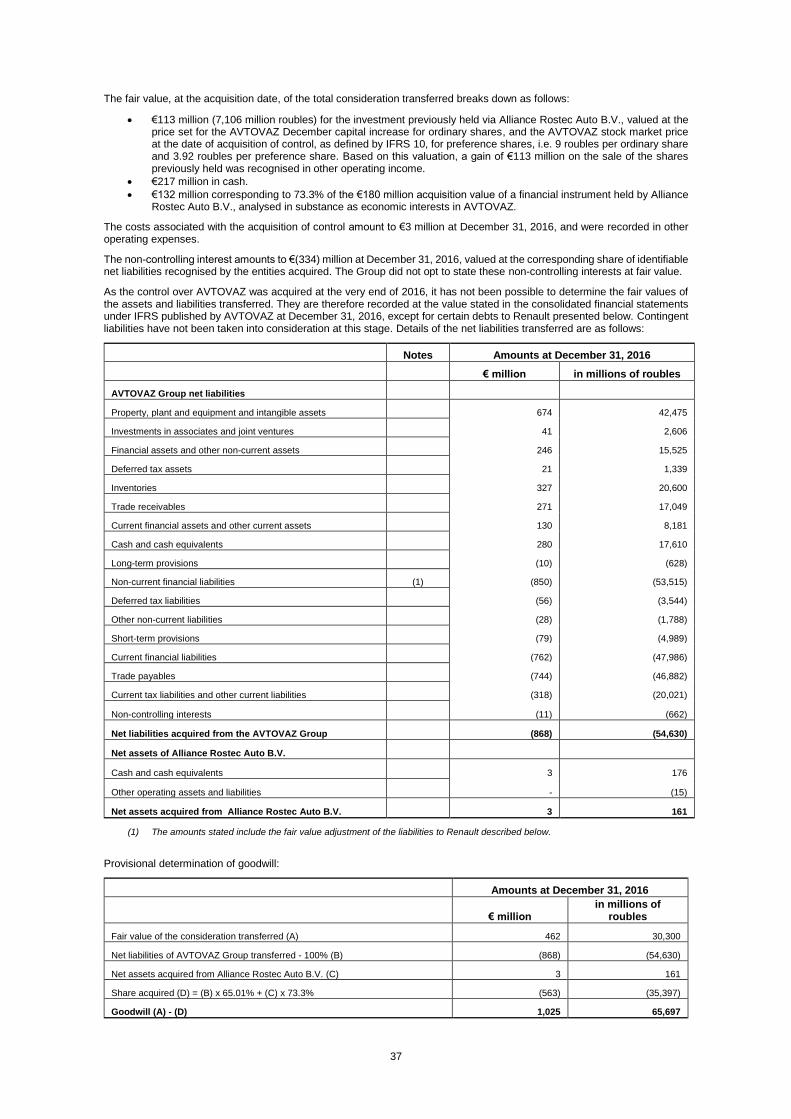
37
The fair value, at the acquisition date, of the total consideration transferred breaks down as follows:
€113 million (7,106 million roubles) for the investment previously held via Alliance Rostec Auto B.V., valued at the price set for the AVTOVAZ December capital increase for ordinary shares, and the AVTOVAZ stock market price at the date of acquisition of control, as defined by IFRS 10, for preference shares, i.e. 9 roubles per ordinary share and 3.92 roubles per preference share. Based on this valuation, a gain of €113 million on the sale of the shares previously held was recognised in other operating income.
€217 million in cash.
€132 million corresponding to 73.3% of the €180 million acquisition value of a financial instrument held by Alliance Rostec Auto B.V., analysed in substance as economic interests in AVTOVAZ.
The costs associated with the acquisition of control amount to €3 million at December 31, 2016, and were recorded in other operating expenses.
The non-controlling interest amounts to €(334) million at December 31, 2016, valued at the corresponding share of identifiable net liabilities recognised by the entities acquired. The Group did not opt to state these non-controlling interests at fair value.
As the control over AVTOVAZ was acquired at the very end of 2016, it has not been possible to determine the fair values of the assets and liabilities transferred. They are therefore recorded at the value stated in the consolidated financial statements under IFRS published by AVTOVAZ at December 31, 2016, except for certain debts to Renault presented below. Contingent liabilities have not been taken into consideration at this stage. Details of the net liabilities transferred are as follows:
Notes Amounts at December 31, 2016
€ million in millions of roubles
AVTOVAZ Group net liabilities
Property, plant and equipment and intangible assets 674 42,475
Investments in associates and joint ventures 41 2,606
Financial assets and other non-current assets 246 15,525
Deferred tax assets 21 1,339
Inventories 327 20,600
Trade receivables 271 17,049
Current financial assets and other current assets 130 8,181
Cash and cash equivalents 280 17,610
Long-term provisions (10) (628)
Non-current financial liabilities (1) (850) (53,515)
Deferred tax liabilities (56) (3,544)
Other non-current liabilities (28) (1,788)
Short-term provisions (79) (4,989)
Current financial liabilities (762) (47,986)
Trade payables (744) (46,882)
Current tax liabilities and other current liabilities (318) (20,021)
Non-controlling interests (11) (662)
Net liabilities acquired from the AVTOVAZ Group (868) (54,630)
Net assets of Alliance Rostec Auto B.V.
Cash and cash equivalents 3 176
Other operating assets and liabilities - (15)
Net assets acquired from Alliance Rostec Auto B.V. 3 161
(1) The amounts stated include the fair value adjustment of the liabilities to Renault described below.
Provisional determination of goodwill:
Amounts at December 31, 2016
€ million in millions of
roubles
Fair value of the consideration transferred (A) 462 30,300
Net liabilities of AVTOVAZ Group transferred - 100% (B) (868) (54,630)
Net assets acquired from Alliance Rostec Auto B.V. (C) 3 161
Share acquired (D) = (B) x 65.01% + (C) x 73.3% (563) (35,397)
Goodwill (A) - (D) 1,025 65,697
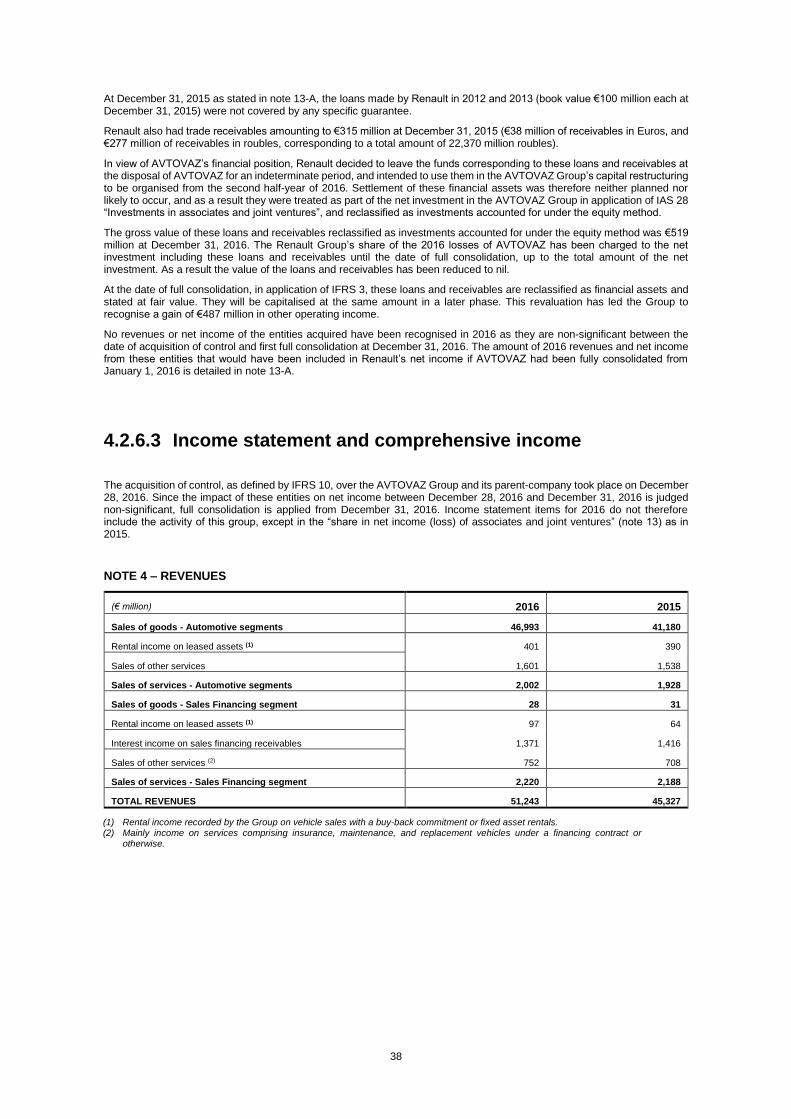
38
At December 31, 2015 as stated in note 13-A, the loans made by Renault in 2012 and 2013 (book value €100 million each at December 31, 2015) were not covered by any specific guarantee.
Renault also had trade receivables amounting to €315 million at December 31, 2015 (€38 million of receivables in Euros, and €277 million of receivables in roubles, corresponding to a total amount of 22,370 million roubles).
In view of AVTOVAZ’s financial position, Renault decided to leave the funds corresponding to these loans and receivables at the disposal of AVTOVAZ for an indeterminate period, and intended to use them in the AVTOVAZ Group’s capital restructuring to be organised from the second half-year of 2016. Settlement of these financial assets was therefore neither planned nor likely to occur, and as a result they were treated as part of the net investment in the AVTOVAZ Group in application of IAS 28 “Investments in associates and joint ventures”, and reclassified as investments accounted for under the equity method.
The gross value of these loans and receivables reclassified as investments accounted for under the equity method was €519 million at December 31, 2016. The Renault Group’s share of the 2016 losses of AVTOVAZ has been charged to the net investment including these loans and receivables until the date of full consolidation, up to the total amount of the net investment. As a result the value of the loans and receivables has been reduced to nil.
At the date of full consolidation, in application of IFRS 3, these loans and receivables are reclassified as financial assets and stated at fair value. They will be capitalised at the same amount in a later phase. This revaluation has led the Group to recognise a gain of €487 million in other operating income.
No revenues or net income of the entities acquired have been recognised in 2016 as they are non-significant between the date of acquisition of control and first full consolidation at December 31, 2016. The amount of 2016 revenues and net income from these entities that would have been included in Renault’s net income if AVTOVAZ had been fully consolidated from January 1, 2016 is detailed in note 13-A.
4.2.6.3 Income statement and comprehensive income
The acquisition of control, as defined by IFRS 10, over the AVTOVAZ Group and its parent-company took place on December 28, 2016. Since the impact of these entities on net income between December 28, 2016 and December 31, 2016 is judged non-significant, full consolidation is applied from December 31, 2016. Income statement items for 2016 do not therefore include the activity of this group, except in the “share in net income (loss) of associates and joint ventures” (note 13) as in 2015.
NOTE 4 – REVENUES
(€ million) 2016 2015
Sales of goods - Automotive segments 46,993 41,180
Rental income on leased assets (1) 401 390
Sales of other services 1,601 1,538
Sales of services - Automotive segments 2,002 1,928
Sales of goods - Sales Financing segment 28 31
Rental income on leased assets (1) 97 64
Interest income on sales financing receivables 1,371 1,416
Sales of other services (2) 752 708
Sales of services - Sales Financing segment 2,220 2,188
TOTAL REVENUES 51,243 45,327
(1) Rental income recorded by the Group on vehicle sales with a buy-back commitment or fixed asset rentals. (2) Mainly income on services comprising insurance, maintenance, and replacement vehicles under a financing contract or
otherwise.

39
B – 2015 revenues applying 2016 scope and methods
(€ million)
Automobile
(excluding
AVTOVAZ)
Sales
financing Total
2015 revenues 43,108 2,219 45,327
Changes in scope of consolidation 156 - 156
2015 revenues applying 2016 scope and methods 43,264 2,219 45,483
2016 revenues 48,995 2,248 51,243
NOTE 5 – OPERATING MARGIN: DETAILS OF INCOME AND EXPENSES BY NATURE
A – Personnel expenses
Personnel expenses amount to €5,747 million in 2016 (€5,408 million in 2015).
The average workforce during the year for consolidated entities is presented in section section 2.4- Human Capital of the 2016 Registration Document.
Details of pensions and other long-term employee benefit expenses are presented in note 19.
The income recorded in respect of the French “CICE” Tax Credit for Competitivity and Employment amount to €50 million in 2016 and €51 million in 2015. It is allocated between income statement items by purpose.
Share-based payments concern stock options, performance shares and other share-based payments granted to personnel, and amounted to a personnel expense of €65 million for 2016 (€42 million in 2015).
The plan valuation method is presented in note 18-H.
B – Rental expenses
Rents amount to €224 million in 2016 (€225 million in 2015).
C – Foreign exchange gains/losses
In 2016, the operating margin includes a net foreign exchange gain of €62 million, partly related to movements in the Argentinian peso, Russian rouble and Turkish lira (compared to a net foreign exchange loss of €96 million in 2015, partly related to movements in the Argentinian peso and Russian rouble).
NOTE 6 – OTHER OPERATING INCOME AND EXPENSES
(€ million) 2016 2015
Restructuring and workforce adjustment costs (283) (157)
Gains and losses on total or partial disposal of businesses or operating entities, and other gains and losses related to changes in the scope of consolidation (23) (13)
Income generated by acquisition of control, as defined by IFRS 10, over Alliance Rostec Auto B.V. and the AVTOVAZ Group 325 -
Gains and losses on disposal of property, plant and equipment and intangible assets (except leased asset sales) 19 23
Impairment of fixed assets and goodwill (excluding goodwill of associates and joint ventures) (38) (53)
Reversal of impairment related to operations in Iran 2 14
Other unusual items (1) (13)
Total 1 (199)
40
A – Restructuring and workforce adjustment costs
Restructuring and workforce adjustment costs in 2016 include €98 million (€79 million in 2015) related to a French career-end work exemption plan introduced in 2013. Employees could sign up to this plan until December 31, 2016. Under IAS 19 (revised), this is considered as an employee benefit and the cost must be covered by a provision established over the residual forecast working life of the employees concerned.
In 2016 these costs also include €106 million for the specific career work exemption arrangements included in the agreement signed on January 13, 2017 named “Renault France CAP 2020 – Contrat d’Activité pour une Performance durable” (activity contract for sustainable performance). The terms of these arrangements were negotiated with representative unions between September 2016 and early January 2017. Since there is a clause that restricts the system to employees having done 15 years of shift work in and outside the Renault Group, the charge recognised in 2016 covers the total cost for employees who had earned the full entitlements at December 31, 2016 and a share of the cost for employees who could sign up for the system between January 1, 2017 and December 31, 2019.
Other restructuring and workforce adjustment costs in 2016 and 2015 mainly concern the Americas, Eurasia and Europe regions.
B – Income generated by acquisition of control, as defined by IFRS 10, over Alliance Rostec Auto B.V.
and the AVTOVAZ Group
The acquisition of control over Alliance Rostec Auto B.V. and AVTOVAZ, which took place on December 28, 2016 (note 3-B), is treated as a sale of the shares in Alliance Rostec Auto B.V. and AVTOVAZ held at the date control was acquired, at their fair value (€113 million, corresponding to the price set for the AVTOVAZ December capital increase for ordinary shares and the AVTOVAZ stock market price at the transaction date for preference shares), in compliance with IFRS 3 “Business combinations”.
The loans and receivables that are analysed under IAS 28 as an extension of the investment had a book value of nil at the date of acquisition of control, and were stated at fair value in compliance with IFRS 3, resulting in a gain of €487 million. The accumulated translation adjustments, amounting to €(272) million at the date of acquisition of control, were transferred to other operating income and expenses.
The net impact of acquisition of control of the AVTOVAZ Group recognised in other operating income and expenses is thus a net gain of €325 million, including €3 million of share purchase expenses.
C – Impairment of fixed assets and goodwill (excluding goodwill of associates and joint ventures)
At December 31, 2016, impairment of €37 million was booked (€53 million in 2015). This impairment relates entirely to intangible assets. In 2015, the impairment concerned both intangible assets (€21 million) and tangible assets (€32 million). This impairment mainly results from impairment tests of vehicle components (note 10 and note 11).
D – Impairment related to operations in Iran
The Group’s exposure to risks on business with Iran, consisting of securities, a shareholder loan and sales receivables, was fully written off in 2013. The situation changed little over 2016. The gross exposure in the assets at December 31, 2016 was €803 million, including €696 million of receivables (€809 million including €701 million of receivables at December 31, 2015). The decrease in impairment in 2016 and 2015 essentially reflects payments received during those years.
The level of operations with Iran showed a recovery at December 31, 2016 compared to 2015, with sales of CKD amounting to €513 million at December 31, 2016 and €218 million at December 31, 2015. Sales are only recognized once the cash is received, and payments related to the totally written-off receivables dating from before mid-2013 remain very limited. This is reflected in the amount recovered from impairment: €2 million at December 31, 2016, compared to €14 million for 2015.
In September 2016 Renault and Iran IDRO, an investment and industry renewal fund in Iran, signed a further agreement for future formation of a joint venture in which Renault will be the majority shareholder. This entity was not yet in existence at December 31, 2016.
As the market is gradually reopening, in view of the forthcoming agreement between Renault and the Iranian government and future discussions with local partners, the possibility of reconsolidating Renault Pars is being examined.
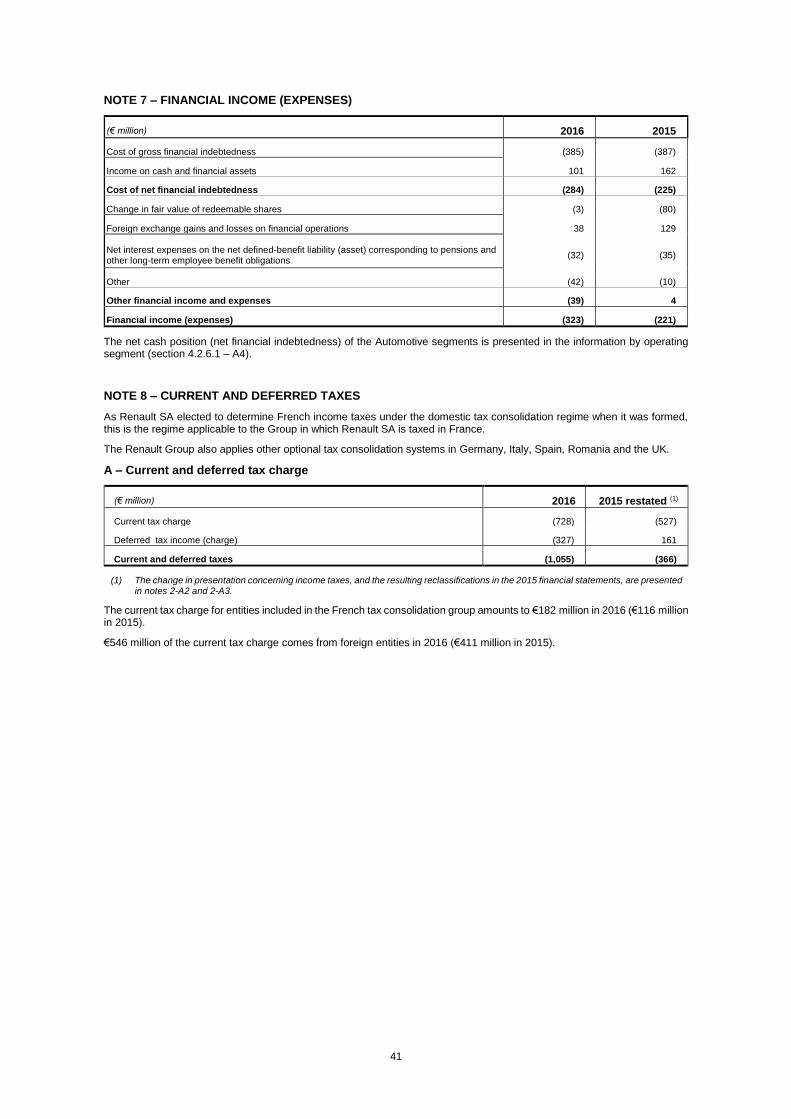
41
NOTE 7 – FINANCIAL INCOME (EXPENSES)
(€ million) 2016 2015
Cost of gross financial indebtedness (385) (387)
Income on cash and financial assets 101 162
Cost of net financial indebtedness (284) (225)
Change in fair value of redeemable shares (3) (80)
Foreign exchange gains and losses on financial operations 38 129
Net interest expenses on the net defined-benefit liability (asset) corresponding to pensions and other long-term employee benefit obligations
(32) (35)
Other (42) (10)
Other financial income and expenses (39) 4
Financial income (expenses) (323) (221)
The net cash position (net financial indebtedness) of the Automotive segments is presented in the information by operating segment (section 4.2.6.1 – A4).
NOTE 8 – CURRENT AND DEFERRED TAXES
As Renault SA elected to determine French income taxes under the domestic tax consolidation regime when it was formed, this is the regime applicable to the Group in which Renault SA is taxed in France.
The Renault Group also applies other optional tax consolidation systems in Germany, Italy, Spain, Romania and the UK.
A – Current and deferred tax charge
(€ million) 2016 2015 restated (1)
Current tax charge (728) (527)
Deferred tax income (charge) (327) 161
Current and deferred taxes (1,055) (366)
(1) The change in presentation concerning income taxes, and the resulting reclassifications in the 2015 financial statements, are presented in notes 2-A2 and 2-A3.
The current tax charge for entities included in the French tax consolidation group amounts to €182 million in 2016 (€116 million in 2015).
€546 million of the current tax charge comes from foreign entities in 2016 (€411 million in 2015).
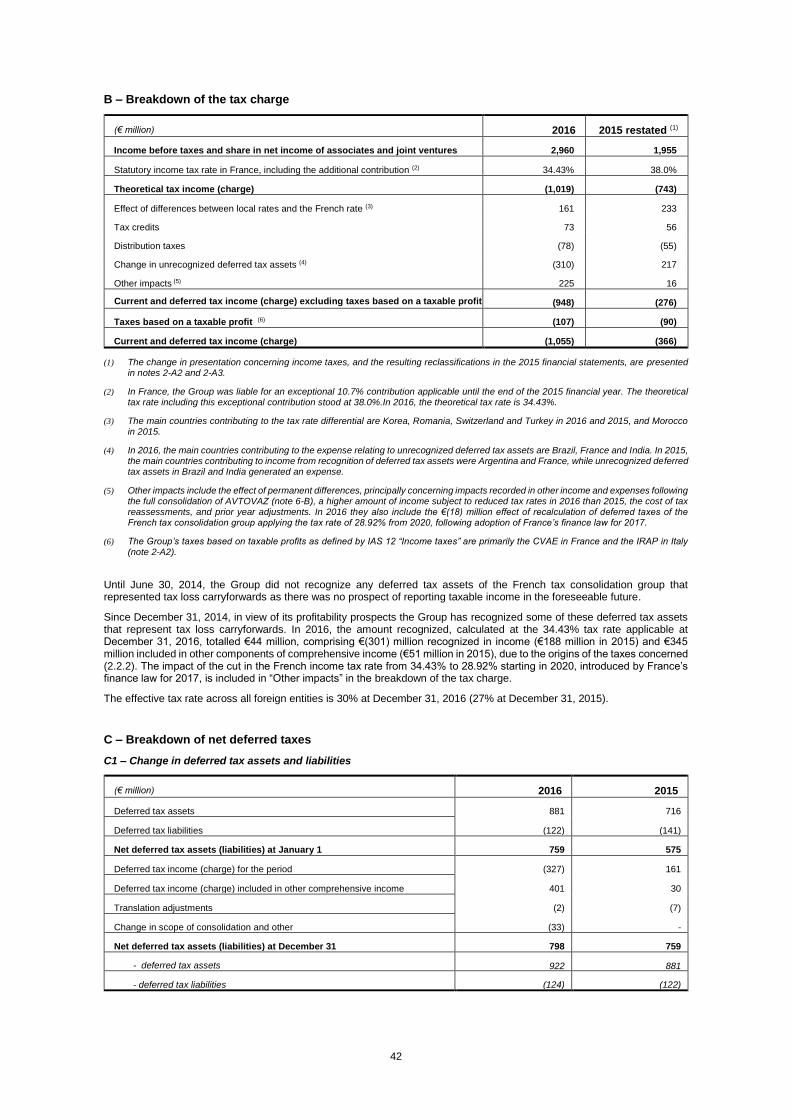
42
B – Breakdown of the tax charge
(€ million) 2016 2015 restated (1)
Income before taxes and share in net income of associates and joint ventures 2,960 1,955
Statutory income tax rate in France, including the additional contribution (2) 34.43% 38.0%
Theoretical tax income (charge) (1,019) (743)
Effect of differences between local rates and the French rate (3) 161 233
Tax credits 73 56
Distribution taxes (78) (55)
Change in unrecognized deferred tax assets (4) (310) 217
Other impacts (5) 225 16
Current and deferred tax income (charge) excluding taxes based on a taxable profit (948) (276)
Taxes based on a taxable profit (6) (107) (90)
Current and deferred tax income (charge) (1,055) (366)
(1) The change in presentation concerning income taxes, and the resulting reclassifications in the 2015 financial statements, are presented in notes 2-A2 and 2-A3.
(2) In France, the Group was liable for an exceptional 10.7% contribution applicable until the end of the 2015 financial year. The theoretical tax rate including this exceptional contribution stood at 38.0%.In 2016, the theoretical tax rate is 34.43%.
(3) The main countries contributing to the tax rate differential are Korea, Romania, Switzerland and Turkey in 2016 and 2015, and Morocco in 2015.
(4) In 2016, the main countries contributing to the expense relating to unrecognized deferred tax assets are Brazil, France and India. In 2015, the main countries contributing to income from recognition of deferred tax assets were Argentina and France, while unrecognized deferred tax assets in Brazil and India generated an expense.
(5) Other impacts include the effect of permanent differences, principally concerning impacts recorded in other income and expenses following the full consolidation of AVTOVAZ (note 6-B), a higher amount of income subject to reduced tax rates in 2016 than 2015, the cost of tax reassessments, and prior year adjustments. In 2016 they also include the €(18) million effect of recalculation of deferred taxes of the French tax consolidation group applying the tax rate of 28.92% from 2020, following adoption of France’s finance law for 2017.
(6) The Group’s taxes based on taxable profits as defined by IAS 12 “Income taxes” are primarily the CVAE in France and the IRAP in Italy (note 2-A2).
Until June 30, 2014, the Group did not recognize any deferred tax assets of the French tax consolidation group that represented tax loss carryforwards as there was no prospect of reporting taxable income in the foreseeable future.
Since December 31, 2014, in view of its profitability prospects the Group has recognized some of these deferred tax assets that represent tax loss carryforwards. In 2016, the amount recognized, calculated at the 34.43% tax rate applicable at December 31, 2016, totalled €44 million, comprising €(301) million recognized in income (€188 million in 2015) and €345 million included in other components of comprehensive income (€51 million in 2015), due to the origins of the taxes concerned (2.2.2). The impact of the cut in the French income tax rate from 34.43% to 28.92% starting in 2020, introduced by France’s finance law for 2017, is included in “Other impacts” in the breakdown of the tax charge.
The effective tax rate across all foreign entities is 30% at December 31, 2016 (27% at December 31, 2015).
C – Breakdown of net deferred taxes
C1 – Change in deferred tax assets and liabilities
(€ million) 2016 2015
Deferred tax assets 881 716
Deferred tax liabilities (122) (141)
Net deferred tax assets (liabilities) at January 1 759 575
Deferred tax income (charge) for the period (327) 161
Deferred tax income (charge) included in other comprehensive income 401 30
Translation adjustments (2) (7)
Change in scope of consolidation and other (33) -
Net deferred tax assets (liabilities) at December 31 798 759
- deferred tax assets 922 881
- deferred tax liabilities (124) (122)
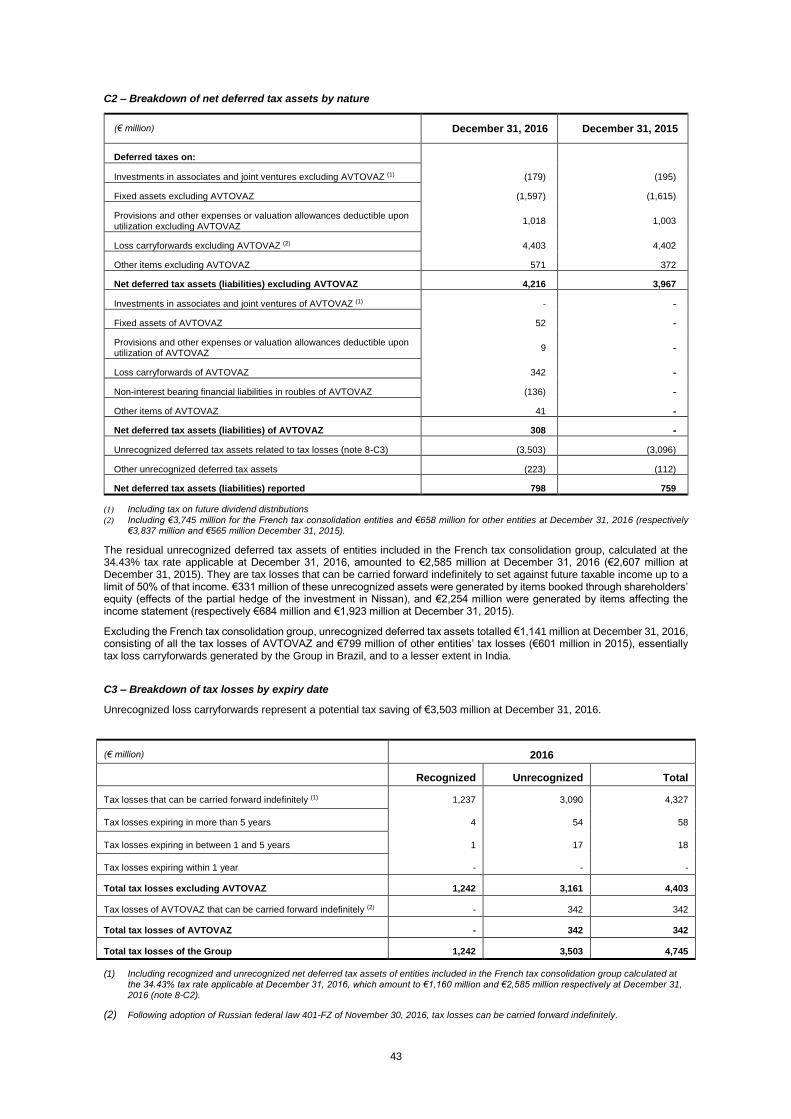
43
C2 – Breakdown of net deferred tax assets by nature
(€ million) December 31, 2016 December 31, 2015
Deferred taxes on:
Investments in associates and joint ventures excluding AVTOVAZ (1) (179) (195)
Fixed assets excluding AVTOVAZ (1,597) (1,615)
Provisions and other expenses or valuation allowances deductible upon utilization excluding AVTOVAZ
1,018 1,003
Loss carryforwards excluding AVTOVAZ (2) 4,403 4,402
Other items excluding AVTOVAZ 571 372
Net deferred tax assets (liabilities) excluding AVTOVAZ 4,216 3,967
Investments in associates and joint ventures of AVTOVAZ (1) - -
Fixed assets of AVTOVAZ 52 -
Provisions and other expenses or valuation allowances deductible upon utilization of AVTOVAZ
9 -
Loss carryforwards of AVTOVAZ 342 -
Non-interest bearing financial liabilities in roubles of AVTOVAZ (136) -
Other items of AVTOVAZ 41 -
Net deferred tax assets (liabilities) of AVTOVAZ 308 -
Unrecognized deferred tax assets related to tax losses (note 8-C3) (3,503) (3,096)
Other unrecognized deferred tax assets (223) (112)
Net deferred tax assets (liabilities) reported 798 759
(1) Including tax on future dividend distributions
(2) Including €3,745 million for the French tax consolidation entities and €658 million for other entities at December 31, 2016 (respectively €3,837 million and €565 million December 31, 2015).
The residual unrecognized deferred tax assets of entities included in the French tax consolidation group, calculated at the 34.43% tax rate applicable at December 31, 2016, amounted to €2,585 million at December 31, 2016 (€2,607 million at December 31, 2015). They are tax losses that can be carried forward indefinitely to set against future taxable income up to a limit of 50% of that income. €331 million of these unrecognized assets were generated by items booked through shareholders’ equity (effects of the partial hedge of the investment in Nissan), and €2,254 million were generated by items affecting the income statement (respectively €684 million and €1,923 million at December 31, 2015).
Excluding the French tax consolidation group, unrecognized deferred tax assets totalled €1,141 million at December 31, 2016, consisting of all the tax losses of AVTOVAZ and €799 million of other entities’ tax losses (€601 million in 2015), essentially tax loss carryforwards generated by the Group in Brazil, and to a lesser extent in India.
C3 – Breakdown of tax losses by expiry date
Unrecognized loss carryforwards represent a potential tax saving of €3,503 million at December 31, 2016.
(€ million) 2016
Recognized Unrecognized Total
Tax losses that can be carried forward indefinitely (1) 1,237 3,090 4,327
Tax losses expiring in more than 5 years 4 54 58
Tax losses expiring in between 1 and 5 years 1 17 18
Tax losses expiring within 1 year - - -
Total tax losses excluding AVTOVAZ 1,242 3,161 4,403
Tax losses of AVTOVAZ that can be carried forward indefinitely (2) - 342 342
Total tax losses of AVTOVAZ - 342 342
Total tax losses of the Group 1,242 3,503 4,745
(1) Including recognized and unrecognized net deferred tax assets of entities included in the French tax consolidation group calculated at the 34.43% tax rate applicable at December 31, 2016, which amount to €1,160 million and €2,585 million respectively at December 31, 2016 (note 8-C2).
(2) Following adoption of Russian federal law 401-FZ of November 30, 2016, tax losses can be carried forward indefinitely.
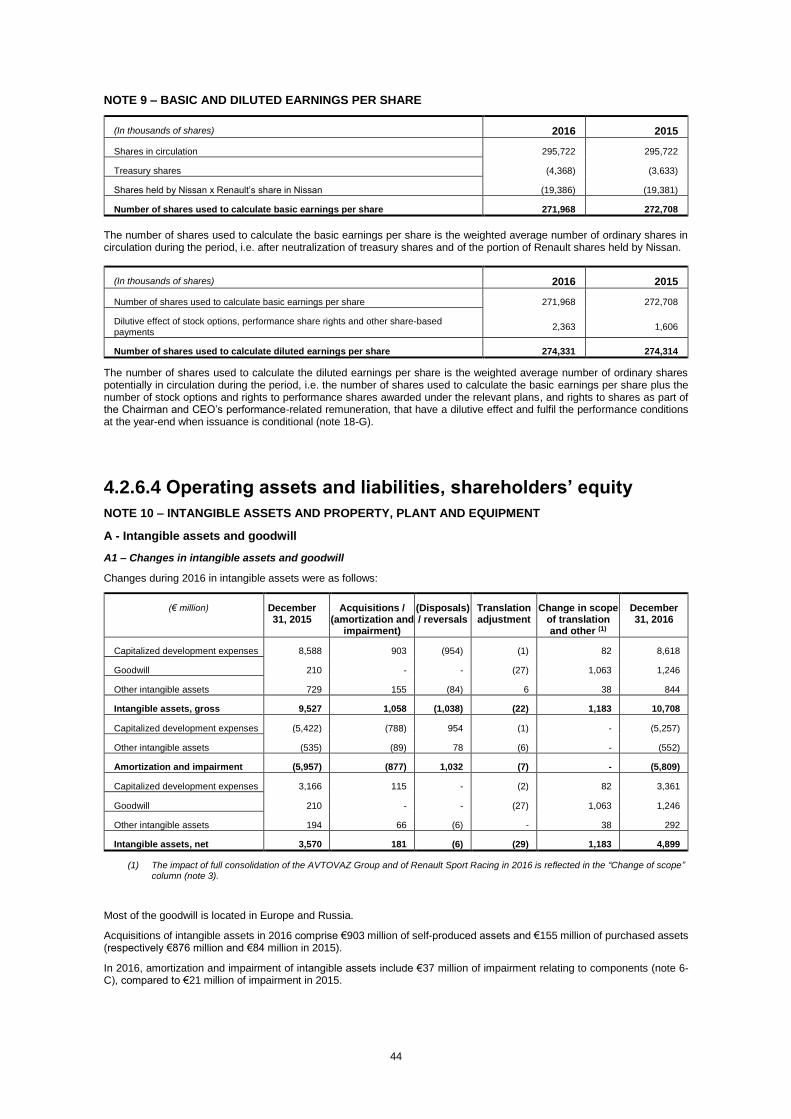
44
NOTE 9 – BASIC AND DILUTED EARNINGS PER SHARE
(In thousands of shares) 2016 2015
Shares in circulation 295,722 295,722
Treasury shares (4,368) (3,633)
Shares held by Nissan x Renault’s share in Nissan (19,386) (19,381)
Number of shares used to calculate basic earnings per share 271,968 272,708
The number of shares used to calculate the basic earnings per share is the weighted average number of ordinary shares in circulation during the period, i.e. after neutralization of treasury shares and of the portion of Renault shares held by Nissan.
(In thousands of shares) 2016 2015
Number of shares used to calculate basic earnings per share 271,968 272,708
Dilutive effect of stock options, performance share rights and other share-based
payments 2,363 1,606
Number of shares used to calculate diluted earnings per share 274,331 274,314
The number of shares used to calculate the diluted earnings per share is the weighted average number of ordinary shares potentially in circulation during the period, i.e. the number of shares used to calculate the basic earnings per share plus the number of stock options and rights to performance shares awarded under the relevant plans, and rights to shares as part of the Chairman and CEO’s performance-related remuneration, that have a dilutive effect and fulfil the performance conditions at the year-end when issuance is conditional (note 18-G).
4.2.6.4 Operating assets and liabilities, shareholders’ equity
NOTE 10 – INTANGIBLE ASSETS AND PROPERTY, PLANT AND EQUIPMENT
A - Intangible assets and goodwill
A1 – Changes in intangible assets and goodwill
Changes during 2016 in intangible assets were as follows:
(€ million) December 31, 2015
Acquisitions / (amortization and
impairment)
(Disposals) / reversals
Translation adjustment
Change in scope of translation and other (1)
December 31, 2016
Capitalized development expenses 8,588 903 (954) (1) 82 8,618
Goodwill 210 - - (27) 1,063 1,246
Other intangible assets 729 155 (84) 6 38 844
Intangible assets, gross 9,527 1,058 (1,038) (22) 1,183 10,708
Capitalized development expenses (5,422) (788) 954 (1) - (5,257)
Other intangible assets (535) (89) 78 (6) - (552)
Amortization and impairment (5,957) (877) 1,032 (7) - (5,809)
Capitalized development expenses 3,166 115 - (2) 82 3,361
Goodwill 210 - - (27) 1,063 1,246
Other intangible assets 194 66 (6) - 38 292
Intangible assets, net 3,570 181 (6) (29) 1,183 4,899
(1) The impact of full consolidation of the AVTOVAZ Group and of Renault Sport Racing in 2016 is reflected in the “Change of scope” column (note 3).
Most of the goodwill is located in Europe and Russia.
Acquisitions of intangible assets in 2016 comprise €903 million of self-produced assets and €155 million of purchased assets (respectively €876 million and €84 million in 2015).
In 2016, amortization and impairment of intangible assets include €37 million of impairment relating to components (note 6-C), compared to €21 million of impairment in 2015.

45
Changes during 2015 in intangible assets were as follows:
(€ million) Gross value Amortization and impairment
Net value
Value at December 31, 2014 10,002 (6,559) 3,443
Acquisitions (note 26-C)/(amortization) 956 (812) 144
(Disposals)/reversals (1,427) 1,415 (12)
Translation adjustment (6) 1 (5)
Change in scope of consolidation and other 2 (2) -
Value at December 31, 2015 9,527 (5,957) 3,570
A2 - Research and development expenses included in income
(€ million) 2016 2015 restated (1)
Research and development expenses (2,530) (2,212)
Capitalized development expenses 903 874
Amortization of capitalized development expenses (743) (706)
Total included in income (2,370) (2,044)
(1) The change in presentation concerning income taxes, and the resulting reclassifications in the 2015 financial statements, are presented in notes 2-A2 and 2-A3.
Research and development expenses are reported net of research tax credits for the vehicle development activity.

46
B – Property, plant and equipment
Changes during 2016 in property, plant and equipment were as follows:
(€ million) December 31, 2015
Acquisitions / (depreciation
and impairment)
(Disposals)/ reversals
Translation adjustments
Change in scope of
consolidation and other (1)
December 31, 2016
Land 563 8 (4) (3) 37 601
Buildings 6,077 157 (45) 85 265 6,539
Specific tools 14,939 1,210 (319) 173 167 16,170
Machinery and other tools 10,626 656 (260) 162 220 11,404
Fixed assets leased to customers 2,304 1,063 (556) (33) - 2,778
Other tangibles 789 69 (38) 7 19 846
Construction in progress (2) 1,254 110 (7) 26 12 1,395
Gross values 36,552 3,273 (1,229) 417 720 39,733
Land - - - - - -
Buildings (3,679) (236) 39 (27) (10) (3,913)
Specific tools (12,345) (918) 322 (111) (21) (13,073)
Machinery and other tools (8,089) (536) 249 (95) 22 (8,449)
Fixed assets leased to customers (607) (255) 200 5 - (657)
Other tangibles (661) (18) 34 (6) (2) (653)
Construction in progress - - - - - -
Depreciation and impairment (3) (25,381) (1,963) 844 (234) (11) (26,745)
Land 563 8 (4) (3) 37 601
Buildings 2,398 (79) (6) 58 255 2,626
Specific tools 2,594 292 3 62 146 3,097
Machinery and other tools 2,537 120 (11) 67 242 2,955
Fixed assets leased to customers 1,697 808 (356) (28) - 2,121
Other tangibles 128 51 (4) 1 17 193
Construction in progress (2) 1,254 110 (7) 26 12 1,395
Net values 11,171 1,310 (385) 183 709 12,988
(1) The impact of full consolidation of the AVTOVAZ Group, the two Renault Sport Racing entities and the Australian subsidiary Vehicle Distributors Australia (VDA) in 2016 is reflected in the “Change of scope” column (note 3).
(2) Items classified as “construction in progress” are transferred to completed asset categories via the “acquisitions / (depreciation and impairment” column.
(3) Depreciation and impairment in 2016 include impairment of €37 million, mainly on components (note 6-C), compared to €32 million of impairment in 2015 (related to vehicles and components).
Changes during 2015 in property, plant and equipment were as follows:
(€ million) Gross value Depreciation and
impairment
Net value
Value at December 31, 2014 35,495 (24,694) 10,801
Acquisitions/(depreciation and impairment) 2,876 (1,916) 960
(Disposals)/reversals (1,353) 933 (420)
Translation adjustments (480) 261 (219)
Change in scope of consolidation and other 14 35 49
Value at December 31, 2015 36,552 (25,381) 11,171
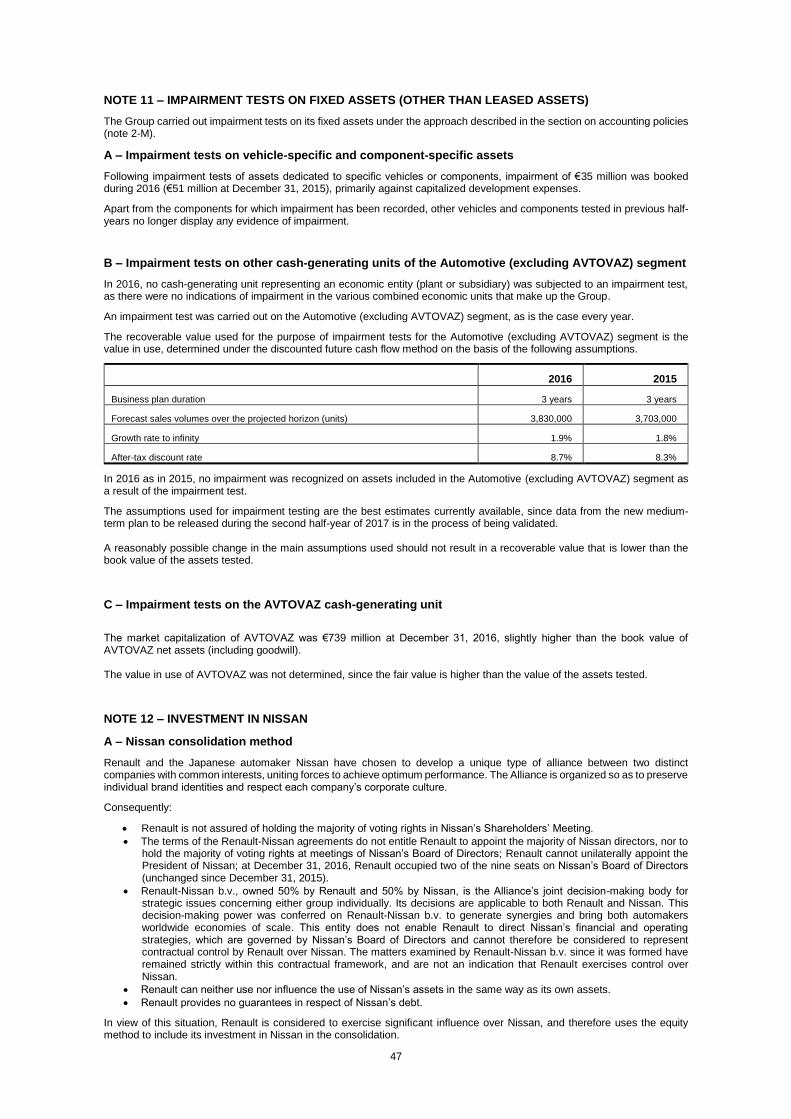
47
NOTE 11 – IMPAIRMENT TESTS ON FIXED ASSETS (OTHER THAN LEASED ASSETS)
The Group carried out impairment tests on its fixed assets under the approach described in the section on accounting policies (note 2-M).
A – Impairment tests on vehicle-specific and component-specific assets
Following impairment tests of assets dedicated to specific vehicles or components, impairment of €35 million was booked during 2016 (€51 million at December 31, 2015), primarily against capitalized development expenses.
Apart from the components for which impairment has been recorded, other vehicles and components tested in previous half-years no longer display any evidence of impairment.
B – Impairment tests on other cash-generating units of the Automotive (excluding AVTOVAZ) segment
In 2016, no cash-generating unit representing an economic entity (plant or subsidiary) was subjected to an impairment test, as there were no indications of impairment in the various combined economic units that make up the Group.
An impairment test was carried out on the Automotive (excluding AVTOVAZ) segment, as is the case every year.
The recoverable value used for the purpose of impairment tests for the Automotive (excluding AVTOVAZ) segment is the value in use, determined under the discounted future cash flow method on the basis of the following assumptions.
2016 2015
Business plan duration 3 years 3 years
Forecast sales volumes over the projected horizon (units) 3,830,000 3,703,000
Growth rate to infinity 1.9% 1.8%
After-tax discount rate 8.7% 8.3%
In 2016 as in 2015, no impairment was recognized on assets included in the Automotive (excluding AVTOVAZ) segment as a result of the impairment test.
The assumptions used for impairment testing are the best estimates currently available, since data from the new medium-term plan to be released during the second half-year of 2017 is in the process of being validated. A reasonably possible change in the main assumptions used should not result in a recoverable value that is lower than the book value of the assets tested.
C – Impairment tests on the AVTOVAZ cash-generating unit
The market capitalization of AVTOVAZ was €739 million at December 31, 2016, slightly higher than the book value of AVTOVAZ net assets (including goodwill). The value in use of AVTOVAZ was not determined, since the fair value is higher than the value of the assets tested.
NOTE 12 – INVESTMENT IN NISSAN
A – Nissan consolidation method
Renault and the Japanese automaker Nissan have chosen to develop a unique type of alliance between two distinct companies with common interests, uniting forces to achieve optimum performance. The Alliance is organized so as to preserve individual brand identities and respect each company’s corporate culture.
Consequently:
Renault is not assured of holding the majority of voting rights in Nissan’s Shareholders’ Meeting.
The terms of the Renault-Nissan agreements do not entitle Renault to appoint the majority of Nissan directors, nor to hold the majority of voting rights at meetings of Nissan’s Board of Directors; Renault cannot unilaterally appoint the President of Nissan; at December 31, 2016, Renault occupied two of the nine seats on Nissan’s Board of Directors (unchanged since December 31, 2015).
Renault-Nissan b.v., owned 50% by Renault and 50% by Nissan, is the Alliance’s joint decision-making body for strategic issues concerning either group individually. Its decisions are applicable to both Renault and Nissan. This decision-making power was conferred on Renault-Nissan b.v. to generate synergies and bring both automakers worldwide economies of scale. This entity does not enable Renault to direct Nissan’s financial and operating strategies, which are governed by Nissan’s Board of Directors and cannot therefore be considered to represent contractual control by Renault over Nissan. The matters examined by Renault-Nissan b.v. since it was formed have remained strictly within this contractual framework, and are not an indication that Renault exercises control over Nissan.
Renault can neither use nor influence the use of Nissan’s assets in the same way as its own assets.
Renault provides no guarantees in respect of Nissan’s debt.
In view of this situation, Renault is considered to exercise significant influence over Nissan, and therefore uses the equity method to include its investment in Nissan in the consolidation.
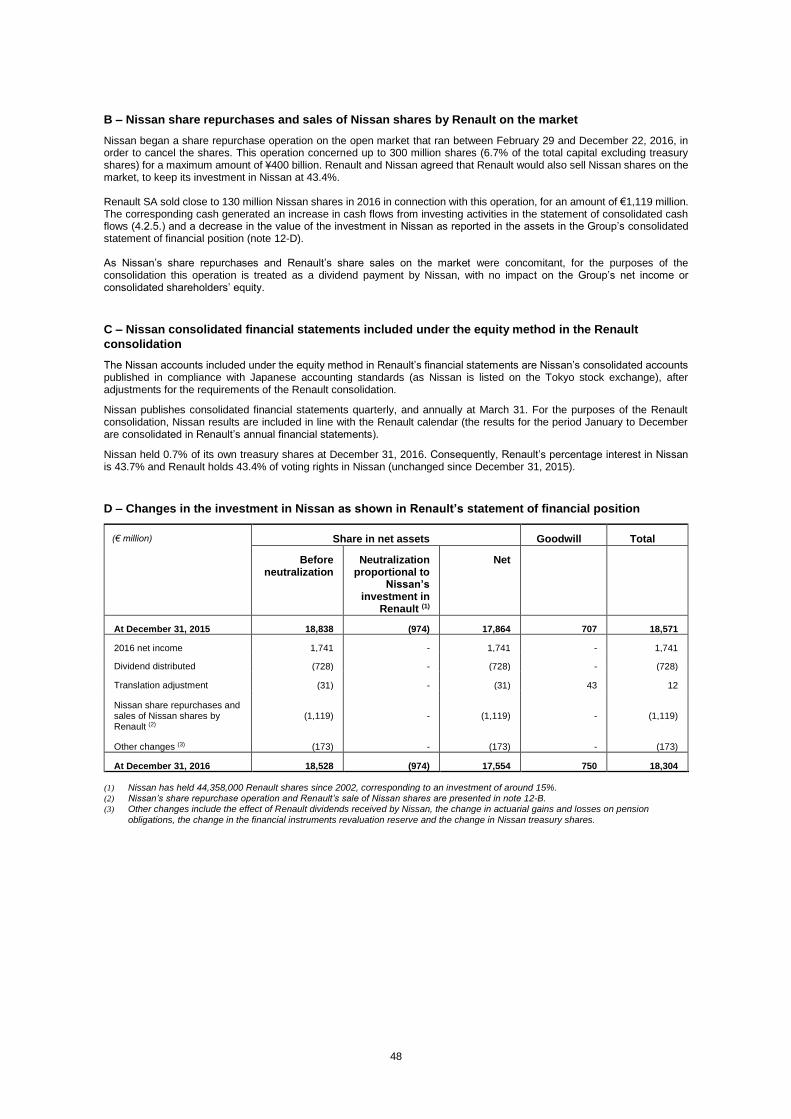
48
B – Nissan share repurchases and sales of Nissan shares by Renault on the market
Nissan began a share repurchase operation on the open market that ran between February 29 and December 22, 2016, in order to cancel the shares. This operation concerned up to 300 million shares (6.7% of the total capital excluding treasury shares) for a maximum amount of ¥400 billion. Renault and Nissan agreed that Renault would also sell Nissan shares on the market, to keep its investment in Nissan at 43.4%. Renault SA sold close to 130 million Nissan shares in 2016 in connection with this operation, for an amount of €1,119 million. The corresponding cash generated an increase in cash flows from investing activities in the statement of consolidated cash flows (4.2.5.) and a decrease in the value of the investment in Nissan as reported in the assets in the Group’s consolidated statement of financial position (note 12-D). As Nissan’s share repurchases and Renault’s share sales on the market were concomitant, for the purposes of the consolidation this operation is treated as a dividend payment by Nissan, with no impact on the Group’s net income or consolidated shareholders’ equity.
C – Nissan consolidated financial statements included under the equity method in the Renault
consolidation
The Nissan accounts included under the equity method in Renault’s financial statements are Nissan’s consolidated accounts published in compliance with Japanese accounting standards (as Nissan is listed on the Tokyo stock exchange), after adjustments for the requirements of the Renault consolidation.
Nissan publishes consolidated financial statements quarterly, and annually at March 31. For the purposes of the Renault consolidation, Nissan results are included in line with the Renault calendar (the results for the period January to December are consolidated in Renault’s annual financial statements).
Nissan held 0.7% of its own treasury shares at December 31, 2016. Consequently, Renault’s percentage interest in Nissan is 43.7% and Renault holds 43.4% of voting rights in Nissan (unchanged since December 31, 2015).
D – Changes in the investment in Nissan as shown in Renault’s statement of financial position
(€ million) Share in net assets Goodwill Total
Before neutralization
Neutralization proportional to
Nissan’s investment in
Renault (1)
Net
At December 31, 2015 18,838 (974) 17,864 707 18,571
2016 net income 1,741 - 1,741 - 1,741
Dividend distributed
(728) - (728) - (728)
Translation adjustment (31) - (31) 43 12
Nissan share repurchases and sales of Nissan shares by Renault (2)
(1,119) - (1,119) - (1,119)
Other changes (3) (173) - (173) - (173)
At December 31, 2016 18,528 (974) 17,554 750 18,304
(1) Nissan has held 44,358,000 Renault shares since 2002, corresponding to an investment of around 15%. (2) Nissan’s share repurchase operation and Renault’s sale of Nissan shares are presented in note 12-B. (3) Other changes include the effect of Renault dividends received by Nissan, the change in actuarial gains and losses on pension
obligations, the change in the financial instruments revaluation reserve and the change in Nissan treasury shares.

49
E – Changes in Nissan equity restated for the purposes of the Renault consolidation
December 31, 2015
2016 net income
Dividends Translation adjustment
Nissan share
repurchases and sales of
Nissan shares by Renault (1)
Other changes
(2)
December 31, 2016
(¥ billion)
Shareholders' equity – Parent-company shareholders’ share under Japanese GAAP 4,935 485 (183) (355) (306) (97) 4,479
Restatements for compliance with IFRS:
Provision for pension and other long-term employee benefit obligations (28) (21) (2) 77 26
Capitalization of development expenses
628 42 (2) 668
Deferred taxes and other restatements
(103) 1 (19) (25) (146)
Net assets restated for compliance with IFRS 5,432 507 (183) (378) (306) (45) 5,027
Restatements for Renault Group requirements (3) 219 (32) (13) 36 (6) 204
Net assets restated for Renault Group requirements 5,651 475 (196) (342) (306) (51) 5,231
(€ million)
Net assets restated for Renault Group requirements 43,117 3,984 (1,666) (71) (2,582) (394) 42,388
Renault’s percentage interest 43.7% 43.7%
Renault's share (before neutralization effect described below) 18,838 1,741 (728) (31) (1,119) (173) 18,528
Neutralization of Nissan’s investment in Renault (4) (974) (974)
Renault's share in the net assets of Nissan 17,864 1,741 (728) (31) (1,119) (173) 17,554
(1) Nissan’s share repurchase operation and Renault’s sale of Nissan shares are presented in note 12-B.
(2) Other changes include the effect of Renault dividends received by Nissan, the change in actuarial gains and losses on pension obligations, the change in the financial instruments revaluation reserve and the change in Nissan treasury shares.
(3) Restatements for Renault Group requirements essentially correspond to revaluation of fixed assets by Renault for the acquisitions undertaken between 1999 and 2002, and elimination of Nissan’s investment in Renault accounted for under the equity method.
(4) Nissan has held 44,358 thousand Renault shares in Renault since 2002, an ownership interest of about 15%.
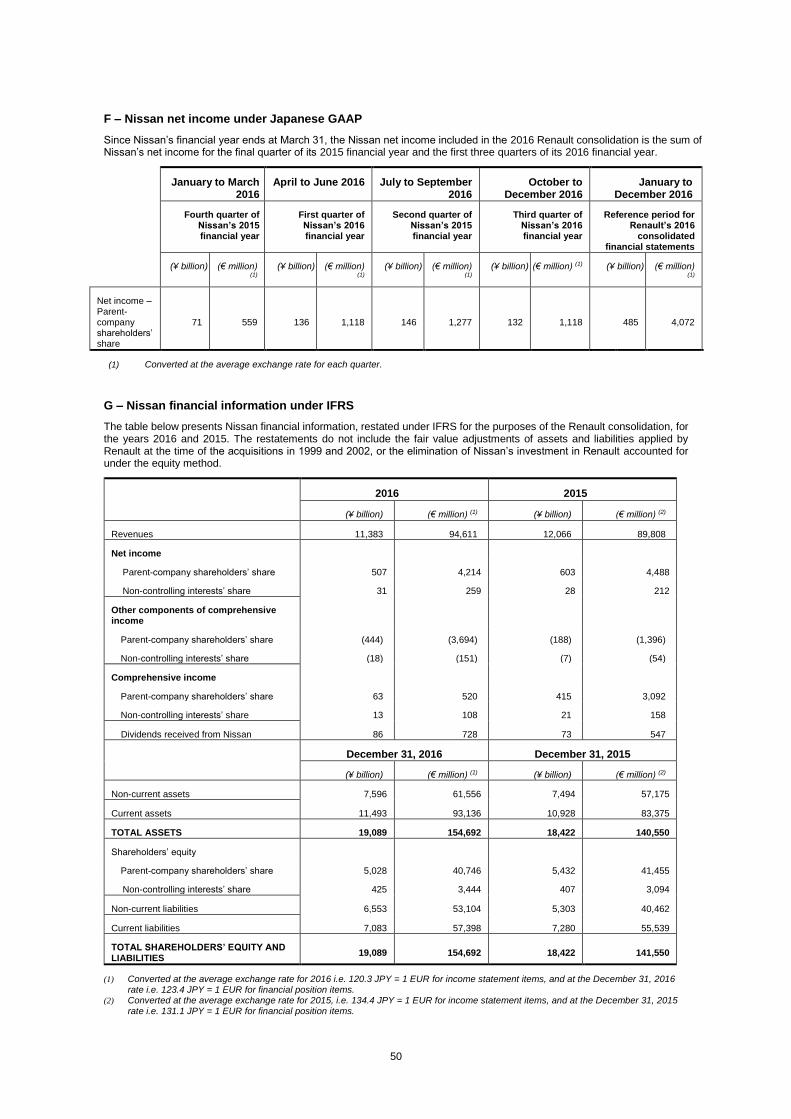
50
F – Nissan net income under Japanese GAAP
Since Nissan’s financial year ends at March 31, the Nissan net income included in the 2016 Renault consolidation is the sum of Nissan’s net income for the final quarter of its 2015 financial year and the first three quarters of its 2016 financial year.
January to March 2016
April to June 2016 July to September 2016
October to December 2016
January to December 2016
Fourth quarter of Nissan’s 2015 financial year
First quarter of Nissan’s 2016 financial year
Second quarter of Nissan’s 2015 financial year
Third quarter of Nissan’s 2016 financial year
Reference period for Renault’s 2016
consolidated financial statements
(¥ billion) (€ million) (1)
(¥ billion) (€ million) (1)
(¥ billion) (€ million) (1)
(¥ billion) (€ million) (1) (¥ billion) (€ million) (1)
Net income – Parent-company shareholders’ share
71 559 136 1,118 146 1,277 132 1,118 485 4,072
(1) Converted at the average exchange rate for each quarter.
G – Nissan financial information under IFRS
The table below presents Nissan financial information, restated under IFRS for the purposes of the Renault consolidation, for the years 2016 and 2015. The restatements do not include the fair value adjustments of assets and liabilities applied by Renault at the time of the acquisitions in 1999 and 2002, or the elimination of Nissan’s investment in Renault accounted for under the equity method.
2016 2015
(¥ billion) (€ million) (1) (¥ billion) (€ million) (2)
Revenues 11,383 94,611 12,066 89,808
Net income
Parent-company shareholders’ share 507 4,214 603 4,488
Non-controlling interests’ share 31 259 28 212
Other components of comprehensive income
Parent-company shareholders’ share (444) (3,694) (188) (1,396)
Non-controlling interests’ share (18) (151) (7) (54)
Comprehensive income
Parent-company shareholders’ share 63 520 415 3,092
Non-controlling interests’ share 13 108 21 158
Dividends received from Nissan 86 728 73 547
December 31, 2016 December 31, 2015
(¥ billion) (€ million) (1) (¥ billion) (€ million) (2)
Non-current assets 7,596 61,556 7,494 57,175
Current assets 11,493 93,136 10,928 83,375
TOTAL ASSETS 19,089 154,692 18,422 140,550
Shareholders’ equity
Parent-company shareholders’ share 5,028 40,746 5,432 41,455
Non-controlling interests’ share 425 3,444 407 3,094
Non-current liabilities 6,553 53,104 5,303 40,462
Current liabilities 7,083 57,398 7,280 55,539
TOTAL SHAREHOLDERS’ EQUITY AND LIABILITIES
19,089 154,692 18,422 141,550
(1) Converted at the average exchange rate for 2016 i.e. 120.3 JPY = 1 EUR for income statement items, and at the December 31, 2016 rate i.e. 123.4 JPY = 1 EUR for financial position items.
(2) Converted at the average exchange rate for 2015, i.e. 134.4 JPY = 1 EUR for income statement items, and at the December 31, 2015 rate i.e. 131.1 JPY = 1 EUR for financial position items.
51
H – Hedging of the investment in Nissan
The Group has partially hedged the Yen/Euro exchange risk on its investment in Nissan since 1999.
At December 31, 2016, the corresponding hedging operations totalled ¥156 billion (€1,264 million), comprising ¥17 billion (€138 million) of private placements on the EMTN market and ¥139 billion (€1,126 million) in bonds issued directly in yen on the Japanese Samurai bond market.
During 2016, these operations generated unfavourable foreign exchange differences of €70 million (unfavourable difference of €103 million in 2015). The net favourable effect of €134 million after deferred taxes is recorded in the Group’s translation adjustment reserve (note 18-E).
I – Valuation of Renault’s investment in Nissan at stock market prices
Based on the quoted price at December 31, 2016 of ¥1,175.5 per share, Renault’s investment in Nissan is valued at €17,450 million (€19,153 million at December 31, 2015 based on the price of ¥1,279.5 per share).
J – Impairment test of the investment in Nissan
At December 31, 2016, the stock market value of the investment was 4.7% lower than the value of Nissan in Renault’s statement of financial position, whereas it was higher at December 31, 2015.
In application of the approach presented in the note on accounting policies (note 2-M), an impairment test was carried out at December 31, 2016. An after-tax discount rate of 7.5% and a growth rate to infinity of 2.7% were used to calculate value in use. The terminal value was calculated under profitability assumptions consistent with Nissan’s past data and balanced medium-term prospects.
The test results did not lead to recognition of any impairment on the investment in Nissan at December 31, 2016.
A reasonably possible change in the main assumptions used should not result in a recoverable value that is lower than the book value of the investment in Nissan.
K – Operations between the Renault Group and the Nissan group
K1 – Automotive (excluding AVTOVAZ) and Sales Financing
Renault and Nissan follow joint strategies for vehicle and component development, purchasing, production and distribution resources. On April 1, 2014 the two companies also launched a project to converge four key functions: Engineering, Manufacturing and Supply Chain Management, Purchasing and Human Resources. This cooperation is reflected in synergies that reduce costs, particularly in the support functions and sales to Nissan.
The Automotive (excluding AVTOVAZ) segment is involved in operations with Nissan on two levels:
Industrial production: cross-over production of vehicles and components in the Alliance’s manufacturing plants: - Sales by the Renault Group to the Nissan group in 2016 totalled approximately €4,105 million (€3,650 million in
2015), comprising around €2,465 million for vehicles (€2,100 million in 2015), €1,580 million for components (€1,500 million in 2015), and €60 million for services (€50 million in 2015). The increase is mainly driven by sales of vehicles made by Renault Samsung Motors for Nissan North America.
- Purchases by the Renault Group from the Nissan group in 2016 totalled approximately €2,115 million (€1,300 million in 2015), comprising around €1,170 million of vehicles (€750 million in 2015), €795 million of components (€450 million in 2015), and €150 million of services (€100 million in 2015).
- The balance of Renault Group receivables on the Nissan group is €430 million at December 31, 2016 (€344 million at December 31, 2015) and the balance of Renault Group liabilities to the Nissan group is €647 million at December 31, 2016 (€512 million at December 31, 2015).
Finance: In addition to its activity for Renault, Renault Finance acts as the Nissan group’s counterparty in financial instruments trading to hedge foreign exchange, interest rate and commodity risks. Renault Finance undertook approximately €19.7 billion of forex transactions on the foreign exchange market for Nissan in 2016 (€19.7 billion in 2015). Operations undertaken with Nissan on foreign exchange, interest rate and commodity derivatives are recorded at market price and included in the positions managed by Renault Finance. In the balance sheet, the derivative assets on the Nissan group amount to €70 million at December 31, 2016 (€225 million at December 31, 2015) and derivative liabilities amount to €74 million at December 31, 2016 (€76 million at December 31, 2015).
Renault’s Sales Financing segment helps to attract customers and build loyalty to Nissan brands through a range of financing products and services incorporated into the sales policy, principally in Europe. In 2016, RCI Banque recorded €134 million of service revenues in the form of commission and interest received from Nissan (€147 million at December 31, 2015). The balance of Sales financing receivables on the Nissan group is €78 million at December 31, 2016 (€69 million at December 31, 2015) and the balance of liabilities is €210 million at December 31, 2016 (€193 million at December 31, 2015)
The Alliance partners hold investments in associates and joint ventures that manage their cooperation. Details of these entities’ activity and location, and the Renault Group’s influence over them, are given in note 13.
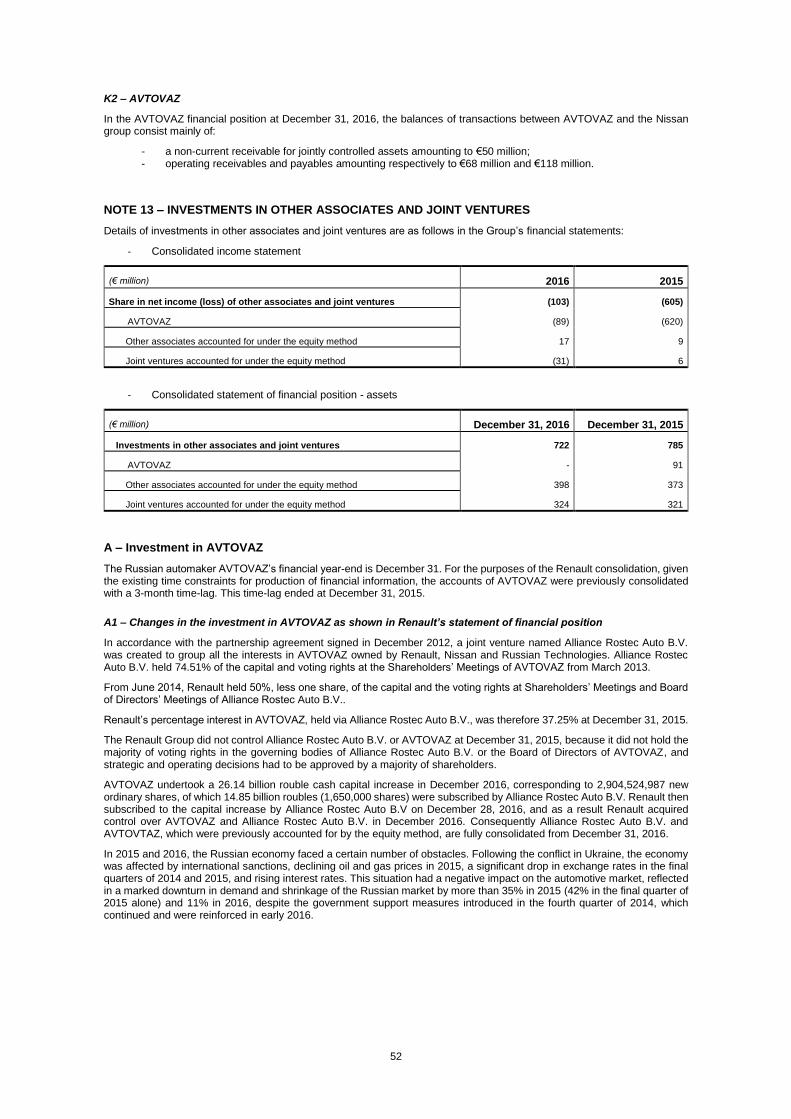
52
K2 – AVTOVAZ
In the AVTOVAZ financial position at December 31, 2016, the balances of transactions between AVTOVAZ and the Nissan group consist mainly of:
- a non-current receivable for jointly controlled assets amounting to €50 million; - operating receivables and payables amounting respectively to €68 million and €118 million.
NOTE 13 – INVESTMENTS IN OTHER ASSOCIATES AND JOINT VENTURES
Details of investments in other associates and joint ventures are as follows in the Group’s financial statements:
- Consolidated income statement
(€ million) 2016 2015
Share in net income (loss) of other associates and joint ventures (103) (605)
AVTOVAZ (89) (620)
Other associates accounted for under the equity method 17 9
Joint ventures accounted for under the equity method (31) 6
- Consolidated statement of financial position - assets
(€ million) December 31, 2016 December 31, 2015
Investments in other associates and joint ventures 722 785
AVTOVAZ - 91
Other associates accounted for under the equity method 398 373
Joint ventures accounted for under the equity method 324 321
A – Investment in AVTOVAZ
The Russian automaker AVTOVAZ’s financial year-end is December 31. For the purposes of the Renault consolidation, given the existing time constraints for production of financial information, the accounts of AVTOVAZ were previously consolidated with a 3-month time-lag. This time-lag ended at December 31, 2015.
A1 – Changes in the investment in AVTOVAZ as shown in Renault’s statement of financial position
In accordance with the partnership agreement signed in December 2012, a joint venture named Alliance Rostec Auto B.V. was created to group all the interests in AVTOVAZ owned by Renault, Nissan and Russian Technologies. Alliance Rostec Auto B.V. held 74.51% of the capital and voting rights at the Shareholders’ Meetings of AVTOVAZ from March 2013.
From June 2014, Renault held 50%, less one share, of the capital and the voting rights at Shareholders’ Meetings and Board of Directors’ Meetings of Alliance Rostec Auto B.V..
Renault’s percentage interest in AVTOVAZ, held via Alliance Rostec Auto B.V., was therefore 37.25% at December 31, 2015.
The Renault Group did not control Alliance Rostec Auto B.V. or AVTOVAZ at December 31, 2015, because it did not hold the majority of voting rights in the governing bodies of Alliance Rostec Auto B.V. or the Board of Directors of AVTOVAZ, and strategic and operating decisions had to be approved by a majority of shareholders.
AVTOVAZ undertook a 26.14 billion rouble cash capital increase in December 2016, corresponding to 2,904,524,987 new ordinary shares, of which 14.85 billion roubles (1,650,000 shares) were subscribed by Alliance Rostec Auto B.V. Renault then subscribed to the capital increase by Alliance Rostec Auto B.V on December 28, 2016, and as a result Renault acquired control over AVTOVAZ and Alliance Rostec Auto B.V. in December 2016. Consequently Alliance Rostec Auto B.V. and AVTOVTAZ, which were previously accounted for by the equity method, are fully consolidated from December 31, 2016.
In 2015 and 2016, the Russian economy faced a certain number of obstacles. Following the conflict in Ukraine, the economy was affected by international sanctions, declining oil and gas prices in 2015, a significant drop in exchange rates in the final quarters of 2014 and 2015, and rising interest rates. This situation had a negative impact on the automotive market, reflected in a marked downturn in demand and shrinkage of the Russian market by more than 35% in 2015 (42% in the final quarter of 2015 alone) and 11% in 2016, despite the government support measures introduced in the fourth quarter of 2014, which continued and were reinforced in early 2016.
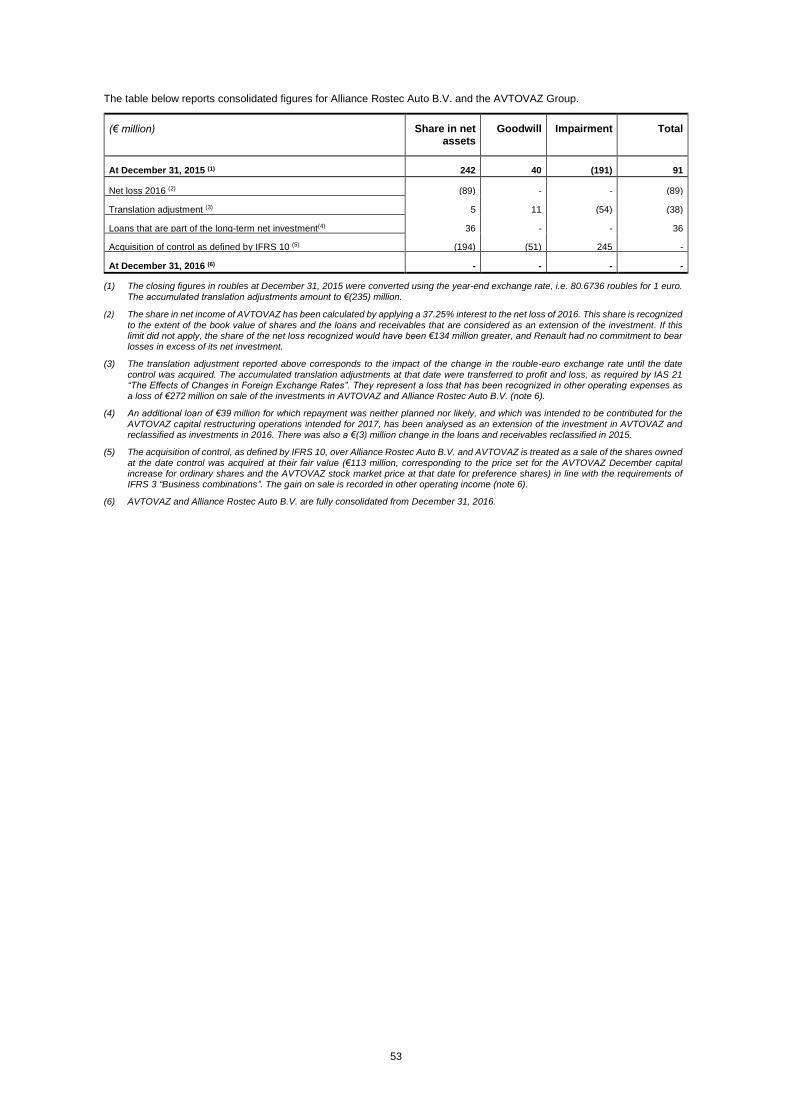
53
The table below reports consolidated figures for Alliance Rostec Auto B.V. and the AVTOVAZ Group.
(€ million) Share in net assets
Goodwill Impairment Total
At December 31, 2015 (1) 242 40 (191) 91
Net loss 2016 (2) (89) - - (89)
Translation adjustment (3)
5 11 (54) (38)
Loans that are part of the long-term net investment(4) 36 - - 36
Acquisition of control as defined by IFRS 10 (5)
(194) (51) 245 -
At December 31, 2016 (6) - - - -
(1) The closing figures in roubles at December 31, 2015 were converted using the year-end exchange rate, i.e. 80.6736 roubles for 1 euro.
The accumulated translation adjustments amount to €(235) million.
(2) The share in net income of AVTOVAZ has been calculated by applying a 37.25% interest to the net loss of 2016. This share is recognized
to the extent of the book value of shares and the loans and receivables that are considered as an extension of the investment. If this limit did not apply, the share of the net loss recognized would have been €134 million greater, and Renault had no commitment to bear losses in excess of its net investment.
(3) The translation adjustment reported above corresponds to the impact of the change in the rouble-euro exchange rate until the date
control was acquired. The accumulated translation adjustments at that date were transferred to profit and loss, as required by IAS 21 “The Effects of Changes in Foreign Exchange Rates”. They represent a loss that has been recognized in other operating expenses as a loss of €272 million on sale of the investments in AVTOVAZ and Alliance Rostec Auto B.V. (note 6).
(4) An additional loan of €39 million for which repayment was neither planned nor likely, and which was intended to be contributed for the
AVTOVAZ capital restructuring operations intended for 2017, has been analysed as an extension of the investment in AVTOVAZ and reclassified as investments in 2016. There was also a €(3) million change in the loans and receivables reclassified in 2015.
(5) The acquisition of control, as defined by IFRS 10, over Alliance Rostec Auto B.V. and AVTOVAZ is treated as a sale of the shares owned
at the date control was acquired at their fair value (€113 million, corresponding to the price set for the AVTOVAZ December capital increase for ordinary shares and the AVTOVAZ stock market price at that date for preference shares) in line with the requirements of IFRS 3 “Business combinations”. The gain on sale is recorded in other operating income (note 6).
(6) AVTOVAZ and Alliance Rostec Auto B.V. are fully consolidated from December 31, 2016.
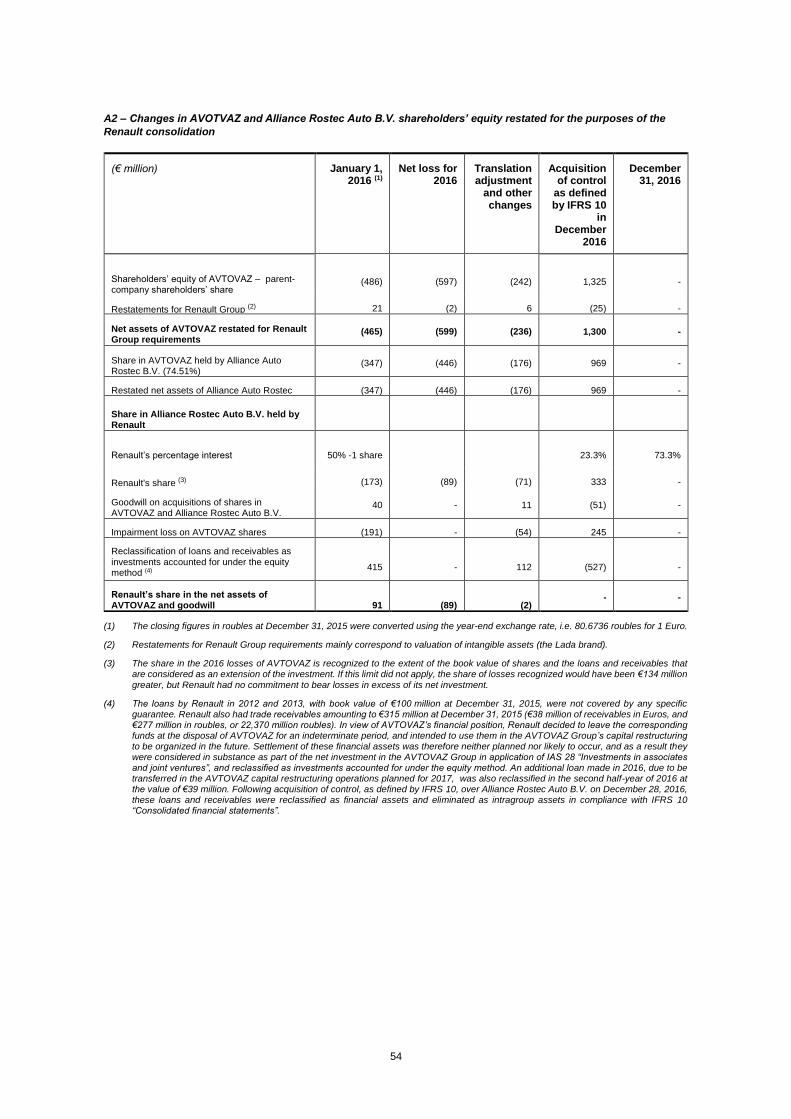
54
A2 – Changes in AVOTVAZ and Alliance Rostec Auto B.V. shareholders’ equity restated for the purposes of the
Renault consolidation
(1) The closing figures in roubles at December 31, 2015 were converted using the year-end exchange rate, i.e. 80.6736 roubles for 1 Euro.
(2) Restatements for Renault Group requirements mainly correspond to valuation of intangible assets (the Lada brand).
(3) The share in the 2016 losses of AVTOVAZ is recognized to the extent of the book value of shares and the loans and receivables that are considered as an extension of the investment. If this limit did not apply, the share of losses recognized would have been €134 million
greater, but Renault had no commitment to bear losses in excess of its net investment.
(4) The loans by Renault in 2012 and 2013, with book value of €100 million at December 31, 2015, were not covered by any specific guarantee. Renault also had trade receivables amounting to €315 million at December 31, 2015 (€38 million of receivables in Euros, and €277 million in roubles, or 22,370 million roubles). In view of AVTOVAZ’s financial position, Renault decided to leave the corresponding funds at the disposal of AVTOVAZ for an indeterminate period, and intended to use them in the AVTOVAZ Group’s capital restructuring to be organized in the future. Settlement of these financial assets was therefore neither planned nor likely to occur, and as a result they were considered in substance as part of the net investment in the AVTOVAZ Group in application of IAS 28 “Investments in associates and joint ventures”, and reclassified as investments accounted for under the equity method. An additional loan made in 2016, due to be transferred in the AVTOVAZ capital restructuring operations planned for 2017, was also reclassified in the second half-year of 2016 at the value of €39 million. Following acquisition of control, as defined by IFRS 10, over Alliance Rostec Auto B.V. on December 28, 2016, these loans and receivables were reclassified as financial assets and eliminated as intragroup assets in compliance with IFRS 10 “Consolidated financial statements”.
(€ million) January 1, 2016 (1)
Net loss for 2016
Translation adjustment
and other changes
Acquisition of control
as defined by IFRS 10
in December
2016
December 31, 2016
Shareholders’ equity of AVTOVAZ – parent-company shareholders’ share
(486) (597) (242) 1,325 -
Restatements for Renault Group (2)
requirements(2)
21 (2) 6 (25) -
Net assets of AVTOVAZ restated for Renault Group requirements
(465) (599) (236) 1,300 -
Share in AVTOVAZ held by Alliance Auto Rostec B.V. (74.51%)
(347) (446) (176) 969 -
Restated net assets of Alliance Auto Rostec B.V.
(347) (446) (176) 969 -
Share in Alliance Rostec Auto B.V. held by Renault
Renault’s percentage interest 50% -1 share 23.3% 73.3%
Renault's share (3) (173) (89) (71) 333 -
Goodwill on acquisitions of shares in AVTOVAZ and Alliance Rostec Auto B.V.
40 - 11 (51) -
Impairment loss on AVTOVAZ shares (191) - (54) 245 -
Reclassification of loans and receivables as investments accounted for under the equity method (4)
415 - 112 (527) -
Renault’s share in the net assets of AVTOVAZ and goodwill 91 (89) (2)
- -
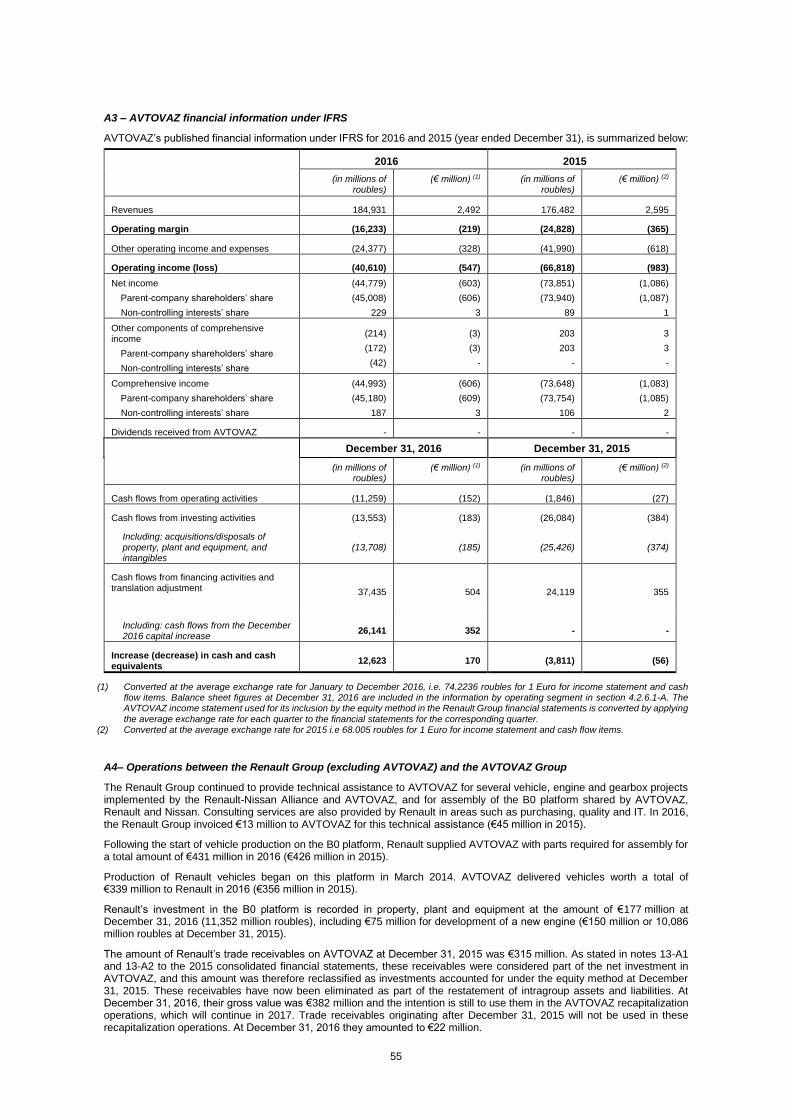
55
A3 – AVTOVAZ financial information under IFRS
AVTOVAZ’s published financial information under IFRS for 2016 and 2015 (year ended December 31), is summarized below:
2016 2015
(in millions of roubles)
(€ million) (1) (in millions of roubles)
(€ million) (2)
Revenues 184,931 2,492 176,482 2,595
Operating margin (16,233) (219) (24,828) (365)
Other operating income and expenses (24,377) (328) (41,990) (618)
Operating income (loss) (40,610) (547) (66,818) (983)
Net income
Parent-company shareholders’ share
Non-controlling interests’ share
(44,779)
(45,008)
229
(603)
(606)
3
(73,851)
(73,940)
89
(1,086)
(1,087)
1
Other components of comprehensive income
Parent-company shareholders’ share
Non-controlling interests’ share
(214)
(172)
(42)
(3)
(3)
-
203
203
-
3
3
-
Comprehensive income
Parent-company shareholders’ share
Non-controlling interests’ share
(44,993)
(45,180)
187
(606)
(609)
3
(73,648)
(73,754)
106
(1,083)
(1,085)
2
Dividends received from AVTOVAZ - - - -
December 31, 2016 December 31, 2015
(in millions of roubles)
(€ million) (1) (in millions of roubles)
(€ million) (2)
Cash flows from operating activities (11,259) (152) (1,846) (27)
Cash flows from investing activities (13,553) (183) (26,084) (384)
Including: acquisitions/disposals of property, plant and equipment, and intangibles
(13,708) (185) (25,426) (374)
Cash flows from financing activities and translation adjustment
37,435 504 24,119 355
Including: cash flows from the December 2016 capital increase
26,141 352 - -
Increase (decrease) in cash and cash equivalents
12,623 170 (3,811) (56)
(1) Converted at the average exchange rate for January to December 2016, i.e. 74.2236 roubles for 1 Euro for income statement and cash flow items. Balance sheet figures at December 31, 2016 are included in the information by operating segment in section 4.2.6.1-A. The AVTOVAZ income statement used for its inclusion by the equity method in the Renault Group financial statements is converted by applying
the average exchange rate for each quarter to the financial statements for the corresponding quarter. (2) Converted at the average exchange rate for 2015 i.e 68.005 roubles for 1 Euro for income statement and cash flow items.
A4– Operations between the Renault Group (excluding AVTOVAZ) and the AVTOVAZ Group
The Renault Group continued to provide technical assistance to AVTOVAZ for several vehicle, engine and gearbox projects implemented by the Renault-Nissan Alliance and AVTOVAZ, and for assembly of the B0 platform shared by AVTOVAZ, Renault and Nissan. Consulting services are also provided by Renault in areas such as purchasing, quality and IT. In 2016, the Renault Group invoiced €13 million to AVTOVAZ for this technical assistance (€45 million in 2015).
Following the start of vehicle production on the B0 platform, Renault supplied AVTOVAZ with parts required for assembly for a total amount of €431 million in 2016 (€426 million in 2015).
Production of Renault vehicles began on this platform in March 2014. AVTOVAZ delivered vehicles worth a total of €339 million to Renault in 2016 (€356 million in 2015).
Renault’s investment in the B0 platform is recorded in property, plant and equipment at the amount of €177 million at December 31, 2016 (11,352 million roubles), including €75 million for development of a new engine (€150 million or 10,086 million roubles at December 31, 2015).
The amount of Renault’s trade receivables on AVTOVAZ at December 31, 2015 was €315 million. As stated in notes 13-A1 and 13-A2 to the 2015 consolidated financial statements, these receivables were considered part of the net investment in AVTOVAZ, and this amount was therefore reclassified as investments accounted for under the equity method at December 31, 2015. These receivables have now been eliminated as part of the restatement of intragroup assets and liabilities. At December 31, 2016, their gross value was €382 million and the intention is still to use them in the AVTOVAZ recapitalization operations, which will continue in 2017. Trade receivables originating after December 31, 2015 will not be used in these recapitalization operations. At December 31, 2016 they amounted to €22 million.
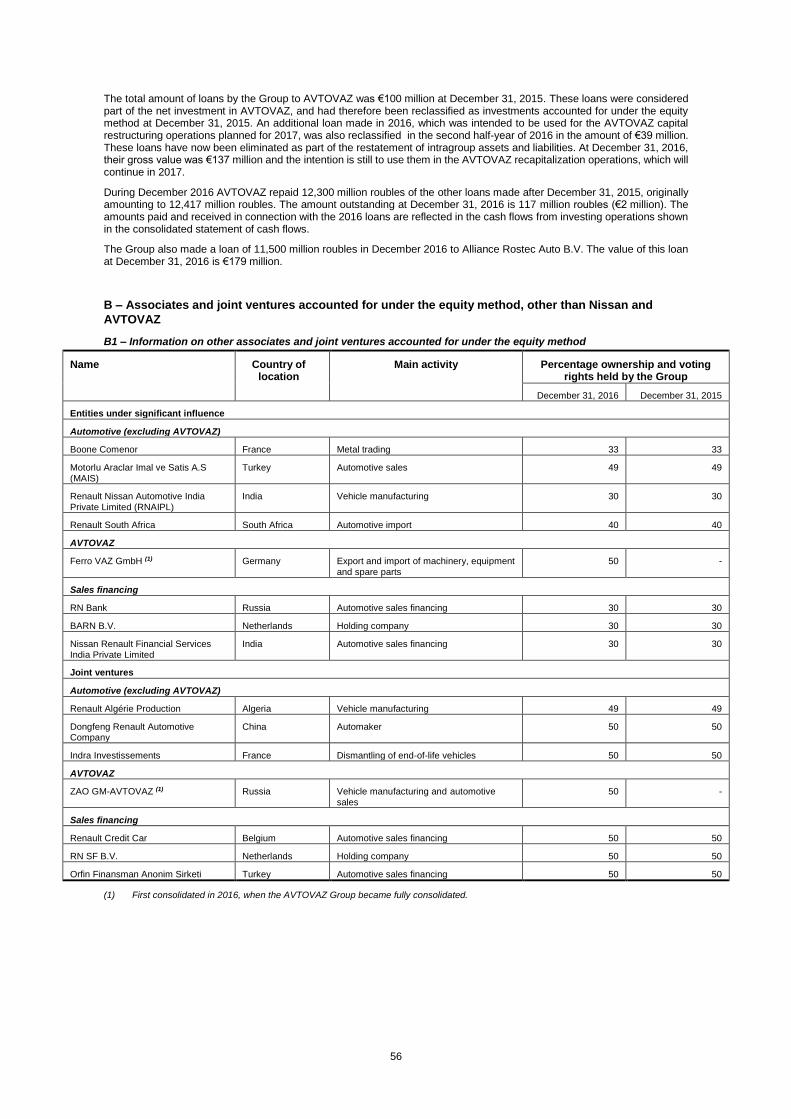
56
The total amount of loans by the Group to AVTOVAZ was €100 million at December 31, 2015. These loans were considered part of the net investment in AVTOVAZ, and had therefore been reclassified as investments accounted for under the equity method at December 31, 2015. An additional loan made in 2016, which was intended to be used for the AVTOVAZ capital restructuring operations planned for 2017, was also reclassified in the second half-year of 2016 in the amount of €39 million. These loans have now been eliminated as part of the restatement of intragroup assets and liabilities. At December 31, 2016, their gross value was €137 million and the intention is still to use them in the AVTOVAZ recapitalization operations, which will continue in 2017.
During December 2016 AVTOVAZ repaid 12,300 million roubles of the other loans made after December 31, 2015, originally amounting to 12,417 million roubles. The amount outstanding at December 31, 2016 is 117 million roubles (€2 million). The amounts paid and received in connection with the 2016 loans are reflected in the cash flows from investing operations shown in the consolidated statement of cash flows.
The Group also made a loan of 11,500 million roubles in December 2016 to Alliance Rostec Auto B.V. The value of this loan at December 31, 2016 is €179 million.
B – Associates and joint ventures accounted for under the equity method, other than Nissan and
AVTOVAZ
B1 – Information on other associates and joint ventures accounted for under the equity method
Name Country of location
Main activity Percentage ownership and voting rights held by the Group
December 31, 2016 December 31, 2015
Entities under significant influence
Automotive (excluding AVTOVAZ)
Boone Comenor France Metal trading 33 33
Motorlu Araclar Imal ve Satis A.S (MAIS)
Turkey Automotive sales 49 49
Renault Nissan Automotive India Private Limited (RNAIPL)
India Vehicle manufacturing 30 30
Renault South Africa South Africa Automotive import 40 40
AVTOVAZ
Ferro VAZ GmbH (1) Germany Export and import of machinery, equipment and spare parts
50 -
Sales financing
RN Bank Russia Automotive sales financing 30 30
BARN B.V. Netherlands Holding company 30 30
Nissan Renault Financial Services India Private Limited
India Automotive sales financing 30 30
Joint ventures
Automotive (excluding AVTOVAZ)
Renault Algérie Production Algeria Vehicle manufacturing 49 49
Dongfeng Renault Automotive Company
China Automaker 50 50
Indra Investissements France Dismantling of end-of-life vehicles 50 50
AVTOVAZ
ZAO GM-AVTOVAZ (1) Russia Vehicle manufacturing and automotive sales
50 -
Sales financing
Renault Credit Car Belgium Automotive sales financing 50 50
RN SF B.V. Netherlands Holding company 50 50
Orfin Finansman Anonim Sirketi Turkey Automotive sales financing 50 50
(1) First consolidated in 2016, when the AVTOVAZ Group became fully consolidated.
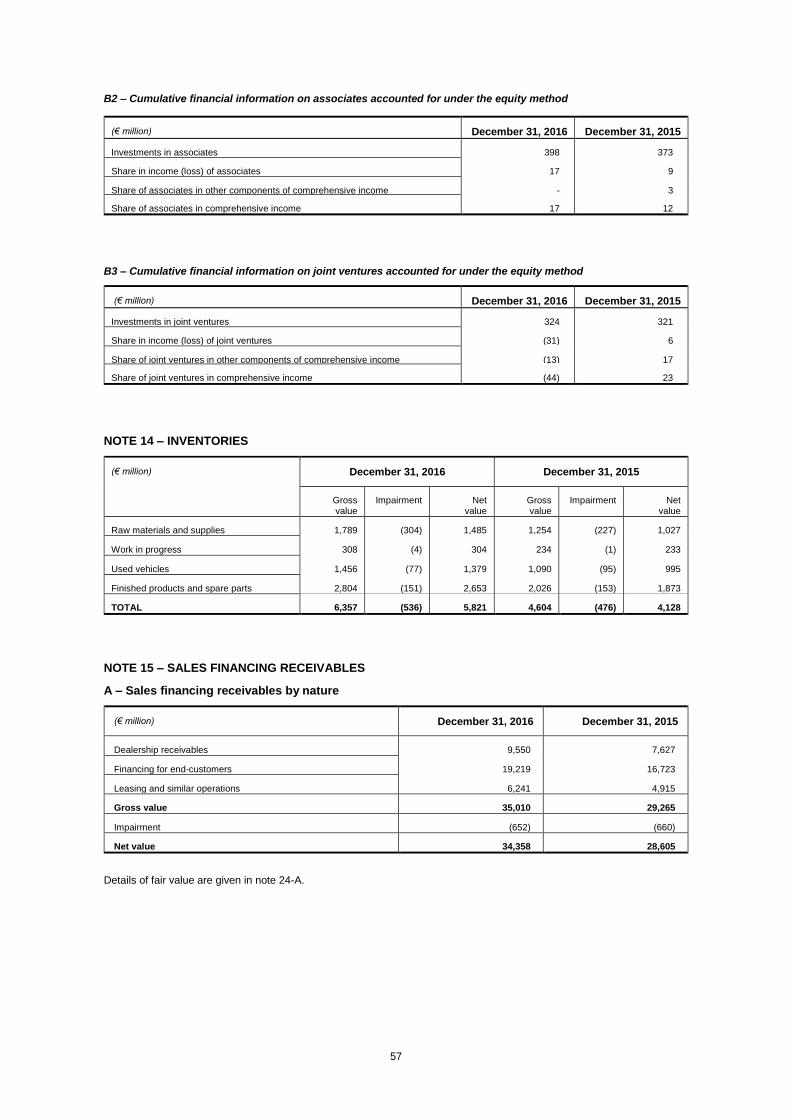
57
B2 – Cumulative financial information on associates accounted for under the equity method
(€ million) December 31, 2016 December 31, 2015
Investments in associates 398 373
Share in income (loss) of associates 17 9
Share of associates in other components of comprehensive income - 3
Share of associates in comprehensive income 17 12
B3 – Cumulative financial information on joint ventures accounted for under the equity method
(€ million) December 31, 2016 December 31, 2015
Investments in joint ventures 324 321
Share in income (loss) of joint ventures (31) 6
Share of joint ventures in other components of comprehensive income (13) 17
Share of joint ventures in comprehensive income (44) 23
NOTE 14 – INVENTORIES
(€ million)
December 31, 2016 December 31, 2015
Gross value
Impairment Net value
Gross value
Impairment Net value
Raw materials and supplies 1,789 (304) 1,485 1,254 (227) 1,027
Work in progress 308 (4) 304 234 (1) 233
Used vehicles 1,456 (77) 1,379 1,090 (95) 995
Finished products and spare parts 2,804 (151) 2,653 2,026 (153) 1,873
TOTAL 6,357 (536) 5,821 4,604 (476) 4,128
NOTE 15 – SALES FINANCING RECEIVABLES
A – Sales financing receivables by nature
(€ million) December 31, 2016 December 31, 2015
Dealership receivables 9,550 7,627
Financing for end-customers 19,219 16,723
Leasing and similar operations 6,241 4,915
Gross value 35,010 29,265
Impairment (652) (660)
Net value 34,358 28,605
Details of fair value are given in note 24-A.
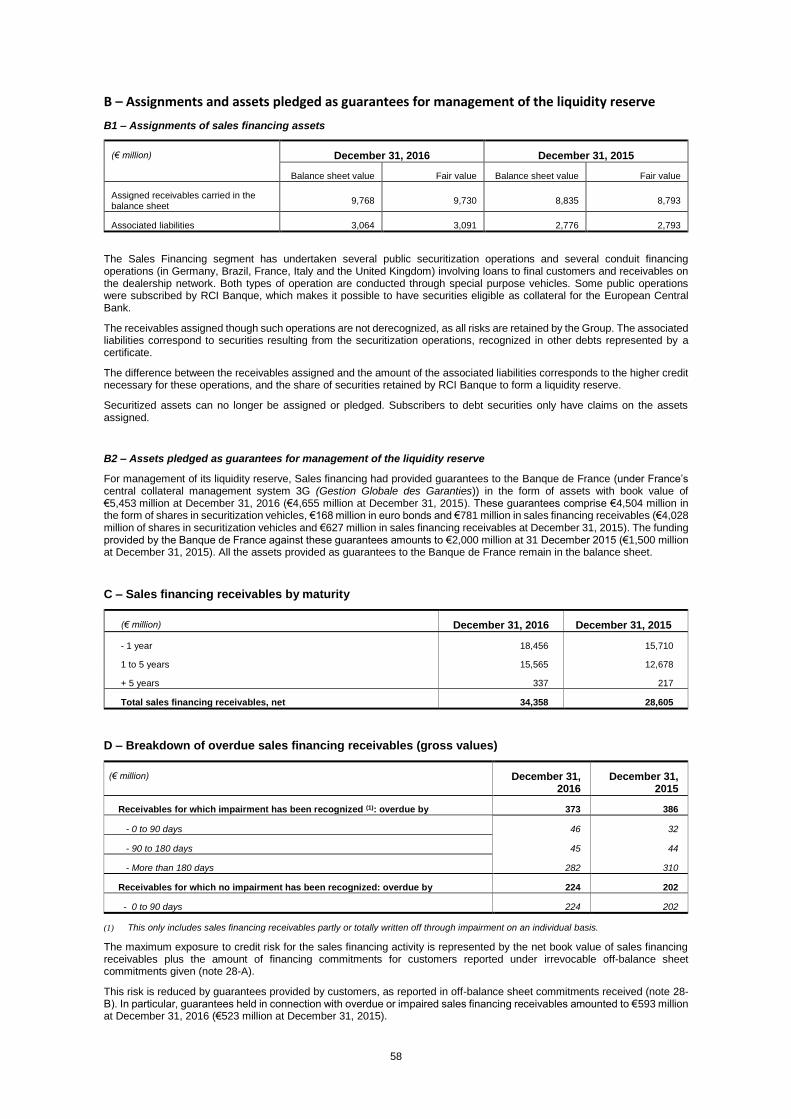
58
B – Assignments and assets pledged as guarantees for management of the liquidity reserve
B1 – Assignments of sales financing assets
(€ million) December 31, 2016 December 31, 2015
Balance sheet value Fair value Balance sheet value Fair value
Assigned receivables carried in the balance sheet
9,768 9,730 8,835 8,793
Associated liabilities 3,064 3,091 2,776 2,793
The Sales Financing segment has undertaken several public securitization operations and several conduit financing operations (in Germany, Brazil, France, Italy and the United Kingdom) involving loans to final customers and receivables on the dealership network. Both types of operation are conducted through special purpose vehicles. Some public operations were subscribed by RCI Banque, which makes it possible to have securities eligible as collateral for the European Central Bank.
The receivables assigned though such operations are not derecognized, as all risks are retained by the Group. The associated liabilities correspond to securities resulting from the securitization operations, recognized in other debts represented by a certificate.
The difference between the receivables assigned and the amount of the associated liabilities corresponds to the higher credit necessary for these operations, and the share of securities retained by RCI Banque to form a liquidity reserve.
Securitized assets can no longer be assigned or pledged. Subscribers to debt securities only have claims on the assets assigned.
B2 – Assets pledged as guarantees for management of the liquidity reserve
For management of its liquidity reserve, Sales financing had provided guarantees to the Banque de France (under France’s central collateral management system 3G (Gestion Globale des Garanties)) in the form of assets with book value of €5,453 million at December 31, 2016 (€4,655 million at December 31, 2015). These guarantees comprise €4,504 million in the form of shares in securitization vehicles, €168 million in euro bonds and €781 million in sales financing receivables (€4,028 million of shares in securitization vehicles and €627 million in sales financing receivables at December 31, 2015). The funding provided by the Banque de France against these guarantees amounts to €2,000 million at 31 December 2015 (€1,500 million at December 31, 2015). All the assets provided as guarantees to the Banque de France remain in the balance sheet.
C – Sales financing receivables by maturity
(€ million) December 31, 2016 December 31, 2015
- 1 year 18,456 15,710
1 to 5 years 15,565 12,678
+ 5 years 337 217
Total sales financing receivables, net 34,358 28,605
D – Breakdown of overdue sales financing receivables (gross values)
(€ million) December 31, 2016
December 31, 2015
Receivables for which impairment has been recognized (1): overdue by 373 386
- 0 to 90 days 46 32
- 90 to 180 days 45 44
- More than 180 days 282 310
Receivables for which no impairment has been recognized: overdue by 224 202
- 0 to 90 days 224 202
(1) This only includes sales financing receivables partly or totally written off through impairment on an individual basis.
The maximum exposure to credit risk for the sales financing activity is represented by the net book value of sales financing receivables plus the amount of financing commitments for customers reported under irrevocable off-balance sheet commitments given (note 28-A).
This risk is reduced by guarantees provided by customers, as reported in off-balance sheet commitments received (note 28-B). In particular, guarantees held in connection with overdue or impaired sales financing receivables amounted to €593 million at December 31, 2016 (€523 million at December 31, 2015).
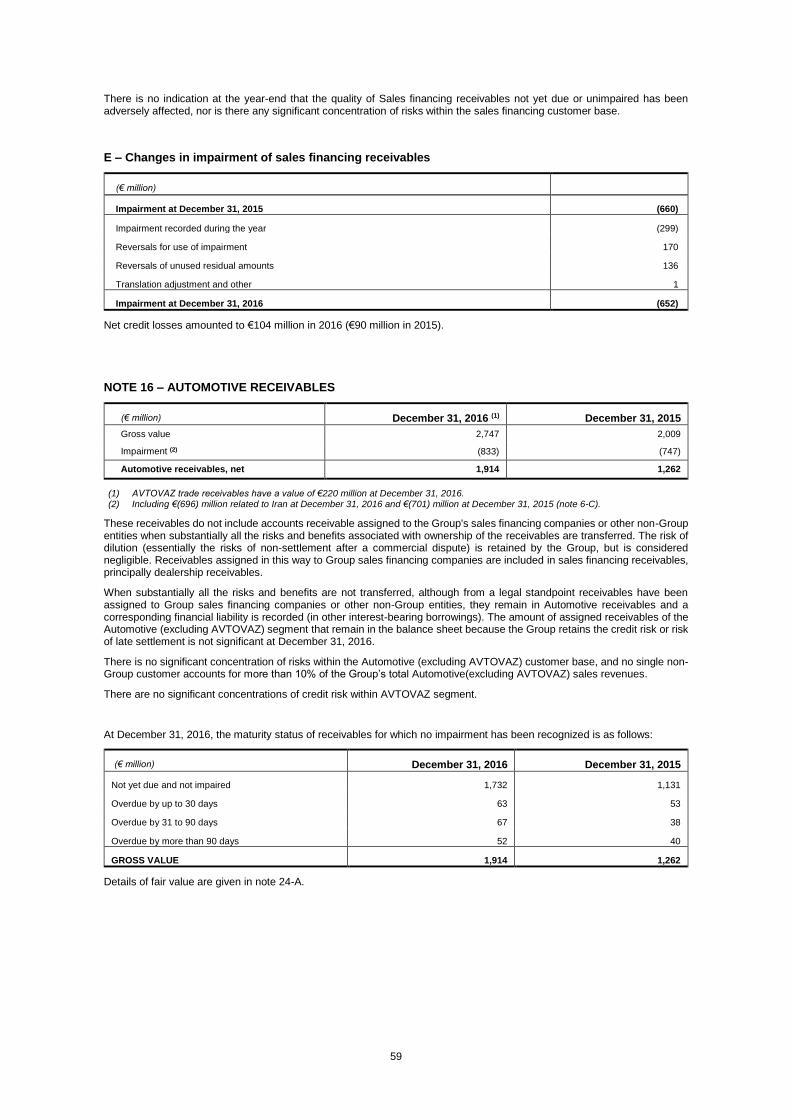
59
There is no indication at the year-end that the quality of Sales financing receivables not yet due or unimpaired has been adversely affected, nor is there any significant concentration of risks within the sales financing customer base.
E – Changes in impairment of sales financing receivables
(€ million)
Impairment at December 31, 2015 (660)
Impairment recorded during the year (299)
Reversals for use of impairment 170
Reversals of unused residual amounts 136
Translation adjustment and other 1
Impairment at December 31, 2016 (652)
Net credit losses amounted to €104 million in 2016 (€90 million in 2015).
NOTE 16 – AUTOMOTIVE RECEIVABLES
(€ million) December 31, 2016 (1) December 31, 2015
Gross value 2,747 2,009
Impairment (2) (833) (747)
Automotive receivables, net 1,914 1,262
(1) AVTOVAZ trade receivables have a value of €220 million at December 31, 2016. (2) Including €(696) million related to Iran at December 31, 2016 and €(701) million at December 31, 2015 (note 6-C).
These receivables do not include accounts receivable assigned to the Group's sales financing companies or other non-Group entities when substantially all the risks and benefits associated with ownership of the receivables are transferred. The risk of dilution (essentially the risks of non-settlement after a commercial dispute) is retained by the Group, but is considered negligible. Receivables assigned in this way to Group sales financing companies are included in sales financing receivables, principally dealership receivables.
When substantially all the risks and benefits are not transferred, although from a legal standpoint receivables have been assigned to Group sales financing companies or other non-Group entities, they remain in Automotive receivables and a corresponding financial liability is recorded (in other interest-bearing borrowings). The amount of assigned receivables of the Automotive (excluding AVTOVAZ) segment that remain in the balance sheet because the Group retains the credit risk or risk of late settlement is not significant at December 31, 2016.
There is no significant concentration of risks within the Automotive (excluding AVTOVAZ) customer base, and no single non-Group customer accounts for more than 10% of the Group’s total Automotive(excluding AVTOVAZ) sales revenues.
There are no significant concentrations of credit risk within AVTOVAZ segment.
At December 31, 2016, the maturity status of receivables for which no impairment has been recognized is as follows:
(€ million) December 31, 2016 December 31, 2015
Not yet due and not impaired 1,732 1,131
Overdue by up to 30 days 63 53
Overdue by 31 to 90 days 67 38
Overdue by more than 90 days 52 40
GROSS VALUE 1,914 1,262
Details of fair value are given in note 24-A.

60
NOTE 17 – OTHER CURRENT AND NON-CURRENT ASSETS
(€ million)
December 31, 2016 December 31, 2015
Non- current
Current Total Non-current
Current Total
Prepaid expenses 193 283 476 143 263 406
Tax receivables (excluding current taxes due) 517 1,737 2,254 400 1,284 1,684
Taxes due (1) - 44 44 - 62 62
Other receivables 574 1,350 1,924 543 1,107 1,650
Investments in controlled unconsolidated entities 82 - 82 45 - 45
Derivatives on operating transactions of the Automotive segments
- 4 4 - 39 39
Derivatives on financing transactions of the Sales Financing segment
- 238 238 - 375 375
TOTAL 1,366 3,656 5,022 1,131 3,130 4,261
Gross value 1,394 3,860 5,254 1,221 3,242 4,463
Impairment (28) (204) (232) (90) (112) (202)
(1) Current taxes due are reported separately in the consolidated financial position (4.2.3).
Tax receivables (excluding current taxes due) do not include French tax receivables assigned outside the Group (the “CIR” Research Tax Credit and “CICE” Tax Credit for Competitivity and Employment), when substantially all the risks and benefits associated with ownership of the receivables are transferred. In the case of tax receivables, assignment only gives rise derecognition if the risk of dilution is deemed to be non-existent, notably when the assigned receivables have already been subject to a tax inspection or preliminary audit.
The total amount of tax receivables assigned and derecognized in 2016 is €50 million, and comprises CICE receivables (€148 million in 2015, comprising €99 million of CIR receivables and €49 million of CICE receivables). This brought the total of tax receivables assigned that remain in the balance sheet to nil at December 31, 2016 (€32 million at December 31, 2015).
NOTE 18 – SHAREHOLDERS' EQUITY
A – Share capital
The total number of ordinary shares issued and fully paid-up at December 31, 2016 is 295,722 thousand, with par value of €3.81 per share (unchanged compared to December 31, 2015).
Treasury shares do not bear dividends. They account for 1.57% of Renault’s share capital at December 31, 2016 (1.21% at December 31, 2015).
The Nissan group holds 15% of Renault through its wholly-owned subsidiary Nissan Finance Co. Ltd (no voting rights are attached to these shares).
B – Capital management
In managing its capital, the Group’s objective is to guarantee continuity of business in order to provide returns for shareholders and benefits for other stakeholders, and to maintain optimum capital structure in order to optimize its cost.
The Group actively manages its capital structure, making adjustments in view of developments in economic conditions. The Group may adjust dividend payments to shareholders, redeem some of the capital or issue new shares.
The Group’s objectives are monitored in different ways in the different operating segments.
The Group manages the Automotive (excluding AVTOVAZ) segment’s capital by reference to a ratio equal to the segment’s net indebtedness divided by the amount of shareholders’ equity. Net financial indebtedness includes all non-operating interest-bearing financial liabilities and commitments less cash and cash equivalents and other non-operating financial assets such as marketable securities or the segment’s loans. Shareholders’ equity is as reported in the Group’s financial position. The Automotive (excluding AVTOVAZ) segment presents a net liquidity position at December 31, 2016 and December 31, 2015 (section 4.2.6.1-A4).
The Sales Financing segment must comply with regulatory ratios specific to banking operations. The minimum solvency ratio (shareholders’ equity including subordinated loans to total weighted risks) is 8%. RCI Banque’s Core Tier 1 solvency ratio is 15.74% at December 31, 2016 (15.14% at December 31, 2015).
The Group also partially hedges its investment in Nissan (note 12-G).
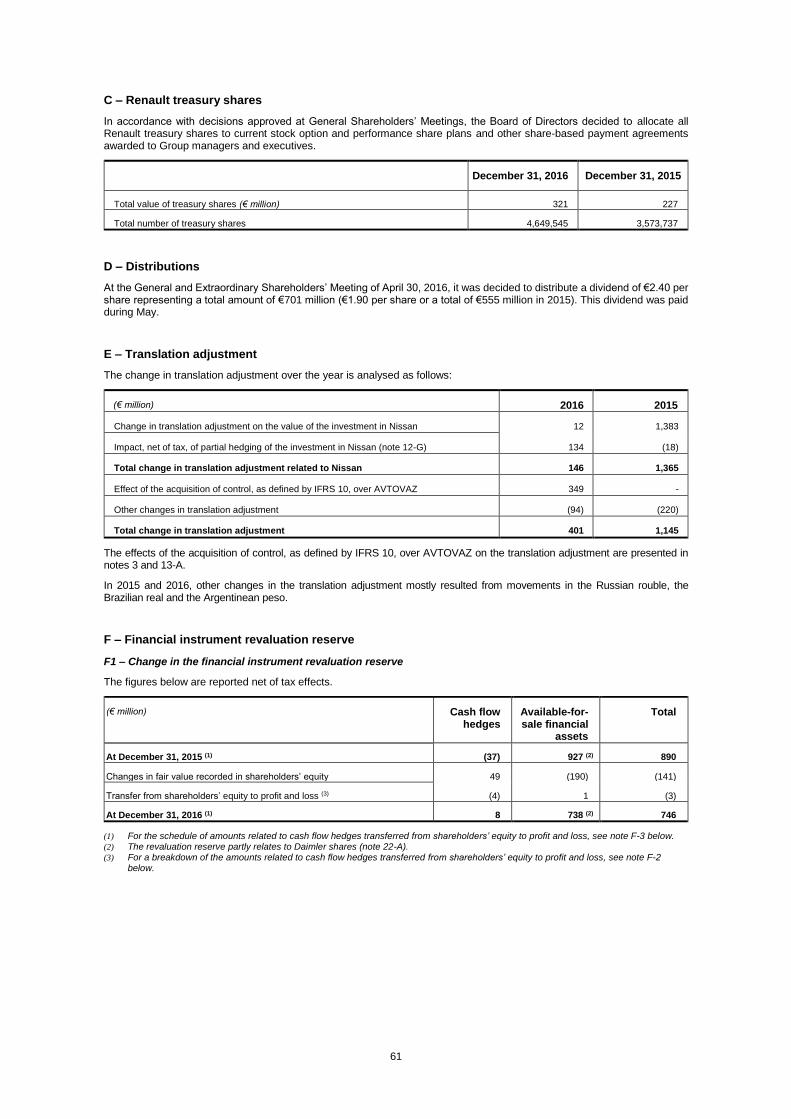
61
C – Renault treasury shares
In accordance with decisions approved at General Shareholders’ Meetings, the Board of Directors decided to allocate all Renault treasury shares to current stock option and performance share plans and other share-based payment agreements awarded to Group managers and executives.
December 31, 2016 December 31, 2015
Total value of treasury shares (€ million) 321 227
Total number of treasury shares 4,649,545 3,573,737
D – Distributions
At the General and Extraordinary Shareholders’ Meeting of April 30, 2016, it was decided to distribute a dividend of €2.40 per share representing a total amount of €701 million (€1.90 per share or a total of €555 million in 2015). This dividend was paid during May.
E – Translation adjustment
The change in translation adjustment over the year is analysed as follows:
(€ million) 2016 2015
Change in translation adjustment on the value of the investment in Nissan 12 1,383
Impact, net of tax, of partial hedging of the investment in Nissan (note 12-G) 134 (18)
Total change in translation adjustment related to Nissan 146 1,365
Effect of the acquisition of control, as defined by IFRS 10, over AVTOVAZ 349 -
Other changes in translation adjustment (94) (220)
Total change in translation adjustment 401 1,145
The effects of the acquisition of control, as defined by IFRS 10, over AVTOVAZ on the translation adjustment are presented in notes 3 and 13-A.
In 2015 and 2016, other changes in the translation adjustment mostly resulted from movements in the Russian rouble, the Brazilian real and the Argentinean peso.
F – Financial instrument revaluation reserve
F1 – Change in the financial instrument revaluation reserve
The figures below are reported net of tax effects.
(€ million) Cash flow hedges
Available-for-sale financial
assets
Total
At December 31, 2015 (1) (37) 927 (2) 890
Changes in fair value recorded in shareholders’ equity 49 (190) (141)
Transfer from shareholders’ equity to profit and loss (3) (4) 1 (3)
At December 31, 2016 (1) 8 738 (2) 746
(1) For the schedule of amounts related to cash flow hedges transferred from shareholders’ equity to profit and loss, see note F-3 below. (2) The revaluation reserve partly relates to Daimler shares (note 22-A). (3) For a breakdown of the amounts related to cash flow hedges transferred from shareholders’ equity to profit and loss, see note F-2
below.
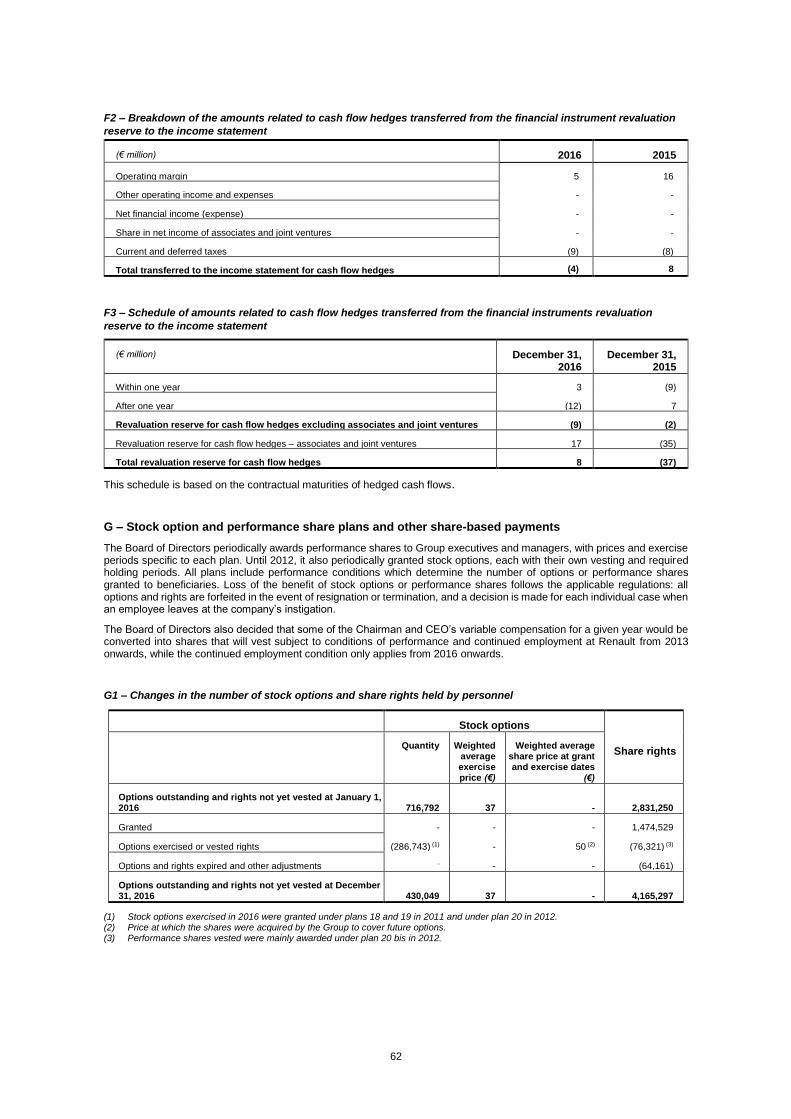
62
F2 – Breakdown of the amounts related to cash flow hedges transferred from the financial instrument revaluation
reserve to the income statement
(€ million) 2016 2015
Operating margin 5 16
Other operating income and expenses - -
Net financial income (expense) - -
Share in net income of associates and joint ventures - -
Current and deferred taxes (9) (8)
Total transferred to the income statement for cash flow hedges (4) 8
F3 – Schedule of amounts related to cash flow hedges transferred from the financial instruments revaluation
reserve to the income statement
(€ million) December 31, 2016
December 31, 2015
Within one year 3 (9)
After one year (12) 7
Revaluation reserve for cash flow hedges excluding associates and joint ventures (9) (2)
Revaluation reserve for cash flow hedges – associates and joint ventures 17 (35)
Total revaluation reserve for cash flow hedges 8 (37)
This schedule is based on the contractual maturities of hedged cash flows.
G – Stock option and performance share plans and other share-based payments
The Board of Directors periodically awards performance shares to Group executives and managers, with prices and exercise periods specific to each plan. Until 2012, it also periodically granted stock options, each with their own vesting and required holding periods. All plans include performance conditions which determine the number of options or performance shares granted to beneficiaries. Loss of the benefit of stock options or performance shares follows the applicable regulations: all options and rights are forfeited in the event of resignation or termination, and a decision is made for each individual case when an employee leaves at the company’s instigation.
The Board of Directors also decided that some of the Chairman and CEO’s variable compensation for a given year would be converted into shares that will vest subject to conditions of performance and continued employment at Renault from 2013 onwards, while the continued employment condition only applies from 2016 onwards.
G1 – Changes in the number of stock options and share rights held by personnel
Stock options
Share rights
Quantity Weighted average exercise price (€)
Weighted average share price at grant and exercise dates
(€)
Options outstanding and rights not yet vested at January 1, 2016 716,792 37 - 2,831,250
Granted - - - 1,474,529
Options exercised or vested rights (286,743) (1) - 50 (2) (76,321) (3)
Options and rights expired and other adjustments - - - (64,161)
Options outstanding and rights not yet vested at December 31, 2016 430,049 37 - 4,165,297
(1) Stock options exercised in 2016 were granted under plans 18 and 19 in 2011 and under plan 20 in 2012. (2) Price at which the shares were acquired by the Group to cover future options. (3) Performance shares vested were mainly awarded under plan 20 bis in 2012.

63
G2 – Stock options
For plans current in 2016, options attributed vest after a period of 4 years, and the exercise period then covers the 4 following years.
Plan Type of plan Grant date Exercise price (€)
Options outstanding at December 31,
2016
Exercise period
Plan 18 Stock purchase options April 29, 2011 38.80 175,574 April 30, 2015 – April 28, 2019
Plan 19 Stock purchase options December 8, 2011 26.87 51,930 December 9, 2015 – December 7, 2019
Plan 20 Stock purchase options December 13, 2012 37.43 202,545 December 13, 2016 – December 12, 2020
TOTAL 430,049
G3 – Performance share plans and other share-based payment agreements
Vesting and minimum holding periods are different depending on whether beneficiaries are French tax residents or tax
residents of other countries, in order to take account of local tax constraints.
The vesting period for shares awarded to French tax residents is 3 years followed by a minimum holding period of 2 years, reduced to 1 year in the case of plan 23 due to changes in regulations.
For non-French tax residents, the vesting period is 4 years and there is no minimum holding period.
Plan Type of plan Grant date Share rights awarded at
December 31, 2016
Vesting date Holding period
Plan 20 bis Performance
shares December 13, 2012
- December 13, 2016 (1) None
Plan 21 (2) Performance
shares February 12,
2014
972,605
313,641
February 12, 2017
February 12, 2018
February 12, 2017 – February 12, 2019
None
Plan 22 (2) Performance
shares February 11,
2015
1,042,420
374,391
February 11, 2018
February 11, 2019
February 11, 2018 – February 11, 2020
None
Plan 23 (2) Performance
shares April 29, 2016
1,007,200
355,040
April 29, 2019
April 29, 2020
April 29, 2019 – April 29, 2020
None
Plan 23 bis Performance
shares July 27, 2016 100,000 July 27, 2020 None
TOTAL 4,165,297
(1) The performance shares concerned by these plans were issued to beneficiaries in 2016. (2) These figures include shares awarded as part of the Chairman and CEO’s performance-related remuneration.
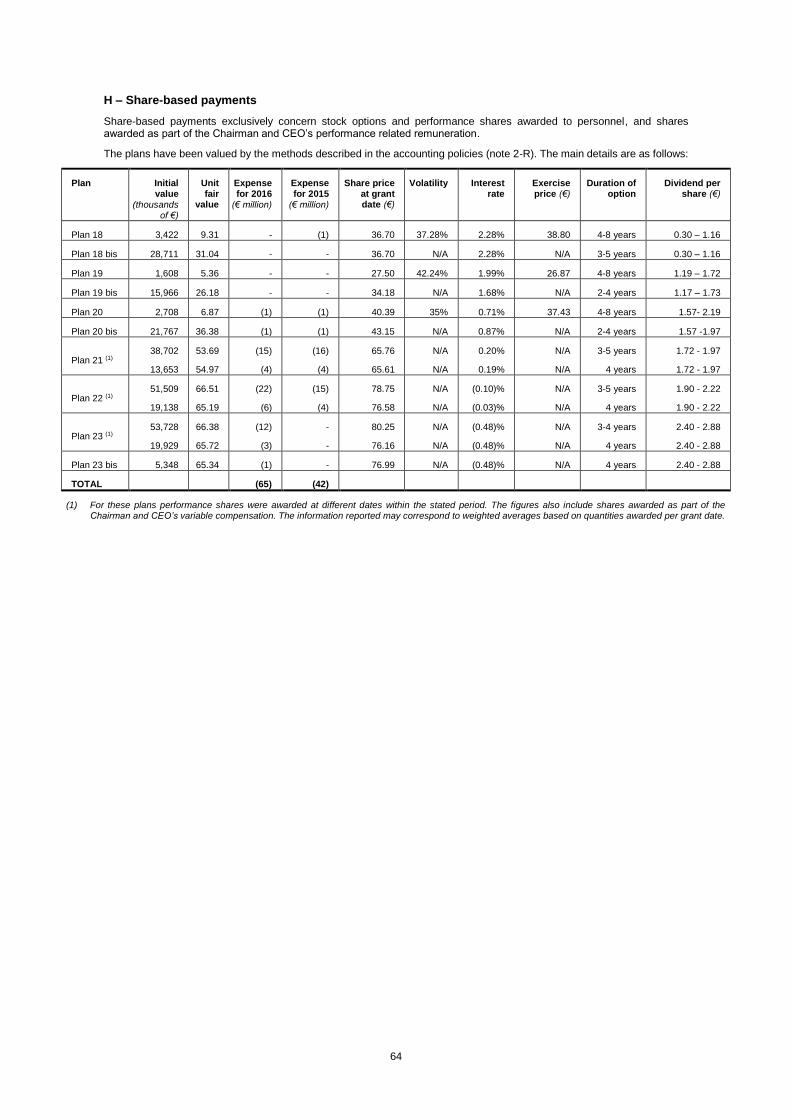
64
H – Share-based payments
Share-based payments exclusively concern stock options and performance shares awarded to personnel, and shares awarded as part of the Chairman and CEO’s performance related remuneration.
The plans have been valued by the methods described in the accounting policies (note 2-R). The main details are as follows:
Plan Initial value
(thousands of €)
Unit fair
value
Expense for 2016
(€ million)
Expense for 2015
(€ million)
Share price at grant date (€)
Volatility Interest rate
Exercise price (€)
Duration of option
Dividend per share (€)
Plan 18 3,422 9.31 - (1) 36.70 37.28% 2.28% 38.80 4-8 years 0.30 – 1.16
Plan 18 bis 28,711 31.04 - - 36.70 N/A 2.28% N/A 3-5 years 0.30 – 1.16
Plan 19 1,608 5.36 - - 27.50 42.24% 1.99% 26.87 4-8 years 1.19 – 1.72
Plan 19 bis 15,966 26.18 - - 34.18 N/A 1.68% N/A 2-4 years 1.17 – 1.73
Plan 20 2,708 6.87 (1) (1) 40.39 35% 0.71% 37.43 4-8 years 1.57- 2.19
Plan 20 bis 21,767 36.38 (1) (1) 43.15 N/A 0.87% N/A 2-4 years 1.57 -1.97
Plan 21 (1) 38,702
13,653
53.69
54.97
(15)
(4)
(16)
(4)
65.76
65.61
N/A
N/A
0.20%
0.19%
N/A
N/A
3-5 years
4 years
1.72 - 1.97
1.72 - 1.97
Plan 22 (1) 51,509
19,138
66.51
65.19
(22)
(6)
(15)
(4)
78.75
76.58
N/A
N/A
(0.10)%
(0.03)%
N/A
N/A
3-5 years
4 years
1.90 - 2.22
1.90 - 2.22
Plan 23 (1) 53,728
19,929
66.38
65.72
(12)
(3)
-
-
80.25
76.16
N/A
N/A
(0.48)%
(0.48)%
N/A
N/A
3-4 years
4 years
2.40 - 2.88
2.40 - 2.88
Plan 23 bis 5,348 65.34 (1) - 76.99 N/A (0.48)% N/A 4 years 2.40 - 2.88
TOTAL (65) (42)
(1) For these plans performance shares were awarded at different dates within the stated period. The figures also include shares awarded as part of the Chairman and CEO’s variable compensation. The information reported may correspond to weighted averages based on quantities awarded per grant date.
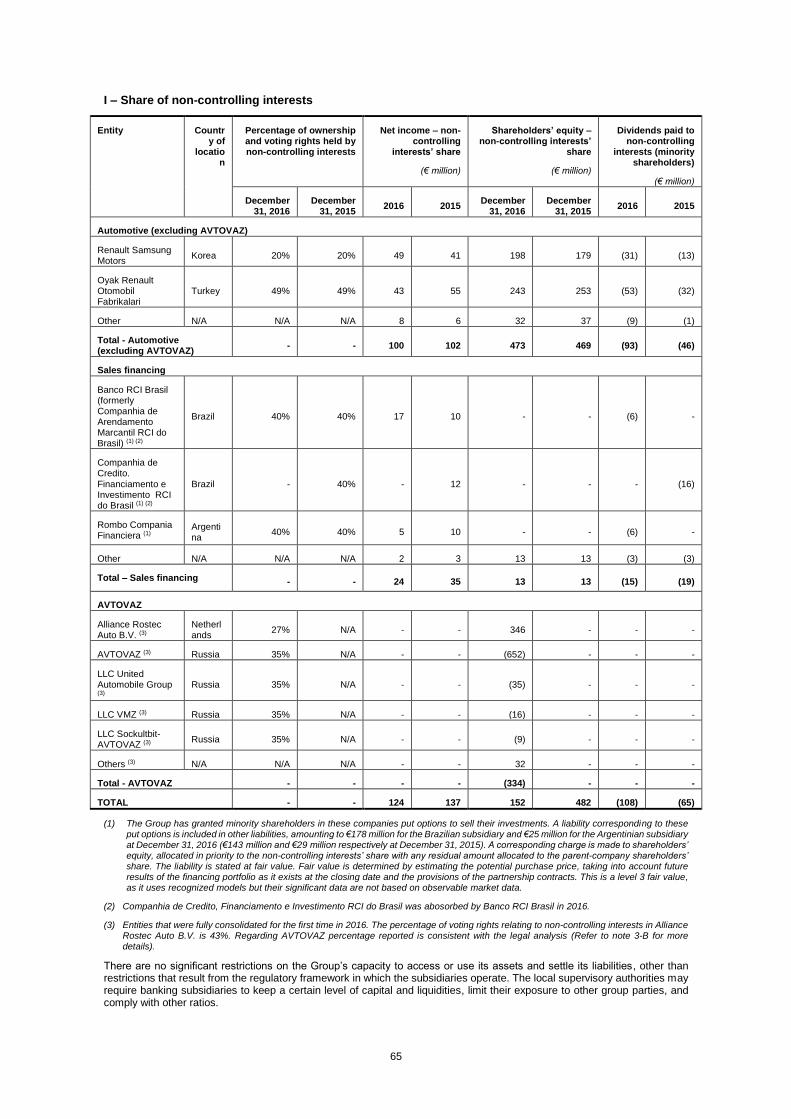
65
I – Share of non-controlling interests
Entity Country of
location
Percentage of ownership and voting rights held by non-controlling interests
Net income – non-controlling
interests’ share
(€ million)
Shareholders’ equity – non-controlling interests’
share
(€ million)
Dividends paid to non-controlling
interests (minority shareholders)
(€ million)
December
31, 2016 December
31, 2015 2016 2015
December 31, 2016
December 31, 2015
2016 2015
Automotive (excluding AVTOVAZ)
Renault Samsung Motors
Korea 20% 20% 49 41 198 179 (31) (13)
Oyak Renault Otomobil Fabrikalari
Turkey 49% 49% 43 55 243 253 (53) (32)
Other N/A N/A N/A 8 6 32 37 (9) (1)
Total - Automotive (excluding AVTOVAZ)
- - 100 102 473 469 (93) (46)
Sales financing
Banco RCI Brasil (formerly Companhia de Arendamento Marcantil RCI do Brasil) (1) (2)
Brazil 40% 40% 17 10 - - (6) -
Companhia de Credito. Financiamento e Investimento RCI do Brasil (1) (2)
Brazil - 40% - 12 - - - (16)
Rombo Compania Financiera (1)
Argentina
40% 40% 5 10 - - (6) -
Other N/A N/A N/A 2 3 13 13 (3) (3)
Total – Sales financing - - 24 35 13 13 (15) (19)
AVTOVAZ
Alliance Rostec Auto B.V. (3)
Netherlands
27% N/A - - 346 - - -
AVTOVAZ (3) Russia 35% N/A - - (652) - - -
LLC United Automobile Group (3)
Russia 35% N/A - - (35) - - -
LLC VMZ (3) Russia 35% N/A - - (16) - - -
LLC Sockultbit-AVTOVAZ (3)
Russia 35% N/A - - (9) - - -
Others (3) N/A N/A N/A - - 32 - - -
Total - AVTOVAZ - - - - (334) - - -
TOTAL - - 124 137 152 482 (108) (65)
(1) The Group has granted minority shareholders in these companies put options to sell their investments. A liability corresponding to these put options is included in other liabilities, amounting to €178 million for the Brazilian subsidiary and €25 million for the Argentinian subsidiary at December 31, 2016 (€143 million and €29 million respectively at December 31, 2015). A corresponding charge is made to shareholders’ equity, allocated in priority to the non-controlling interests’ share with any residual amount allocated to the parent-company shareholders’ share. The liability is stated at fair value. Fair value is determined by estimating the potential purchase price, taking into account future results of the financing portfolio as it exists at the closing date and the provisions of the partnership contracts. This is a level 3 fair value, as it uses recognized models but their significant data are not based on observable market data.
(2) Companhia de Credito, Financiamento e Investimento RCI do Brasil was abosorbed by Banco RCI Brasil in 2016.
(3) Entities that were fully consolidated for the first time in 2016. The percentage of voting rights relating to non-controlling interests in Alliance Rostec Auto B.V. is 43%. Regarding AVTOVAZ percentage reported is consistent with the legal analysis (Refer to note 3-B for more details).
There are no significant restrictions on the Group’s capacity to access or use its assets and settle its liabilities, other than restrictions that result from the regulatory framework in which the subsidiaries operate. The local supervisory authorities may require banking subsidiaries to keep a certain level of capital and liquidities, limit their exposure to other group parties, and comply with other ratios.
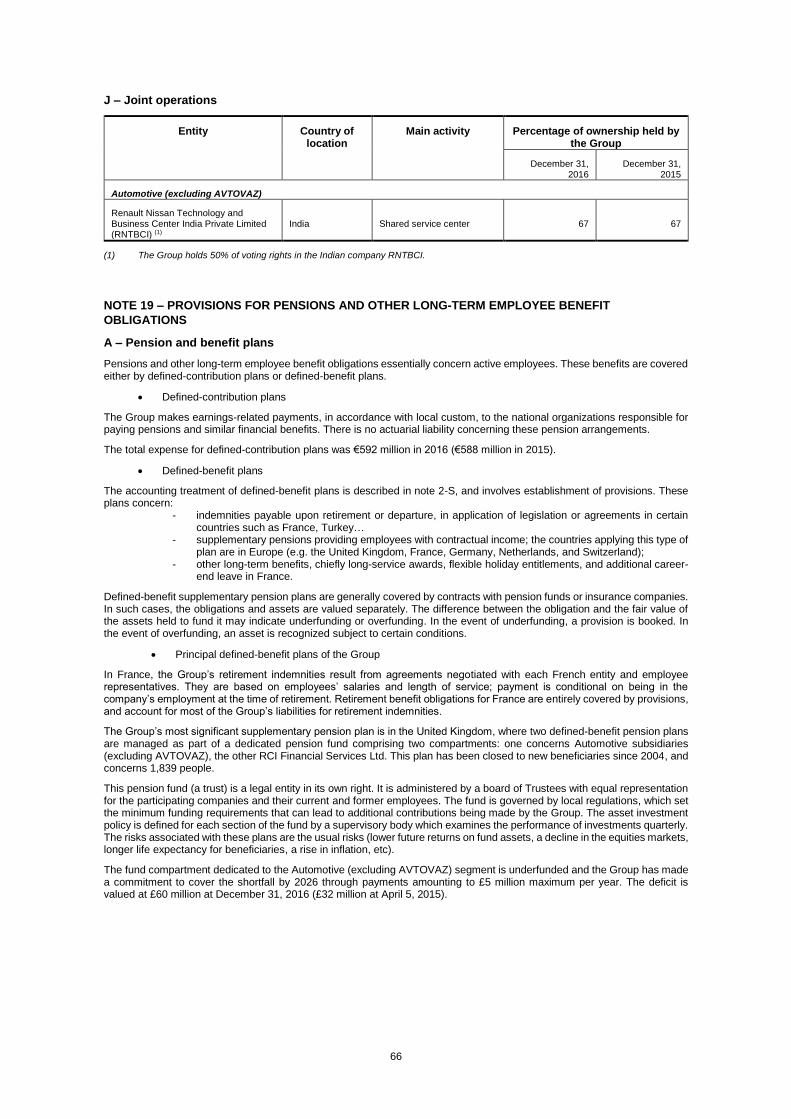
66
J – Joint operations
Entity
Country of location
Main activity Percentage of ownership held by the Group
December 31, 2016
December 31, 2015
Automotive (excluding AVTOVAZ)
Renault Nissan Technology and Business Center India Private Limited (RNTBCI) (1)
India Shared service center 67 67
(1) The Group holds 50% of voting rights in the Indian company RNTBCI.
NOTE 19 – PROVISIONS FOR PENSIONS AND OTHER LONG-TERM EMPLOYEE BENEFIT
OBLIGATIONS
A – Pension and benefit plans
Pensions and other long-term employee benefit obligations essentially concern active employees. These benefits are covered either by defined-contribution plans or defined-benefit plans.
Defined-contribution plans
The Group makes earnings-related payments, in accordance with local custom, to the national organizations responsible for paying pensions and similar financial benefits. There is no actuarial liability concerning these pension arrangements.
The total expense for defined-contribution plans was €592 million in 2016 (€588 million in 2015).
Defined-benefit plans
The accounting treatment of defined-benefit plans is described in note 2-S, and involves establishment of provisions. These plans concern:
- indemnities payable upon retirement or departure, in application of legislation or agreements in certain countries such as France, Turkey…
- supplementary pensions providing employees with contractual income; the countries applying this type of plan are in Europe (e.g. the United Kingdom, France, Germany, Netherlands, and Switzerland);
- other long-term benefits, chiefly long-service awards, flexible holiday entitlements, and additional career-end leave in France.
Defined-benefit supplementary pension plans are generally covered by contracts with pension funds or insurance companies. In such cases, the obligations and assets are valued separately. The difference between the obligation and the fair value of the assets held to fund it may indicate underfunding or overfunding. In the event of underfunding, a provision is booked. In the event of overfunding, an asset is recognized subject to certain conditions.
Principal defined-benefit plans of the Group
In France, the Group’s retirement indemnities result from agreements negotiated with each French entity and employee representatives. They are based on employees’ salaries and length of service; payment is conditional on being in the company’s employment at the time of retirement. Retirement benefit obligations for France are entirely covered by provisions, and account for most of the Group’s liabilities for retirement indemnities.
The Group’s most significant supplementary pension plan is in the United Kingdom, where two defined-benefit pension plans are managed as part of a dedicated pension fund comprising two compartments: one concerns Automotive subsidiaries (excluding AVTOVAZ), the other RCI Financial Services Ltd. This plan has been closed to new beneficiaries since 2004, and concerns 1,839 people.
This pension fund (a trust) is a legal entity in its own right. It is administered by a board of Trustees with equal representation for the participating companies and their current and former employees. The fund is governed by local regulations, which set the minimum funding requirements that can lead to additional contributions being made by the Group. The asset investment policy is defined for each section of the fund by a supervisory body which examines the performance of investments quarterly. The risks associated with these plans are the usual risks (lower future returns on fund assets, a decline in the equities markets, longer life expectancy for beneficiaries, a rise in inflation, etc).
The fund compartment dedicated to the Automotive (excluding AVTOVAZ) segment is underfunded and the Group has made a commitment to cover the shortfall by 2026 through payments amounting to £5 million maximum per year. The deficit is valued at £60 million at December 31, 2016 (£32 million at April 5, 2015).
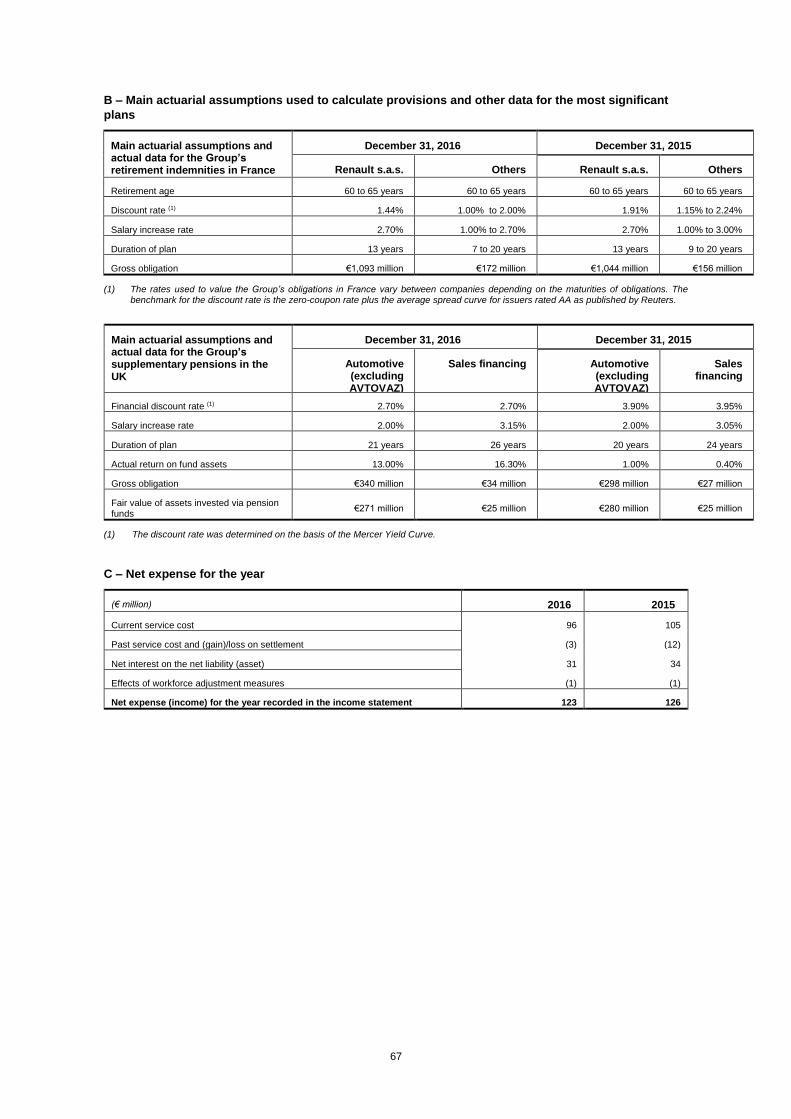
67
B – Main actuarial assumptions used to calculate provisions and other data for the most significant
plans
Main actuarial assumptions and actual data for the Group’s retirement indemnities in France
December 31, 2016 December 31, 2015
Renault s.a.s. Others Renault s.a.s. Others
Retirement age 60 to 65 years 60 to 65 years 60 to 65 years 60 to 65 years
Discount rate (1) 1.44% 1.00% to 2.00% 1.91% 1.15% to 2.24%
Salary increase rate 2.70% 1.00% to 2.70% 2.70% 1.00% to 3.00%
Duration of plan 13 years 7 to 20 years 13 years 9 to 20 years
Gross obligation €1,093 million €172 million €1,044 million €156 million
(1) The rates used to value the Group’s obligations in France vary between companies depending on the maturities of obligations. The benchmark for the discount rate is the zero-coupon rate plus the average spread curve for issuers rated AA as published by Reuters.
Main actuarial assumptions and actual data for the Group’s supplementary pensions in the UK
December 31, 2016 December 31, 2015
Automotive (excluding AVTOVAZ)
Sales financing Automotive (excluding AVTOVAZ)
Sales financing
Financial discount rate (1) 2.70% 2.70% 3.90% 3.95%
Salary increase rate 2.00% 3.15% 2.00% 3.05%
Duration of plan 21 years 26 years 20 years 24 years
Actual return on fund assets 13.00% 16.30% 1.00% 0.40%
Gross obligation €340 million €34 million €298 million €27 million
Fair value of assets invested via pension funds
€271 million €25 million €280 million €25 million
(1) The discount rate was determined on the basis of the Mercer Yield Curve.
C – Net expense for the year
(€ million) 2016 2015
Current service cost 96 105
Past service cost and (gain)/loss on settlement (3) (12)
Net interest on the net liability (asset) 31 34
Effects of workforce adjustment measures (1) (1)
Net expense (income) for the year recorded in the income statement 123 126
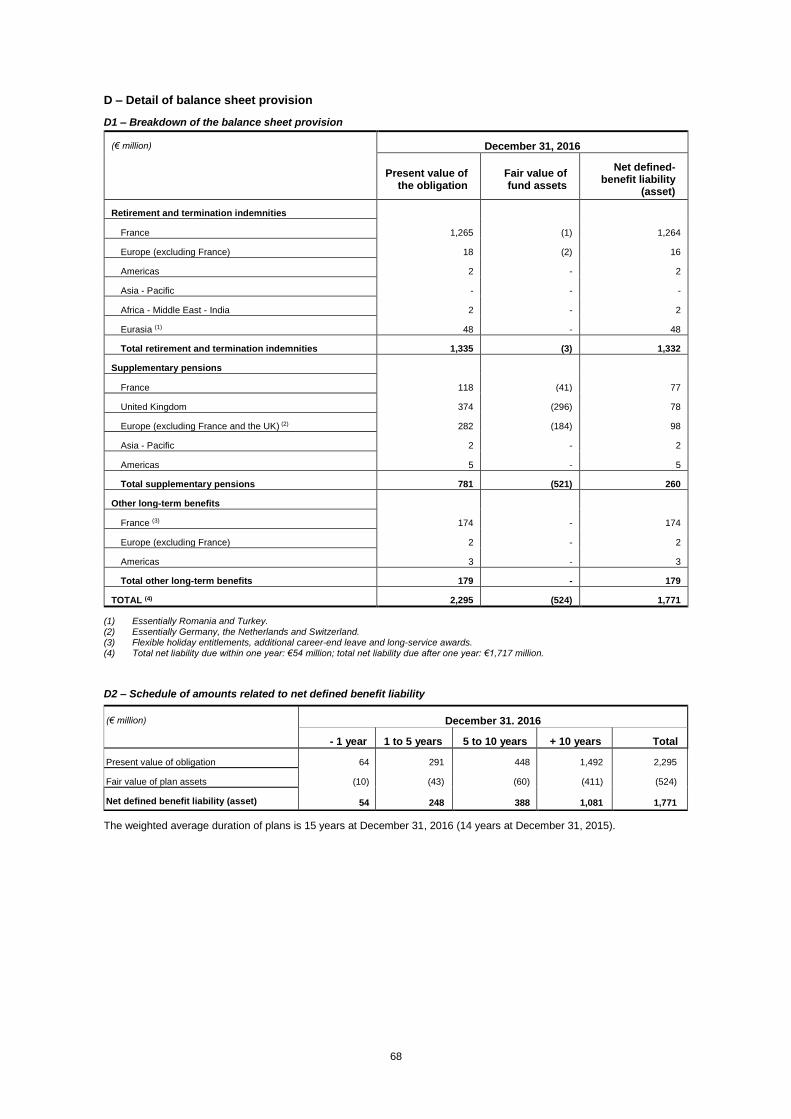
68
D – Detail of balance sheet provision
D1 – Breakdown of the balance sheet provision
(€ million) December 31, 2016
Present value of the obligation
Fair value of fund assets
Net defined-benefit liability
(asset)
Retirement and termination indemnities
France 1,265 (1) 1,264
Europe (excluding France) 18 (2) 16
Americas 2 - 2
Asia - Pacific - - -
Africa - Middle East - India 2 - 2
Eurasia (1) 48 - 48
Total retirement and termination indemnities 1,335 (3) 1,332
Supplementary pensions
France 118 (41) 77
United Kingdom 374 (296) 78
Europe (excluding France and the UK) (2) 282 (184) 98
Asia - Pacific 2 - 2
Americas 5 - 5
Total supplementary pensions 781 (521) 260
Other long-term benefits
France (3) 174 - 174
Europe (excluding France) 2 - 2
Americas 3 - 3
Total other long-term benefits 179 - 179
TOTAL (4) 2,295 (524) 1,771
(1) Essentially Romania and Turkey. (2) Essentially Germany, the Netherlands and Switzerland. (3) Flexible holiday entitlements, additional career-end leave and long-service awards. (4) Total net liability due within one year: €54 million; total net liability due after one year: €1,717 million.
D2 – Schedule of amounts related to net defined benefit liability
The weighted average duration of plans is 15 years at December 31, 2016 (14 years at December 31, 2015).
(€ million) December 31. 2016
- 1 year 1 to 5 years 5 to 10 years + 10 years Total
Present value of obligation 64 291 448 1,492 2,295
Fair value of plan assets (10) (43) (60) (411) (524)
Net defined benefit liability (asset) 54 248 388 1,081 1,771
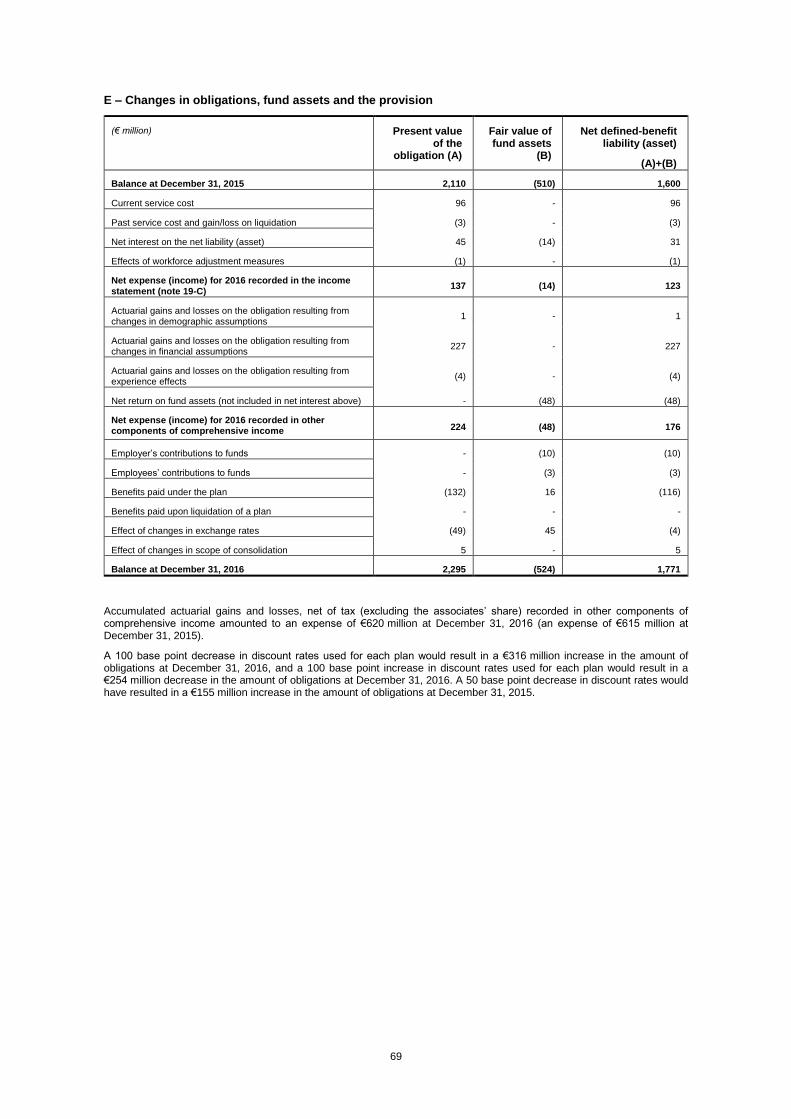
69
E – Changes in obligations, fund assets and the provision
(€ million) Present value of the
obligation (A)
Fair value of fund assets
(B)
Net defined-benefit liability (asset)
(A)+(B)
Balance at December 31, 2015 2,110 (510) 1,600
Current service cost 96 - 96
Past service cost and gain/loss on liquidation (3) - (3)
Net interest on the net liability (asset) 45 (14) 31
Effects of workforce adjustment measures (1) - (1)
Net expense (income) for 2016 recorded in the income statement (note 19-C)
137 (14) 123
Actuarial gains and losses on the obligation resulting from changes in demographic assumptions
1 - 1
Actuarial gains and losses on the obligation resulting from changes in financial assumptions
227 - 227
Actuarial gains and losses on the obligation resulting from experience effects
(4) - (4)
Net return on fund assets (not included in net interest above) - (48) (48)
Net expense (income) for 2016 recorded in other components of comprehensive income 224 (48) 176
Employer’s contributions to funds - (10) (10)
Employees’ contributions to funds - (3) (3)
Benefits paid under the plan (132) 16 (116)
Benefits paid upon liquidation of a plan - - -
Effect of changes in exchange rates (49) 45 (4)
Effect of changes in scope of consolidation 5 - 5
Balance at December 31, 2016 2,295 (524) 1,771
Accumulated actuarial gains and losses, net of tax (excluding the associates’ share) recorded in other components of comprehensive income amounted to an expense of €620 million at December 31, 2016 (an expense of €615 million at December 31, 2015).
A 100 base point decrease in discount rates used for each plan would result in a €316 million increase in the amount of obligations at December 31, 2016, and a 100 base point increase in discount rates used for each plan would result in a €254 million decrease in the amount of obligations at December 31, 2016. A 50 base point decrease in discount rates would have resulted in a €155 million increase in the amount of obligations at December 31, 2015.
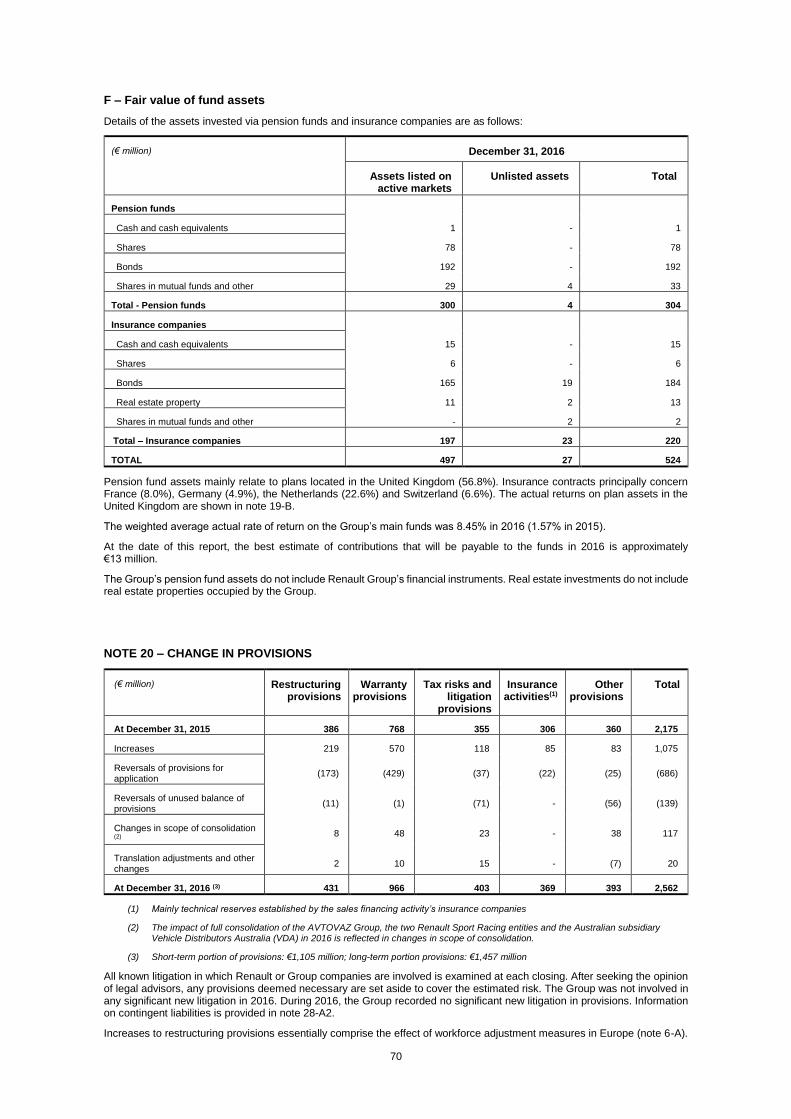
70
F – Fair value of fund assets
Details of the assets invested via pension funds and insurance companies are as follows:
(€ million) December 31, 2016
Assets listed on active markets
Unlisted assets Total
Pension funds
Cash and cash equivalents 1 - 1
Shares 78 - 78
Bonds 192 - 192
Shares in mutual funds and other 29 4 33
Total - Pension funds 300 4 304
Insurance companies
Cash and cash equivalents 15 - 15
Shares 6 - 6
Bonds 165 19 184
Real estate property 11 2 13
Shares in mutual funds and other - 2 2
Total – Insurance companies 197 23 220
TOTAL 497 27 524
Pension fund assets mainly relate to plans located in the United Kingdom (56.8%). Insurance contracts principally concern France (8.0%), Germany (4.9%), the Netherlands (22.6%) and Switzerland (6.6%). The actual returns on plan assets in the United Kingdom are shown in note 19-B.
The weighted average actual rate of return on the Group’s main funds was 8.45% in 2016 (1.57% in 2015).
At the date of this report, the best estimate of contributions that will be payable to the funds in 2016 is approximately €13 million.
The Group’s pension fund assets do not include Renault Group’s financial instruments. Real estate investments do not include real estate properties occupied by the Group.
NOTE 20 – CHANGE IN PROVISIONS
(€ million) Restructuring provisions
Warranty provisions
Tax risks and litigation
provisions
Insurance activities(1)
Other provisions
Total
At December 31, 2015 386 768 355 306 360 2,175
Increases 219 570 118 85 83 1,075
Reversals of provisions for application
(173) (429) (37) (22) (25) (686)
Reversals of unused balance of provisions
(11) (1) (71) - (56) (139)
Changes in scope of consolidation (2)
8 48 23 - 38 117
Translation adjustments and other changes
2 10 15 - (7) 20
At December 31, 2016 (3) 431 966 403 369 393 2,562
(1) Mainly technical reserves established by the sales financing activity’s insurance companies
(2) The impact of full consolidation of the AVTOVAZ Group, the two Renault Sport Racing entities and the Australian subsidiary Vehicle Distributors Australia (VDA) in 2016 is reflected in changes in scope of consolidation.
(3) Short-term portion of provisions: €1,105 million; long-term portion provisions: €1,457 million
All known litigation in which Renault or Group companies are involved is examined at each closing. After seeking the opinion of legal advisors, any provisions deemed necessary are set aside to cover the estimated risk. The Group was not involved in any significant new litigation in 2016. During 2016, the Group recorded no significant new litigation in provisions. Information on contingent liabilities is provided in note 28-A2.
Increases to restructuring provisions essentially comprise the effect of workforce adjustment measures in Europe (note 6-A).
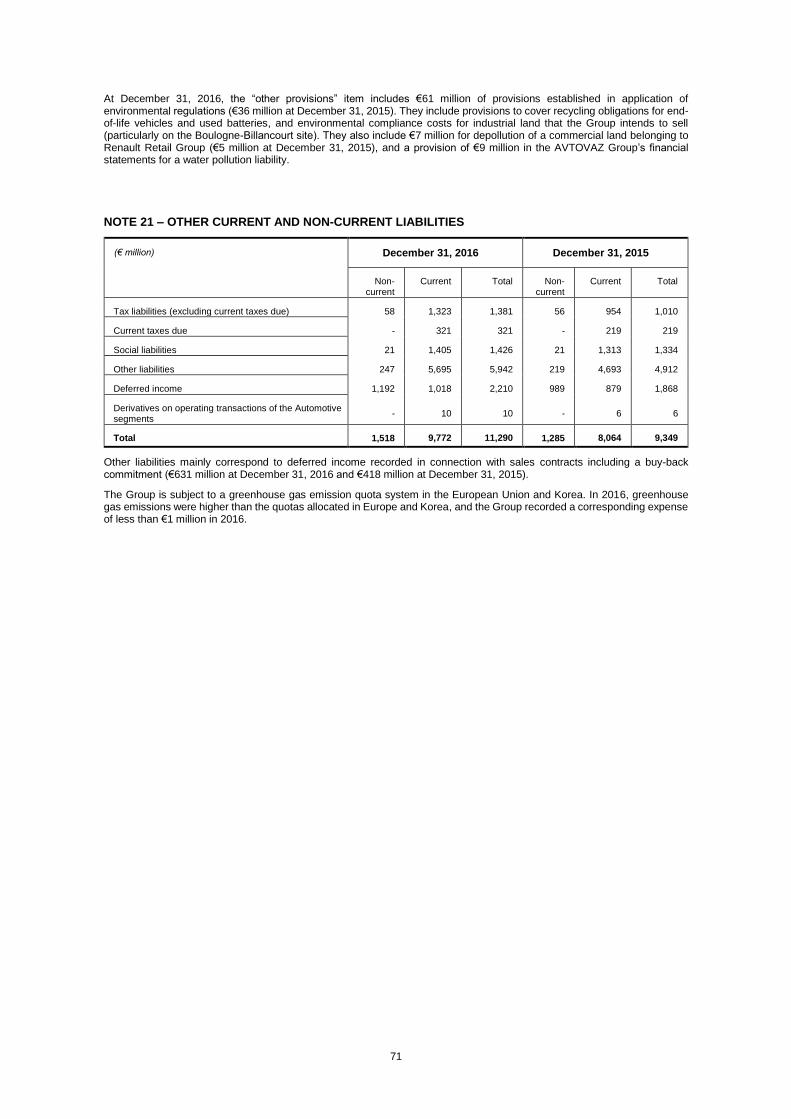
71
At December 31, 2016, the “other provisions” item includes €61 million of provisions established in application of environmental regulations (€36 million at December 31, 2015). They include provisions to cover recycling obligations for end-of-life vehicles and used batteries, and environmental compliance costs for industrial land that the Group intends to sell (particularly on the Boulogne-Billancourt site). They also include €7 million for depollution of a commercial land belonging to Renault Retail Group (€5 million at December 31, 2015), and a provision of €9 million in the AVTOVAZ Group’s financial statements for a water pollution liability.
NOTE 21 – OTHER CURRENT AND NON-CURRENT LIABILITIES
(€ million) December 31, 2016 December 31, 2015
Non- current
Current Total Non- current
Current Total
Tax liabilities (excluding current taxes due) 58 1,323 1,381 56 954 1,010
Current taxes due - 321 321 - 219 219
Social liabilities 21 1,405 1,426 21 1,313 1,334
Other liabilities 247 5,695 5,942 219 4,693 4,912
Deferred income 1,192 1,018 2,210 989 879 1,868
Derivatives on operating transactions of the Automotive segments
- 10 10 - 6 6
Total 1,518 9,772 11,290 1,285 8,064 9,349
Other liabilities mainly correspond to deferred income recorded in connection with sales contracts including a buy-back commitment (€631 million at December 31, 2016 and €418 million at December 31, 2015).
The Group is subject to a greenhouse gas emission quota system in the European Union and Korea. In 2016, greenhouse gas emissions were higher than the quotas allocated in Europe and Korea, and the Group recorded a corresponding expense of less than €1 million in 2016.
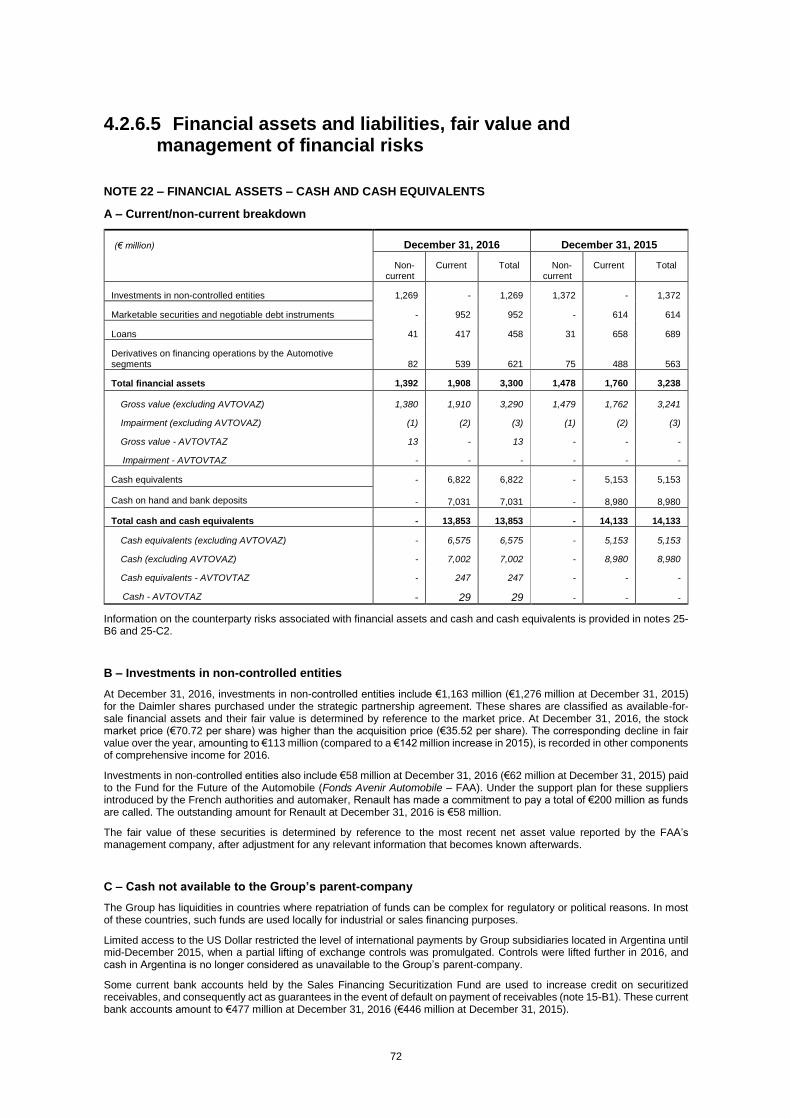
72
4.2.6.5 Financial assets and liabilities, fair value and management of financial risks
NOTE 22 – FINANCIAL ASSETS – CASH AND CASH EQUIVALENTS
A – Current/non-current breakdown
(€ million) December 31, 2016 December 31, 2015
Non-current
Current Total Non-current
Current Total
Investments in non-controlled entities 1,269 - 1,269 1,372 - 1,372
Marketable securities and negotiable debt instruments - 952 952 - 614 614
Loans 41 417 458 31 658 689
Derivatives on financing operations by the Automotive segments 82 539 621 75 488 563
Total financial assets 1,392 1,908 3,300 1,478 1,760 3,238
Gross value (excluding AVTOVAZ) 1,380 1,910 3,290 1,479 1,762 3,241
Impairment (excluding AVTOVAZ) (1) (2) (3) (1) (2) (3)
Gross value - AVTOVTAZ 13 - 13 - - -
Impairment - AVTOVTAZ - - - - - -
Cash equivalents - 6,822 6,822 - 5,153 5,153
Cash on hand and bank deposits - 7,031 7,031 - 8,980 8,980
Total cash and cash equivalents - 13,853 13,853 - 14,133 14,133
Cash equivalents (excluding AVTOVAZ) - 6,575 6,575 - 5,153 5,153
Cash (excluding AVTOVAZ) - 7,002 7,002 - 8,980 8,980
Cash equivalents - AVTOVTAZ - 247 247 - - -
Cash - AVTOVTAZ - 29 29 - - -
Information on the counterparty risks associated with financial assets and cash and cash equivalents is provided in notes 25-B6 and 25-C2.
B – Investments in non-controlled entities
At December 31, 2016, investments in non-controlled entities include €1,163 million (€1,276 million at December 31, 2015) for the Daimler shares purchased under the strategic partnership agreement. These shares are classified as available-for-sale financial assets and their fair value is determined by reference to the market price. At December 31, 2016, the stock market price (€70.72 per share) was higher than the acquisition price (€35.52 per share). The corresponding decline in fair value over the year, amounting to €113 million (compared to a €142 million increase in 2015), is recorded in other components of comprehensive income for 2016.
Investments in non-controlled entities also include €58 million at December 31, 2016 (€62 million at December 31, 2015) paid to the Fund for the Future of the Automobile (Fonds Avenir Automobile – FAA). Under the support plan for these suppliers introduced by the French authorities and automaker, Renault has made a commitment to pay a total of €200 million as funds are called. The outstanding amount for Renault at December 31, 2016 is €58 million.
The fair value of these securities is determined by reference to the most recent net asset value reported by the FAA’s management company, after adjustment for any relevant information that becomes known afterwards.
C – Cash not available to the Group’s parent-company
The Group has liquidities in countries where repatriation of funds can be complex for regulatory or political reasons. In most of these countries, such funds are used locally for industrial or sales financing purposes.
Limited access to the US Dollar restricted the level of international payments by Group subsidiaries located in Argentina until mid-December 2015, when a partial lifting of exchange controls was promulgated. Controls were lifted further in 2016, and cash in Argentina is no longer considered as unavailable to the Group’s parent-company.
Some current bank accounts held by the Sales Financing Securitization Fund are used to increase credit on securitized receivables, and consequently act as guarantees in the event of default on payment of receivables (note 15-B1). These current bank accounts amount to €477 million at December 31, 2016 (€446 million at December 31, 2015).
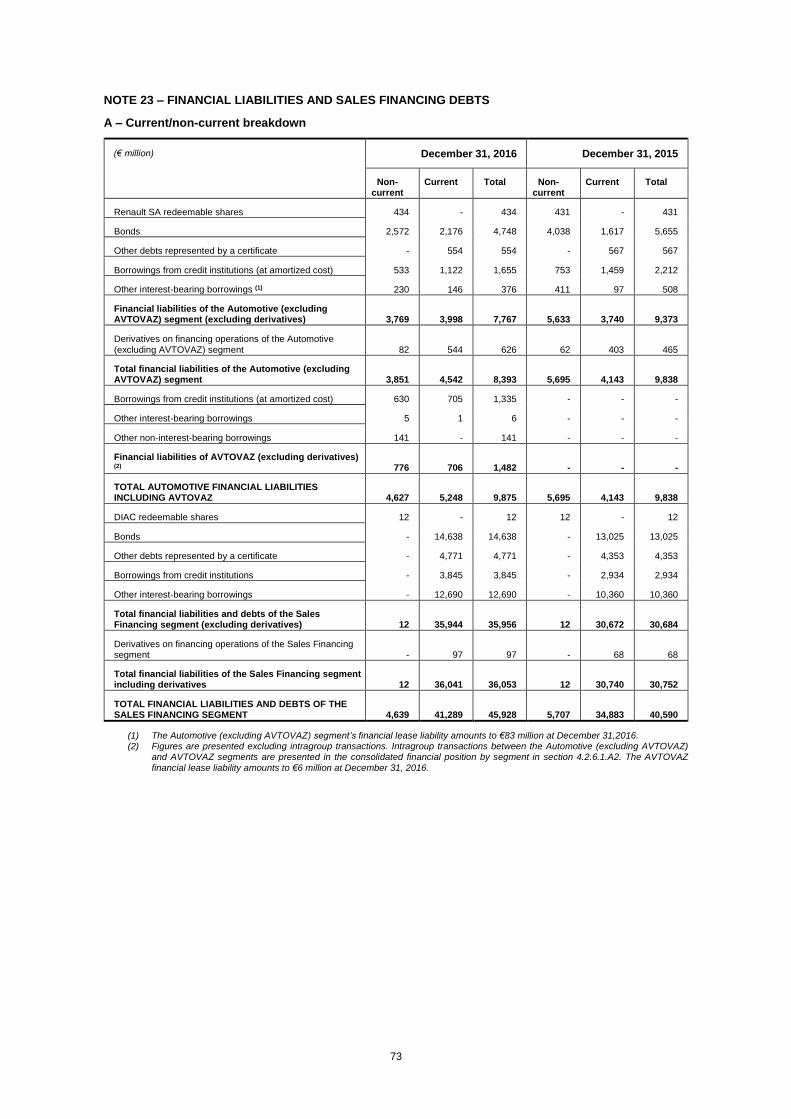
73
NOTE 23 – FINANCIAL LIABILITIES AND SALES FINANCING DEBTS
A – Current/non-current breakdown
(€ million) December 31, 2016 December 31, 2015
Non-current
Current Total Non-current
Current Total
Renault SA redeemable shares 434 - 434 431 - 431
Bonds 2,572 2,176 4,748 4,038 1,617 5,655
Other debts represented by a certificate - 554 554 - 567 567
Borrowings from credit institutions (at amortized cost) 533 1,122 1,655 753 1,459 2,212
Other interest-bearing borrowings (1) 230 146 376 411 97 508
Financial liabilities of the Automotive (excluding AVTOVAZ) segment (excluding derivatives) 3,769 3,998 7,767 5,633 3,740 9,373
Derivatives on financing operations of the Automotive (excluding AVTOVAZ) segment 82 544 626 62 403 465
Total financial liabilities of the Automotive (excluding AVTOVAZ) segment 3,851 4,542 8,393 5,695 4,143 9,838
Borrowings from credit institutions (at amortized cost) 630 705 1,335 - - -
Other interest-bearing borrowings 5 1 6 - - -
Other non-interest-bearing borrowings 141 - 141 - - -
Financial liabilities of AVTOVAZ (excluding derivatives) (2) 776 706 1,482 - - -
TOTAL AUTOMOTIVE FINANCIAL LIABILITIES INCLUDING AVTOVAZ 4,627 5,248 9,875 5,695 4,143 9,838
DIAC redeemable shares 12 - 12 12 - 12
Bonds - 14,638 14,638 - 13,025 13,025
Other debts represented by a certificate - 4,771 4,771 - 4,353 4,353
Borrowings from credit institutions - 3,845 3,845 - 2,934 2,934
Other interest-bearing borrowings - 12,690 12,690 - 10,360 10,360
Total financial liabilities and debts of the Sales Financing segment (excluding derivatives) 12 35,944 35,956 12 30,672 30,684
Derivatives on financing operations of the Sales Financing segment - 97 97 - 68 68
Total financial liabilities of the Sales Financing segment including derivatives 12 36,041 36,053 12 30,740 30,752
TOTAL FINANCIAL LIABILITIES AND DEBTS OF THE SALES FINANCING SEGMENT 4,639 41,289 45,928 5,707 34,883 40,590
(1) The Automotive (excluding AVTOVAZ) segment’s financial lease liability amounts to €83 million at December 31,2016. (2) Figures are presented excluding intragroup transactions. Intragroup transactions between the Automotive (excluding AVTOVAZ)
and AVTOVAZ segments are presented in the consolidated financial position by segment in section 4.2.6.1.A2. The AVTOVAZ
financial lease liability amounts to €6 million at December 31, 2016.
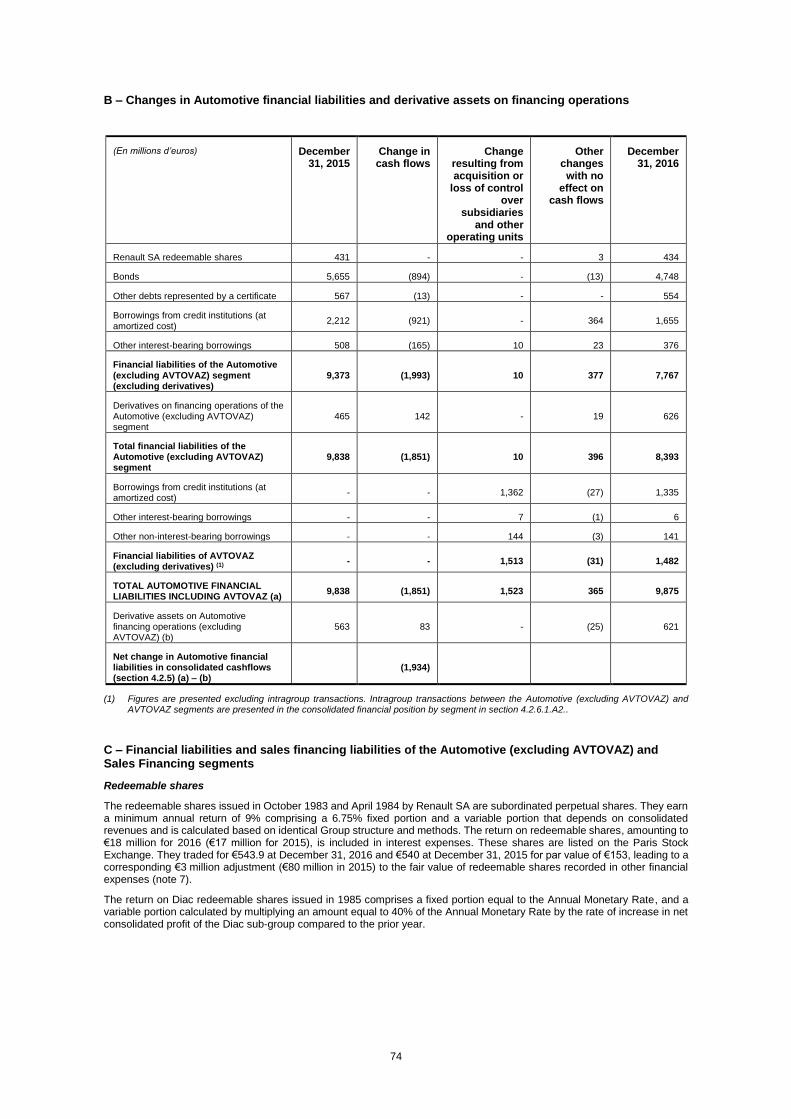
74
B – Changes in Automotive financial liabilities and derivative assets on financing operations
(En millions d’euros) December 31, 2015
Change in cash flows
Change resulting from acquisition or
loss of control over
subsidiaries and other
operating units
Other changes with no
effect on cash flows
December 31, 2016
Renault SA redeemable shares 431 - - 3 434
Bonds 5,655 (894) - (13) 4,748
Other debts represented by a certificate 567 (13) - - 554
Borrowings from credit institutions (at amortized cost)
2,212 (921) - 364 1,655
Other interest-bearing borrowings 508 (165) 10 23 376
Financial liabilities of the Automotive (excluding AVTOVAZ) segment (excluding derivatives)
9,373 (1,993) 10 377 7,767
Derivatives on financing operations of the Automotive (excluding AVTOVAZ) segment
465 142 - 19 626
Total financial liabilities of the Automotive (excluding AVTOVAZ) segment
9,838 (1,851) 10 396 8,393
Borrowings from credit institutions (at amortized cost)
- - 1,362 (27) 1,335
Other interest-bearing borrowings - - 7 (1) 6
Other non-interest-bearing borrowings - - 144 (3) 141
Financial liabilities of AVTOVAZ (excluding derivatives) (1)
- - 1,513 (31) 1,482
TOTAL AUTOMOTIVE FINANCIAL LIABILITIES INCLUDING AVTOVAZ (a)
9,838 (1,851) 1,523 365 9,875
Derivative assets on Automotive financing operations (excluding AVTOVAZ) (b)
563 83 - (25) 621
Net change in Automotive financial liabilities in consolidated cashflows (section 4.2.5) (a) – (b)
(1,934)
(1) Figures are presented excluding intragroup transactions. Intragroup transactions between the Automotive (excluding AVTOVAZ) and AVTOVAZ segments are presented in the consolidated financial position by segment in section 4.2.6.1.A2..
C – Financial liabilities and sales financing liabilities of the Automotive (excluding AVTOVAZ) and Sales Financing segments
Redeemable shares
The redeemable shares issued in October 1983 and April 1984 by Renault SA are subordinated perpetual shares. They earn a minimum annual return of 9% comprising a 6.75% fixed portion and a variable portion that depends on consolidated revenues and is calculated based on identical Group structure and methods. The return on redeemable shares, amounting to €18 million for 2016 (€17 million for 2015), is included in interest expenses. These shares are listed on the Paris Stock Exchange. They traded for €543.9 at December 31, 2016 and €540 at December 31, 2015 for par value of €153, leading to a corresponding €3 million adjustment (€80 million in 2015) to the fair value of redeemable shares recorded in other financial expenses (note 7).
The return on Diac redeemable shares issued in 1985 comprises a fixed portion equal to the Annual Monetary Rate, and a variable portion calculated by multiplying an amount equal to 40% of the Annual Monetary Rate by the rate of increase in net consolidated profit of the Diac sub-group compared to the prior year.
75
Changes in bonds of the Automotive (excluding AVTOVAZ) segment
Renault issued a private placement bond under its EMTN programme (¥10 billion and 3-year maturity), and a Samurai bond
on the Japanese market as part of its “Shelf Registration” programme (¥50 billion and 3-year maturity).
Over the same period, the Brazilian subsidiary Renault do Brasil issued a 4-year bond of 400 million Brazilian reals. This bond
is redeemable quarterly.
The total amount of bonds issued by the Automotive (excluding AVTOVAZ) segment in 2016 is €616 million.
In 2016, Renault SA redeemed bonds for a total amount of €1,490 million, and Renault do Brasil redeemed €20 million of the bond issued in March 2016.
Changes in debts of the Sales Financing segment
In 2016 the RCI Banque group redeemed bonds for a total of €3,673 million, and issued new bonds totalling €5,353 million and maturing between 2017 and 2023.
New savings collected rose by €2,342 million during 2016 (€1,695 million of sight deposits and €647 million of term deposits) to €12,576 million (€9,027 million of sight deposits and €3,549 million of term deposits), and are classified as other interest-bearing borrowings. These savings are collected in Germany, Austria, France and the United Kingdom.
Credit lines
At December 31, 2016, Renault SA had confirmed credit lines opened with banks worth €3,305 million (as at December 31, 2015). These credit lines were unused at December 31, 2016 and 2015.
Also, at December 31, 2016, the Sales Financing segment’s confirmed credit lines opened in several currencies with banks amounted to €4,637 million (€4,882 at December 31, 2015). These credit lines were unused at December 31, 2016 and 2015.
The contractual documentation for financial liabilities and confirmed credit lines contains no clause that could affect the continued supply of credit in the event of any change in Renault’s credit rating or financial ratio compliance.
Breakdown by maturity
For financial liabilities including derivatives, contractual flows are similar to the expected flows and correspond to the amounts to be paid.
For floating-rate financial instruments, interest is calculated using interest rates as at December 31, 2016.
No contractual flows are reported for Renault and Diac redeemable shares as they have no fixed redemption date.
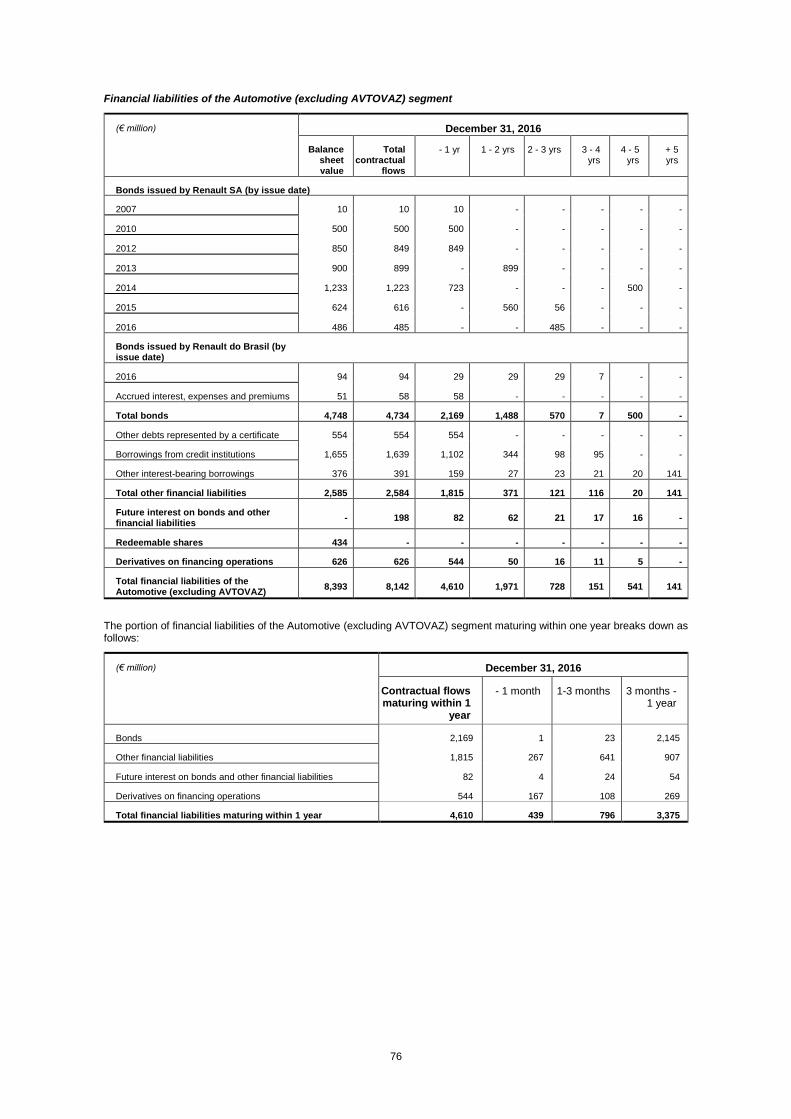
76
Financial liabilities of the Automotive (excluding AVTOVAZ) segment
(€ million) December 31, 2016
Balance sheet value
Total contractual
flows
- 1 yr 1 - 2 yrs 2 - 3 yrs 3 - 4 yrs
4 - 5 yrs
+ 5 yrs
Bonds issued by Renault SA (by issue date)
2007 10 10 10 - - - - -
2010 500 500 500 - - - - -
2012 850 849 849 - - - - -
2013 900 899 - 899 - - - -
2014 1,233 1,223 723 - - - 500 -
2015 624 616 - 560 56 - - -
2016 486 485 - - 485 - - -
Bonds issued by Renault do Brasil (by issue date)
2016 94 94 29 29 29 7 - -
Accrued interest, expenses and premiums 51 58 58 - - - - -
Total bonds 4,748 4,734 2,169 1,488 570 7 500 -
Other debts represented by a certificate 554 554 554 - - - - -
Borrowings from credit institutions 1,655 1,639 1,102 344 98 95 - -
Other interest-bearing borrowings 376 391 159 27 23 21 20 141
Total other financial liabilities 2,585 2,584 1,815 371 121 116 20 141
Future interest on bonds and other financial liabilities
- 198 82 62 21 17 16 -
Redeemable shares 434 - - - - - - -
Derivatives on financing operations 626 626 544 50 16 11 5 -
Total financial liabilities of the Automotive (excluding AVTOVAZ) segment
8,393 8,142 4,610 1,971 728 151 541 141
The portion of financial liabilities of the Automotive (excluding AVTOVAZ) segment maturing within one year breaks down as follows:
(€ million) December 31, 2016
Contractual flows maturing within 1
year
- 1 month 1-3 months
3 months - 1 year
Bonds 2,169 1 23 2,145
Other financial liabilities 1,815 267 641 907
Future interest on bonds and other financial liabilities 82 4 24 54
Derivatives on financing operations 544 167 108 269
Total financial liabilities maturing within 1 year 4,610 439 796 3,375
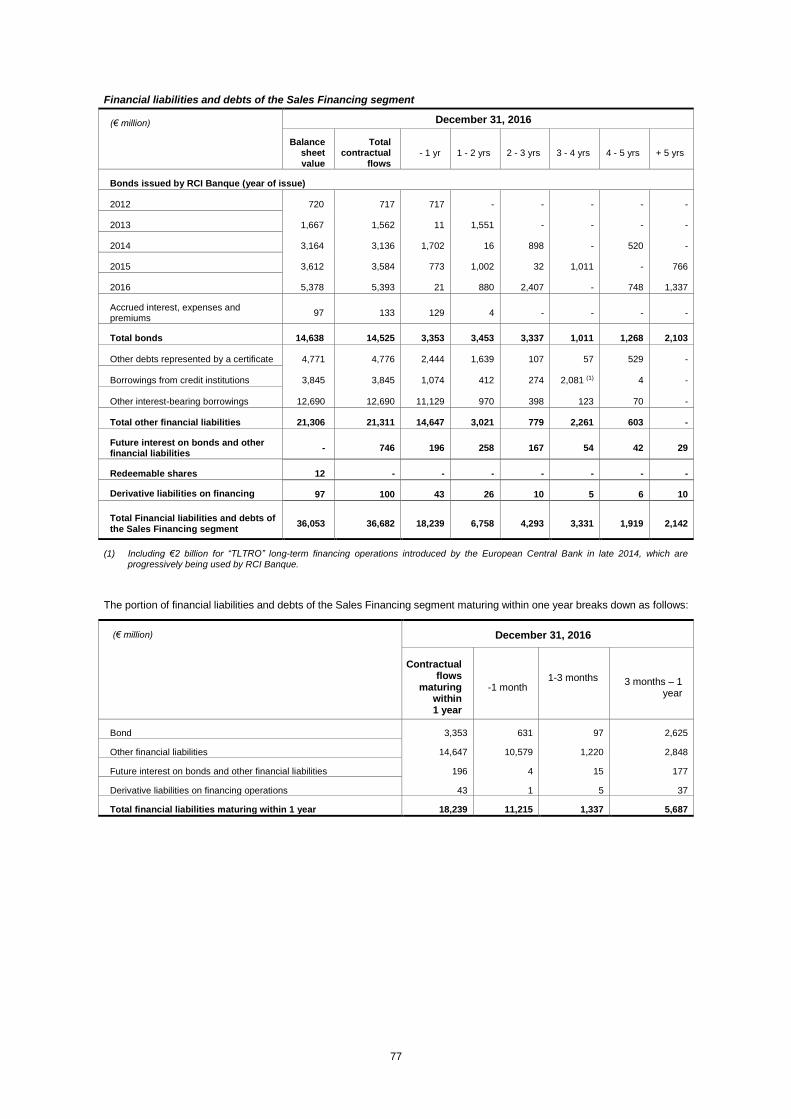
77
Financial liabilities and debts of the Sales Financing segment
(€ million) December 31, 2016
Balance sheet value
Total contractual
flows - 1 yr 1 - 2 yrs 2 - 3 yrs 3 - 4 yrs 4 - 5 yrs + 5 yrs
Bonds issued by RCI Banque (year of issue)
2012 720 717 717 - - - - -
2013 1,667 1,562 11 1,551 - - - -
2014 3,164 3,136 1,702 16 898 - 520 -
2015 3,612 3,584 773 1,002 32 1,011 - 766
2016 5,378 5,393 21 880 2,407 - 748 1,337
Accrued interest, expenses and premiums
97 133 129 4 - - - -
Total bonds 14,638 14,525 3,353 3,453 3,337 1,011 1,268 2,103
Other debts represented by a certificate 4,771 4,776 2,444 1,639 107 57 529 -
Borrowings from credit institutions 3,845 3,845 1,074 412 274 2,081 (1) 4 -
Other interest-bearing borrowings 12,690 12,690 11,129 970 398 123 70 -
Total other financial liabilities 21,306 21,311 14,647 3,021 779 2,261 603 -
Future interest on bonds and other financial liabilities
- 746 196 258 167 54 42 29
Redeemable shares 12 - - - - - - -
Derivative liabilities on financing operations
97 100 43 26 10 5 6 10
Total Financial liabilities and debts of the Sales Financing segment
36,053 36,682 18,239 6,758 4,293 3,331 1,919 2,142
(1) Including €2 billion for “TLTRO” long-term financing operations introduced by the European Central Bank in late 2014, which are progressively being used by RCI Banque.
The portion of financial liabilities and debts of the Sales Financing segment maturing within one year breaks down as follows:
(€ million) December 31, 2016
Contractual flows
maturing within 1 year
-1 month 1-3 months
3 months – 1 year
Bond 3,353 631 97 2,625
Other financial liabilities 14,647 10,579 1,220 2,848
Future interest on bonds and other financial liabilities 196 4 15 177
Derivative liabilities on financing operations 43 1 5 37
Total financial liabilities maturing within 1 year 18,239 11,215 1,337 5,687
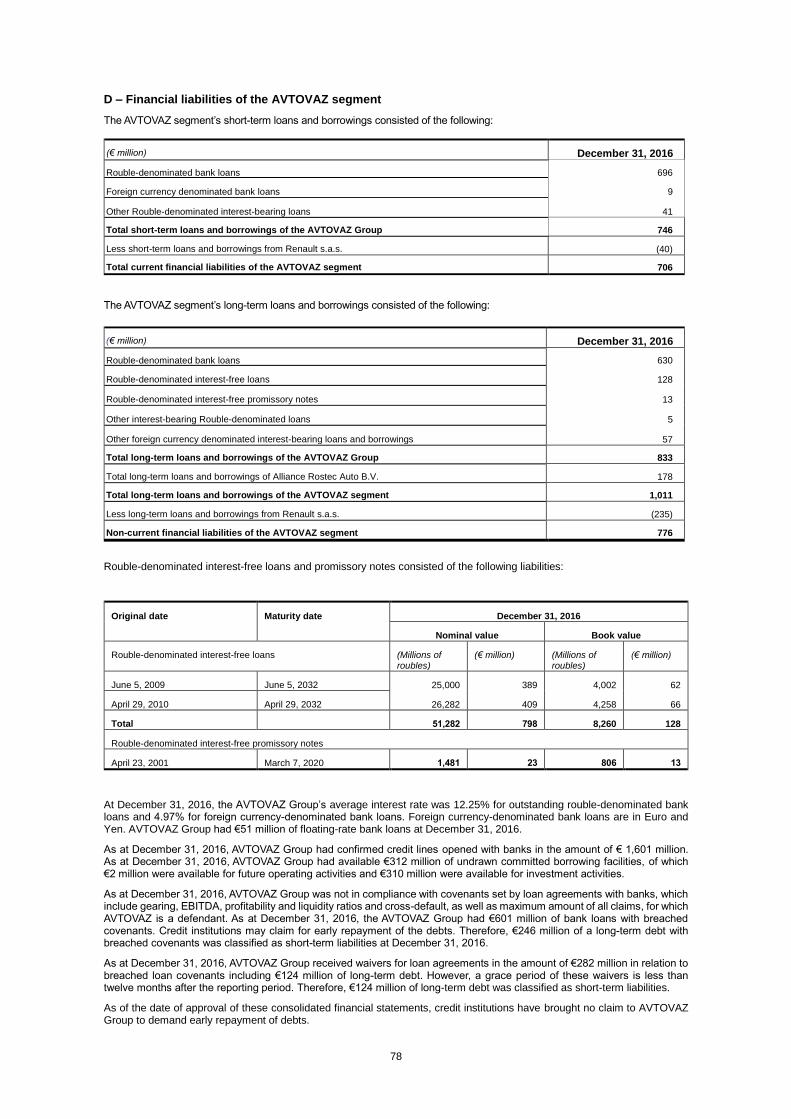
78
D – Financial liabilities of the AVTOVAZ segment
The AVTOVAZ segment’s short-term loans and borrowings consisted of the following:
(€ million) December 31, 2016
Rouble-denominated bank loans 696
Foreign currency denominated bank loans 9
Other Rouble-denominated interest-bearing loans 41
Total short-term loans and borrowings of the AVTOVAZ Group 746
Less short-term loans and borrowings from Renault s.a.s. (40)
Total current financial liabilities of the AVTOVAZ segment 706
The AVTOVAZ segment’s long-term loans and borrowings consisted of the following:
(€ million) December 31, 2016
Rouble-denominated bank loans 630
Rouble-denominated interest-free loans 128
Rouble-denominated interest-free promissory notes 13
Other interest-bearing Rouble-denominated loans 5
Other foreign currency denominated interest-bearing loans and borrowings 57
Total long-term loans and borrowings of the AVTOVAZ Group 833
Total long-term loans and borrowings of Alliance Rostec Auto B.V. 178
Total long-term loans and borrowings of the AVTOVAZ segment 1,011
Less long-term loans and borrowings from Renault s.a.s. (235)
Non-current financial liabilities of the AVTOVAZ segment 776
Rouble-denominated interest-free loans and promissory notes consisted of the following liabilities:
Original date Maturity date December 31, 2016
Nominal value Book value
Rouble-denominated interest-free loans (Millions of roubles)
(€ million) (Millions of roubles)
(€ million)
June 5, 2009 June 5, 2032 25,000 389 4,002 62
April 29, 2010 April 29, 2032 26,282 409 4,258 66
Total 51,282 798 8,260 128
Rouble-denominated interest-free promissory notes
April 23, 2001 March 7, 2020 1,481 23 806 13
At December 31, 2016, the AVTOVAZ Group’s average interest rate was 12.25% for outstanding rouble-denominated bank loans and 4.97% for foreign currency-denominated bank loans. Foreign currency-denominated bank loans are in Euro and Yen. AVTOVAZ Group had €51 million of floating-rate bank loans at December 31, 2016.
As at December 31, 2016, AVTOVAZ Group had confirmed credit lines opened with banks in the amount of € 1,601 million. As at December 31, 2016, AVTOVAZ Group had available €312 million of undrawn committed borrowing facilities, of which €2 million were available for future operating activities and €310 million were available for investment activities.
As at December 31, 2016, AVTOVAZ Group was not in compliance with covenants set by loan agreements with banks, which include gearing, EBITDA, profitability and liquidity ratios and cross-default, as well as maximum amount of all claims, for which AVTOVAZ is a defendant. As at December 31, 2016, the AVTOVAZ Group had €601 million of bank loans with breached covenants. Credit institutions may claim for early repayment of the debts. Therefore, €246 million of a long-term debt with breached covenants was classified as short-term liabilities at December 31, 2016.
As at December 31, 2016, AVTOVAZ Group received waivers for loan agreements in the amount of €282 million in relation to breached loan covenants including €124 million of long-term debt. However, a grace period of these waivers is less than twelve months after the reporting period. Therefore, €124 million of long-term debt was classified as short-term liabilities.
As of the date of approval of these consolidated financial statements, credit institutions have brought no claim to AVTOVAZ Group to demand early repayment of debts.
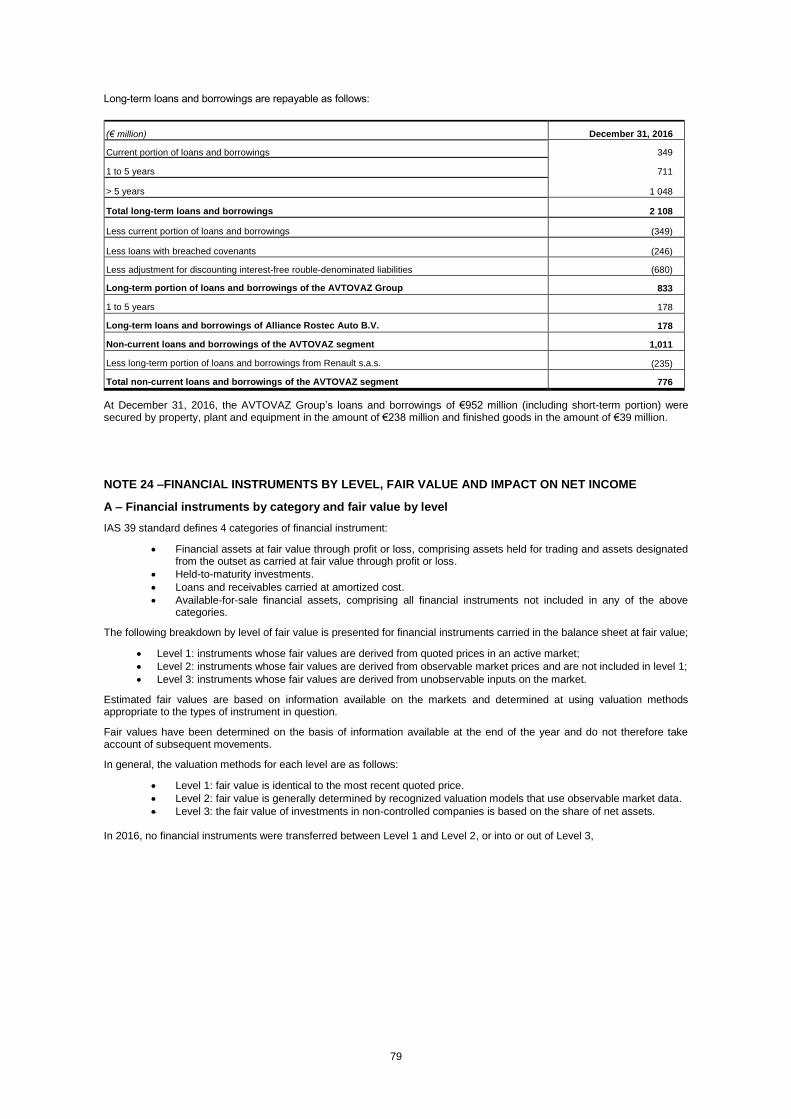
79
Long-term loans and borrowings are repayable as follows:
(€ million) December 31, 2016
Current portion of loans and borrowings 349
1 to 5 years 711
> 5 years 1 048
Total long-term loans and borrowings 2 108
Less current portion of loans and borrowings (349)
Less loans with breached covenants (246)
Less adjustment for discounting interest-free rouble-denominated liabilities (680)
Long-term portion of loans and borrowings of the AVTOVAZ Group 833
1 to 5 years 178
Long-term loans and borrowings of Alliance Rostec Auto B.V. 178
Non-current loans and borrowings of the AVTOVAZ segment 1,011
Less long-term portion of loans and borrowings from Renault s.a.s. (235)
Total non-current loans and borrowings of the AVTOVAZ segment 776
At December 31, 2016, the AVTOVAZ Group’s loans and borrowings of €952 million (including short-term portion) were secured by property, plant and equipment in the amount of €238 million and finished goods in the amount of €39 million.
NOTE 24 –FINANCIAL INSTRUMENTS BY LEVEL, FAIR VALUE AND IMPACT ON NET INCOME
A – Financial instruments by category and fair value by level
IAS 39 standard defines 4 categories of financial instrument:
Financial assets at fair value through profit or loss, comprising assets held for trading and assets designated from the outset as carried at fair value through profit or loss.
Held-to-maturity investments.
Loans and receivables carried at amortized cost.
Available-for-sale financial assets, comprising all financial instruments not included in any of the above categories.
The following breakdown by level of fair value is presented for financial instruments carried in the balance sheet at fair value;
Level 1: instruments whose fair values are derived from quoted prices in an active market;
Level 2: instruments whose fair values are derived from observable market prices and are not included in level 1;
Level 3: instruments whose fair values are derived from unobservable inputs on the market.
Estimated fair values are based on information available on the markets and determined at using valuation methods appropriate to the types of instrument in question.
Fair values have been determined on the basis of information available at the end of the year and do not therefore take account of subsequent movements.
In general, the valuation methods for each level are as follows:
Level 1: fair value is identical to the most recent quoted price.
Level 2: fair value is generally determined by recognized valuation models that use observable market data.
Level 3: the fair value of investments in non-controlled companies is based on the share of net assets. In 2016, no financial instruments were transferred between Level 1 and Level 2, or into or out of Level 3,

80
(€ million)
Notes
December 31, 2016
FINANCIAL ASSETS
AND OTHER ASSETS
Balance sheet value
Fair value of financial assets
at amortized cost
Fair value level of financial assets at fair
value
Held for trading
Initially designated as
measured at fair value through profit and loss
Hedging derivatives
Available for sale
Loans and receivables
Level 1 Level 2 Level 3
Loans 22 - - - - 458 (1)
Sales financing receivables 15 - - - - 34,358 34,402 (2)
Automotive customer receivables 16 - - - - 1,914 (1)
Tax receivables (including current taxes due)
17 - - - - 2,298 (1)
Other receivables and prepaid expenses
17 - - - - 2,395 (1)
Cash equivalents 22 - - - - 6,634 (1)
Cash 22 - - - - 7,031 (1)
Total financial assets recorded at amortized cost
- - - - 55,088
Marketable securities and negotiable debt instruments
22 - - - 952 - 952 - -
Investments in non-controlled entities
22 - - - 1,269 -
1,163 - 106
Investments in unconsolidated controlled entities
17 - - - 82 -
- - 82
Derivatives on financing operations
of the Automotive segments 22 - - 1 - -
- 1 -
Derivatives on operating transactions of the Automotive segments
17 - - 4 - - - 4 -
Derivatives on financing operations of the Sales Financing segment
17 - - 43 - -
- 43 -
Financial assets at fair value through equity
- - 48 2,303 -
2,115 48 188
Other receivables (3) 17 - 5 - - -
- 5 -
Derivatives on financing operations of the Automotive segments
22 615 - 5 - - - 620 -
Derivatives on operating transactions of the Automotive segments
17 - - - - - - - -
Derivatives on financing operations of the Sales Financing segment
17 36 - 159 - -
- 195 -
Cash equivalents 22 51 - - 137 -
188 - -
Financial assets at fair value through profit and loss
702 5 164 137 -
188 820 -
Total financial assets recorded at fair value
702 5 212 2,440 -
2,303 868 188
(1) The Group does not report the fair value of financial assets such as trade receivables of the Automotive segments, tax receivables or cash and cash equivalents because their net book value after impairment is a reasonable approximation of their fair value.
(2) The fair value of sales financing receivables is estimated by discounting future cash flows at rates that would be applicable to similar
loans (conditions, maturity and debtor quality) at the year-end. Receivables with a term of less than one year are not discounted, as their fair value does not differ significantly from their net book value. This is a level 3 fair value, as it uses recognized models for which certain significant data, such as the credit risk associated with the portfolio of receivables, are not based on observable market data.
(3) Short-term assets of the AVTOVAZ pension fund at fair value through profit or loss.
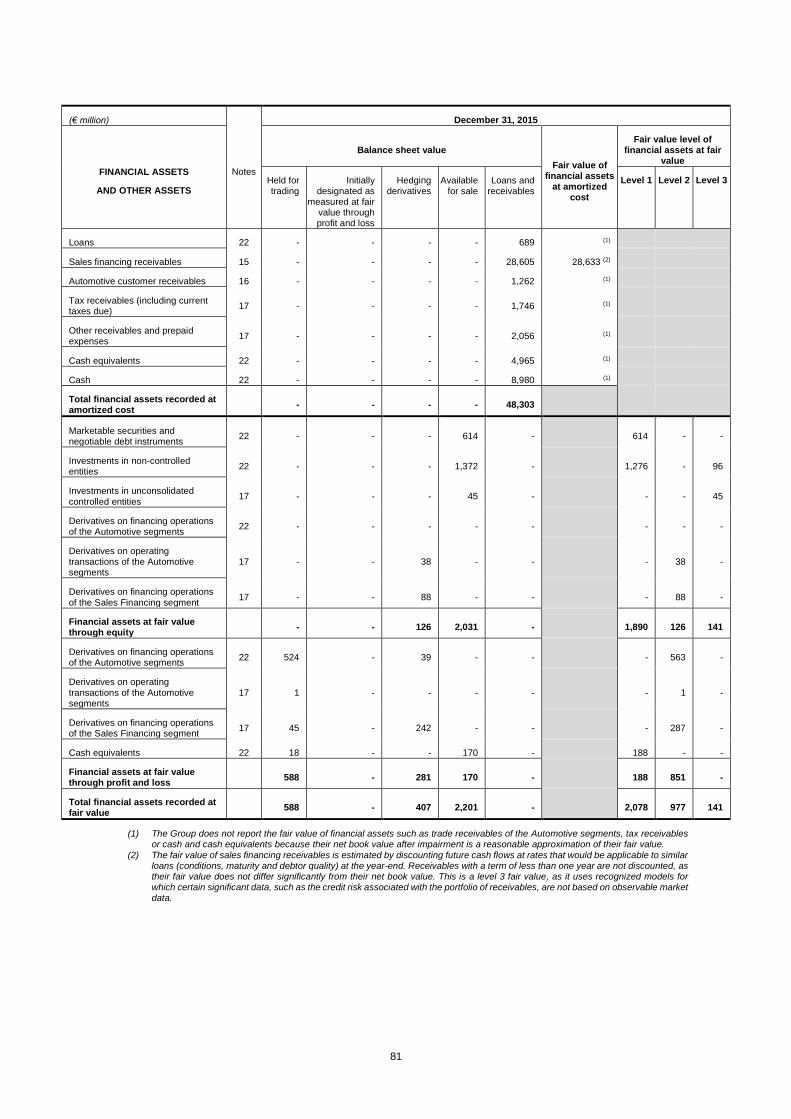
81
(€ million)
Notes
December 31, 2015
FINANCIAL ASSETS
AND OTHER ASSETS
Balance sheet value
Fair value of financial assets
at amortized cost
Fair value level of financial assets at fair
value
Held for trading
Initially designated as
measured at fair value through profit and loss
Hedging derivatives
Available for sale
Loans and receivables
Level 1 Level 2 Level 3
Loans 22 - - - - 689 (1)
Sales financing receivables 15 - - - - 28,605 28,633 (2)
Automotive customer receivables 16 - - - - 1,262 (1)
Tax receivables (including current taxes due)
17 - - - - 1,746 (1)
Other receivables and prepaid expenses
17 - - - - 2,056 (1)
Cash equivalents 22 - - - - 4,965 (1)
Cash 22 - - - - 8,980 (1)
Total financial assets recorded at amortized cost
- - - - 48,303
Marketable securities and negotiable debt instruments
22 - - - 614 - 614 - -
Investments in non-controlled entities
22 - - - 1,372 -
1,276 - 96
Investments in unconsolidated controlled entities
17 - - - 45 -
- - 45
Derivatives on financing operations of the Automotive segments
22 - - - - -
- - -
Derivatives on operating transactions of the Automotive segments
17 - - 38 - - - 38 -
Derivatives on financing operations of the Sales Financing segment
17 - - 88 - -
- 88 -
Financial assets at fair value through equity
- - 126 2,031 -
1,890 126 141
Derivatives on financing operations of the Automotive segments
22 524 - 39 - -
- 563 -
Derivatives on operating transactions of the Automotive segments
17 1 - - - - - 1 -
Derivatives on financing operations of the Sales Financing segment
17 45 - 242 - -
- 287 -
Cash equivalents 22 18 - - 170 -
188 - -
Financial assets at fair value through profit and loss
588 - 281 170 -
188 851 -
Total financial assets recorded at fair value
588 - 407 2,201 -
2,078 977 141
(1) The Group does not report the fair value of financial assets such as trade receivables of the Automotive segments, tax receivables or cash and cash equivalents because their net book value after impairment is a reasonable approximation of their fair value.
(2) The fair value of sales financing receivables is estimated by discounting future cash flows at rates that would be applicable to similar loans (conditions, maturity and debtor quality) at the year-end. Receivables with a term of less than one year are not discounted, as their fair value does not differ significantly from their net book value. This is a level 3 fair value, as it uses recognized models for which certain significant data, such as the credit risk associated with the portfolio of receivables, are not based on observable market data.
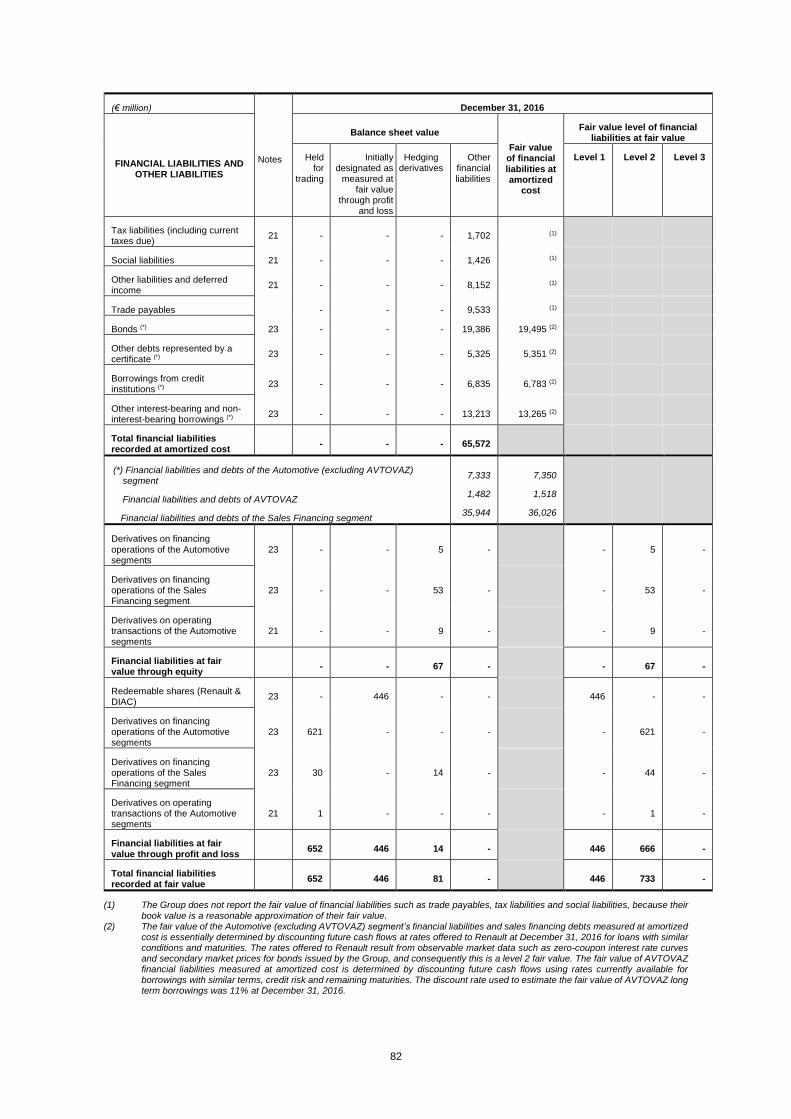
82
(€ million)
Notes
December 31, 2016
FINANCIAL LIABILITIES AND OTHER LIABILITIES
Balance sheet value
Fair value of financial liabilities at amortized
cost
Fair value level of financial liabilities at fair value
Held for
trading
Initially designated as
measured at fair value
through profit and loss
Hedging derivatives
Other financial liabilities
Level 1 Level 2 Level 3
Tax liabilities (including current taxes due)
21 - - - 1,702 (1)
Social liabilities 21 - - - 1,426 (1)
Other liabilities and deferred income
21 - - - 8,152 (1)
Trade payables - - - 9,533 (1)
Bonds (*) 23 - - - 19,386 19,495 (2)
Other debts represented by a certificate (*)
23 - - - 5,325 5,351 (2)
Borrowings from credit institutions (*)
23 - - - 6,835 6,783 (2)
Other interest-bearing and non-interest-bearing borrowings (*)
23 - - - 13,213 13,265 (2)
Total financial liabilities recorded at amortized cost
- - - 65,572
(*) Financial liabilities and debts of the Automotive (excluding AVTOVAZ) segment
Financial liabilities and debts of AVTOVAZ
Financial liabilities and debts of the Sales Financing segment
7,333
1,482
35,944
7,350
1,518
36,026
Derivatives on financing
operations of the Automotive segments
23 - - 5 -
- 5 -
Derivatives on financing operations of the Sales Financing segment
23 - - 53 - - 53 -
Derivatives on operating transactions of the Automotive segments
21 - - 9 - - 9 -
Financial liabilities at fair value through equity
- - 67 -
- 67 -
Redeemable shares (Renault & DIAC)
23 - 446 - -
446 - -
Derivatives on financing operations of the Automotive segments
23 621 - - -
- 621 -
Derivatives on financing operations of the Sales Financing segment
23 30 - 14 -
- 44 -
Derivatives on operating transactions of the Automotive segments
21 1 - - - - 1 -
Financial liabilities at fair value through profit and loss
652 446 14 -
446 666 -
Total financial liabilities recorded at fair value
652 446 81 -
446 733 -
(1) The Group does not report the fair value of financial liabilities such as trade payables, tax liabilities and social liabilities, because their
book value is a reasonable approximation of their fair value. (2) The fair value of the Automotive (excluding AVTOVAZ) segment’s financial liabilities and sales financing debts measured at amortized
cost is essentially determined by discounting future cash flows at rates offered to Renault at December 31, 2016 for loans with similar conditions and maturities. The rates offered to Renault result from observable market data such as zero-coupon interest rate curves and secondary market prices for bonds issued by the Group, and consequently this is a level 2 fair value. The fair value of AVTOVAZ financial liabilities measured at amortized cost is determined by discounting future cash flows using rates currently available for borrowings with similar terms, credit risk and remaining maturities. The discount rate used to estimate the fair value of AVTOVAZ long term borrowings was 11% at December 31, 2016.
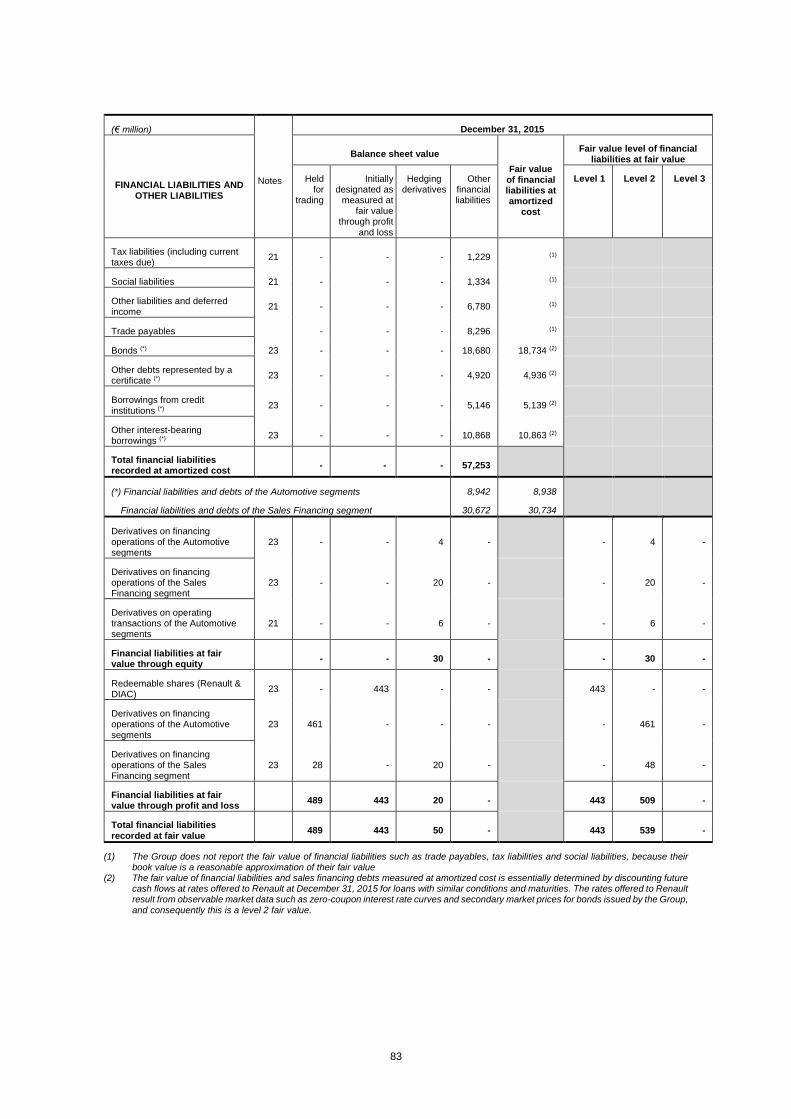
83
(€ million)
Notes
December 31, 2015
FINANCIAL LIABILITIES AND OTHER LIABILITIES
Balance sheet value
Fair value of financial liabilities at amortized
cost
Fair value level of financial liabilities at fair value
Held for
trading
Initially designated as
measured at fair value
through profit and loss
Hedging derivatives
Other financial liabilities
Level 1 Level 2 Level 3
Tax liabilities (including current taxes due)
21 - - - 1,229 (1)
Social liabilities 21 - - - 1,334 (1)
Other liabilities and deferred income
21 - - - 6,780 (1)
Trade payables - - - 8,296 (1)
Bonds (*) 23 - - - 18,680 18,734 (2)
Other debts represented by a certificate (*)
23 - - - 4,920 4,936 (2)
Borrowings from credit institutions (*)
23 - - - 5,146 5,139 (2)
Other interest-bearing borrowings (*)
23 - - - 10,868 10,863 (2)
Total financial liabilities recorded at amortized cost
- - - 57,253
(*) Financial liabilities and debts of the Automotive segments
Financial liabilities and debts of the Sales Financing segment
8,942
30,672
8,938
30,734
Derivatives on financing operations of the Automotive segments
23 - - 4 -
- 4 -
Derivatives on financing operations of the Sales Financing segment
23 - - 20 - - 20 -
Derivatives on operating transactions of the Automotive segments
21 - - 6 - - 6 -
Financial liabilities at fair value through equity
- - 30 -
- 30 -
Redeemable shares (Renault & DIAC)
23 - 443 - -
443 - -
Derivatives on financing operations of the Automotive segments
23 461 - - -
- 461 -
Derivatives on financing operations of the Sales Financing segment
23 28 - 20 -
- 48 -
Financial liabilities at fair value through profit and loss
489 443 20 -
443 509 -
Total financial liabilities recorded at fair value
489 443 50 -
443 539 -
(1) The Group does not report the fair value of financial liabilities such as trade payables, tax liabilities and social liabilities, because their book value is a reasonable approximation of their fair value
(2) The fair value of financial liabilities and sales financing debts measured at amortized cost is essentially determined by discounting future cash flows at rates offered to Renault at December 31, 2015 for loans with similar conditions and maturities. The rates offered to Renault result from observable market data such as zero-coupon interest rate curves and secondary market prices for bonds issued by the Group,
and consequently this is a level 2 fair value.
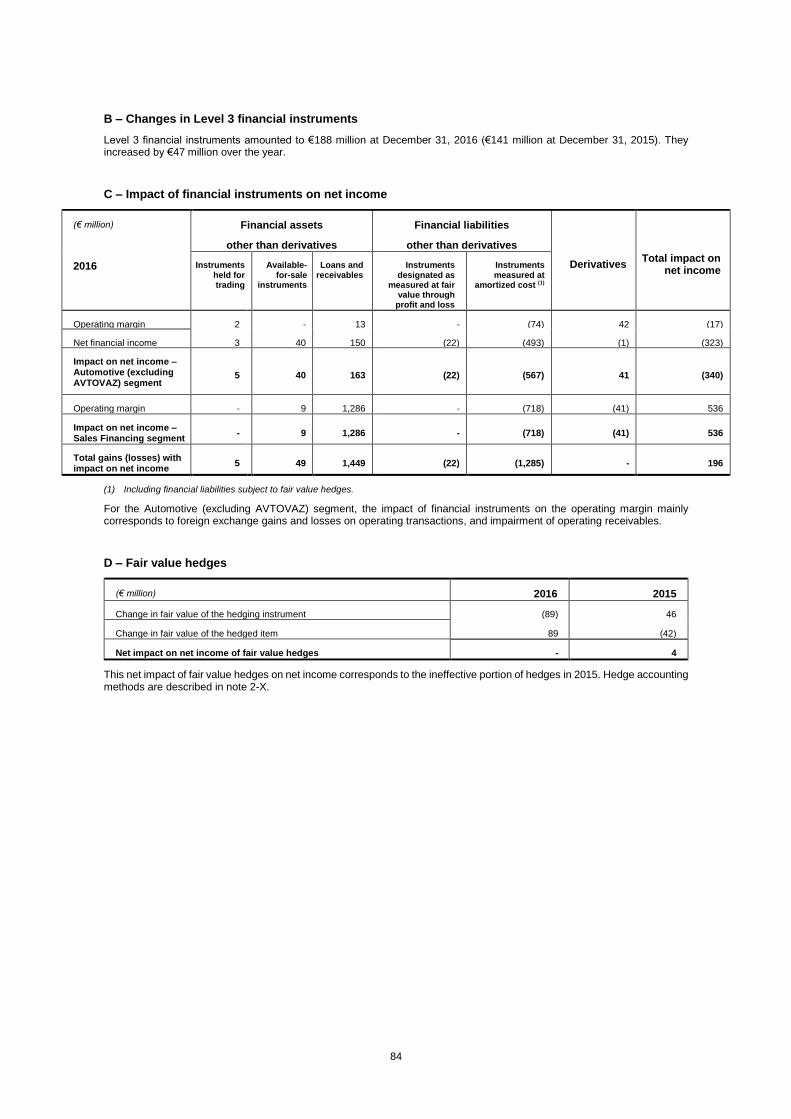
84
B – Changes in Level 3 financial instruments
Level 3 financial instruments amounted to €188 million at December 31, 2016 (€141 million at December 31, 2015). They increased by €47 million over the year.
C – Impact of financial instruments on net income
(€ million)
Financial assets
other than derivatives
Financial liabilities
other than derivatives
Derivatives Total impact on
net income 2016
Instruments held for trading
Available-for-sale
instruments
Loans and receivables
Instruments designated as
measured at fair value through
profit and loss
Instruments measured at
amortized cost (1)
Operating margin
2 - 13 - (74) 42 (17)
Net financial income (expenses)
3 40 150 (22) (493) (1) (323)
Impact on net income – Automotive (excluding AVTOVAZ) segment
5 40 163 (22) (567) 41 (340)
Operating margin - 9 1,286 - (718) (41) 536
Impact on net income – Sales Financing segment
- 9 1,286 - (718) (41) 536
Total gains (losses) with impact on net income
5 49 1,449 (22) (1,285) - 196
(1) Including financial liabilities subject to fair value hedges.
For the Automotive (excluding AVTOVAZ) segment, the impact of financial instruments on the operating margin mainly corresponds to foreign exchange gains and losses on operating transactions, and impairment of operating receivables.
D – Fair value hedges
(€ million) 2016 2015
Change in fair value of the hedging instrument (89) 46
Change in fair value of the hedged item 89 (42)
Net impact on net income of fair value hedges - 4
This net impact of fair value hedges on net income corresponds to the ineffective portion of hedges in 2015. Hedge accounting methods are described in note 2-X.
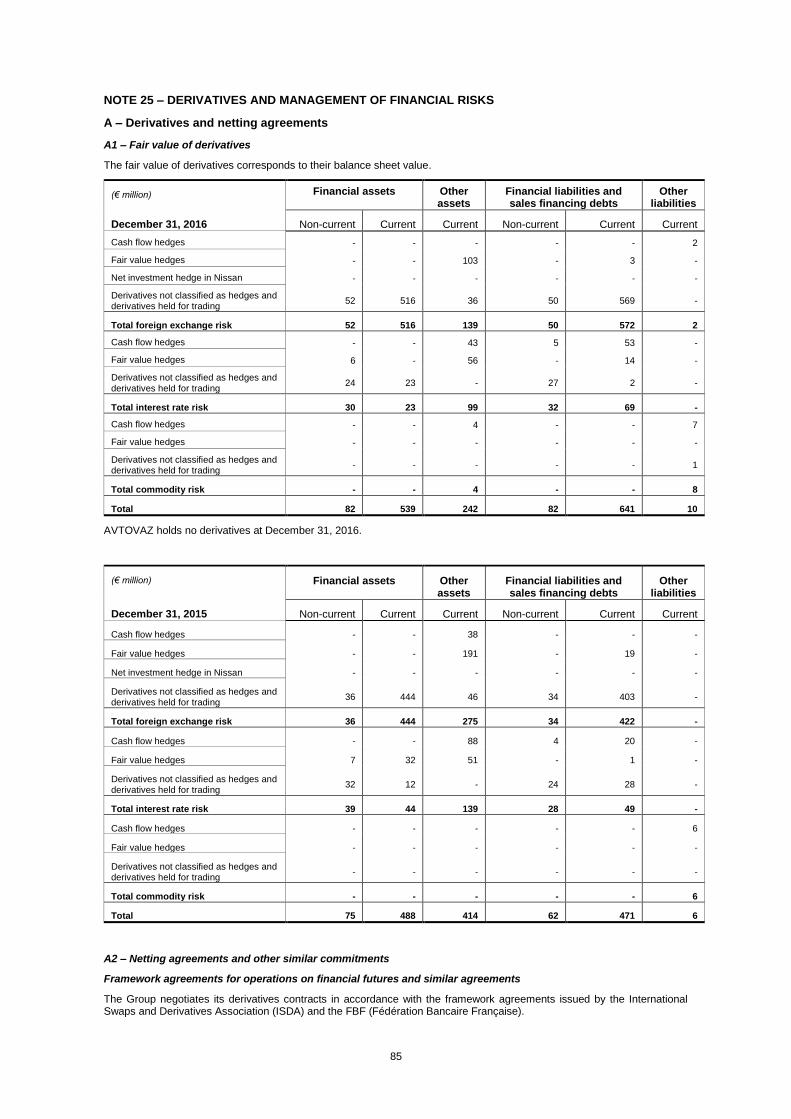
85
NOTE 25 – DERIVATIVES AND MANAGEMENT OF FINANCIAL RISKS
A – Derivatives and netting agreements
A1 – Fair value of derivatives
The fair value of derivatives corresponds to their balance sheet value.
(€ million) Financial assets Other assets
Financial liabilities and sales financing debts
Other liabilities
December 31, 2016 Non-current Current Current Non-current Current Current
Cash flow hedges - - - - - 2
Fair value hedges - - 103 - 3 -
Net investment hedge in Nissan - - - - - -
Derivatives not classified as hedges and derivatives held for trading
52 516 36 50 569 -
Total foreign exchange risk 52 516 139 50 572 2
Cash flow hedges - - 43 5 53 -
Fair value hedges 6 - 56 - 14 -
Derivatives not classified as hedges and derivatives held for trading
24 23 - 27 2 -
Total interest rate risk 30 23 99 32 69 -
Cash flow hedges - - 4 - - 7
Fair value hedges - - - - - -
Derivatives not classified as hedges and derivatives held for trading
- - - - - 1
Total commodity risk - - 4 - - 8
Total 82 539 242 82 641 10
AVTOVAZ holds no derivatives at December 31, 2016.
(€ million) Financial assets Other assets
Financial liabilities and sales financing debts
Other liabilities
December 31, 2015 Non-current Current Current Non-current Current Current
Cash flow hedges - - 38 - - -
Fair value hedges - - 191 - 19 -
Net investment hedge in Nissan - - - - - -
Derivatives not classified as hedges and derivatives held for trading
36 444 46 34 403 -
Total foreign exchange risk 36 444 275 34 422 -
Cash flow hedges - - 88 4 20 -
Fair value hedges 7 32 51 - 1 -
Derivatives not classified as hedges and derivatives held for trading
32 12 - 24 28 -
Total interest rate risk 39 44 139 28 49 -
Cash flow hedges - - - - - 6
Fair value hedges - - - - - -
Derivatives not classified as hedges and derivatives held for trading
- - - - - -
Total commodity risk - - - - - 6
Total 75 488 414 62 471 6
A2 – Netting agreements and other similar commitments
Framework agreements for operations on financial futures and similar agreements
The Group negotiates its derivatives contracts in accordance with the framework agreements issued by the International Swaps and Derivatives Association (ISDA) and the FBF (Fédération Bancaire Française).
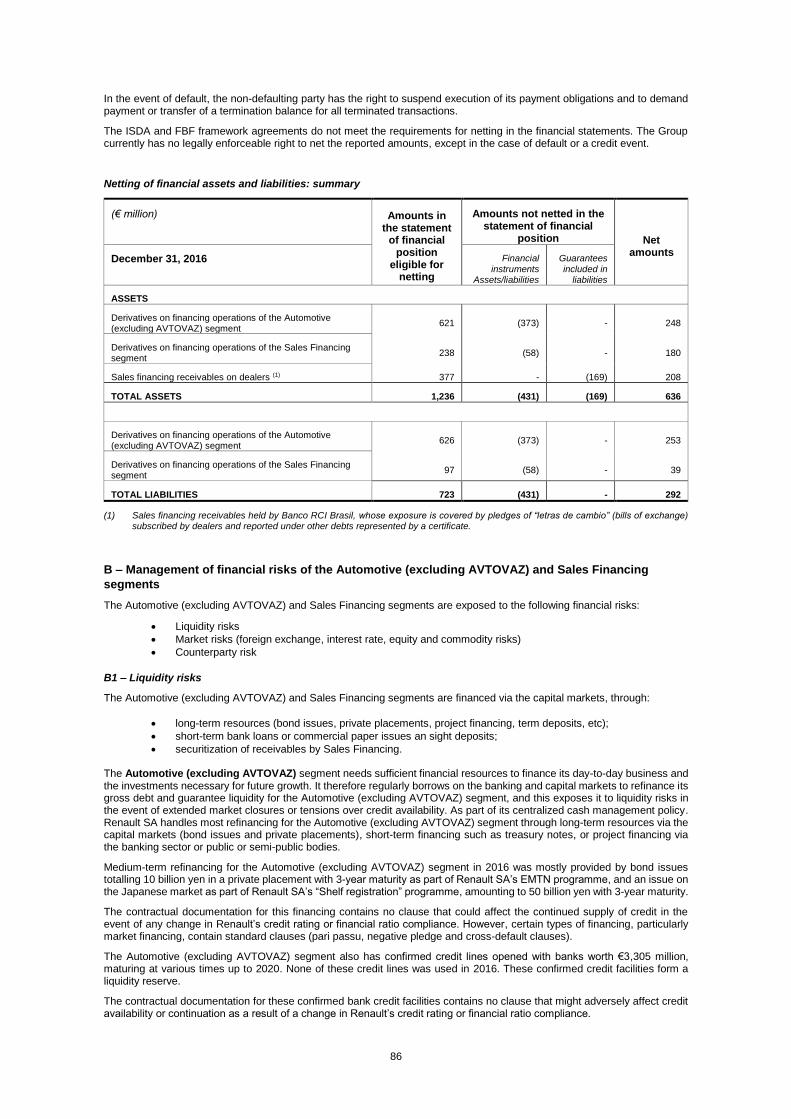
86
In the event of default, the non-defaulting party has the right to suspend execution of its payment obligations and to demand payment or transfer of a termination balance for all terminated transactions.
The ISDA and FBF framework agreements do not meet the requirements for netting in the financial statements. The Group currently has no legally enforceable right to net the reported amounts, except in the case of default or a credit event.
Netting of financial assets and liabilities: summary
(€ million) Amounts in the statement
of financial position
eligible for netting
Amounts not netted in the statement of financial
position Net amounts
December 31, 2016 Financial
instruments Assets/liabilities
Guarantees
included in liabilities
ASSETS
Derivatives on financing operations of the Automotive (excluding AVTOVAZ) segment
621 (373) - 248
Derivatives on financing operations of the Sales Financing segment
238 (58) - 180
Sales financing receivables on dealers (1) 377 - (169) 208
TOTAL ASSETS 1,236 (431) (169) 636
Derivatives on financing operations of the Automotive (excluding AVTOVAZ) segment
626 (373) - 253
Derivatives on financing operations of the Sales Financing segment
97 (58) - 39
TOTAL LIABILITIES 723 (431) - 292
(1) Sales financing receivables held by Banco RCI Brasil, whose exposure is covered by pledges of “letras de cambio” (bills of exchange) subscribed by dealers and reported under other debts represented by a certificate.
B – Management of financial risks of the Automotive (excluding AVTOVAZ) and Sales Financing
segments
The Automotive (excluding AVTOVAZ) and Sales Financing segments are exposed to the following financial risks:
Liquidity risks
Market risks (foreign exchange, interest rate, equity and commodity risks)
Counterparty risk
B1 – Liquidity risks
The Automotive (excluding AVTOVAZ) and Sales Financing segments are financed via the capital markets, through:
long-term resources (bond issues, private placements, project financing, term deposits, etc);
short-term bank loans or commercial paper issues an sight deposits;
securitization of receivables by Sales Financing. The Automotive (excluding AVTOVAZ) segment needs sufficient financial resources to finance its day-to-day business and the investments necessary for future growth. It therefore regularly borrows on the banking and capital markets to refinance its gross debt and guarantee liquidity for the Automotive (excluding AVTOVAZ) segment, and this exposes it to liquidity risks in the event of extended market closures or tensions over credit availability. As part of its centralized cash management policy. Renault SA handles most refinancing for the Automotive (excluding AVTOVAZ) segment through long-term resources via the capital markets (bond issues and private placements), short-term financing such as treasury notes, or project financing via the banking sector or public or semi-public bodies.
Medium-term refinancing for the Automotive (excluding AVTOVAZ) segment in 2016 was mostly provided by bond issues totalling 10 billion yen in a private placement with 3-year maturity as part of Renault SA’s EMTN programme, and an issue on the Japanese market as part of Renault SA’s “Shelf registration” programme, amounting to 50 billion yen with 3-year maturity.
The contractual documentation for this financing contains no clause that could affect the continued supply of credit in the event of any change in Renault’s credit rating or financial ratio compliance. However, certain types of financing, particularly market financing, contain standard clauses (pari passu, negative pledge and cross-default clauses).
The Automotive (excluding AVTOVAZ) segment also has confirmed credit lines opened with banks worth €3,305 million, maturing at various times up to 2020. None of these credit lines was used in 2016. These confirmed credit facilities form a liquidity reserve.
The contractual documentation for these confirmed bank credit facilities contains no clause that might adversely affect credit availability or continuation as a result of a change in Renault’s credit rating or financial ratio compliance.

87
Given its available cash reserves (€11.8 billion) and confirmed credit lines unused at year-end (€3.3 billion), the Automotive (excluding AVTOVAZ) segment has sufficient financial resources to cover its commitments over a 12-month horizon.
Confirmed credit lines open but unused are described in note 23-C.
The Sales Financing segment is very attentive to diversification of its sources of liquidity. Any restriction on access to banking and financial markets would lead to downscaling of its financing activity and/or raise the cost of the financing negotiated. RCI Banque’s liquidity risks monitoring uses several indicators or analyses which are updated monthly based on the latest forecasts of credit outstanding (concerning both customers and the dealership network) and refinancing operations undertaken. Prudent assumptions have been applied regarding the laws on deposit outflows.
In 2016 the Sales Financing segment issued five public bonds for a total amount of €3,350 million: one €500 million variable-coupon bond with 3-year maturity, one €600 million fixed-coupon bond with 7-year maturity, and three €750 million fixed-coupon bonds with maturities of 3 years, 5 years and 7 years. The success of the two 7-year bonds, a long maturity used for the first time in 2014, diversified the investor base and demonstrates investors’ confidence in RCI Banque as a sound business.
Many other private placements were undertaken, totalling €1.1 billion with maturities of between 2 and 3 years.
The Sales Financing segment also undertook a public securitization operation backed by German automobile credits, of which €500 million were placed with investors. This replaces an operation dating from 2013 which has been in the process of amortization since 2014.
The alternation of different maturities, coupon types and issue formats is part of the Sales financing’s diversification strategy for financing sources. This policy has been followed for several years, and enables RCI Banque to reach the maximum number of investors.
Outside Europe, the Sales financing entities in Argentina, Brazil, South Korea and Morocco made borrowings through their domestic bond markets.
Savings deposits collected from private customers increased by €2.3 billion in one year. At December 31, 2016 they totalled €12.6 billion or more than 33% of credit outstanding, in line with the company’s objective of holding customer deposits equivalent to one third of the customer financing given.
In addition to these resources, in Europe the Sales Financing segment has €4.1 billion in undrawn confirmed credit lines with
banks, €2.6 billion of collateral eligible for the European Central Bank’s monetary policy operations, €1.3 billion of highly liquid
assets, and short-term financial assets amounting to €0.3 billion. These resources enable RCI Banque to fund its customer
financing for more than 10 months with no access to external resources.
Confirmed credit lines open but unused are described in note 23-C.
B2 – Foreign exchange risks
Management of foreign exchange risks
The Automotive (excluding AVTOVAZ) segment is exposed to foreign exchange risks in the course of its industrial and commercial business. These risks are monitored and centralized by Renault Financing and Treasury department.
It is Renault’s general policy not to hedge operating future cash flows in foreign currencies. As a result, the Group’s operating margin is exposed to foreign exchange risks. The working capital is also sensitive to movements in exchange rates. Any hedges of such risks require formal authorization from the Finance department or General Management, and the results of these hedges are then reported to the General Management.
In contrast, the Automotive (excluding AVTOVAZ) segment’s general policy is to minimize the foreign exchange risks affecting financing and investment flows in foreign currencies, to avoid any exchange–related distortion of the financial result. All the Automotive (excluding AVTOVAZ) segment’s exposures to foreign exchange risks on financial result items are aggregated and monitored by the central Cash Management team, with monthly reporting to the Chief Financial Officer. Financing flows in foreign currency originating from Renault entities are hedged in the same currency. If a subsidiary needs external financing in a currency other than the local currency, the parent-company monitors the operations closely. Cash surpluses in countries that are not part of the parent-company’s centralized cash management are generally invested in local currency, under the supervision of the Group’s central Cash management department.
Equity investments (in currencies other than the euro) are not generally hedged. However, due to its importance, the investment in Nissan is subject to a partial foreign exchange hedge amounting to 156 billion yen at December 31, 2016 (note 12-H).
The subsidiary Renault Finance can undertake foreign exchange operations on its own behalf, within strictly defined risk limits. Its foreign exchange positions are monitored and valued in real time. This activity is chiefly intended to maintain the Group’s expertise on the financial markets. It generates very short exposures and does not exceed some tens of millions of euros, and cannot therefore have a significant impact on Renault’s consolidated results.
The Sales Financing segment has low exposure to foreign exchange risks due to the management principles applied. No position can be taken under the central management framework for refinancing; the trading room hedges all flows concerned. Residual, temporal positions in foreign currencies related to the time differences in cash flow inherent to multi-currency cash management may still remain. They are monitored daily and the same hedging policy applies. The sales financing subsidiaries are obliged to obtain refinancing in their own currency and as a result are not exposed. In exceptional circumstances, limits are assigned to subsidiaries where sales financing activities or refinancing take place in several different currencies, and to subsidiaries authorized to invest some of their cash surpluses in a currency other than their local currency.
At December 31, 2016 RCI Banque’s consolidated foreign exchange position reached €9 million.

88
The Automotive (excluding AVTOVAZ) and Sales Financing segments made no major changes to their foreign exchange risks management policy in 2016.
Analysis of financial instruments’ sensitivity to foreign exchange risks
This analysis concerns the sensitivity to foreign exchange risks of monetary assets and liabilities (including intercompany balances) and derivatives in a currency other than the currency of the entity that holds them. However, it does not take into account items covered by fair value hedges (hedged assets or liabilities and derivatives), for which changes in fair value of the hedged item and the hedging instrument almost totally offset each other in the income statement.
The impact on shareholders’ equity (before tax) of a 1% rise in the Euro against other currencies is assessed by converting available-for-sale financial assets, cash flow hedges and the partial hedge of the investment in Nissan. For the Automotive (excluding AVTOVAZ) segment, this impact would be a favourable €13 million at December 31, 2016, mainly associated with the yen bond issues that make up the partial hedge of the investment in Nissan.
The impact on net income of a 1% rise in the Euro against other currencies would be an unfavourable €(8) million at December 31, 2016, mainly attributable to unhedged operating assets and liabilities denominated in a currency that is not the functional currency.
Currency derivatives
(€ million) December 31, 2016 December 31, 2015
Nominal - 1 yr 1 – 5 yrs + 5 yrs Nominal - 1 yr 1 – 5 yrs + 5 yrs
Currency swaps – purchases 3,758 2,555 1,203 - 7,923 5,317 2,606 -
Currency swaps – sales 3,903 2,593 1,310 - 8,033 5,334 2,699 -
Forward purchases 28,296 27,204 1,092 - 23,509 23,063 446 -
Forward sales 28,292 27,200 1,092 - 23,520 23,074 446 -
B3 – Interest rate risks
Interest rate risks management
The Renault Group’s exposure to interest rate risks mainly concerns the sales financing business of Sales financing and its subsidiaries. The overall interest rate risks represent the impact of fluctuating rates on the future gross financial margin. The Sales Financing segment’s aim is to limit these risks as far as possible in order to protect its margin on sales. To take account of the difficulty of precisely matching the structure of borrowings with the structure of loans, a limited amount of flexibility is allowed in each subsidiary’s interest rate hedging. This flexibility is reflected in a sensitivity limit assigned to each subsidiary and validated by the finance committee, in an individual adaptation of part of the limit Renault assigns to the Sales Financing segment.
Sensitivity is calculated daily for each currency and each management entity (central refinancing office, French and foreign sales financing subsidiaries), for overall management of interest rate risks across the consolidated scope of the Sales Financing segment.
Each entity’s position with regard to its limit is checked daily, and immediate hedging directives are issued to the subsidiaries if circumstances require. The result of the checks are reported monthly to the Sales Financing segment’s finance committee, which checks that the positions comply with the Group’s financial strategy and current procedural instructions.
Analysis of the Sales Financing segment’s structural interest rate risk shows the following:
Virtually all loans to customers by sales financing subsidiaries bear interest at a fixed rate and have terms of one to seventy-two months. These loans are hedged by fixed-rate resources with the same structure. They are covered by macro-hedging and only generate a residual interest rate risk. In subsidiaries where the financing bears interest at a floating rate, the interest rate risk is hedged by macro-hedging using interest rate swaps.
The main activity of the Sales Financing segment’s central refinancing department is refinancing the Group’s commercial subsidiaries. Macro-hedging transactions in the form of interest rate swaps keep the sensitivity of the refinancing holding company below the defined limit.
The Automotive (excluding AVTOVAZ) segment’s interest rate risk management policy applies two principles: long-term investments generally use fixed-rate financing, and investments for cash reserves generally use floating-rate financing. Fixed-rate borrowings are swapped to variable rates to maintain a balance between floating-rate liabilities and floating-rate assets when the yield curve is not close enough to zero. The financing in yen undertaken as part of the partial hedge of Nissan equity is fixed-rate.
The Automotive (excluding AVTOVAZ) segment’s available cash is managed centrally by Renault SA as far as possible, and invested in short-term bank deposits by Renault Finance.
Finally, Renault Finance carries out interest rate transactions on its own behalf, within strictly defined risk limits, and positions are monitored and valued in real time. The risk associated with this arbitrage activity is very limited, and has no significant impact on the Group’s consolidated net income.
The Automotive (excluding AVTOVAZ) and Sales Financing segments made no major changes to its interest rate risk management policy in 2016.

89
Analysis of financial instruments’ sensitivity to interest rate risks
The Automotive (excluding AVTOVAZ) and Sales Financing segments are exposed to the following interest rate risks:
- variations in the interest flows on floating-rate financial instruments stated at amortized cost (including fixed-rate instruments swapped to floating rate, and structured products);
- variations in the fair value of the fixed-rate financial instruments stated at fair value;
- variations in the fair value of derivatives.
Impacts are estimated by applying a 100 base point rise in interest rates over a one-year period to financial instruments reported in the closing statement of financial position.
The impact on shareholders’ equity corresponds to the change in fair value before reclassification in profit or loss (section 4.2.2) of available-for-sale fixed-rate financial assets and cash flow hedges after a 100 base point rise in interest rates. All other impacts affect net income.
Calculation of the individual segments’ sensitivity to interest rates includes intersegment loans and borrowings.
For the Automotive (excluding AVTOVAZ) segment. The impact on net income and shareholders’ equity (before taxes) of a 100 base point rise in interest rates applied to financial instruments exposed to interest rate risks would be a positive €92 million and €3 million respectively at December 31, 2016.
For the Sales Financing segment, the overall sensitivity to interest rate risks in 2016 remained below the limit set by the RCI Banque group (€40 million until December 5, 2016 and €50 million since that date).
At December 31, 2016, a 100 point base point rise in interest rates would have the following impacts on net income and shareholders’ equity (before taxes):
- +€12.3 million for items denominated in Euros.
- -€0.1 million for items denominated in Argentinean pesos.
- -€0.1 million for items denominated in Brazilian real.
- +€3.6 million for items denominated in Swiss francs.
- +€0.5 million for items denominated in pounds sterling.
- -€0.1 million for items denominated in Korean won.
- +€1.4 million for items denominated in Moroccan dirham.
- +€0.3 million for items denominated in Polish zloty.
The sum of the absolute sensitivities in each currency amounts to €18.6 million.
Fixed rate/floating rate breakdown of financial liabilities and sales financing debts of the Group (excluding AVTOVAZ), after the effect of derivatives
(€ million) December 31, 2016 December 31, 2015
Financial liabilities before hedging: fixed rate (a) 23,850 23,242
Financial liabilities before hedging: floating rate (a’) 19,427 16,372
Financial liabilities before hedging (without redeemable shares) of the Group (excluding AVTOVAZ)
43,277 39,614
Hedges: floating rate / fixed (b) 7,525 5,931
Hedges: fixed rate / floating (b’) 7,340 7,755
Hedges 14,865 13,686
Financial liabilities after hedging: fixed rate (a+b-b’) 24,035 21,418
Financial liabilities after hedging: floating rate (a’+b’-b) 19,242 18,196
Financial liabilities after hedging (without redeemable shares) of the Group (excluding AVTOVAZ)
43,277 39,614
Interest rate derivatives
(€ million) December 31, 2016 December 31, 2015
Nominal - 1 yr 1 – 5 yrs + 5 yrs Nominal - 1 yr 1 – 5 yrs + 5 yrs
Interest rate swaps 18,293 5,975 10,668 1,650 15,447 5,100 9,447 900
Other interest rate hedging instruments
- - - - - - - -

90
B4 – Equity risks
Management of equity risks
The Group’s exposure to equity risks essentially concerns the Daimler shares acquired in connection with the cooperation agreements, and marketable securities indexed to share prices. The Group does not use equity derivatives to hedge these risks.
The Group made no major changes to its equity risks management policy in 2016.
Analysis of financial instruments’ sensitivity to equity risks
The sensitivity to equity risks resulting from application of a 10% decrease in share prices to the financial assets concerned at the year-end would have an unfavourable impact of €137 million on shareholders’ equity. The impact on net income is not significant at December 31, 2016.
B5 – Commodity risks
Management of commodity risks
Commodity purchase prices can change suddenly and significantly, and cannot necessarily be passed on through vehicle sale prices. This may lead Renault’s Purchases department to hedge part of its commodity risks using financial instruments. These hedges are subject to volume, duration and price limits.
In 2016 Renault undertook hedging operations for a maximum of 70% of monthly quantities on aluminium, lead, copper, palladium, platinum, nickel and Brent oil, whenever prices on the financial markets fall below thresholds validated by the CEO.
The operations in progress at December 31, 2016 are classified for accounting purposes as cash flow hedges, and accordingly changes in their fair value are included in shareholders’ equity.
Analysis of financial instruments’ sensitivity to commodity risks
Financial instruments’ accounting sensitivity to commodity risks results from derivatives used to hedge the Group’s economic exposure to these risks.
A 10% increase in commodity prices for derivatives classified as hedging derivatives would have a positive impact of €13 million on shareholders’ equity at December 31, 2016.
Commodity derivatives
(€ million) December 31, 2016 December 31, 2015
Nominal - 1 yr 1 to 5 yrs + 5 yrs Nominal - 1 yr 1 to 5 yrs + 5 yrs
Purchases of swaps 142 142 - - 111 111 - -
B6 – Counterparty risk
All Group entities use a fully-coordinated counterparty risk management procedure involving a scoring system, based principally on the counterparties’ long-term credit rating and equity level. For Group companies with significant exposure, compliance with authorized limits is monitored on a daily basis under strict internal control procedures.
The Group produces a consolidated monthly report covering all its bank counterparties, organized by credit rating. This report provides a detailed analysis of compliance with limits in terms of amount, term and type, as well as a list of the main exposures.
Most deposits are with large network banks, as this allows a good spread of the risk and lowers the systemic risk. None of these deposits are for terms longer than 90 days.
The Group is not subject to any significant risk concentration for its operations on the financial and banking markets.
No losses due to default by a banking counterparty were recorded in 2016.
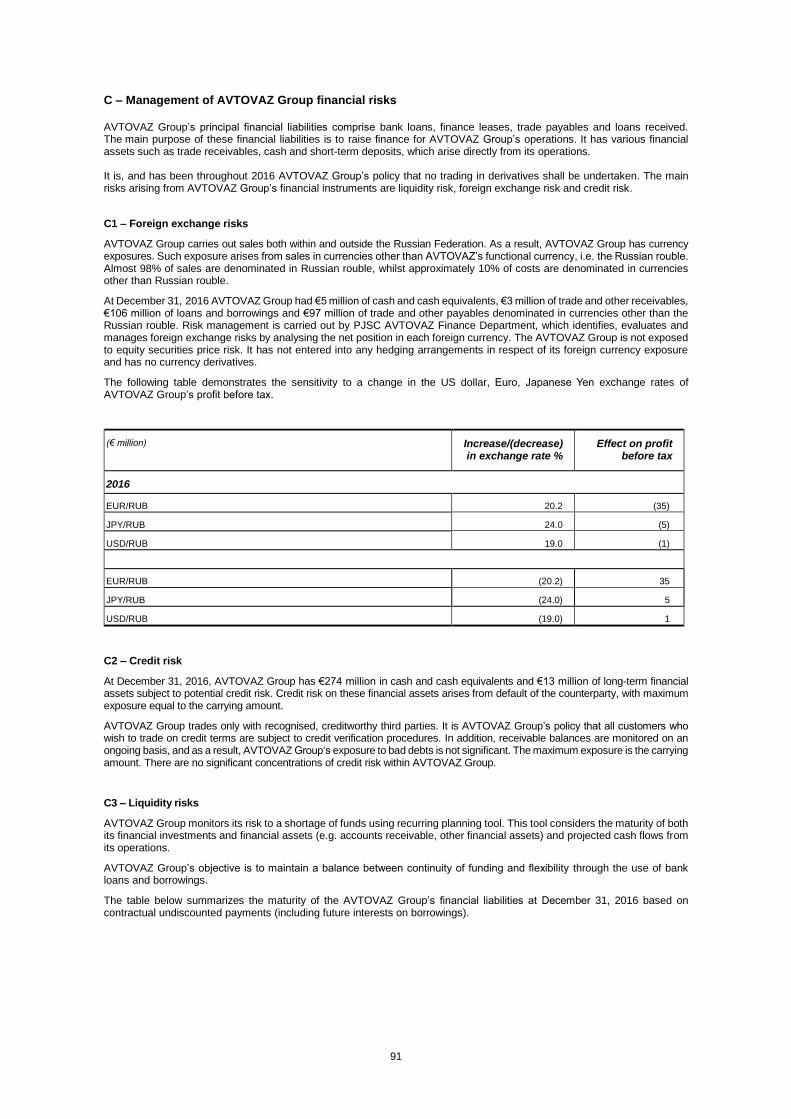
91
C – Management of AVTOVAZ Group financial risks AVTOVAZ Group’s principal financial liabilities comprise bank loans, finance leases, trade payables and loans received. The main purpose of these financial liabilities is to raise finance for AVTOVAZ Group’s operations. It has various financial assets such as trade receivables, cash and short-term deposits, which arise directly from its operations. It is, and has been throughout 2016 AVTOVAZ Group’s policy that no trading in derivatives shall be undertaken. The main risks arising from AVTOVAZ Group’s financial instruments are liquidity risk, foreign exchange risk and credit risk.
C1 – Foreign exchange risks
AVTOVAZ Group carries out sales both within and outside the Russian Federation. As a result, AVTOVAZ Group has currency exposures. Such exposure arises from sales in currencies other than AVTOVAZ’s functional currency, i.e. the Russian rouble. Almost 98% of sales are denominated in Russian rouble, whilst approximately 10% of costs are denominated in currencies other than Russian rouble.
At December 31, 2016 AVTOVAZ Group had €5 million of cash and cash equivalents, €3 million of trade and other receivables, €106 million of loans and borrowings and €97 million of trade and other payables denominated in currencies other than the Russian rouble. Risk management is carried out by PJSC AVTOVAZ Finance Department, which identifies, evaluates and manages foreign exchange risks by analysing the net position in each foreign currency. The AVTOVAZ Group is not exposed to equity securities price risk. It has not entered into any hedging arrangements in respect of its foreign currency exposure and has no currency derivatives.
The following table demonstrates the sensitivity to a change in the US dollar, Euro, Japanese Yen exchange rates of AVTOVAZ Group’s profit before tax.
(€ million) Increase/(decrease) in exchange rate %
Effect on profit before tax
2016
EUR/RUB 20.2 (35)
JPY/RUB 24.0 (5)
USD/RUB 19.0 (1)
EUR/RUB (20.2) 35
JPY/RUB (24.0) 5
USD/RUB (19.0) 1
C2 – Credit risk
At December 31, 2016, AVTOVAZ Group has €274 million in cash and cash equivalents and €13 million of long-term financial assets subject to potential credit risk. Credit risk on these financial assets arises from default of the counterparty, with maximum exposure equal to the carrying amount.
AVTOVAZ Group trades only with recognised, creditworthy third parties. It is AVTOVAZ Group’s policy that all customers who wish to trade on credit terms are subject to credit verification procedures. In addition, receivable balances are monitored on an ongoing basis, and as a result, AVTOVAZ Group‘s exposure to bad debts is not significant. The maximum exposure is the carrying amount. There are no significant concentrations of credit risk within AVTOVAZ Group.
C3 – Liquidity risks
AVTOVAZ Group monitors its risk to a shortage of funds using recurring planning tool. This tool considers the maturity of both its financial investments and financial assets (e.g. accounts receivable, other financial assets) and projected cash flows from its operations.
AVTOVAZ Group’s objective is to maintain a balance between continuity of funding and flexibility through the use of bank loans and borrowings.
The table below summarizes the maturity of the AVTOVAZ Group’s financial liabilities at December 31, 2016 based on contractual undiscounted payments (including future interests on borrowings).
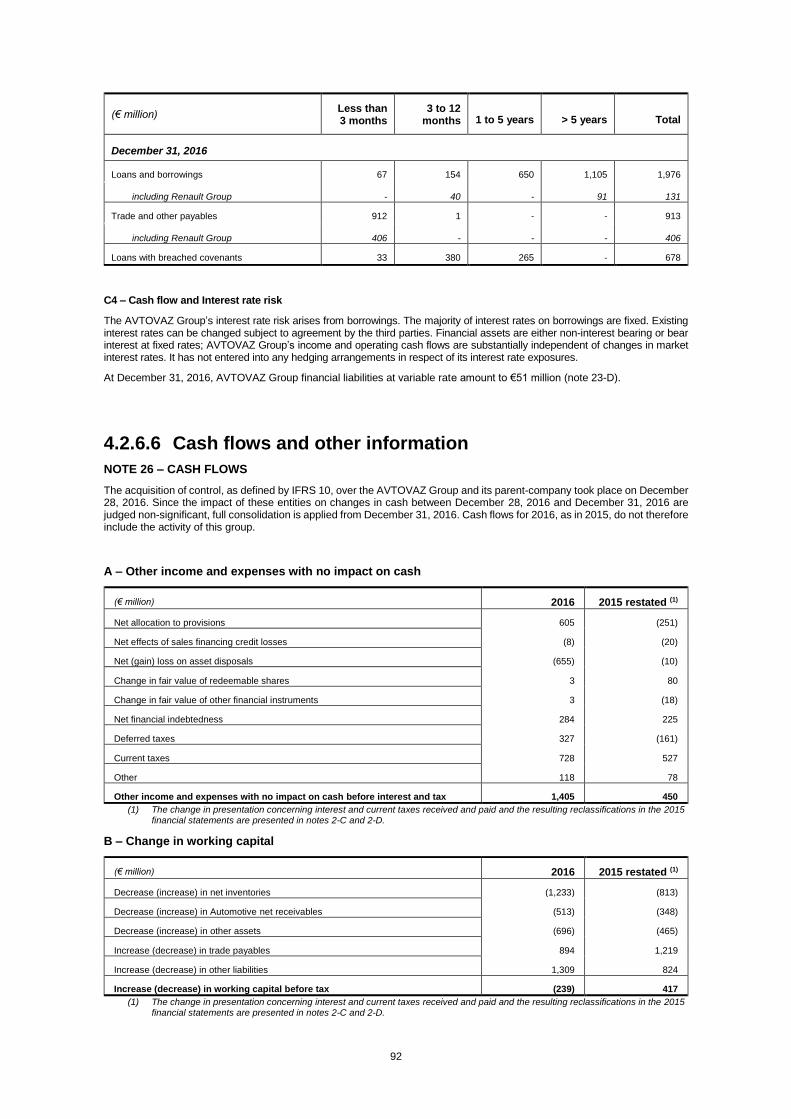
92
(€ million) Less than 3 months
3 to 12 months 1 to 5 years > 5 years Total
December 31, 2016
Loans and borrowings
67 154 650 1,105 1,976
including Renault Group - 40 - 91 131
Trade and other payables 912 1 - - 913
including Renault Group 406 - - - 406
Loans with breached covenants 33 380 265 - 678
C4 – Cash flow and Interest rate risk
The AVTOVAZ Group’s interest rate risk arises from borrowings. The majority of interest rates on borrowings are fixed. Existing interest rates can be changed subject to agreement by the third parties. Financial assets are either non-interest bearing or bear interest at fixed rates; AVTOVAZ Group’s income and operating cash flows are substantially independent of changes in market interest rates. It has not entered into any hedging arrangements in respect of its interest rate exposures.
At December 31, 2016, AVTOVAZ Group financial liabilities at variable rate amount to €51 million (note 23-D).
4.2.6.6 Cash flows and other information
NOTE 26 – CASH FLOWS
The acquisition of control, as defined by IFRS 10, over the AVTOVAZ Group and its parent-company took place on December 28, 2016. Since the impact of these entities on changes in cash between December 28, 2016 and December 31, 2016 are judged non-significant, full consolidation is applied from December 31, 2016. Cash flows for 2016, as in 2015, do not therefore include the activity of this group.
A – Other income and expenses with no impact on cash
(€ million) 2016 2015 restated (1)
Net allocation to provisions 605 (251)
Net effects of sales financing credit losses (8) (20)
Net (gain) loss on asset disposals (655) (10)
Change in fair value of redeemable shares 3 80
Change in fair value of other financial instruments 3 (18)
Net financial indebtedness 284 225
Deferred taxes 327 (161)
Current taxes 728 527
Other 118 78
Other income and expenses with no impact on cash before interest and tax 1,405 450
(1) The change in presentation concerning interest and current taxes received and paid and the resulting reclassifications in the 2015 financial statements are presented in notes 2-C and 2-D.
B – Change in working capital
(€ million) 2016 2015 restated (1)
Decrease (increase) in net inventories (1,233) (813)
Decrease (increase) in Automotive net receivables (513) (348)
Decrease (increase) in other assets (696) (465)
Increase (decrease) in trade payables 894 1,219
Increase (decrease) in other liabilities 1,309 824
Increase (decrease) in working capital before tax (239) 417
(1) The change in presentation concerning interest and current taxes received and paid and the resulting reclassifications in the 2015 financial statements are presented in notes 2-C and 2-D.
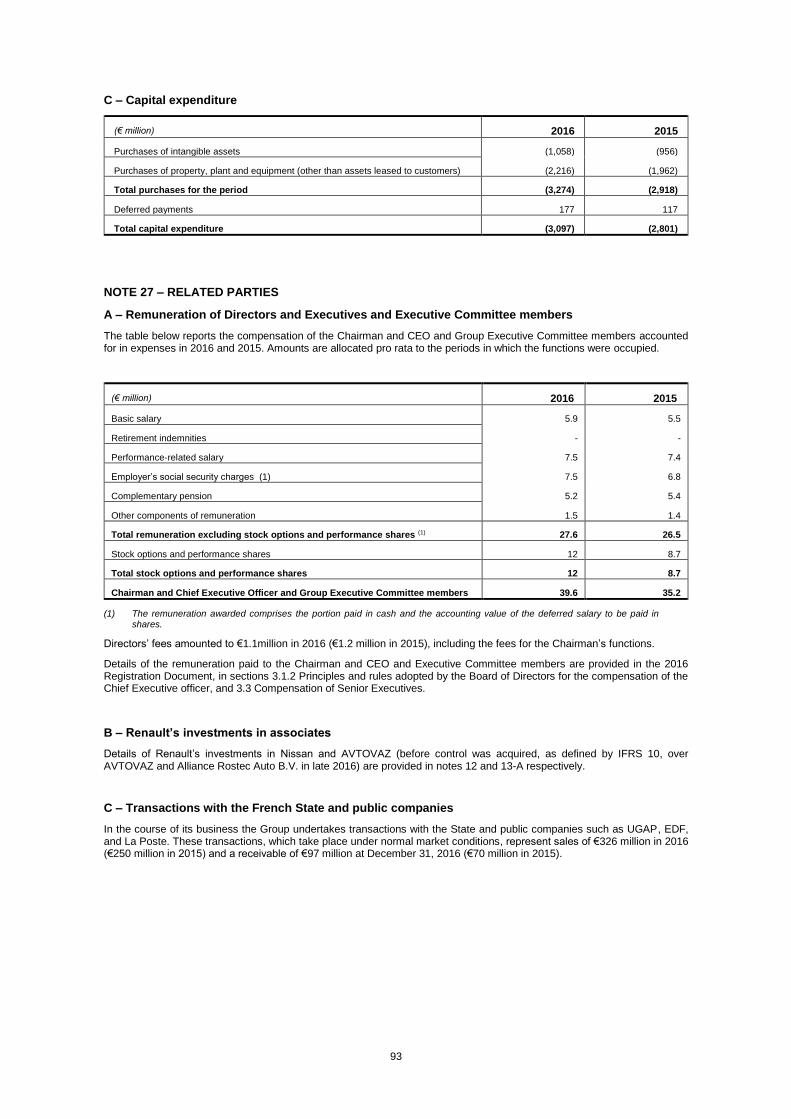
93
C – Capital expenditure
(€ million) 2016 2015
Purchases of intangible assets (1,058) (956)
Purchases of property, plant and equipment (other than assets leased to customers) (2,216) (1,962)
Total purchases for the period (3,274) (2,918)
Deferred payments 177 117
Total capital expenditure (3,097) (2,801)
NOTE 27 – RELATED PARTIES
A – Remuneration of Directors and Executives and Executive Committee members
The table below reports the compensation of the Chairman and CEO and Group Executive Committee members accounted for in expenses in 2016 and 2015. Amounts are allocated pro rata to the periods in which the functions were occupied.
(€ million) 2016 2015
Basic salary 5.9 5.5
Retirement indemnities - -
Performance-related salary 7.5 7.4
Employer’s social security charges (1) 7.5 6.8
Complementary pension 5.2 5.4
Other components of remuneration 1.5 1.4
Total remuneration excluding stock options and performance shares (1) 27.6 26.5
Stock options and performance shares 12 8.7
Total stock options and performance shares 12 8.7
Chairman and Chief Executive Officer and Group Executive Committee members 39.6 35.2
(1) The remuneration awarded comprises the portion paid in cash and the accounting value of the deferred salary to be paid in shares.
Directors’ fees amounted to €1.1million in 2016 (€1.2 million in 2015), including the fees for the Chairman’s functions.
Details of the remuneration paid to the Chairman and CEO and Executive Committee members are provided in the 2016 Registration Document, in sections 3.1.2 Principles and rules adopted by the Board of Directors for the compensation of the Chief Executive officer, and 3.3 Compensation of Senior Executives.
B – Renault’s investments in associates
Details of Renault’s investments in Nissan and AVTOVAZ (before control was acquired, as defined by IFRS 10, over AVTOVAZ and Alliance Rostec Auto B.V. in late 2016) are provided in notes 12 and 13-A respectively.
C – Transactions with the French State and public companies
In the course of its business the Group undertakes transactions with the State and public companies such as UGAP, EDF, and La Poste. These transactions, which take place under normal market conditions, represent sales of €326 million in 2016 (€250 million in 2015) and a receivable of €97 million at December 31, 2016 (€70 million in 2015).
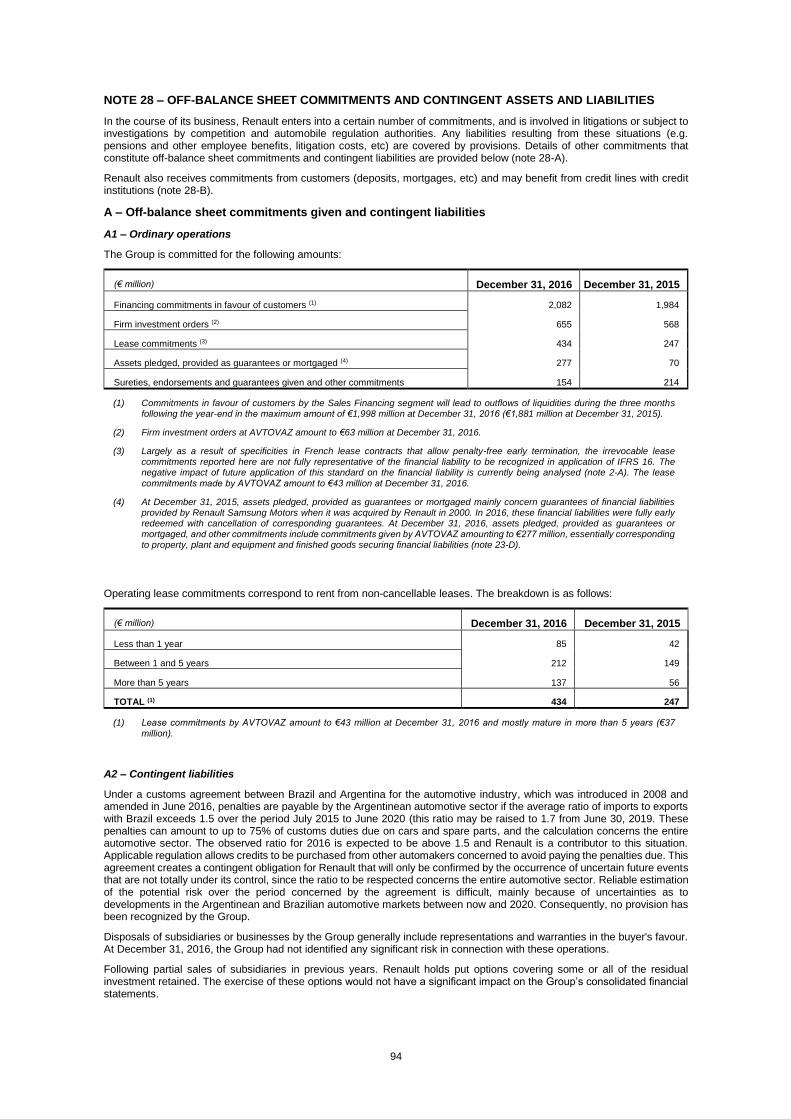
94
NOTE 28 – OFF-BALANCE SHEET COMMITMENTS AND CONTINGENT ASSETS AND LIABILITIES
In the course of its business, Renault enters into a certain number of commitments, and is involved in litigations or subject to investigations by competition and automobile regulation authorities. Any liabilities resulting from these situations (e.g. pensions and other employee benefits, litigation costs, etc) are covered by provisions. Details of other commitments that constitute off-balance sheet commitments and contingent liabilities are provided below (note 28-A).
Renault also receives commitments from customers (deposits, mortgages, etc) and may benefit from credit lines with credit institutions (note 28-B).
A – Off-balance sheet commitments given and contingent liabilities
A1 – Ordinary operations
The Group is committed for the following amounts:
(€ million) December 31, 2016 December 31, 2015
Financing commitments in favour of customers (1) 2,082 1,984
Firm investment orders (2) 655 568
Lease commitments (3) 434 247
Assets pledged, provided as guarantees or mortgaged (4) 277 70
Sureties, endorsements and guarantees given and other commitments 154 214
(1) Commitments in favour of customers by the Sales Financing segment will lead to outflows of liquidities during the three months following the year-end in the maximum amount of €1,998 million at December 31, 2016 (€1,881 million at December 31, 2015).
(2) Firm investment orders at AVTOVAZ amount to €63 million at December 31, 2016.
(3) Largely as a result of specificities in French lease contracts that allow penalty-free early termination, the irrevocable lease commitments reported here are not fully representative of the financial liability to be recognized in application of IFRS 16. The negative impact of future application of this standard on the financial liability is currently being analysed (note 2-A). The lease
commitments made by AVTOVAZ amount to €43 million at December 31, 2016.
(4) At December 31, 2015, assets pledged, provided as guarantees or mortgaged mainly concern guarantees of financial liabilities provided by Renault Samsung Motors when it was acquired by Renault in 2000. In 2016, these financial liabilities were fully early redeemed with cancellation of corresponding guarantees. At December 31, 2016, assets pledged, provided as guarantees or mortgaged, and other commitments include commitments given by AVTOVAZ amounting to €277 million, essentially corresponding to property, plant and equipment and finished goods securing financial liabilities (note 23-D).
Operating lease commitments correspond to rent from non-cancellable leases. The breakdown is as follows:
(€ million) December 31, 2016 December 31, 2015
Less than 1 year 85 42
Between 1 and 5 years 212 149
More than 5 years 137 56
TOTAL (1) 434 247
(1) Lease commitments by AVTOVAZ amount to €43 million at December 31, 2016 and mostly mature in more than 5 years (€37
million).
A2 – Contingent liabilities
Under a customs agreement between Brazil and Argentina for the automotive industry, which was introduced in 2008 and amended in June 2016, penalties are payable by the Argentinean automotive sector if the average ratio of imports to exports with Brazil exceeds 1.5 over the period July 2015 to June 2020 (this ratio may be raised to 1.7 from June 30, 2019. These penalties can amount to up to 75% of customs duties due on cars and spare parts, and the calculation concerns the entire automotive sector. The observed ratio for 2016 is expected to be above 1.5 and Renault is a contributor to this situation. Applicable regulation allows credits to be purchased from other automakers concerned to avoid paying the penalties due. This agreement creates a contingent obligation for Renault that will only be confirmed by the occurrence of uncertain future events that are not totally under its control, since the ratio to be respected concerns the entire automotive sector. Reliable estimation of the potential risk over the period concerned by the agreement is difficult, mainly because of uncertainties as to developments in the Argentinean and Brazilian automotive markets between now and 2020. Consequently, no provision has been recognized by the Group.
Disposals of subsidiaries or businesses by the Group generally include representations and warranties in the buyer's favour. At December 31, 2016, the Group had not identified any significant risk in connection with these operations.
Following partial sales of subsidiaries in previous years. Renault holds put options covering some or all of the residual investment retained. The exercise of these options would not have a significant impact on the Group’s consolidated financial statements.

95
Group companies are periodically subject to tax inspections in the countries in which they operate. Accepted tax adjustments are recorded as provisions in the financial statements. Contested tax adjustments are recognized on a case-by-case basis, taking into account the risk that the proceedings or appeals undertaken may be unsuccessful.
Group companies are periodically subject to investigations by the authorities in the countries in which they operate. When the resulting financial consequences are accepted, they are recognized in the financial statements via provisions. When they are contested, they are recognized on a case-by-case basis, based on estimates that take into account the risk that the proceedings or appeals undertaken may be unsuccessful.
The main investigations by the competition and Automotive regulations authorities in progress at December 31, 2016 are the following: some inquiries in Europe concerning the level of vehicle emissions. No provision has been recognized for these investigations, but the cost of adapting vehicles already on the road is covered by a provision amounting to €20 million at December 31, 2016. The investigation by the competition authorities in Korea was closed in 2017 and concluded with the absence of violation of competition regulations.
Group companies are subject to the applicable regulations regarding pollution, which vary depending on the country of location. Some of the associated environmental liabilities are potential and will only be recognized in the accounts if the activity is discontinued or the site closed. It is also difficult to determine the amount of the obligation reliably. Provisions are only established for liabilities that correspond to a legal or constructive obligation at the year-end, and can be estimated with reasonable reliability. Details of significant provisions are given in note 20 – Change in provisions.
B – Off-balance sheet commitments received and contingent assets
(€ million) December 31, 2016 December 31, 2015
Sureties, endorsements and guarantees received 2,295 2,039
Assets pledged or mortgaged (1) 3,138 2,672
Buy-back commitments (2) 2,274 1,656
Other commitments 33 4
(1) The Sales Financing segment receives guarantees from its customers in the course of sales financing for new or used vehicles, Guarantees received from customers amount to €2,757 million at December 31, 2016 (€2,397 million at December 31, 2015). In addition, AVTOVAZ Group received pledges on real estate, properties and inventories as guarantee on loans provided (€13 million) and trade receivable (€93 million).
(2) Commitments received by the Sales Financing segment for sale to a third party of rental vehicles at the end of the rental contract.
Off-balance sheet commitments received concerning confirmed opened credit lines are presented in notes 23-A and 23-D.
NOTE 29 – FEES PAID TO STATUTORY AUDITORS AND THEIR NETWORK
The fees paid to the Group’s Statutory Auditors and their networks are reported in section 7.3.3 of the 2016 Registration Document.
NOTE 30 – SUBSEQUENT EVENTS
In the ongoing “emissions” affair, Renault notes that a legal investigation has been opened, although at this stage it has not been able to obtain official confirmation of this. This new stage in the procedure is seen as an indication that the French prosecution office wishes to pursue this matter. No provision has been recorded in the financial statements at December 31, 2016 in respect of this matter.
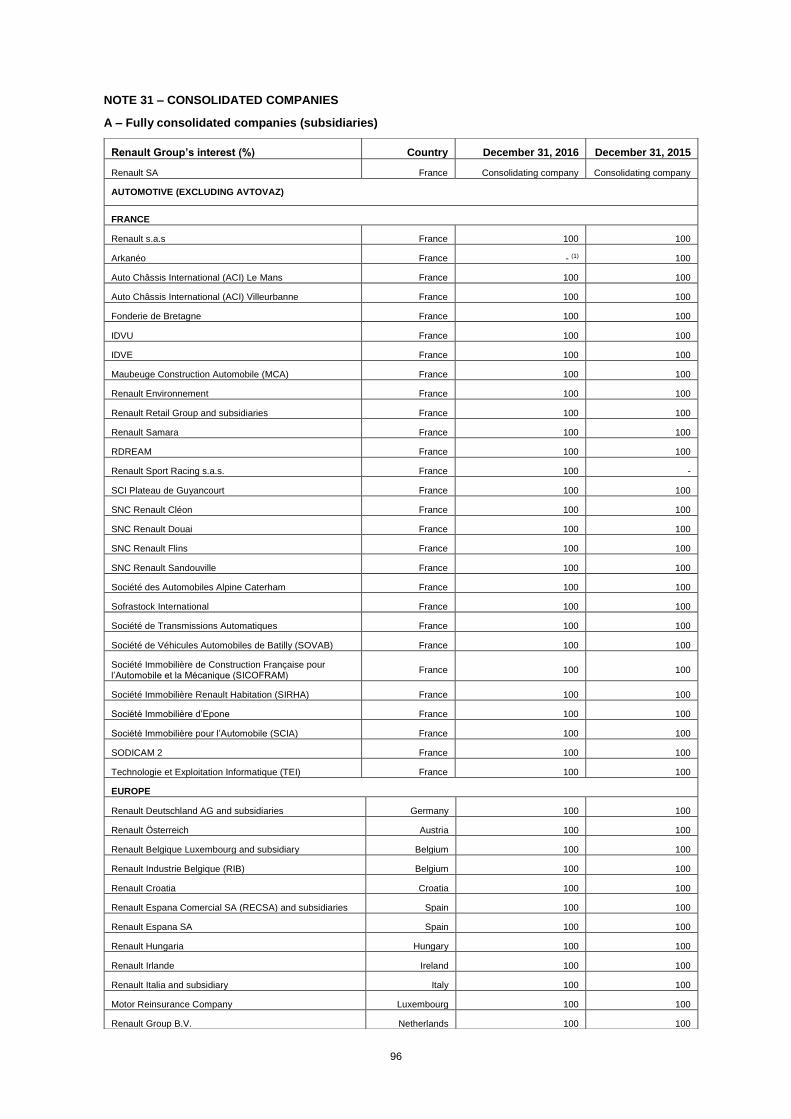
96
NOTE 31 – CONSOLIDATED COMPANIES
A – Fully consolidated companies (subsidiaries)
Renault Group’s interest (%) Country December 31, 2016 December 31, 2015
Renault SA France Consolidating company Consolidating company
AUTOMOTIVE (EXCLUDING AVTOVAZ)
FRANCE
Renault s.a.s France 100 100
Arkanéo France - (1) 100
Auto Châssis International (ACI) Le Mans France 100 100
Auto Châssis International (ACI) Villeurbanne France 100 100
Fonderie de Bretagne France 100 100
IDVU France 100 100
IDVE France 100 100
Maubeuge Construction Automobile (MCA) France 100 100
Renault Environnement France 100 100
Renault Retail Group and subsidiaries France 100 100
Renault Samara France 100 100
RDREAM France 100 100
Renault Sport Racing s.a.s. France 100 -
SCI Plateau de Guyancourt France 100 100
SNC Renault Cléon France 100 100
SNC Renault Douai France 100 100
SNC Renault Flins France 100 100
SNC Renault Sandouville France 100 100
Société des Automobiles Alpine Caterham France 100 100
Sofrastock International France 100 100
Société de Transmissions Automatiques France 100 100
Société de Véhicules Automobiles de Batilly (SOVAB) France 100 100
Société Immobilière de Construction Française pour l’Automobile et la Mécanique (SICOFRAM)
France 100 100
Société Immobilière Renault Habitation (SIRHA) France 100 100
Société Immobilière d’Epone France 100 100
Société Immobilière pour l’Automobile (SCIA) France 100 100
SODICAM 2 France 100 100
Technologie et Exploitation Informatique (TEI) France 100 100
EUROPE
Renault Deutschland AG and subsidiaries Germany 100 100
Renault Österreich Austria 100 100
Renault Belgique Luxembourg and subsidiary Belgium 100 100
Renault Industrie Belgique (RIB) Belgium 100 100
Renault Croatia Croatia 100 100
Renault Espana Comercial SA (RECSA) and subsidiaries Spain 100 100
Renault Espana SA Spain 100 100
Renault Hungaria Hungary 100 100
Renault Irlande Ireland 100 100
Renault Italia and subsidiary Italy 100 100
Motor Reinsurance Company Luxembourg 100 100
Renault Group B.V. Netherlands 100 100
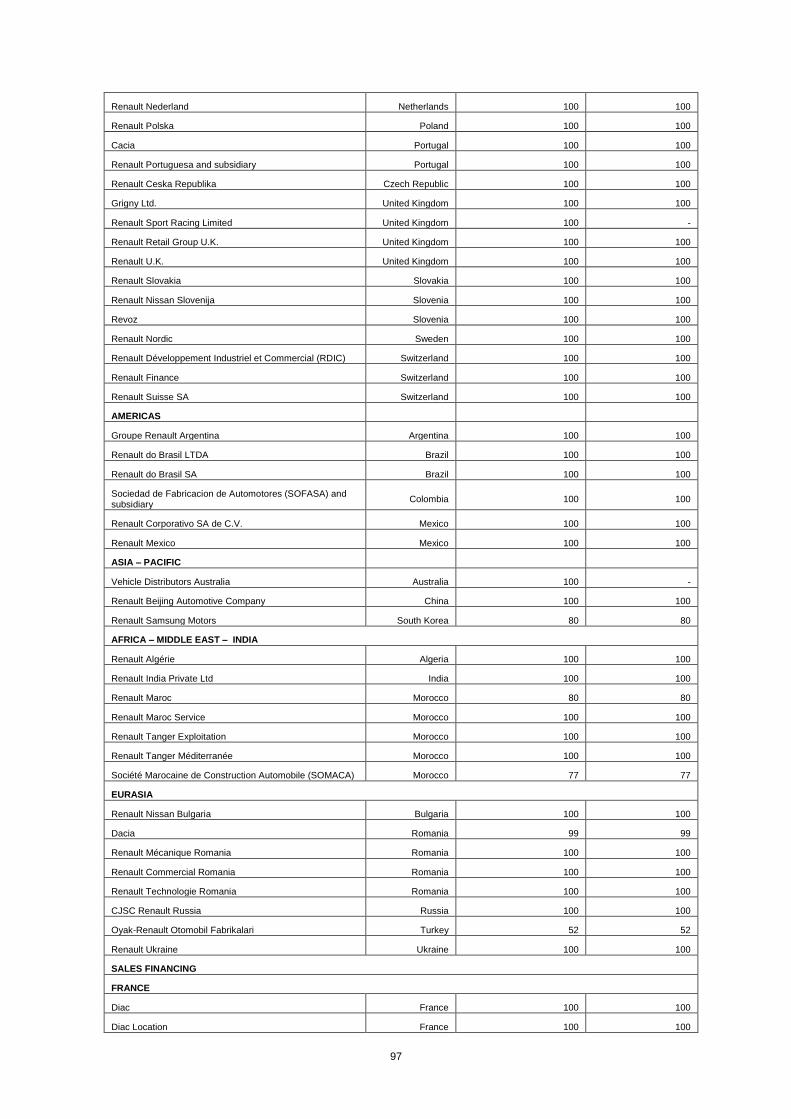
97
Renault Nederland Netherlands 100 100
Renault Polska Poland 100 100
Cacia Portugal 100 100
Renault Portuguesa and subsidiary Portugal 100 100
Renault Ceska Republika Czech Republic 100 100
Grigny Ltd. United Kingdom 100 100
Renault Sport Racing Limited United Kingdom 100 -
Renault Retail Group U.K. United Kingdom 100 100
Renault U.K. United Kingdom 100 100
Renault Slovakia Slovakia 100 100
Renault Nissan Slovenija Slovenia 100 100
Revoz Slovenia 100 100
Renault Nordic Sweden 100 100
Renault Développement Industriel et Commercial (RDIC) Switzerland 100 100
Renault Finance Switzerland 100 100
Renault Suisse SA Switzerland 100 100
AMERICAS
Groupe Renault Argentina Argentina 100 100
Renault do Brasil LTDA Brazil 100 100
Renault do Brasil SA Brazil 100 100
Sociedad de Fabricacion de Automotores (SOFASA) and subsidiary
Colombia 100 100
Renault Corporativo SA de C.V. Mexico 100 100
Renault Mexico Mexico 100 100
ASIA – PACIFIC
Vehicle Distributors Australia Australia 100 -
Renault Beijing Automotive Company China 100 100
Renault Samsung Motors South Korea 80 80
AFRICA – MIDDLE EAST – INDIA
Renault Algérie Algeria 100 100
Renault India Private Ltd India 100 100
Renault Maroc Morocco 80 80
Renault Maroc Service Morocco 100 100
Renault Tanger Exploitation Morocco 100 100
Renault Tanger Méditerranée Morocco 100 100
Société Marocaine de Construction Automobile (SOMACA) Morocco 77 77
EURASIA
Renault Nissan Bulgaria Bulgaria 100 100
Dacia Romania 99 99
Renault Mécanique Romania Romania 100 100
Renault Commercial Romania Romania 100 100
Renault Technologie Romania Romania 100 100
CJSC Renault Russia Russia 100 100
Oyak-Renault Otomobil Fabrikalari Turkey 52 52
Renault Ukraine Ukraine 100 100
SALES FINANCING
FRANCE
Diac France 100 100
Diac Location France 100 100

98
RCI Banque and branches France 100 100
EUROPE
RCI Versicherungs Services GmbH Germany 100 100
RCI Financial Services S.A. Belgium 100 100
Renault AutoFin S.A. Belgium 100 100
Overlease Spain 100 100
RCI zrt Hongrie Hungary 100 100
ES Mobility SRL Italy 100 100
RCI Insurance Ltd Malta 100 100
RCI Life Ltd Malta 100 100
RCI Services Ltd Malta 100 100
RCI Financial Services B.V. Netherlands 100 100
Renault Leasing Polska Sp. Z.o.o. Poland 100 100
RCICOM. SA Portugal 100 -
RCI Gest Instituiçao Financiora de Credito Portugal - (1) 100
RCI Gest Seguros – Mediadores de Seguros Portugal 100 100
RCI Finance CZ s.r.o. Czech Republic 100 100
RCI Financial Services s.r.o. Czech Republic 50 50
RCI Financial Services Ltd United Kingdom 100 100
RCI Finance S.A. Switzerland 100 100
AMERICAS
Courtage S.A. Argentina 100 100
Rombo Compania Financiera Argentina 60 60
RCI Brasil S.A. (Ex. Companhia de Arrendamento Mercantil RCI do Brasil)
Brazil 60 60
Companhia de Crédito. Financiamento e Investimento RCI do Brasil
Brazil - (1) 60
Administradora de Consorcio Renault do Brasil Brazil 100 100
Corretora de Seguros RCI do Brasil Brazil 100 100
ASIA - PACIFIC
RCI Financial Services Korea South Korea 100 100
AFRICA – MIDDLE EAST – INDIA
RCI Finance Maroc Morocco 100 100
RDFM Morocco 100 100
EURASIA
RCI Broker De Asigurare Romania 100 100
RCI Finantare Romania Romania 100 100
RCI Leasing Romania IFN Romania 100 100
LLC RN FINANCE RUS Russia 100 100
AVTOVAZ (2)
EUROPE
LADA International Ltd Cyprus 65 -
Alliance Rostec Auto B.V. Netherlands 73 (2) -
EURASIA
JOJSC Minsk-Lada Belarus 37 -
PJSC AVTOVAZ Russia 65 (2) -
JSC Avtosentr-Togliatti-VAZ Russia 33 -
JSC Bryansk Lada Russia 50 -
JSC Cheboksary-Lada Russia 60 -
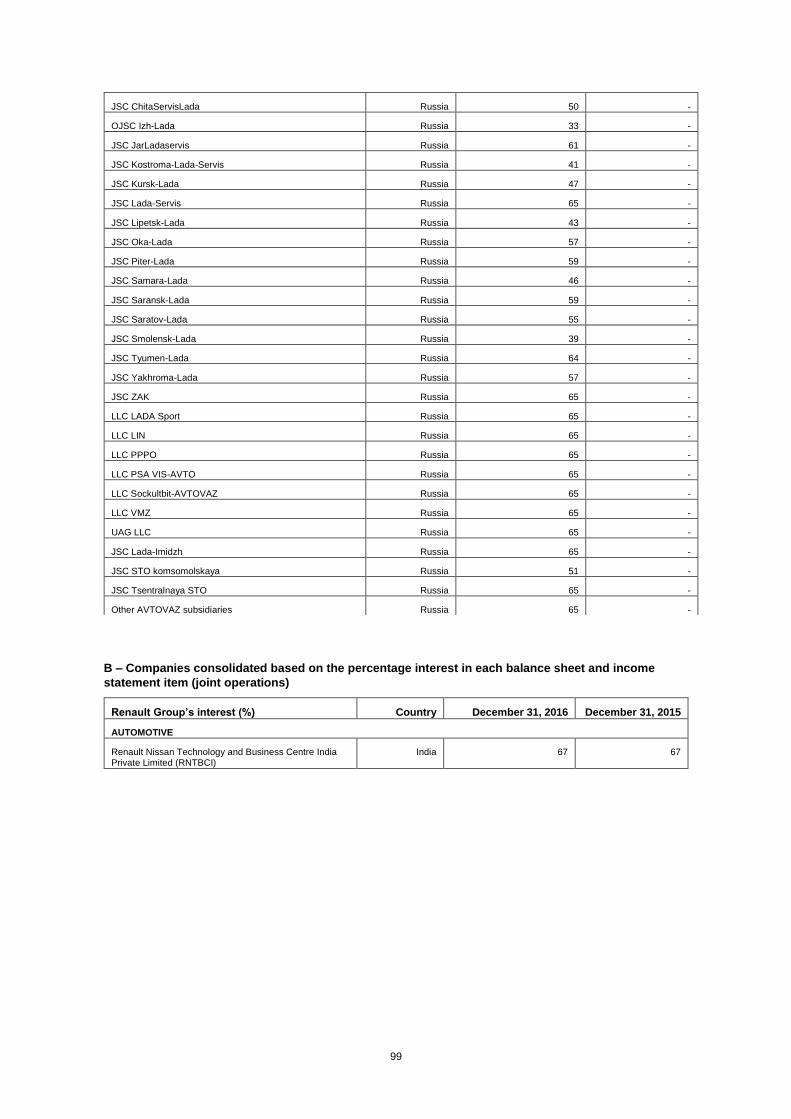
99
B – Companies consolidated based on the percentage interest in each balance sheet and income
statement item (joint operations)
Renault Group’s interest (%) Country December 31, 2016 December 31, 2015
AUTOMOTIVE
Renault Nissan Technology and Business Centre India Private Limited (RNTBCI)
India 67 67
JSC ChitaServisLada Russia 50 -
OJSC Izh-Lada Russia 33 -
JSC JarLadaservis Russia 61 -
JSC Kostroma-Lada-Servis Russia 41 -
JSC Kursk-Lada Russia 47 -
JSC Lada-Servis Russia 65 -
JSC Lipetsk-Lada Russia 43 -
JSC Oka-Lada Russia 57 -
JSC Piter-Lada Russia 59 -
JSC Samara-Lada Russia 46 -
JSC Saransk-Lada Russia 59 -
JSC Saratov-Lada Russia 55 -
JSC Smolensk-Lada Russia 39 -
JSC Tyumen-Lada Russia 64 -
JSC Yakhroma-Lada Russia 57 -
JSC ZAK Russia 65 -
LLC LADA Sport Russia 65 -
LLC LIN Russia 65 -
LLC PPPO Russia 65 -
LLC PSA VIS-AVTO Russia 65 -
LLC Sockultbit-AVTOVAZ Russia 65 -
LLC VMZ Russia 65 -
UAG LLC Russia 65 -
JSC Lada-Imidzh Russia 65 -
JSC STO komsomolskaya Russia 51 -
JSC Tsentralnaya STO Russia 65 -
Other AVTOVAZ subsidiaries Russia 65 -
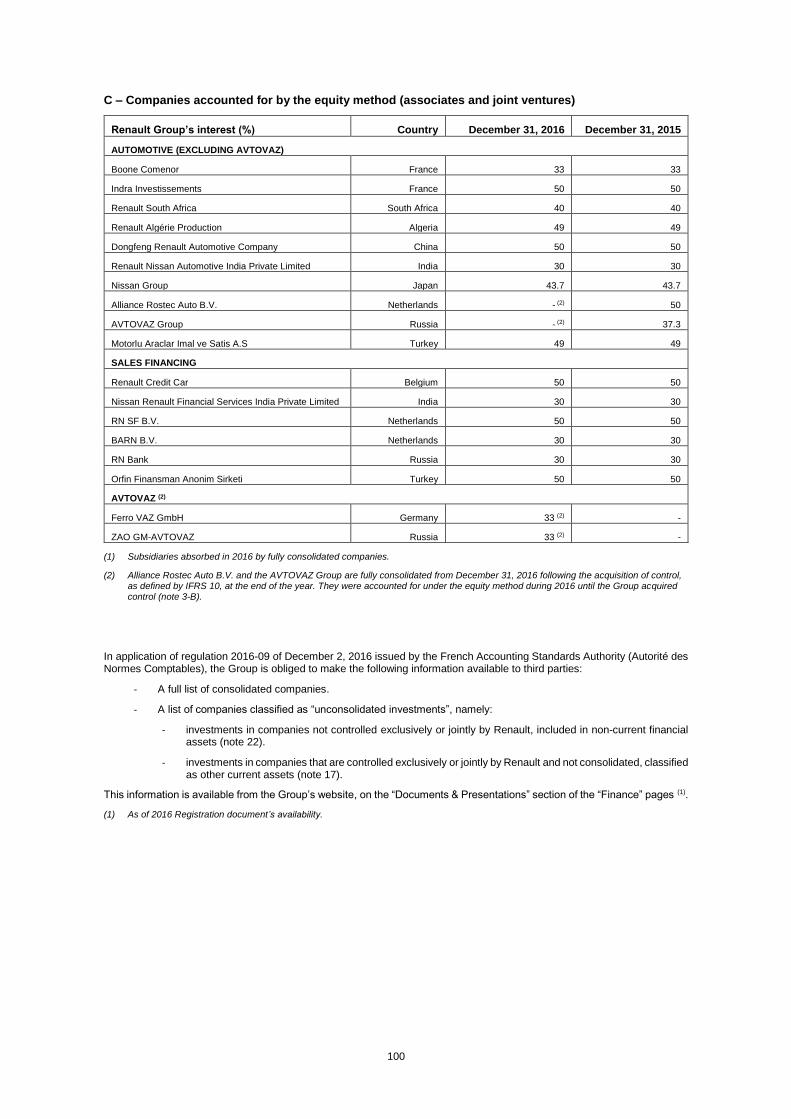
100
C – Companies accounted for by the equity method (associates and joint ventures)
Renault Group’s interest (%) Country December 31, 2016 December 31, 2015
AUTOMOTIVE (EXCLUDING AVTOVAZ)
Boone Comenor France 33 33
Indra Investissements France 50 50
Renault South Africa South Africa 40 40
Renault Algérie Production Algeria 49 49
Dongfeng Renault Automotive Company China 50 50
Renault Nissan Automotive India Private Limited India 30 30
Nissan Group Japan 43.7 43.7
Alliance Rostec Auto B.V. Netherlands - (2) 50
AVTOVAZ Group Russia - (2) 37.3
Motorlu Araclar Imal ve Satis A.S Turkey 49 49
SALES FINANCING
Renault Credit Car Belgium 50 50
Nissan Renault Financial Services India Private Limited India 30 30
RN SF B.V. Netherlands 50 50
BARN B.V. Netherlands 30 30
RN Bank Russia 30 30
Orfin Finansman Anonim Sirketi Turkey 50 50
AVTOVAZ (2)
Ferro VAZ GmbH Germany 33 (2) -
ZAO GM-AVTOVAZ Russia 33 (2) -
(1) Subsidiaries absorbed in 2016 by fully consolidated companies.
(2) Alliance Rostec Auto B.V. and the AVTOVAZ Group are fully consolidated from December 31, 2016 following the acquisition of control, as defined by IFRS 10, at the end of the year. They were accounted for under the equity method during 2016 until the Group acquired control (note 3-B).
In application of regulation 2016-09 of December 2, 2016 issued by the French Accounting Standards Authority (Autorité des Normes Comptables), the Group is obliged to make the following information available to third parties:
- A full list of consolidated companies.
- A list of companies classified as “unconsolidated investments”, namely:
- investments in companies not controlled exclusively or jointly by Renault, included in non-current financial assets (note 22).
- investments in companies that are controlled exclusively or jointly by Renault and not consolidated, classified as other current assets (note 17).
This information is available from the Group’s website, on the “Documents & Presentations” section of the “Finance” pages (1).
(1) As of 2016 Registration document’s availability.