notes on excel 2007 forecasting tools
TRANSCRIPT

8/22/2019 Notes on Excel 2007 Forecasting Tools
http://slidepdf.com/reader/full/notes-on-excel-2007-forecasting-tools 1/24
Notes on Excel 2007Forecasting Tools
► Data Table► Scenario Manager ► Goal Seek►
Solver
Paula EcklundFall 2008

8/22/2019 Notes on Excel 2007 Forecasting Tools
http://slidepdf.com/reader/full/notes-on-excel-2007-forecasting-tools 2/24
ContentsPage
Tools Introduction ................................................................................1
Data TableScenario Manager Goal SeekSolver
The Sample Workbook ........................................................................2
Tool ExamplesThe Excel 2007 Data Table ............................................................. 2
One-Input vs. Two-Input Data Tables..................................... 5
The One-Input Data TableBuilding a One-Input Data Table.................................. 6Running a One-Input Data Table................................. 6Examples of Other Uses for the One-Input
Data Table with this Model.................................. 7 A One-Input Data Table with Multiple Formulas
Example.............................................................. 8One-Input Data Table Summary.................................. 9
Data Table Manipulations
Formatting Data Table Results .................................... 10The “results array” ....................................................... 10Changing the structure and re-running ........................ 10Labeling tip .................................................................. 11
The Two-Input Data Table...................................................... 12Two-Input Data Table Summary.................................. 13
Scenario Manager ........................................................................... 13
Goal Seek......................................................................................... 17
Solver ........................................................................................................ 18
8-8-2008

8/22/2019 Notes on Excel 2007 Forecasting Tools
http://slidepdf.com/reader/full/notes-on-excel-2007-forecasting-tools 3/24
1
Tools Introduction
Data Table
Excel’s Data Table is a powerful sensitivity analysis tool that shows howchanging certain values in a model’s formulas might affect critical elements ofthe model. Data tables provide a shortcut for generating multiple views for amodel in a single operation as well as a way to view and compare the results ofall of the variations together on a single worksheet. There are two varieties ofData Table: one-input and two-input. To run a Data Table, establish the properData Table layout and data and then use the commands Data, Table to open the“Table” dialog. Using the prompts in the “Table” dialog, link the Data Tableinput values to the model and click OK to run.
Scenario Manager
A scenario is a set of values that Excel saves and can substitute on command in aworksheet model. You can create and save different groups of values on aworksheet and then switch to any of these new scenarios to view different modelresults. For example, if you create a budget worksheet but are uncertain whatrevenue value to include, you can define different values for the revenue andthen switch between the scenarios to perform what-if analyses. To buildscenarios, choose Tools, Scenarios to open the “Scenario Manager” dialog. Followthe prompts.
Goal Seek
When you know the result you want from a single formula but not the inputvalue the formula needs to determine the result, use Excel’s Goal Seek. When
goal seeking, Excel varies the value in a worksheet cell you specify until theformula that's dependent on that cell returns the result you want.
Solver
Excel’s Solver is a problem-solving tool like Goal Seek; however, the Solverprovides a much more powerful and flexible approach. Use Solver to determinethe maximum or minimum value of one cell by changing other cells— forexample, the maximum profit you can generate by changing advertisingexpenditures. You specify one or more “changing cells” which must be relatedthrough formulas on the worksheet. In addition, you can establish modelconstraints, and Solver will search for a solution without violating the
constraints. Solver adjusts the values in the changing cells you specify to producethe result you want from the formula. Solver is an Excel add-in, but is part ofExcel. If you don’t find Solver on the ribbon, add it by opening the “ExcelOptions” dialog and going to the “Add-Ins” section. You may need to return toyour Excel software media to add it as an option to your Excel installation.

8/22/2019 Notes on Excel 2007 Forecasting Tools
http://slidepdf.com/reader/full/notes-on-excel-2007-forecasting-tools 4/24
2
The Sample WorkbookA multi-tabbed Excel file named ForecastingTools2007.xlsm is available for download ifyou want to experiment with the examples that follow and see them in context. If youdon’t have the sample workbook or would rather focus just on the text in this document,there are plenty of illustrations; using the workbook isn’t necessary.
Tool Examples
► The Excel 2007 Data Table
To illustrate the features of Excel 2007’s Data Table we make use of a monthly incomestatement for a firm named Triangle Widgets, Inc. If you’re following along with theForecastingTools2007.xlsm workbook, make the “Data Table” tab current.
As you might expect, this income statement model uses formulas, not static values, formany cells. For example, the Total Revenue, Total Variable Expenses, and Total FixedExpenses are formulas. Changing the value of one or more of cells that determine thevalues of these items changes the model. In particular the important Summary values(Total Expenses and Operating Income) are affected by any change in contributingvalues.

8/22/2019 Notes on Excel 2007 Forecasting Tools
http://slidepdf.com/reader/full/notes-on-excel-2007-forecasting-tools 5/24
3
The view of the worksheet with formulas displayed (toggle: CTRL+`) makes the modelrelationships clearer.
An alternative to displaying formulas is to use the “TraceDependents” tool in the “Formula Auditing” group on
the “Formulas” ribbon.
Click any cell and click the “TraceDependents” button one or more times
for a graphical view of how cell valuesdetermine formula results.

8/22/2019 Notes on Excel 2007 Forecasting Tools
http://slidepdf.com/reader/full/notes-on-excel-2007-forecasting-tools 6/24
4
As you examine the Triangle Widgets monthly income statement you might want theanswers to some questions that this model can provide. For example: 1
What happens to Operating Income (the bottom line) if Triangle Widgets sells2000, 2500, or 3000 units per month instead of 1,200?
If the company sells 2000 units how do expenses change? What’s the impact onexpenses if 3000 units are sold? 4000?
What happens if Triangle Widget’s leasing costs go up by 20%? By 25% By 30%?
What happens if the manufacturing cost per unit goes down by an eighth? By aquarter? By a third?
Much of the power of Excel comes from its dynamic modeling capability. If you want toknow the effect on the bottom line if Units Sold is 3,000 instead of 1,200 it’s easy to findout. Replace the 1,200 value in Cell C5 with 3000. The Operating Income value
automatically changes from $13,300 to $119,500.
1 As the model is currently constructed there are also some kinds of questions (that involve morecomplex calculations and assumptions) that you can not answer. For example, in this model thefixed expense value for “Advertising” is a static number. While changing the static advertisingvalue will affect the bottom line, the model can’t show how a change might affect “Units Sold”. Soyou can’t use this model to answer the question “How would an increase in advertising affectunit sales?”

8/22/2019 Notes on Excel 2007 Forecasting Tools
http://slidepdf.com/reader/full/notes-on-excel-2007-forecasting-tools 7/24
5
Certainly changing the values of model cells can be a useful exercise. However, if youwant to look at the results of a large number of changes, manually editing and recordingthe results becomes a tedious task. The Data Table can help you forecast results quicklyand efficiently. The Data Table is constructed outside of the model, but is linked to it.When you run the Data Table, you read its analysis in the Data Table results area. The
model itself doesn’t change.
Some of the advantages of using a Data Table for this kind of task instead of justchanging values in the model itself are:
Any number of values can be included in the Data Table as substitutes for amodel value. For example, with a Data Table it’s easy how a wide range ofproduction level values (Units Sold) affect operating income instead of viewingone at a time the effect of a change in Units Sold on the model.
The Data Table results are displayed visible in a conveniently small matrix.
Data Tables can be a bit tricky to work with only because you must understand the DataTable layout Excel requires and how to execute the Data Table properly.
One-Input vs. Two-Input Data Tables
The Data Table is available in two “flavors”: One-Input and Two-Input. Both areillustrated in these notes. The differences in brief are:
In a One-Input Data Table, the Data Table has multiple substitute values for a single model value. It has at least one formula from the model. The formula’s results (asdisplayed in the Data Table results area) must depend on the chosen Data Table input
value either directly or indirectly. A One-Input Data Table may have more than oneformula from the model. If it has more than one formula, the One-Input Data Table isgenerally built with input values arranged down a column and formulas across the toprow.
In a Two-Input Data Table, the Data Table has two substitute values, one set for each oftwo model values. It can have only a single formula from the model. One set of inputs isarranged down a column, the other set of inputs is arranged along a row, and theformula is in the intersecting cell above the first column input and to the left of the firstrow input.
The layout of the two types and the differences between them will be more obvious inthe examples that follow.

8/22/2019 Notes on Excel 2007 Forecasting Tools
http://slidepdf.com/reader/full/notes-on-excel-2007-forecasting-tools 8/24
6
Building a One input Data Table
I locate a One-Input Data Table to the right of the income statement model on the “DataTable” worksheet. My Data Table will operate on different values for “Units Sold” (inmodel Cell C5) and track the effects of those different values on “Total Revenue” (inmodel Cell C7).
To build the Data Table I locate input values for “Units Sold” down one column. In theillustration below the values range from 800 to 1,500 in increments of 100. This columnbecomes the left-hand edge of the Data Table. One column to the right of the inputs andone row above the first column input I locate a reference to the model cell whose value Iwant to track: “Total Revenue”. The structure of the One-Input Data Table with a singleformula looks like this:
Notice that the Total Revenue formula in the model can be either a copy of the formulain the model or a reference to the model cell that holds the original formula.
Running a One-Input Data TableOnce the Data Table is constructed it’s ready to run. Followthese steps:
1) Select the Data Table range (the column of inputcells, the formula, the blank cells to the right of theinputs, and the blank cell to the left of the formula).
2) From the “Data” tab choose the “Data Tools” groupand the “What-If Analysis” drop-down.
3) Choose Data Table… from the drop-down.
The Total Revenueformula from the model(Cell C7).
“UnitsSold”values

8/22/2019 Notes on Excel 2007 Forecasting Tools
http://slidepdf.com/reader/full/notes-on-excel-2007-forecasting-tools 9/24
7
4) A “Data Table” dialog displays, prompting for a row input cell and a columninput cell. This dialog serves both the One-Input and the Two-Input Data Tables,but for a One-Input Data Table arranged like the one I built the “Row input cell”prompt is irrelevant. Leave that box blank.
For the “Column input cell” box, indicate the cell in themodel for which your Data Table input values willsubstitute. In this model, that’s Cell C5, the cell holdingthe number of units sold.
5) Click OK . Excel fills the DataTable results area withcalculated values.
Read the results like this:
When Units Sold = Then Total Revenue =800 80,000900 90,0001,000 100,000Etcetera.
If you have a “target” value for Total Revenue, you can zero in on the number ofunits that must be sold in a month to reach that value.
Examples of Other Uses for the One-Input Data Table with this Model
A One-Input Data Table could be constructed with this model to:
Vary and see the effect on
Price per Unit Total Revenue
Manufacturing Expenses Total Variable ExpensesAdministration Total Fixed ExpensesAdministration Total Expenses
Units Produced Operating IncomeEtcetera
8/22/2019 Notes on Excel 2007 Forecasting Tools
http://slidepdf.com/reader/full/notes-on-excel-2007-forecasting-tools 10/24
8
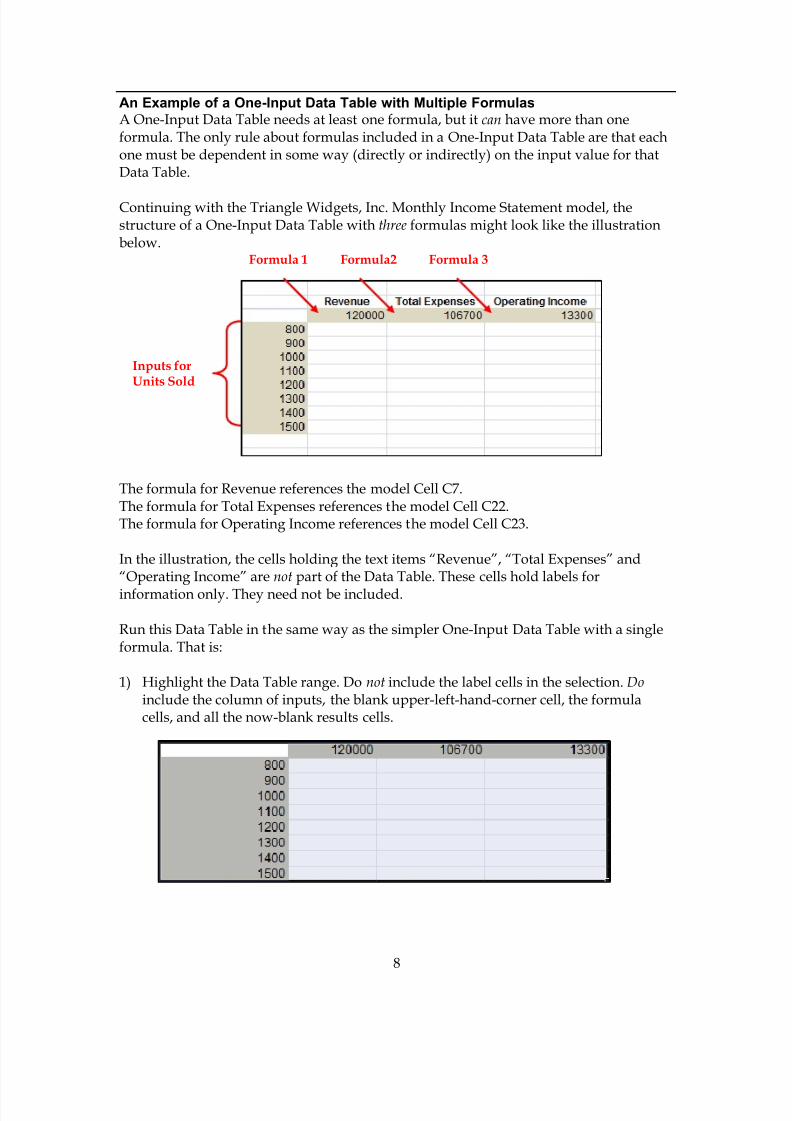
An Example of a One-Input Data Table with Multiple Formulas
A One-Input Data Table needs at least one formula, but it can have more than oneformula. The only rule about formulas included in a One-Input Data Table are that eachone must be dependent in some way (directly or indirectly) on the input value for thatData Table.
Continuing with the Triangle Widgets, Inc. Monthly Income Statement model, thestructure of a One-Input Data Table with three formulas might look like the illustrationbelow.
The formula for Revenue references the model Cell C7.The formula for Total Expenses references the model Cell C22.The formula for Operating Income references the model Cell C23.
In the illustration, the cells holding the text items “Revenue”, “Total Expenses” and“Operating Income” are not part of the Data Table. These cells hold labels for
information only. They need not be included.
Run this Data Table in the same way as the simpler One-Input Data Table with a singleformula. That is:
1) Highlight the Data Table range. Do not include the label cells in the selection. Doinclude the column of inputs, the blank upper-left-hand-corner cell, the formulacells, and all the now-blank results cells.
Inputs forUnits Sold
Formula 1 Formula2 Formula 3

8/22/2019 Notes on Excel 2007 Forecasting Tools
http://slidepdf.com/reader/full/notes-on-excel-2007-forecasting-tools 11/24
9
2) On the “Data” tab choose the “Data Tools” group and the “What-If Analysis” icon.3) From the drop-down that displays choose “Data Table…” and complete the “Data
Table” dialog, indicating Cell C5 (Units Sold) as the Data Table’s column input cell.4) Click OK.
Excel generates results in the Data Table. Read the results of this Data Table in the sameway you read the earlier one.
For example: When 800 units are sold, Total Revenue is 80,000, Total Expenses are 90,300,
and Operating Income is -10,300. When 1,500 units are sold, Total Revenue is 150,000, Total Expenses are
119,000, and Operating Income is 31,000.
One input Data Table Summary
A One-Input Data Table varies one model value to see the effect on one or more othervalues in the model. The focus can be on the change to a single model value (such asTotal Revenue). Or, changes to multiple model values (Total Revenue, Total Expenses,and Operating Income) can be shown, as in the example above. The One-Input DataTable can be expanded or contracted by changing the column of input values. Use theData Table to quickly see the results of a range of changes to a model value on one or
more model formulas you want to track.

8/22/2019 Notes on Excel 2007 Forecasting Tools
http://slidepdf.com/reader/full/notes-on-excel-2007-forecasting-tools 12/24
10
Data Table Manipulations
Formatting Data Table ResultsYou may want to format the values in the Data Table. Use Excel’s regular formattingtools.
The “results array”The results area of the Data Table does not contain “regular” numeric values. Instead,because of the way Excel processes the data to generate the values, the results area cellsare filled with array values.
Because of the array structure:You can not change or delete any single value in the results array.You can format any single value in the results array.You can delete all the results array values at the same time.
Changing the Structure and Re-Running You may very well find that you work with a Data Table in an iterative way. That is, youcreate an initial Data Table and after viewing the results you decide to modify the inputvalues, change the input values, or change the model formula(s) you’re tracking.
It’s simple to make structural changes to the Data Table. Changing the Data Tablestructure automatically changes values in the Data Table results area. Example:
You must re-run the Data Table manually only if:1) You erase the results area.2) You expand the number of input values or the number of formulas.
Array notation for resultsvalues.
Initial Data Table Input values changed.
Results area valuesautomatically update.

8/22/2019 Notes on Excel 2007 Forecasting Tools
http://slidepdf.com/reader/full/notes-on-excel-2007-forecasting-tools 13/24
11
In the illustration at left, theoriginal One-Input DataTable has been executed andresults are shown. Thelavender areas show new
input values added and newtracking formulas added. TheData Table must be manuallyre-run to account for thisexpanded structure.
Labeling TipIn the illustration at left below, the Data Table cell holding a reference to the model’sTotal Revenue formula displays the current Total Revenue value in the model; that is,120000. The cell above that value holds a text label “Revenue” which is not part of theData Table. In the illustration at right below, the Data Table cell holding a reference tothe model’s Total Revenue formula has been reformatted using a “Custom” format so itdisplays the text “Total Revenue” instead of 120000. This reformat makes a separate out-of-Data Table label cell unnecessary.
Cell holding a referenceto the “Total Revenue”
calculation in themodel.
Textlabel.
Entered in doublequote marks.
8/22/2019 Notes on Excel 2007 Forecasting Tools
http://slidepdf.com/reader/full/notes-on-excel-2007-forecasting-tools 14/24
12
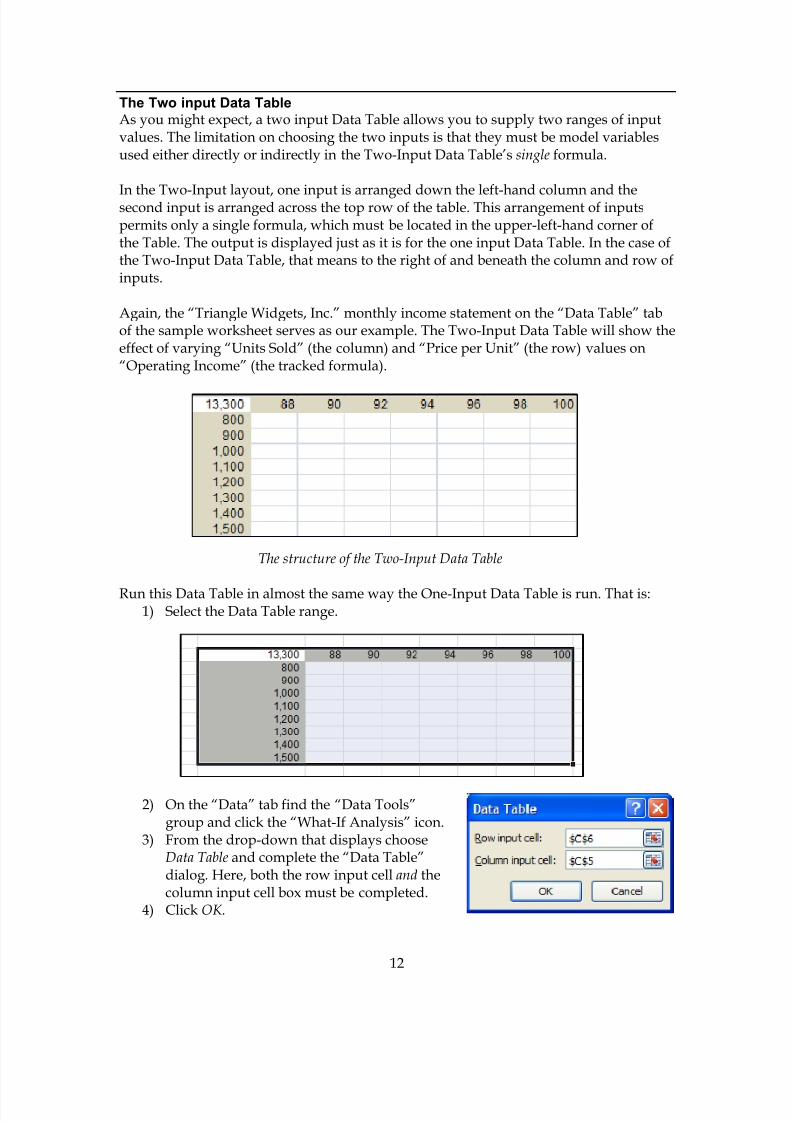
The Two input Data Table
As you might expect, a two input Data Table allows you to supply two ranges of inputvalues. The limitation on choosing the two inputs is that they must be model variablesused either directly or indirectly in the Two-Input Data Table’s single formula.
In the Two-Input layout, one input is arranged down the left-hand column and thesecond input is arranged across the top row of the table. This arrangement of inputspermits only a single formula, which must be located in the upper-left-hand corner ofthe Table. The output is displayed just as it is for the one input Data Table. In the case ofthe Two-Input Data Table, that means to the right of and beneath the column and row ofinputs.
Again, the “Triangle Widgets, Inc.” monthly income statement on the “Data Table” tabof the sample worksheet serves as our example. The Two-Input Data Table will show theeffect of varying “Units Sold” (the column) and “Price per Unit” (the row) values on“Operating Income” (the tracked formula).
The structure of the Two-Input Data Table
Run this Data Table in almost the same way the One-Input Data Table is run. That is:1) Select the Data Table range.
2) On the “Data” tab find the “Data Tools”group and click the “What-If Analysis” icon.
3) From the drop-down that displays chooseData Table and complete the “Data Table”dialog. Here, both the row input cell and thecolumn input cell box must be completed.
4) Click OK .

8/22/2019 Notes on Excel 2007 Forecasting Tools
http://slidepdf.com/reader/full/notes-on-excel-2007-forecasting-tools 15/24
13
Excel fills in the results matrix. Read the Two-Input Data Table results by reading acrossa row and down a column. For example, if 1,400 units are sold at $96/unit, OperatingIncome is $19,500.
The same manipulations that apply to the One-Input Data Table also apply to the Two-Input Data Table.
Two input Data Table Summary
A Two-Input Data Table varies two model values to see the effect on a single calculatedvalue in the model. Both inputs must be referenced by the calculation either directly orindirectly. The Two-Input Data Table can be extended or contracted by changing thecolumn and row of input values. Use the Two-Input Data Table to quickly see the resultsof a range of changes to two model values on a single model formula you want to track.
►Scenario Manager For an example of Excel’s Scenario Manager we again return to the “Income Statement”worksheet in the ForecastingTools2007.xlsm workbook. Above, we generated two kindsof Data Tables to summarize how a change in one or two values affects other values inthe model. Here, we do something similar. However, instead of showing the changedvalues in a table of results we show a number of possible variations individually asdifferent worksheet scenarios. This method has the advantage of allowing the viewer tosee the changes within the worksheet itself and is often useful if you have a smallnumber of scenarios you want to work with or present.
The Scenario Manager is available
from the same set of “What-IfAnalysis” tools that contain theData Table. Click the “Data Tab”and choose the “Data Tools”group. Click the “What-IfAnalysis” drop-down and select“Scenario Manager…”

8/22/2019 Notes on Excel 2007 Forecasting Tools
http://slidepdf.com/reader/full/notes-on-excel-2007-forecasting-tools 16/24
14
Excel opens the “ScenarioManager” dialog. The dialoginitially looks like the one atleft. No scenarios currently are
defined.
We create three new scenarios:Low Cost, Competitive, andHigh Cost. In addition, forconvenience, I’ll add ascenario named Status Quothat shows the original modelvalues.
Once the scenarios are built wecan use the manager to viewany scenario by itself and/orgenerate a summary thatcompares the scenarios.
To create a scenario:1) Click the Add… button on the “Scenario Manager” dialog. The “Edit Scenario”
dialog opens.2) Complete the “Edit Scenario” dialog. In the example below, we build a scenario
named “High Cost” and elect in this scenario to change the cells C5, C6, and C10.In the model those are the “Units Sold”, “Price per Unit”, and “Material Cost perUnit” cells.
3) Click OK .

8/22/2019 Notes on Excel 2007 Forecasting Tools
http://slidepdf.com/reader/full/notes-on-excel-2007-forecasting-tools 17/24
15
4) Excel displays a “Scenario Values” dialog and prompts for values for each of themodel cells identified as changing cells. If these cells are range-named, Excel usesthe names in the dialog, making it much easier to work with the scenario.
“High Cost” values are s shownin the illustration at left.
5) Click OK to return to the“Scenario Manager” dialog.From this dialog additionalscenarios can be added by goingthrough the same steps,beginning with clicking the Add… button. Add as manyscenarios as you like.
6) To display a scenario, return tothe “Scenario Manager” dialog,select a scenario by name, andclick the Show button at thebottom of the dialog.
The cells in red at left areidentified as changing cells.
Excel substitutes into themodel the values youestablished for the scenario
you selected. You see thechanges and their effects inthe context of the entiremodel. This is very differentfrom the looking at a DataTable results area, forexample.

8/22/2019 Notes on Excel 2007 Forecasting Tools
http://slidepdf.com/reader/full/notes-on-excel-2007-forecasting-tools 18/24
16
Show a different scenario by selecting its name in the “Scenario Manager” dialog.Put the “Scenario Manager” dialog away by clicking its Close button.
The scenarios you build are automatically saved when you save your workbook.You can call them up to view or edit at any time.
7) Generate a summary of the various scenarios you’ve built by clicking theSummary… button on the “Scenario Manager” dialog.
8) Excel opens a “Scenario Summary” dialogthat prompts for the type of report(summary or PivotTable) and “result cells”.Result cells are cells you want the summaryreport to track. In the illustration below, wetrack “Total Expenses” (Cell C22) and“Operating Income” (C23).
9) Click OK . Excel inserts a new worksheet into the workbook and gives it the name“Scenario Summary” The summary devotes one column to each of the scenarios(“Low Cost”, “Competitive”, and “High Cost”) and one column to document themodel’s original values (“Current Values”). The values for cells identified asscenario changing cells are shown, as are values under each scenario for theresult cells identified when building the summary. Use the outline symbols todisplay just the changing cells, just the result cells, or both.
The summary below shows that the “Low Cost” scenario would result in anegative value for Operating Income and, not surprisingly, the “High Cost”scenario would generate the highest profit.

8/22/2019 Notes on Excel 2007 Forecasting Tools
http://slidepdf.com/reader/full/notes-on-excel-2007-forecasting-tools 19/24
17
►Goal SeekWhen you know the result you want from a single formula but not the input value theformula needs to determine that result, use Excel’s Goal Seek. When goal seeking, Excelvaries the value in the cell you specify until a formula that's dependent on that cell
returns the result you want.
This example is from the “Goal Seek” tab in the ForecastingTools2007.xlsm workbook.In that worksheet a small model uses Excel’s PMT function to calculate the monthlyrepayment cost for a loan of $100,000 over 15 years (180 months) at 5% interest. Themonthly payment is $790.79.
Suppose the borrower can afford to pay more per month on the loan. They want to seehow much larger a loan they can afford at a repayment rate of $1,000 per month. UseGoal Seek and identify the “Loan Amount” (Cell C4) as the value that Goal Seek canchange. Excel changes this value in the model until the payment value in C7 equals$1,000.
To open the “Goal Seek” dialog,click the “Data” tab and find the“Data Tools” group. Choose the“What-If Analysis” button andselect Goal Seek… from the drop-down that displays.
A “Goal Seek” dialog opens. Identify the “set cell”, orthe cell whose value you know you want to change.The “set cell” must hold a formula. In the “to value”
box enter the value you want the formula to return.In the “by changing cell” identify one model cell thataffects the formula you identified and that holds avalue you will allow Goal Seek to change.
Click OK .

8/22/2019 Notes on Excel 2007 Forecasting Tools
http://slidepdf.com/reader/full/notes-on-excel-2007-forecasting-tools 20/24
18
Goal seek goes to work and if it finds asolution it displays a “Goal Seek Status”dialog with its results.
To keep the results click OK . To discard theresults click Cancel.
In this example, Goal Seek has foundthat the borrower can add $26,455 tothe loan amount.
►Solver
Excel’s Solver is a powerful tool for forecasting and what-if analysis. For an example ofSolver we use the data on the “Solver” worksheet in the Forecasting Tools2007.xlsmworkbook. Start by taking a look at that worksheet.

8/22/2019 Notes on Excel 2007 Forecasting Tools
http://slidepdf.com/reader/full/notes-on-excel-2007-forecasting-tools 21/24
19
The worksheet shows the five different widget models that Triangle Widgets makes(Red, Blue, etc. in Row 6) along with the profit per unit for each model (Row 7), and theproduction levels for October (Row 8, 10 for each type). An Excel SUMPRODUCTformula in Cell B4 near the top of the worksheet calculates the Total Profit that will begenerated by the current production levels.
As written, however, there’s a problem with the values in this model. In the section ofthe worksheet that details widget components are two columns that track the number ofwidget parts required for the current level of production: “Parts Required” and “Partson Hand”. At the production levels currently in the model -- 10 widgets of each type --the company has exceeded parts-on-hand quantities for components B (by 30) and E (by40). So the Production Level values in the model show an impossible scenario. Althoughthe model shows a Total Profit of $3,150.00, it’s at the expense of the reality in thefactory.
To change the Production Level values to get the highest possible Total Profit withoutviolating any of the Parts on Hand and Parts Required constraints, one could change thefive Production Level values in the model manually. This would require experimentingwith different combinations until a combination that maximizes profit is found, whilekeeping within the constraints. Unfortunately, to be sure to maximize profits thisexperimental, manual process could take quite a bit of time. In a large problem, amanual method might prove to be simply impractical.
As an alternative to a manual method, Excel’s Solver tool can maximize total profit inthis model, quickly finding the best solution. Solver is an Excel add-in that’s part of theExcel program. That is, when you purchase Excel, you get Solver automatically (whetheror not it’s actually installed). If installed, Solver appears on Excel 2007’s “Data” tab inthe “Analysis” group. Start Solver and the “Solver Parameters” dialog opens.

8/22/2019 Notes on Excel 2007 Forecasting Tools
http://slidepdf.com/reader/full/notes-on-excel-2007-forecasting-tools 22/24
20
The “Solver Parameters” dialog shown below has already been completed for theTriangle Widgets model. Notice that there are three main segments in this dialog box.They define the “set” cell, the changing cells, and any constraints.
The “Set” Cell or TargetBegin with the “set” cell or target cell. In our example, the target is Total Profit, in CellB4. To maximize total profit click the “Max” option. Solver can also minimize or find aparticular value (like Goal Seek).
The Changing CellsIdentify the model cells that Solver can change to find its solution. The changing cells
should be related to the target cell, of course. In our example, the changing cells are thenumber of widgets to make, or the Production Level values. The changing cells need notbe contiguous in the worksheet and there can be any number of changing cells.
ConstraintsFinally, identify any constraints Solver should take into account when finding a solution.Although it appears that there’s a text box in which to enter constraints, that’s not thecase. To enter a constraint, click inside the “Subject to the Constraints” box and click the Add button. Solver then displays a special mini-dialog in which to enter the constraint inthe correct format.
8/22/2019 Notes on Excel 2007 Forecasting Tools
http://slidepdf.com/reader/full/notes-on-excel-2007-forecasting-tools 23/24
21
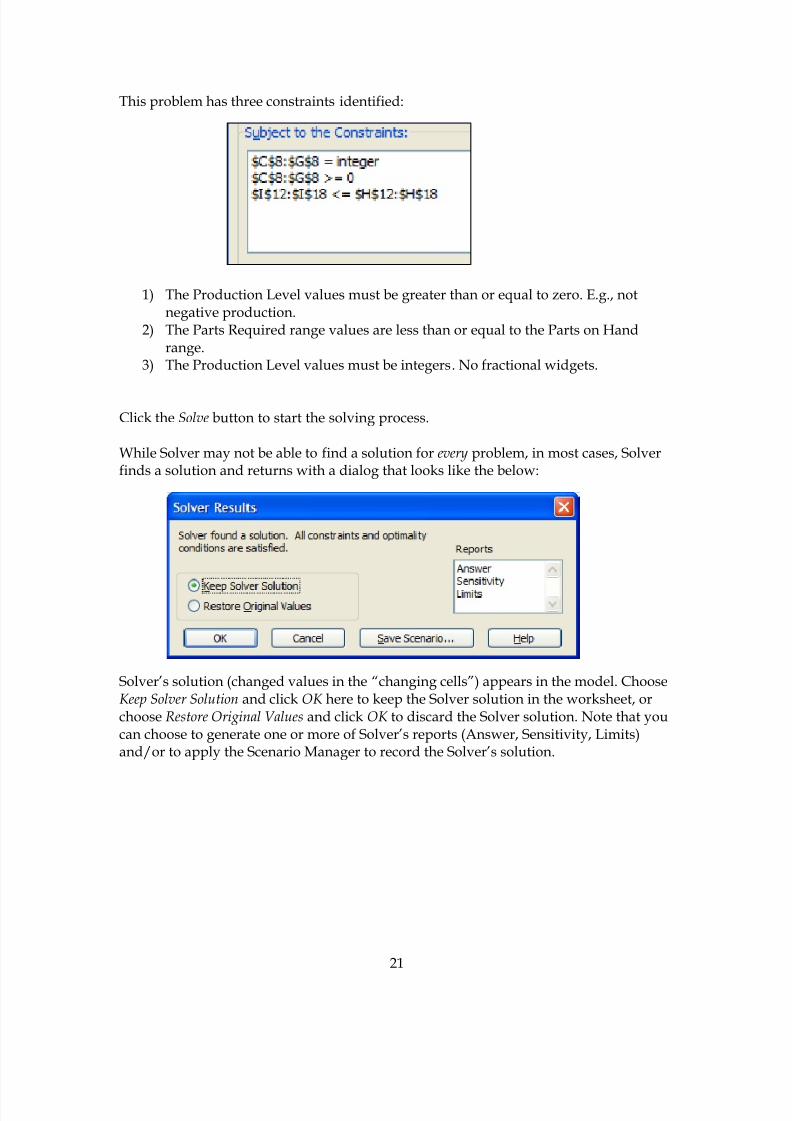
This problem has three constraints identified:
1) The Production Level values must be greater than or equal to zero. E.g., notnegative production.
2) The Parts Required range values are less than or equal to the Parts on Handrange.
3) The Production Level values must be integers. No fractional widgets.
Click the Solve button to start the solving process.
While Solver may not be able to find a solution for every problem, in most cases, Solverfinds a solution and returns with a dialog that looks like the below:
Solver’s solution (changed values in the “changing cells”) appears in the model. ChooseKeep Solver Solution and click OK here to keep the Solver solution in the worksheet, orchoose Restore Original Values and click OK to discard the Solver solution. Note that youcan choose to generate one or more of Solver’s reports (Answer, Sensitivity, Limits)and/or to apply the Scenario Manager to record the Solver’s solution.

8/22/2019 Notes on Excel 2007 Forecasting Tools
http://slidepdf.com/reader/full/notes-on-excel-2007-forecasting-tools 24/24
The model with Solver’s solution in place looks like this:
Solver found a reasonable maximum total profit by eliminating the red and blue widgetsfrom the production schedule and adjusting the production levels of the three otherwidget types considerably.
Note that Solver respected the constraints we defined:No production level is less than zero.The values in the Parts Required column are less than or equal to the Parts onHand values.All the production level recommendations are for integer quantities.
End