note - institute for telecommunication sciences - its · web viewpacket-switched transport (e.g.,...
TRANSCRIPT

VQEG Hybrid Testplan Version 1.4
Hybrid Perceptual/Bitstream GroupTEST PLAN
Draft Version 1.897Jan. 25, 2010
Contacts: Jens Berger (Co-Chair) Tel: +41 32 685 0830 Email: [email protected] Lee (Co-Chair) Tel: +82 2 2123 2779 Email: [email protected] David Hands (Editor) Tel: +44 (0)1473 648184 Email: [email protected] Staelens (Editor) Tel: +32 9 331 49 75 Email: [email protected] Dhondt (Editor) Tel: +32 9 331 49 85 Email: [email protected]
Hybrid Test Plan DRAFT version 1.4. June 10, 2009
Editors Note: unresolved issues or missing data are annotated by the string <<XXX>>

VQEG Hybrid Testplan Version 1.4
Editorial History
Version Date Nature of the modification
1.0 May 9, 2007 Initial Draft, edited by A. Webster (from Multimedia Testplan 1.6)
1.1 Revised First Draft, edited by David Hands and Nicolas Staelens
1.1a September 13, 2007
Edits approved at the VQEG meeting in Ottawa.
1.2 July 14, 2008 Revised by Chulhee Lee and Nicolas Staelens using some of the outputs of the Kyoto VQEG meeting
1.3 Jan. 4, 2009 Revised by Chulhee Lee, Nicolas Staelens and Yves Dhondt using some of the outputs of the Ghent VQEG meeting
1.4 June 10, 2009 Revised by Chulhee Lee using some of the outputs of the San Jose VQEG meeting
1.5 June 23, 2009 The previous decisions are incorporated.
1.6 June 24, 2009 Additional changes are made.
1.7 Jan. 25, 2010 Revised by Chulhee Lee using the outputs of the Berlin VQEG meeting
1.8 Jan. 28, 2010 Revised by Chulhee Lee using the outputs of the Boulder VQEG meeting
Summary of Changes (V1.7)
ToR is added to Appendix
ACR with 11 points
HD monitor use for SDTV test
Size of common set
PVS admissibility, reference decoder, working system (Section 6.4)
Hybrid Testplan DRAFT version 1.0. 9 May 2007 2/87

VQEG Hybrid Testplan Version 1.4
Summary
1. Introduction 6
2. List of Definitions 7
3. List of Acronyms 9
4. Subjective Evaluation Procedure 10
4.1. The ACR Method with Hidden Reference Removal 204.1.1. General Description 204.1.2. Application across Different Video Formats and Displays 204.1.3. Display Specification and Set-up 204.1.4. Test Method 204.1.5. Evaluators 오류! 책갈피가 정의되어 있지 않습니다.4.1.6. Viewing Conditions 204.1.7. Experiment design 204.1.8. Randomization 204.1.9. Test Data Collection 20
4.2. Data Format 204.2.1. Results Data Format 204.2.2. Subjective Data Analysis 20
5. Test Laboratories and Schedule 21
5.1. Independent Laboratory Group (ILG) 21
5.2. Proponent Laboratories 21
5.3. Test procedure and schedule 22
1.1. 22
6. Sequence Processing and Data Formats 24
6.1. Sequence Processing Overview 246.1.1. Duration of Source Sequences 246.1.2. Camera and Source Test Material Requirements 266.1.3. Software Tools 266.1.4. Colour Space Conversion 266.1.5. De-Interlacing 276.1.6. Cropping & Rescaling 276.1.7. Rescaling 286.1.8. File Format 286.1.9. Source Test Video Sequence Documentation 29
6.2. Test Materials 296.2.1. Selection of Test Material (SRC) 30
6.3. Hypothetical Reference Circuits (HRC) 306.3.1. Video Bit-rates 316.3.2. Simulated Transmission Errors 316.3.3. Live Network Conditions 336.3.4. Pausing with Skipping and Pausing without Skipping 33
Hybrid Testplan DRAFT version 1.0. 9 May 2007 3/87

VQEG Hybrid Testplan Version 1.4
6.3.5. Frame Rates 346.3.6. Pre-Processing 356.3.7. Post-Processing 356.3.8. Coding Schemes 356.3.9. Processing and Editing Sequences 35
7. Objective Quality Models 36
7.1. Model Type 39
7.2. Model Input and Output Data Format 39
7.3. Submission of Executable Model 42
7.4. Registration 43
8. Objective Quality Model Evaluation Criteria 45
8.1. Evaluation Procedure 45
8.2. PSNR 45
8.3. Data Processing 468.3.1. Calculating DMOS Values 468.3.2. Mapping to the Subjective Scale 468.3.3. Averaging Process 478.3.4. Aggregation Procedure 47
8.4. Evaluation Metrics 478.4.1. Pearson Correlation Coefficient 478.4.2. Root Mean Square Error 48
8.5. Statistical Significance of the Results 498.5.1. Significance of the Difference between the Correlation Coefficients 498.5.2. Significance of the Difference between the Root Mean Square Errors 508.5.3. Significance of the Difference between the Outlier Ratios 50
9. Recommendation 52
10. Bibliography 53Introduction56Packet switched radio network 56Wireline Internet 57Circuit switched radio network 57Summary of transmission error simulators 57References 59Installation and preparation 61Running the program 61Setup-file parameters 62Example of a setup-file 63
Transformation of source test sequences to UYVY AVI files 68
AviSynth Scripts for the common transformations 69
UYVY Raw to UYVY AVI 70
UYVY Raw to RGB AVI 70
Hybrid Testplan DRAFT version 1.0. 9 May 2007 4/87
VQEG Hybrid Testplan Version 1.4
RGB AVI to UYVY AVI 71
Processing and Editing Sequences 71
Calibration 72
UYVY Decoder to UYVY Raw / UYVY AVI 72
Notes 73
Hybrid Testplan DRAFT version 1.0. 9 May 2007 5/87

1. Introduction
This document defines the procedure for evaluating the performance of objective perceptual quality models submitted to the Video Quality Experts Group (VQEG) formed from experts of ITU-T Study Groups 9 and 12 and ITU-R Study Group 6. It is based on discussions from various meetings of the VQEG Hybrid perceptual bit-stream working group (HBS) recorded in the Editorial History section at the beginning of this document.
The goal of the VQEG HBS group is to evaluate perceptual quality models suitable for digital video quality measurement in video and multimedia services delivered over an IP network. The scope of the testplan covers a range of applications including IPTV, internet streaming and mobile video. The primary point of use for the measurement tools evaluated by the HBS group is considered to be operational environments (as defined in Figure X, Section Y), although they may be used for performance testing in the laboratory.
For the HBS testing, audio-video test sequences will be presented to evaluators (viewers). Evaluators will provide three quality ratings for each test sequence: a video quality rating (MOSV), an audio quality rating (MOSA) and an overall quality rating (MOSAV). Models may predict the quality of the video only or provide all three measures for each test sequence. Initially, the hybrid project will test video only. If enough audio(with video) subjective data is available, models for audio and audio/video will be also validated.
The performance of objective models will be based on the comparison of the MOS obtained from controlled subjective tests and the MOS predicted by the submitted models. This testplan defines the test method, selection of source test material (termed SRCs) and processed test conditions (termed HRCs), and evaluation metrics to examine the predictive performance of competing objective hybrid/bit-stream quality models.
A final report will be produced after the analysis of test results.
Page 6 of 87

2. List of Definitions
Intended frame rate is defined as the number of video frames per second physically stored for some representation of a video sequence. The intended frame rate may be constant or may change with time. Two examples of constant intended frame rates are a BetacamSP tape containing 25 fps and a VQEG FR-TV Phase I compliant 625-line YUV file containing 25 fps; these both have an absolute frame rate of 25 fps. One example of a variable absolute frame rate is a computer file containing only new frames; in this case the intended frame rate exactly matches the effective frame rate. The content of video frames is not considered when determining intended frame rate.
Anomalous frame repetition is defined as an event where the HRC outputs a single frame repeatedly in response to an unusual or out of the ordinary event. Anomalous frame repetition includes but is not limited to the following types of events: an error in the transmission channel, a change in the delay through the transmission channel, limited computer resources impacting the decoder’s performance, and limited computer resources impacting the display of the video signal.
Constant frame skipping is defined as an event where the HRC outputs frames with updated content at an effective frame rate that is fixed and less than the source frame rate.
Effective frame rate is defined as the number of unique frames (i.e., total frames – repeated frames) per second.
Frame rate is the number of (progressive) frames displayed per second (fps).
Live Network Conditions are defined as errors imposed upon the digital video bit stream as a result of live network conditions. Examples of error sources include packet loss due to heavy network traffic, increased delay due to transmission route changes, multi-path on a broadcast signal, and fingerprints on a DVD. Live network conditions tend to be unpredictable and unrepeatable.
Pausing with skipping (formerly frame skipping) is defined as events where the video pauses for some period of time and then restarts with some loss of video information. In pausing with skipping, the temporal delay through the system will vary about an average system delay, sometimes increasing and sometimes decreasing. One example of pausing with skipping is a pair of IP Videophones, where heavy network traffic causes the IP Videophone display to freeze briefly; when the IP Videophone display continues, some content has been lost. Another example is a videoconferencing system that performs constant frame skipping or variable frame skipping. Constant frame skipping and variable frame skipping are subsets of pausing with skipping. A processed video sequence containing pausing with skipping will be approximately the same duration as the associated original video sequence.
Pausing without skipping (formerly frame freeze) is defined as any event where the video pauses for some period of time and then restarts without losing any video information. Hence, the temporal delay through the system must increase. One example of pausing without skipping is a computer simultaneously downloading and playing an AVI file, where heavy network traffic causes the player to pause briefly and then continue playing. A processed video sequence containing pausing without skipping events will always be longer in duration than the associated original video sequence.
Refresh rate is defined as the rate at which the computer monitor is updated.
Simulated transmission errors are defined as errors imposed upon the digital video bit stream in a highly controlled environment. Examples include simulated packet loss rates and simulated bit errors. Parameters used to control simulated transmission errors are well defined.
Source frame rate (SFR) is the intended frame rate of the original source video sequences. The source frame rate is constant. For the MM testplan the SFR may be either 25 fps or 30 fps.
Page 7 of 87

Transmission errors are defined as any error imposed on the video transmission. Example types of errors include simulated transmission errors and live network conditions.
Variable frame skipping is defined as an event where the HRC outputs frames with updated content at an effective frame rate that changes with time. The temporal delay through the system will increase and decrease with time, varying about an average system delay. A processed video sequence containing variable frame skipping will be approximately the same duration as the associated original video sequence.
Page 8 of 87

3. List of Acronyms
ACR-HRR Absolute Category Rating with Hidden Reference Removal
ANOVA ANalysis Of VAriance
ASCII ANSI Standard Code for Information Interchange
CCIR Comite Consultatif International des Radiocommunications
CIF Common Intermediate Format (352 x 288 pixels)
CODEC COder-DECoder
CRC Communications Research Centre (Canada)
DVB-C Digital Video Broadcasting-Cable
DMOS Difference Mean Opinion Score
FR Full Reference
GOP Group Of Pictures
HRC Hypothetical Reference Circuit
HSDPA High-Speed Downlink Packet Access
ILG Independent Laboratory Group
ITU International Telecommunication Union
LSB Least Significant Bit
MM MultiMedia
MOS Mean Opinion Score
MOSp Mean Opinion Score, predicted
MPEG Moving Picture Experts Group
NR No (or Zero) Reference
NTSC National Television Standard Code (60 Hz TV)
PAL Phase Alternating Line standard (50 Hz TV)
PLR Packet Loss Ratio
PS Program Segment
PVS Processed Video Sequence
QAM Quadrature Amplitude Modulation
QCIF Quarter Common Intermediate Format (176 x 144 pixels)
QPSK Quadrature Phase Shift Keying
VQR Video Quality Rating (as predicted by an objective model)
RR Reduced Reference
SMPTE Society of Motion Picture and Television Engineers
SRC Source Reference Channel or Circuit
VGA Video Graphics Array (640 x 480 pixels)
VQEG Video Quality Experts Group
VTR Video Tape Recorder
Page 9 of 87

WCDMA Wideband Code Division Multiple Access
Page 10 of 87

4. Subjective Evaluation Procedure
4.1. The ACR Method with Hidden Reference
This section describes the test method according to which the VQEG Hybrid Perceptual Bitstream Project’s subjective tests will be performed. We will use the absolute category scale (ACR) [Rec. P.910rev] for collecting subjective judgments of video samples. ACR is a single-stimulus method in which a processed video segment is presented alone, without being paired with its unprocessed (“reference”) version. The present test procedure includes a reference version of each video segment, not as part of a pair, but as a freestanding stimulus for rating like any other. During the data analysis the ACR scores will be subtracted from the corresponding reference scores to obtain DMOSs. This procedure is known as “hidden reference removal.”
4.1.1. General Description
The VQEG HDTV subjective tests will be performed using the Absolute Category Rating Hidden Reference (ACR-HR) method.
The selected test methodology is the Absolute Rating method – Hidden Reference (ACR-HR) and is derived from the standard Absolute Category Rating – Hidden Reference (ACR-HR) method [ITU-T Recommendation P.910, 1999.] The 5-point ACR scale will be used.
Hidden Reference has been added to the method more recently to address a disadvantage of ACR for use in studies in which objective models must predict the subjective data: If the original video material (SRC) is of poor quality, or if the content is simply unappealing to viewers, such a PVS could be rated low by humans and yet not appear to be degraded to an objective video quality model, especially a full-reference model. In the HR addition to ACR, the original version of each SRC is presented for rating somewhere in the test, without identifying it as the original. Viewers rate the original as they rate any other PVS. The rating score for any PVS is computed as the difference in rating between the processed version and the original of the given SRC. Effects due to esthetic quality of the scene or to original filming quality are “differenced” out of the final PVS subjective ratings.
In the ACR-HR test method, each test condition is presented once for subjective assessment. The test presentation order is randomized according to standard procedures (e.g., Latin or Graeco-Latin square or via computer). Subjective ratings are reported on the five-point scale:
5 Excellent
4 Good
3 Fair
2 Poor
1 Bad.
Figure borrowed from the ITU-T P.910 (1999):
T1207460-95
10 s10 s~10 s ~10 s ~10 s
Ai Sequence A under test condition iBj Sequence B under test condition jCk Sequence C under test condition k
Grey GreyPict.Ai Pict.Bj Pict.Ck
voting voting voting
Page 11 of 87

Figure 1 – ACR basic test cell, as specified by ITU-T P.910.
Viewers will see each scene once and will not have the option of re-playing a scene.
An example of instructions is given in Annex III.
The selected test methodology is the single stimulus Absolute Category Rating method with hidden reference (henceforth referred to as ACR-HR). This choice has been selected due to the fact that ACR provides a reliable and standardized method (ITU-R Rec. 500-11, ITU-T P.910rev) that allows a large number of test conditions to be assessed in any single test session.
• In the ACR test method, each test condition is presented singly for subjective assessment. The test presentation order is randomized according to standard procedures (e.g. Latin or Graeco-Latin square, or via random number generator). The test format is shown in Figure 1. At the end of each test presentation, human judges ("evaluators" or “viewers”) provide a quality rating using the 11-grade ACR rating scale below. Subjective scores should be inputted as integer numbers (0-10). The input methods for subjective scores include, but are not limited to, the following:
– By checking one of 11 bins (computer or paper)– By entering an integer number (0-10) (computer or paper)– By moving a sliding bar which takes one of 11 discrete positions. (computer)
Figure 1 – ACR basic test cell, as specified by ITU-T P.910.
The SRC/PVS length and rebuffering condition are as follows:
SD/HD
Page 12 of 87

SRC/PVS length: 15 seconds
Rebuffering is not allowed.
QVGA
SRC/PVS length: 10 seconds with rebuffering disallowed
SRC/PVS length: SRC is 16 seconds with rebuffering allowed. PVS can be up to 24s. The maximum time limit for freezing or rebuffering is 8 seconds.
It is not allowed to mix 10s and 16-24s SRC/PVS in the same session. [??TBD] Further study on 16-24s SRC/PVS (e.g., single evaluation values for 24 sec, user response to various length of PVSs). May propose a special test for rebuffering, including coding and transmission error impairments.
Note: Rebuffering is freezing longer than 0.5s without skipping
Instructions to the evaluators provide a more detailed description of the ACR procedure. The instruction script appears in Annex I.
4.1.2. Application across Different Video Formats and Displays
The proposed Hybrid Perceptual/Bitstream Validation (HBS) test will examine the performance of objective perceptual quality models for different video formats (HD, SD, and QVGA). Section 4.1.3 defines format and display types in detail. Video applications targeted in this test include the suite of IPTV services, internet video, mobile video, video telephony, and streaming video.
The test instructions request evaluators to maintain a specified viewing distance from the display device. The viewing distance is as follows:
QVGA: 4-6H and let the viewer choose within physical limits
SD: 6H (to be consistent with the table on page 4 of ITU-R Rec. BT.500-11)
HD: 3H
H=Picture Heights (picture is defined as the size of the video window)
Preferably, each test viewer will have his/her own video display. For QVGA, it is required that each test viewer will have his/her own video display. The test room will conform to ITU-R Rec. BT.500-11 requirements.
It is recommended that viewers be seated facing the center of the video display at the specified viewing distance. That means that viewer's eyes are positioned opposite to the video display's center (i.e. if possible, centered both vertically and horizontally). If two or three viewers are run simultaneously using a single display, then the viewer’s eyes, if possible, are centered vertically, and viewers should be centered evenly in front of the monitor.
4.1.3. Display Specification and Set-up
The subjective tests will cover two display categories: television (SD/HD) and multimedia (QVGA). For multimedia, LCD displays will be used. For SD/HD television, LCD/ CRT(professional) displays will be used. The display requirements for each category are now provided.
Page 13 of 87

4.1.4. QVGA RequirementsFor QVGA resolution content, this Test Plan requires that subjective tests use LCD displays that meet the following specifications:
Monitor Feature SpecificationDiagonal Size 17-24 inchesDot pitch < 0.30Resolution Native resolution (no scaling allowed)Gray to Gray Response Time (if specified by manufacturer, otherwise assume response time reported is white-black)
< 30 ms (<10 ms if based on white-black)
Color Temperature 6500KCalibration YesCalibration Method Eye One / Video Essentials DVDBit Depth 8 bits/colourRefresh Rate >= 60 HzStandalone/laptop StandaloneLabel TCO ‘06 or later
The LCD shall be set-up using the following procedure:
Use the autosetting to set the default values for luminance, contrast and colour shade of white.
Adjust the brightness according to Rec. ITU-T P.910, but do not adjust the contrast (it might change bal-ance of the colour temperature).
Set the gamma to 2.2.
Set the colour temperature to 6500 K (default value on most LCDs).
The scan rate of the PC monitor must be at least 60 Hz.
The LCD display shall be a high-quality monitor. Annex V contains a list of preferred LCD monitors for use in the subjective tests.
Video sequences will be displayed using a black border frame (0) on a grey background (128). The black border frame will be of the following size:
18 lines/pixels QVGA
The black border frame will be on all four sides.
4.1.5. SD Requirements
Viewing conditions should comply with those described in International Telecommunications Union Recommendation ITU-R BT.500-11. An example schematic of a viewing room is shown in Figure 1. Specific viewing conditions for subjective assessments in a laboratory environment are:
Ratio of luminance of inactive screen to peak luminance: 0.02
Ratio of the luminance of the screen, when displaying only black level in a completely dark room, to that corresponding to peak white: 0.01
Display brightness and contrast: set up via PLUGE (see Recommendations ITU-R BT.814 and ITU-R BT.815)
Maximum observation angle relative to the normal: 300
Page 14 of 87

Ratio of luminance of background behind picture monitor to peak luminance of picture: 0.15
Chromaticity of background: D65
Other room illumination: low
The monitor to be used in the subjective assessments is a 19 in. (minimum) professional-grade moni-tor, for example a Sony BVM-20F1U or equivalent.
The viewing distance of 6H selected by VQEG falls in the range of 4 to 6 H, i.e. four to six times the height of the picture tube, compliant with Recommendation ITU-R BT.500-10.
Soundtrack will not be included.
If a HD LCD monitor is used for SDTV testing, the picture area should be centered and the non-pic-ture area should be black or mid-level gray (e.g, 128).
Figure 1. Example of viewing room.
4.1.6. HD Monitor Requirements
All subjective experiments will use LCD monitors and professional CRT monitors. Only high-end consumer TV (Full HD) or professional grade monitors should be used. LCD PC monitors may be used, provided that the monitor meets the other specifications (below) and is color calibrated for video.
Given that the subjective tests will use different HD display technologies, it is necessary to ensure that each test laboratory selects an appropriate display and common set-up techniques are employed. Due to the fact that most consumer grade displays employ some kind of display processing that will be difficult to account for in the models, all subjective facilities doing testing for HDTV shall use a full resolution display.
Page 15 of 87

All labs that will run viewers must post to the HDTV reflector information about the model to be used. If a proponent or ILG has serious technical objections to the monitor, the proponent or ILG should post the objection with detailed explanation within two weeks. The decision to use the monitor will be decided by a majority vote among proponents and ILGs.
Input requirements
HDMI (player) to HDMI (display); or DVI (player) to DVI (display)
SDI (player) to SDI (display)
Conversion (HDMI to SDI or vice versa) should be transparent
If possible, a professional HDTV LCD monitor should be used. The monitor should have as little post-processing as possible. Preferably, the monitor should make available a description of the post-processing performed.
If the native display of the monitor is progressive and thus performs de-interlacing, then if 1080i SRC are used, the monitor will do the de-interlacing. Any artifacts resulting from the monitor’s de-interlacing are expected to have a negligible impact on the subjective quality ratings, especially in the presence of other degradations.
The smallest monitor that can be used is a 24” LCD.
A valid HDTV monitor should support the full-HD resolution (1920 by 1080). In other words, when the HDTV monitor is used as a PC monitor, its native resolution should be 1920 by 1080. On the other hands, most TV monitors support overscan. Consequently, the HDTV monitor may crop boundaries (e.g, 3-5% from top, bottom, two sides) and display enlarged pictures (Figure). Thus, it is possible that the HDTV monitor may not display whole pictures, which is allowed.
The valid HDTV monitor should be LCD types. The HDTV monitor should be a high-end product, which provides adequate motion blur reduction techniques and post-processing which includes deinterlacing.
Labs must post to the reflector what monitor they plan to use; VQEG members have 2 weeks to object.
Page 16 of 87

Figure. An Example of Overscan
4.1.7. Test Method
All subjective tests for QVGA will be run using the same software package. The software package will include the following components:
Entry system for evaluator details (e.g. name, age, gender)
Test screens (prompts to users, grey panel, ACR scale, response input, data capture, data storage)
Timing control
Correct video play-out check
Video player
Annex V describes the test method to be used in the VQEG Multimedia testing. Annex V also provides minimum computer specifications (including required OS) required when using this subjective test software package.
For the HD/SD testing, the video will use the full screen dimensions and no background panel or black border will be present. If a HD LCD monitor is used for SDTV testing, the picture area should be centered and the non-picture area should be black or mid-level gray.
Page 17 of 87

4.1.8. Length of Sessions
For 10s PVSs (QVGA without rebuffering), the number of PVSs per session is 160. For 15s PVSs (SD/HD), the number of PVSs per session is 120. For 16-24s (ave 20s) PVSs (QVGA with rebuffering), the number of PVSs per session is 90. The number of PVSs of the common set is 24.For 10s PVS, the total number of PVSs is about 168. For 15s PVS (SD/HD), the total number of PVSs is about 130.
4.1.9. Evalulators (Viewers)
Different subjective experiments will be conducted by several test laboratories. Exactly 24 valid viewers per experiment will be used for data analysis. A valid viewer means a viewer whose ratings are accepted after post-experiment results screening. Post-experiment results screening is necessary to discard viewers who are suspected to have voted randomly. The rejection criteria verify the level of consistency of the scores of one viewer according to the mean score of all observers over the entire experiment. The method for post-experiment results screening is described in Annex VI. Only scores from valid viewers will be reported in the results spreadsheets as described in Section 4.21. In Section 4.1.10 a procedure is described to obtain ratings for 24 valid observers.
It is preferred that each viewer be given a different randomized order of video sequences where possible. Otherwise, the viewers will be assigned to sub-groups, which will see the test sessions in different randomized orders. A maximum of 6 viewers may be presented with the same ordering of test sequences per subjective test. For QVGA, different ordering is required for each viewer. For more information on the randomization process, see 4.1.13.
Each viewer can only participate in 1 experiment (i.e. one experiment at one image resolution).
Only non-expert viewers will participate. The term non-expert is used in the sense that the viewers’ work does not involve video picture quality and they are not experienced assessors. They must not have participated in a subjective quality test over a period of six months.
Prior to a session, the observers should usually be screened for normal visual acuity or corrected-to-normal acuity and for normal color vision. Acuity will be checked according to the method specified in ITU-T P.910 or ITU-R Rec. 500, which is as follows. Concerning acuity, no errors on the 20/30 line of a standard eye chart2 should be made. The chart should be scaled for the test viewing distance and the acuity test performed at the same location where the video images will be viewed (i.e. lean the eye chart up against the monitor) and have the evaluators seated. Ishihara or Pseudo Isochromatic plates may be used for colour screening. When using either colour test please refer to usage guidelines when determining whether evaluators have passed (e.g. standard definition of normal colour vision in the Ishihara test is considered to be 17 plates correct out of a 38 plate test; ITU-T Rec. P.910 states that no more than 2 plates may be failed in a 12 plate test. Evaluators should also have sufficient familiarity with the language to comprehend instructions and to provide valid responses using the semantic judgment terms expressed in that language.
4.1.10. Instructions for Evaluators and Selection of Valid Evaluators
For many labs, obtaining a reasonably representative sample of evaluators is difficult. Therefore, obtaining and retaining a valid data set from each evaluator is important. The following procedures are highly recommended to ensure valid subjective data:
Write out a set of instructions that the experimenter will read to each test viewer. The instructions should clearly explain why the test is being run, what the evaluator will see, and what the evaluator should do. Pre-test the instructions with non-experts to make sure they are clear; revise as necessary.
1 Test laboratories can keep data from invalid viewers if they consider this to be of valuable information to them but they must not include them in the VQEG data.
2 Grahm-Field Catalogue Number 13-1240.
Page 18 of 87

Explain that it is important for evaluators to pay attention to the video on each trial.
There are no “correct” ratings. The instructions should not suggest that there is a correct rating or provide any feedback as to the “correctness” of any response. The instructions should emphasize that the test is being conducted to learn viewers’ judgments of the quality of the samples, and that it is the viewer’s opinion that determines the appropriate rating.
If it is suspected that an evaluator is not responding to the video stimuli or is responding in a manner contrary to the instructions, their data may be discarded and a replacement evaluator can be tested. The experimenter will report the number of evaluators’ datasets discarded and the criteria for doing so. Example criteria for discarding subjective data sets are:
The same rating is used for all or most of the PVSs.
The evaluator’s ratings correlate poorly with the average ratings from the other evaluators (see Annex II).
Different subjective experiments will be conducted by several test laboratories. Exactly 24 valid viewers per experiment will be used for data analysis. A valid viewer means a viewer whose ratings are accepted after post-experiment results screening. Post-experiment results screening is necessary to discard viewers who are suspected to have voted randomly. The rejection criteria verify the level of consistency of the scores of one viewer according to the mean score of all observers over the entire experiment. The method for post-experiment results screening is described in Annex VI. Only scores from valid viewers will be reported.
The following procedure is suggested to obtain ratings for 24 valid observers:
1. Conduct the experiment with 24 viewers
2. Apply post-experiment screening to eventually discard viewers who are suspected to have voted randomly (see Annex VI).
3. If n viewers are rejected, run n additional evaluators.
4. Go back to step 2 and step 3 until valid results for 24 viewers are obtained.
4.1.11. Viewing Conditions
For the QVGA testing, each test session will involve only one evaluator per display assessing the test material. Evaluators will be seated directly in line with the center of the video display at a specified viewing distance (see Section 4.1.2). The test cabinet will conform to ITU-T Rec. P.910 requirements.
4.1.12. Experiment design
Each subjective experiment will include the same number of PVSs3 for the same type of experiment. The PVSs include both the common set of PVSs inserted in each experiment and the hidden reference (hidden SRCs) sequences, i.e. each hidden SRC is one PVS. The common set of PVSs will include the secret PVSs and secret source. The number of PVSs of the common set is 3024.
In this scenario, an experiment will include the following steps:
1. Introduction and instructions to viewer2. Practice clips: these test clips allow the viewer to familiarize with the assessment procedure and
software. They must represent the range of distortions in the experiment but with different contents
3 This will allow conducting an ACR experiment within about 1 hour, including practice clips and a comfortable break during the experiment.
Page 19 of 87

than those used in the experiment. A number of 6 practice clips is suggested. Ratings given to practice clips are not used for data analysis.
3. Assessment of PVSs4. Short break5. Practice clips (this step is optional but advised to regain viewer’s concentration after the break)6. Assessment of PVSs
ILGs will determine the test conditions [??TBD]Editor’s note: We need to decide whether or not to apply a full matrix approach for each experiment.
The SRCS used in each experiment must cover a variety of content categories as defined in Section 6.2. At least 6 categories of content must be included in each experiment.
A similar number of PVSs from each type of error will be tested per image resolution. The image resolutions are defined in Section 4.1.2. The different types of error conditions are defined in Section 6.1.3. However different types of error conditions can be mixed between experiments to ensure a balance in the design of each individual experiment.
4.1.13. Randomization
For each subjective test, a randomization process will be used to generate orders of presentation (playlists) of video sequences. Playlists can be pre-generated offline (e.g. using separate piece of code or software) or generated by the subjective test software itself. As stated in section 4.1.4, it is preferred that each evaluator be given a different randomized order of video sequences where possible. Otherwise, the viewers will be assigned to sub-groups, which will see the test sessions in different randomized orders. A maximum of 6 evaluators may be presented with the same ordering of test sequences per subjective test.
In generating random presentation order playlists the same scene content may not be presented in two successive trials.
Randomization refers to a random permutation of the set of PVSs used in that test. Shifting is not permitted, e.g.Subject1 = [PVS4 PVS2 PVS1 PVS3]Subject2 = [PVS2 PVS1 PVS3 PVS4]Subject3 = [PVS1 PVS3 PVS4 PVS2] …
If a random number generator is used (as stated in section 4.1.1), it is necessary to use a different starting seed for different tests.
Example script in Matlab that generates playlists (i.e. randomized orders of presentation) is given below:
rand('state',sum(100*clock)); % generates a random starting seedNpvs=200; % number of PVSs in the testNsubj=24; % number of evaluators in the testplaylists=zeros(Npvs,Nsubj);for i=1:Nsubj
playlists(:,i)=randperm(Npvs);end
Page 20 of 87

4.1.14. Test Data Collection
The responsibility for the collection and organization of the data files containing the votes will be shared by the ILG Co-Chairs and the proponents. The collection of data will be supervised by the ILG and distributed to test participants for verification.
4.2. Data Format
4.2.1. Results Data Format
The following format is designed to facilitate data analysis of the subjective data results file.
The subjective data will be stored in a Microsoft Excel 97-2003 spreadsheet containing the following columns in the following order: lab name, test identifier, test type, evaluator #, month, day, year, session, resolution, rate, age, gender, order, scene, HRC, ACR Score. Missing data values will be indicated by the value -9999 to facilitate global search and replacement of missing values. Each Excel spreadsheet cell will contain either a number or a name. All names (e.g., test, lab, scene, hrc) must be ASCII strings containing no white space (e.g., space, tab). Where exact text strings are to be used, the text strings will be identified below in single quotes (e.g., ‘original’). In the Excel sheet, only data from valid viewers (i.e., viewers who pass the visual acuity and color tests) will be forwarded to the ILG and other proponents.
Below are definitions for the Excel spreadsheet columns:
Lab: Name of laboratory’s organization (e.g., CRC, Intel, NTIA, NTT, etc.). This abbreviation must be a single word with no white space (e.g., space, tab).
Test: Name of the test. Each test must have a unique name.Type: Name of the test category. [Note: exact text strings will be specified after individual test
categories have been finalized.] Distance: Viewing distance (e.g. 6to10H, 6to8H, 4to6H, 3to6H).Evaluator #: Integer indicating the evaluator number. Each laboratory will start numbering viewers at a
different point, to ensure that all viewers receive unique numbering. Starting points will be separated by 1000 (e.g., lab1 starts numbering at 1000, lab2 starts numbering at 2000, etc). Evaluators’ names will not be collected or recorded.
Month: Integer indicating month [1..12]Day: Integer indicating day [1..31]Year: Integer indicating year [2004..2006]Session: Integer indicating viewing sessionEditor’s note: do we need a new column to indicate number of viewers in a test session [1..3]?Resolution: One of the following three strings: ‘hd’, ‘sd’, or ‘qvga’.Rate: A number indicating the frames per second (fps) of the original video sequence.Age: Integer number that indicates the viewer’s age.Gender: ‘f’ for female, ‘m’ for maleOrder: An integer indicating the order in which the evaluator viewed the video sequences [or trial
number, if scenes are ordered randomly].Scene: Name of the scene. All scenes from all tests must have unique names. If a single scene is
used in multiple tests (i.e., digitally identical files), then the same scene name must be used. Names shall be eight characters or fewer.
HRC: Name of the HRC. For reference video sequences, the exact text ‘reference’ must be used. All processed HRCs from all tests must have unique names. If a single HRC is used in multiple tests, then the same HRC name must be used.
ACR Score: Integer indicating the viewer’s ACR score (1, 2, 3, 4, or 5).
See Annex II for an example.
Page 21 of 87

4.2.2. Subjective Data Analysis
Difference scores will be calculated for each processed video sequence (PVS). A PVS is defined as a SRCxHRC combination. The difference scores, known as Difference Mean Opinion Scores (DMOS) will be produced for each PVS by subtracting the score from that of the hidden reference score for the SRC used to produce the PVS. Subtraction will be done per viewer. Difference scores will be used to assess the performance of each full reference and reduced reference proponent model, applying the metrics defined in Section 39.
For evaluation of no-reference proponent models, the absolute (raw) subjective score will be used. Thus, for each test sequence, only the absolute rating for the SRC and PVS will be calculated. Based on each viewer’s absolute rating for the test presentations, an absolute mean opinion score will be produced for each test condition. These MOS will then be used to evaluate the performance of NR proponent models using the metrics specified in Section 39.
Page 22 of 87

5. Test Laboratories and ScheduleGiven the scope of the HBS testing, both independent test laboratories and proponent laboratories will be given subjective test responsibilities. Before conducting subjective tests, all laboratories will inform VQEG (via the HBS Reflector [[email protected]]) of the test environment and equipment they plan to use.
5.1. Independent Laboratory Group (ILG)
The independent laboratory group is composed of IRCCyN (France), CRC (Canada), INTEL (USA), Acreo (Sweden), FUB (Italy), NTIA (USA) and AGH Nortel (CanadaPoland).
5.2. Proponent Laboratories
A number of proponents also have significant expertise in and facilities for subjective quality testing. Proponents can conduct subjective tests under the ILG guidance. Proponents indicating a willingness to participate as test laboratories are as follows (tentative list):
[??Editor’s Note] The resolution is tentative.
BT 1 (QVGA, SD625, HD50i, HD25p)
Ericsson1 (QVGA)
DT 1 (HD25p)
Ghent Univ. 1 (QVGA, HD30p, HD25p)
KDDI 2 1 (QVGA, SD525, HD60i, HD30p)
Lancaster Univ. 1 ?? (QVGA) not present at Boulder meeting
VQLINK 0 not present at Boulder meeting
NTT 2 1 (SD525, HD60i)
OPTICOM Opticom 1 (QVGA)
Psytechnics ?1
Symmetricom 1 (SD525, HD60i, HD30p)
Swissqual 1 ?1
Tektronix not present at Boulder meeting
Yonsei 3 1 (QVGA, SD525, HD60i, HD30p)
Total: 15 (QVGA, SD, HD50, HD60)
CRC 01
INTEL 1 0 (QVGA, HD60i, HD30p)
Acreo 0 or possibly 1 (QVGA, SD625)
IRCCyN 1 ?
Nortel 0
Page 23 of 87

FUB 1 (QVGA, SD625, HD50i, HD25p) not present at Boulder meeting
NTIA 0
Verizon 1 ?? (QVGA, SD525, HD60i, HD30p) not present at Boulder meeting
NOTE: ATIS option may be considered.
Total: 4 or 53
It is clearly important to ensure all test data is derived in accordance with this testplan. Critically, proponent testing must be free from charges of advantage to one of their models or disadvantage to competing models.
The maximum number of subjective experiments run by any one proponent laboratory is 3 times the lowest non-zero number run by any other proponent laboratory, per image size.
The maximum number of non-secret PVSs included in overall test by any single proponent laboratory is 20%.
For each proponent subjective test, no more than 50% of test sequences may be derived from a single proponent. This does not apply to PVSs created by the ILG or to common sequences.
See Annex IV for details on fees and conditions for proponents participating in the VQEG HBS tests.
5.3. Test Schedule
1. Finalization of the candidate working systems which include reference encoder, container, server, packet capturer, extractor and reference decoder (June 2010).
2. Finalization of the working systems (Oct 2010)
3. Source video sequences are collected & sent to point of contact. (as soon as possible). Strong needs for European HD materials.
4. NDA for SRC video distribution (July 2010)
5. AApproval of the test plan (next VQEG meeting, Jan 2011 after step 1. Steps 1 and 2 may happen at the same VQEG meeting).
6. Finalization of the working systems which include reference en-coder, container, server, packet capturer, extractor and reference de-coder at the next VQEG meeting.
7. Declaration of intent to participate and the number of models to submit (Approval of testplan + 1 month)
8. Fee payment if applicable (Approval of testplan + 2 month)
Page 24 of 87

9. Source video sequences are collected & sent to point of contact. (as soon as possible)
10. NDA for SRC video distribution (March 2010)
11. All SRC video will be sent to the requesting organization, ex-cept for the secret SRC after NDA is signed. The requesting orga-nization will have to pay for the cost. The point of contact should send the source pool within two weeks after it receives the request. Alternatively, the SRC video can be distributed at the next VQEG meeting.
12. Secret content should be sent to the ILG directly. Proponents are not allowed to provide secret content.
13. Test period (5 months after Step 1). Three or four test session data will be distributed to the proponents and ILS within three months of Step 1. Any proponents or ILG may contribute test data. Proponents can report any problems during the next two months to address any potential issues.
14. VQEG compiles a list of HRCs that are of interest the HYBRID test. Proponents will send details of proposed HRCs and indicate which ones they can create to the points of contacts and example PVSs. (Step 1 + 2 month)
15. Each organization that will perform subjective testing creates a proposed list of HRCs, that they plan to use in a subjective test. This list will include exactly the number of HRCs needed. (Step 1 + 4 month)
16. The proposed lists of HRCs for each experiment are examined by VQEG for problems (e.g., one organization creating too many HRCs, overlap between experiments, using NTT guidelines). (Step 1 + 5 month)
17. Proponents submit their models (executable and, only if de-sired, encrypted source code). Procedures for making changes after
Page 25 of 87

submission will be outlined in a separate document. To be approved prior to submission of models. (Approval of testplan Step 1 + 8 6 month).
18. Training data exchange: (Approval of testplan + 3 month).
19. Test design by ILGs and proponents: (Model submission + 2 month).
20. Test design review by ILGs and proponents: (Model submission + 3 month).
21.
22. [??STEPS BELOW: ??TBD] The following schedule is tenta-tive.
23. ILG select SRC sequences for each experiment & sends them only to the organization running that experiment. ILG will send ex-actly the number of SRCs required. (Model submission + 1 4 month)??
24. ILG creates a set of secret SRCs and secret HRCscommon sets and send them to ILG/Proponents. The ILG inserts these into every proponents’ experiments. (Model submission + 1 4 month)
25. The relevant organizations running the experiment will generate the PVSs, using the scenes that were sent to them and send all the PVSs to a common point of contact who will distribute them to ILGs and proponents. (Model submission +3 5 month)
26. Proponents check calibration of all PVSs and identify potential problems. They may ask the ILG to review the selection of test mate-rial and replace if necessary. (Model submission + 6 month)
27. Proponents check the calibration and registration of the PVSs in their experiment. (Model submission + 4 month)
Page 26 of 87

28. If a proponent or ILG testlab believes that their any experiment is unbalanced in terms of qualities or have calibration problems, they may ask the ILG and the proponent group to review the selection of test material. If 2/3rda majority of ILG agrees, then selection of PVSs will be amended by the ILG. An even distribution of qualities from excellent to bad is desirable. (Model submission + 5 6 month)
29. ILGs and pAll SRCs and PVSs are distributed to all the propo-nents (Model submission + 6 month)
30. Proponents check calibration of all PVSs and identify potential problems. They may ask the ILG to review the selection of test mate-rial and replace if necessary. (Model submission + 7 month)
31. Proponents run their subject test & submits results to the ILG. (Model submission + 8 month).
32. P roponents submit their objective data. (Model submission + 8 month)
33. Verification of submitted models by ILG (Model submission + 9 month)
34. ILG distribute subjective and objective data to the proponents and other ILG (Model submission + 9 month)
35. Statistical analysis (Model submission + 9 10 month)
36. Draft final report (Model submission + 10 12 month)
37. Approval of final report (Model submission + 12 month Advice to Proponents on Pre-Model Submission Checking
Prior to the official model submission date, the ILG will verify that the submitted models (1) run on the ILG’s computers and (2) yield the correct output values when run on the test video sequences. Due to their limited resources, the ILG may encounter difficulties verifying executables submitted too close to the model submission deadline. Therefore, proponents are strongly encouraged to submit a prototype model to the ILG well before the verification deadline, to work out platform compatibility problems well ahead of the final verification date. Proponents are also strongly encouraged to submit their final model executable 14 days prior to the verification deadline date, giving the ILG two weeks to resolve problems arising from the verification procedure.
The ILG requests that proponents kindly estimate the run-speed of their executables on a test video sequence and to provide this information to the ILG.
Page 27 of 87

6. Sequence Processing and Data FormatsSeparate subjective tests will be performed for different video sizes:
QVGA (320 x 240)
SD (525/60 or 625/50 line formats)
HD (1080i50, 1080i60, 1080p30, and 1080p25)
In the case of Rec. 601 video source, aspect ratio correction will be performed on the video sequences prior to writing the AVI files (SRC) or processing the PVS.
Note that in all subjective tests 1 pixel of video will be displayed as 1 pixel native display. No upsampling or downsampling of the video is allowed at the player.
Presently, VQEG has access to a set of video test sequences. For audio-video tests this database needs to be extended to include new source material containing both audio and video.
37.1. Sequence Processing Overview
The test material will be selected from a common pool of video sequences.
The source video can only be used in the testing if an expert in the field considers the quality to be good or excellent on an ACR-scale. The source video should have no visible coding artifacts. The final decision whether a source video sequence is admissible will be made by ILGs.
For QVGA, all source material should be 25 or 30 frames per second progressive and there should be no more than one version of each source sequence for each resolution. If the test sequences are in an interlaced format, then agreed de-interlacing methods will be applied to transform the test sequence to a progressive format for QVGA. The de-interlacing algorithm will de-interlace Rec. 601 (or other, e.g., HDTVHYBRID) formatted video into a progressive format, i.e., QVGA. Algorithms will be proposed on the VQEG reflector and approved before processing takes place.
The source video should have no visible coding artifacts. 1080i footage may be de-interlaced and then used as SRC in a 1080p experiment. 1080p enlarged from 720p or 1080i enlarged from 1366x768 or similar are valid HDTVHYBRID source. 1080p 24fps film footage can be converted and used in any 1080i or 1080p experiment. The frame rate of the unconverted source must be at least as high as the target SRC (e.g., 720p 50fps can be converted and used in a 1080i 50fps experiment, but 720p 29.97fps cannot be converted and used in a 1080i 59.94fps experiment).
Uncompressed AVI files will be used for subjective and objective tests. Tools are being sought to convert from the various coding schemes to uncompressed AVI (see Annex VIII for a description of the tools used for conversion). The progressive test sequences used in the subjective tests should also be used by the models to produce objective scores.
It is important to minimize the processing of video source sequences. Hence, we will endeavor to find methods that minimize this processing (e.g., to perform de-interlacing and resizing in one step).
Page 28 of 87

37.1.1. Duration of Source Sequences
Source content may be obtained from content stored on tape or on hard drive, provided it meets the quality requirements outlined in Section 6.1.2.
The SRC/PVS length and rebuffering condition are as follows:
SD/HD
SRC/PVS length: 15 seconds
Rebuffering is not allowed.
The original source should be at least 19 seconds, allowing extra 2 seconds at the beginning and the end.
QVGA
SRC/PVS length: 10 seconds with rebuffering disallowed
The original source should be at least 14 seconds, allowing extra 2 seconds at the beginning and the end.
SRC/PVS length: SRC is 15 seconds with rebuffering allowed. PVS can be up to 24s. The maximum time limit for freezing or rebuffering is 8 seconds.
The original source should be at least 19 seconds, allowing extra 2 seconds at the beginning and the end.
37.1.2. Camera and Source Test Material Requirements
The standard definition source test material should be in Rec. 601, DigiBeta, Betacam SP, or DV25 (3-chip camera) format or better. Note that this requirement does not apply to Categories 4 and 8 (Section 37.2) where the best available quality reference will be used. HD source test material should be taken from a pro -fessional grade HD camera (e.g., Sony HDR-FX1) or better. Original HD video sequences that have been compressed should show no impairments after being re-sampled to QVGA.
The VQEG hybrid project expresses a preference for all test material to be open source. At a minimum, source material must be available within the VQEG hybrid project to both proponents and ILG for testing (e.g., under non-disclosure agreement if necessary).
37.1.3. Software Tools
Transformation of the source test sequences (e.g., from Rec. 601 525-line to CIF) shall be performed using [??TBD]Avisynth 2.5.5, VirtualDub 1.6.11, and ffdshow 20050303. Within VirtualDub, video sequences will be saved to AVI files using Video Compression option (Video->Compressor) "ffdshow Video Codec", configured with the "Uncompressed" decoder and the UYVY color space. For the Colour Depth (Video->Color Depth), the setting “4:2:2 YCbCr (UYVY)” is used as output format. The processing mode (Video->) is set to “Full processing mode”.
37.1.4. Colour Space Conversion
In the absence of known color transformation matrices (e.g., such as what might be used by a video display adapter), the following algorithms will be used to transform between ITU-R Recommendation BT.601
Page 29 of 87

Y'CB'CR' video and R'G'B' video that is in the range [0, 255]. The reference for these color transformation equations is pages 15-16 of ColorFAQ.pdf, which can be downloaded from:
http://www.poynton.com/PDFs/ColorFAQ.pdf
Transforming R'G'B' to Y'CB'CR'
1. Compute the matrix transformation:
2. Round to the nearest integer.
3. Clamp all three components to the range 1 through 254 inclusive (0 and 255 are reserved for synchronization signals in ITU-R Recommendation BT.601).
Transforming Y'CB'CR' to R'G'B'
1. Compute the matrix transformation:
2. Round to the nearest integer.
3. Clamp all three components to the range 0 through 255 inclusive.
37.1.5. De-Interlacing
De-interlacing will be performed when original material is interlaced and requires de-interlacing, using the de-interlacing function “KernelDeint” in Avisynth. If the de-interlacing using KernelDeint results in a source sequence that has serious artifacts, the Blendfield or Autodeint may be used as alternative methods for de-in -terlacing. Proprietary algorithms and/or hardware de-interlacing may be used if the above three methods prove unsatisfactory.
To check for de-interlacing problems (e.g. serious artifacts introduced by the de-interlacing process), the ILG will examine source content played back at normal speed, with the option to inspect possible problems at re -duced speed.
37.1.6. Cropping & Rescaling
Table 2 lists recommend values for region of interests to be used for transforming images. These source regions should be centered vertically and horizontally. These source regions are intended to be applied prior to rescaling and avoid use of over scan video in most cases. These regions are known to correctly produce square pixels in the target video sequence. Other regions may be used, provided that the target video sequence contains the correct aspect ratio.
Page 30 of 87

The source region selection must not include overscan—i.e. black borders from the overscan are not allowed.
TABLE 2. Recommended Source Regions for Video Transformation ??Help from Margaret?
From To Source Region
525-line: 720x486 Rec. 601 QVGA: 320x240 square pixel 640x480
525-line: 720x486 Rec. 601 QCIF: 176x144 square pixel 646x480
625-line: 720x576 Rec. 601 QVGA: 320x240 square pixel 720x540
625-line: 720x576 Rec. 601 QCIF: 176x144 square pixel 644x576
1080i: 1920x1080 QVGA: 320x240 square pixel 1440x1080
1080i: 1920x1080 QCIF: 176x144 square pixel 1320x1080
720p: 1280x720 QVGA: 320x240 square pixel 960x720
720p: 1280x720 QCIF: 176x144 square pixel 880x720
37.1.7. Rescaling
Video sequences will be resized using Avisynth’s ‘LanczosResize’ function.
37.1.8. File Format
All source and processed video sequences will be stored in Uncompressed AVI in UyVy..
Source material with a source frame rate of 29.97 fps will be manually assigned a source frame rate of 30 fps prior to being inserted into the common pool of video sequences.
AVI is essentially a container format that consists of hierarchical chunks – which have their equivalent in C data structures – which are all preceded by a so called fourcc, a “four character code”, which indicates the type of chunk following. Some of the chunks are compulsory and describe the structure of the file, while some are optional and others contain the real video or audio data. The AVI container format which is used for the exchange of files in the VQEG hybrid project is originally defined by Microsoft as part of the RIFF file specification in:“http://msdn.microsoft.com/library/default.asp?url=/library/en-us/wcedshow/html/_dxce_dshow_avi_riff_file_reference.asp”
Other descriptions can be found in:http://www.opennet.ru/docs/formats/avi.txt http://www.the-labs.com/Video/odmlff2-avidef.pdf
These last two can be found on the mmpretest ftp server. All these links describe the AVI format in details as far as the container itself is concerned. Since the multitude of chunks is quite confusing, an example C code that reads and writes AVI files down to this level is also included in the archive on the mmpretest reflector (files avilib.c and avilib.h). Please note that the provided C code falls under the GNU Public License. Please refer to the license statements in the files themselves. The provided C code is very simple to use and should serve all needs of VQEG. Please note that the C code allows opening the data chunk with the UVVY data, but it does not decode this data. In fact, avilib does not know how to interpret these data. All it returns is a pointer to the data and some additional information like image sizes and frame rate. Interpretation of these data is up to the user and described in the following paragraphs.
Page 31 of 87

A description of the UYVY chunk format which is to be used inside the AVI container can be found in http://www.fourcc.org/index.php?http%3A//www.fourcc.org/fccyvrgb.php and below.
UYVY is a YUV 4:2:2 format. The effective bits per pixel are 16. In the AVI main header (after the fourcc “avih”), a positive height parameter implies a top-down image (top line first).Two image pixels form one macro pixel and are stored in one 32bit word with the following byte ordering:
(lowest byte) U0 Y0 V0 Y1 (highest byte)
37.1.9. Source Test Video Sequence Documentation
Preferably, each source video sequence should be documented. The exact process used to create each source video sequence should be documented, listing the following information:
Camera specifications Source region of interest (if the default values were not used) Use restrictions (e.g., “open source”) De-interlacing method
This documentation is desirable but not required.
37.2. Test Materials??TBD
The test material will be representative of a range of content and applications. The list below identifies the type of test material that forms the basis for selection of sequences.
1) video conferencing: (available for research purposes only, NTIA (Rec 601 60Hz); BT (Rec 601 50Hz), Yonsei (QVGA and SD), FT (Rec 601 50Hz, D1)), NTT (Rec 601 60Hz, D1)
Currently available: NTIA, NTT, FT
2) movies, movie trailers:(VQEG Phase II), Opticom, IRCCyN, (trailer equivalent, restricted within VQEG)
Currently available: Psytechnics, SVT, Opticom,
3) sports: (available, 15-20 mins from Yonsei, Comcast), KDDI (7 min D1 and D2, other scenes also available), NTIA (Comcast), IRCCyN
Currently available: Yonsei, SVT, Psytechnics, Opticom
4) music video: (Intel ), IRCCyN
Currently available: NTIA
5) advertisement:
Currently available: Psytechnics, Opticom
6) animation: (graphics Phase I, cartoon Phase II; Opticom will send material to Yonsei), IRCCyN
Currently available: Opticom, NTIA
7) broadcasting news: (head and shoulders and outside broadcasting). (available – Yonsei;, possible Comcast), IRCCyN
Page 32 of 87

Currently available: KBS, Opticom
8) home video: (FUB possibly, BT possibly, INTEL, NTIA). Must be captured with DV camera or better.
Currently available: NTIA, SwissQual, Yonsei
There will be no completely still video scenes in the test.
All test material should be sent to the content point of contact (Chulhee Lee, Yonsei) first and then it will be put on the ftp server by NTIA. Ideally the material should be converted before being sent to Chulhee Lee.
The source video will only be used in the testing if an expert in the field considers the quality to be good or excellent on an ACR-scale.
37.2.1. Selection of Test Material (SRC)
The ILG is responsible for selecting SRC material to be used in each subjective quality test. The VQEG Hybrid group will be responsible for deciding upon precise HRCs to be used in the testing. Section 5.3 provides basic guidelines on the process for selecting SRCs and HRCs together with a procedure for the distribution of test content.
37.3. Hypothetical Reference Circuits (HRC) [??TBD]
The subjective tests will be performed to investigate a range of HRC error conditions. These error conditions may include, but will not be limited to, the following:
Compression errors (such as those introduced by varying bit-rate, codec type, frame rate and so on)
Transmission errors
Post-processing effects
Live network conditions
Interlacing problems
The overall selection of the HRCs will be done such that most, but not necessarily all, of the following conditions are represented.
The following constraints must be met by every PVS. These constraints were chosen to be easily checked by the ILG, and to provide proponents with feedback on their model's calibration intended search range. It is recommended that those who generate PVSs should use the recommended maximum limits. Then, it would be very unlikely that the PVSs would violate the required maximum limits and have to be replaced.
Maximum allowable deviation in luminance gain is +/- 20% (Recommended maximum deviation in luminance gain is +/- 10% when generating PVSs)Maximum allowable deviation in luminance offset is +/- 50 (Recommended maximum deviation in luminance offset is +/- 20 when generating PVSs)Maximum allowable Horizontal Shift is +/- 8 pixels for QVGA, +/- 16 pixels for SD/HDTV +/- 5 pixels (Recommended maximum Horizontal Shift is +/- 3 pixels when generating PVSs)Maximum allowable Vertical Shift is +/- 8 lines for QVGA, +/- 16 lines for SD/HDTV+/- 5 lines (Recommended maximum Horizontal Shift is +/- 3 pixels when generating PVSs)
No PVS may have visibly obvious scaling.The color space must appear to be correct (e.g., a red apple should not mistakenly rendered be rendered "blue" due to a swap of the Cb and Cr color planes). No more than 1/2 of a PVS may consist of frozen frames or pure blackuni-color frames (e.g., from over-the-air broadcast lack of delivery).
Page 33 of 87

When creating PVSs, a SRC with +2 second of extra content before and after should be used. All of the content visible in the PVS should be contained in the SRC. Pure uni-color frames (e.g., from over-the-air broadcast lack of delivery) must not occur in the first 2-seconds or the last 2-seconds of any PVS. The reason for this constraint, is that the viewers may be confused and mistake the uni-color for the end of sequence. It is recommended that the first half second and the last half second might not contain any noticeable freezing so that the evaluators might not be confused whether the freezing comes from impairments or the player.The field order must not be swapped (e.g., field one moved forward in time into field two, field two moved back in time into field one). The intent of this test plan, is that all PVSs will contain realistic impairments that could be encountered in real delivery of HDTV (e.g., over-the-air broadcast, satellite, cable, IPTV). If a PVS appears to be completely unrealistic, proponents or ILGs may request to remove or replace it. ILGs will make the final decision regarding the removal or replacement.
37.3.1. Video Bit-rates (exemplary)
QVGA: 64 kbps to 704 kbps (e.g. 64, 128, 192, 320, 448, 704)
SDTV: 128kbps to 6Mbit/s (e.g. 128, 256, 320, 448, 704, ~1M, ~1.5M, ~2M, 3M,~4M)
HDTV: 1Mbit/s to 30Mbit/s
37.3.2. Simulated Transmission Errors
A set of test conditions (HRC) will include error profiles and levels representative of video transmission over different types of transport bearers:
Packet-switched transport (e.g., 2G or 3G mobile video streaming, PC-based wireline video streaming)
Circuit-switched transport (e.g., mobile video-telephony)
It is important that when creating HRCs using a simulator, documentation is produced detailing simulator settings (for circuit switched HRCs the error pattern for each PVS should also be produced).
Annex III provides guidelines on the procedures for creating and documenting transmission error conditions.
Packet-switched transmission
HRCs will include packet loss with a range of packet loss ratios (PLR) representative of typical real-life scenarios.
In mobile video streaming, we consider the following scenarios:
1. Arrival of packets is delayed due to re-transmission over the air. Re-transmission is requested either because packets are corrupted when being transmitted over the air, or because of network congestion on the fixed IP part. Video will play until the buffer empties if no new (error-checked/corrected) packet is received. If the video buffer empties, the video will pause until a sufficient number of packets are buffered again. This means that in the case of heavy network congestion or bad radio conditions, video will pause without skipping during re-buffering, and no video frames will be lost.
2. Arrival of packets is delayed, and the delay is too large: These packets are discarded by the video client.
Page 34 of 87

Note: A radio link normally has in-order delivery, which means that if one packet is delayed the following packets will also be delayed.
Note: If the packet delay is too long, the radio network might drop the packet.
3. Very bad radio conditions: Massive packet loss occurs.
4. Handovers: Packet loss can be caused by handovers. Packets are lost in bursts and cause image artifacts.
Note: This is valid only for certain radio networks and radio links, like GSM or HSDPA in WCDMA. A dedicated radio channel in WCDMA uses soft handover, which will not cause any packet loss.
Typical radio network error conditions are:
Packet delays between 100 ms and 5 seconds.
In PC-based wireline video streaming, network congestion causes packet loss during IP transmission.
In order to cover different scenarios, we consider the following models of packet loss:
1. Bursty packet loss. The packet loss pattern can be generated by a link simulator or by a bit or block error model, such as the Gilbert-Elliott model.
2. Random packet loss
3. Periodic packet loss.
Note: The bursty loss model is probably the most common scenario in a ‘normal’ network operation. However, periodic or random packet loss can be caused by a faulty piece of equipment in the network. Bursty, random, and periodic packet loss models are available in commercially-available packet network emulators.
Choice of a specific PLR is not sufficient to characterize packet loss effects, as perceived quality will also be dependent on codecs, content, packet loss distribution (profiles) and which types of video frames were hit by the loss of packets. For our tests, we will select different levels of loss ratio with different distribution profiles in order to produce test material that spreads over a wide range of video quality. To confirm that test files do cover a wide range of quality, the generated test files (i.e., decoded video after simulation of transmission error) will be:
1. Viewed by video experts to ensure that the visual degradations resulting from the simulated transmission error are spread over a range of video quality over different content;
2. Checked to ensure that degradations remain within the limits stated by the test plan (e.g., in the case where packet loss causes loss of complete frames, we will check that temporal misalignment remains with the limits stated by the test plan).
Circuit-switched transmission
HRCs will include bit errors and/or block errors with a range of bit error rates (BER) or/and block 4 error rates (BLER) representative of typical real-world scenarios. In circuit-switched transmission, e.g., video-telephony, no re-transmission is used. Bit or block errors occur in bursts.
In order to cover different scenarios, the following error levels can be considered:
Air interface block error rates: Normal uplink and downlink: 0.3%, normally not lower. High value uplink: 0.5%, high downlink: 1.0%. To make sure the proponents’ algorithms will handle really bad conditions up to 2%-3% block errors on the downlink can be used.
4 Note that the term ‘block’ does not refer to a visual degradation such as blocking errors (or blockiness) but refers to errors in the transport stream (transport blocks).
Page 35 of 87

Bit stream errors: Block errors over the air will cause bits to not be received correctly over the air. A video telephony (H.223) bit stream will experience CRC errors and chunks of the bit stream will be lost.
Tools are currently being sought to simulate the types of error transmission described in this section.
Proponents are asked to provide examples of level of error conditions and profiles that are relevant to the industry. These examples will be viewed and/or examined after electronic distribution (only open source video is allowed for this).
37.3.3. Live Network Conditions
Simulated errors are an excellent means to test the behavior of a system under well defined conditions and to observe the effects of isolated distortions. In real live networks however usually a multitude of effects happen simultaneously when signals are transmitted, especially when radio interfaces are involved. Some effects like e.g. handovers, can only be observed in live networks.
The term "live network" specifies conditions which make use of a real network for the signal transmission. This network is not exclusively used by the test setup. It does not mean that the recorded data themselves are taken from live traffic in the sense of passive network monitoring. The recordings may be generated by traditional intrusive test tools, but the network itself must not be simulated.
Live network conditions of interest include radio transmission (e.g., mobile applications) and fixed IP transmission (e.g., PC-based video streaming, PC to PC video-conferencing, best-effort IP-network with ADSL-access). Live network testing conditions are of particular value for conditions that cannot confidently be generated by network simulated transmission errors (see section 37.3.4). Live network conditions should exhibit distortions representative of real-world situations that remain within the limits stated elsewhere in this test plan.
Normally most live network samples are of very good or best quality. To get a good proportion of sample quality levels, an even distribution of samples from high to low quality should be saved after a live network session.
Note: Keep in mind the characteristics of the radio network used in the test. Some networks will be able to keep a very good radio link quality until it suddenly drops. Other will make the quality to slowly degrade.
Samples with perfect quality do not need to be taken from live network conditions. They can instead be recorded from simulation tests.
Live network conditions as opposed to simulated errors are typically very uncontrolled by their nature. The distortion types that may appear are generally very unpredictable. However, they represent the most realistic conditions as observed by users of e.g. 3G networks.
Recording PVSs under live network conditions is generally a challenging task since a real hardware test setup is required. Ideally, the capture method should not introduce any further degradation. The only requirement on capture method is that the captured sequences conform to the file requirements in section 37.1.8 and 38.2.
For applications including radio transmissions, one possibility is to use a laptop with e.g. a built-in 3G network card and to download streams from a server through a radio network. Another possibility is the use of drive test tools and to simulate a video phone call while the car is driving. In order to simulate very bad radio coverage, the antenna may be wrapped with some aluminum foil (Editors note: This strictly a simulation again, but for the sake of simplicity it can be accepted since the simulated bad coverage is overlayed with the effects from the live network).
In order to prepare the PVSs the same rules apply as for simulated network conditions. The only difference is the network used for the transmission.
Any transmission errors will be allowed as long as the corresponding PVSs meet the calibration limits.
Page 36 of 87

37.3.4. Pausing with Skipping and Pausing without Skipping (freezing) for 10s and 15s PVSs
• Recommended maximum freezing: 3s (mandatory limit: 5s)
• Recommended maximum skipping: 3s (mandatory limit: 5s)
• Recommended maximum total frame loss (maximum total frame loss= maximum frame loss at start + maximum frame loss at end): 1s (mandatory limit: 2s)
• Recommended maximum total extra frame (including beginning and end): 1s (mandatory requirement: the entire PVS must be contained in the SRC used for encoding??).
• Anything can happen in-between (freezing with/without skipping, skipping, fast forward) as long as they meet the aforementioned conditions. The video should not play backwards, because this is an unnatural impairment. However, the video may jump backwards in time in response to a transmission error, or display a portion of a previous frame along with the current frame.
37.3.5. Frame Rates
For those codecs that only offer automatically set frame rate, this rate will be decided by the codec. Some codecs will have options to set the frame rate either automatically or manually. For those codecs that have options for manually setting the frame rate (and we choose to set it for the particular case), 5 fps will be considered the minimum frame rate for VGA and CIF, and 2.5 fps for PDA/Mobile.
Manually set frame rates (constant frame rate) may include:
QVGA: 30, 25, 15, 12.5, 10, 8, 5 fps
SDTV: 30, 25 fps (interlaced)
HDTV: 1080i 60 Hz (30 fps), 1080i 50 Hz (25 fps), 1080p (25 fps), 1080p (30 fps)
Variable frame rates are acceptable for the HRCs. The first 1s and last 1s of each QCIF PVS must contain at least two unique frames, provided the source content is not still for those two seconds. The first 1s and last 1s of each QVGA, SD and HD PVS must contain at least four unique frames, provided the source content is not still for those two seconds.
Care must be taken when creating test sequences for display on a PC monitor. The refresh rate can influence the reproduction quality of the video and VQEG Hybrid requires that the sampling rate and display output
Page 37 of 87

rate are compatible. For example: given a source frame rate of video is 30fps, the sampling rate is 30/X (e.g. 30/2 = sampling rate of 15fps). This is called frame rate. Then we upsample and repeat frames from the sampling rate of 15fps to obtain 30 fps for display output.
The intended frame rate of the source and the PVS must be identical.
37.3.6. Pre-Processing
The HRC processing may include, typically prior to the encoding, one or more of the following:
Filtering
Simulation of non-ideal cameras (e.g. mobile)
Colour space conversion (e.g. from 4:2:2 to 4:2:0)
Interlacing of previously de-interlaced source.
Down- and up-sampling
This processing will be considered part of the HRC.
37.3.7. Post-Processing
The following post-processing effects may be used in the preparation of test material:
Colour space conversion
De-blocking
Decoder jitter
Down- and up-sampling
De-interlacing of codec output including when it has been interlaced prior to codec input.
37.3.8. Coding Schemes
Coding Schemes are as follows:
H.264 (MPEG-4 Part 10): QVGA, SD, HD
MPEG-2: SD
[??TBD] We specify profiles. Suggestions for H.264: QVGA in baseline, SD in baseline and main, HD in main. Suggestions for MPEG-2: HD in main and high profile.
37.3.9. Processing and Editing Sequences
Page 38 of 87

37.4. Reference Decoder
For hybrid models, multiple decoders/players can be used to generate PVSs as long as the decoders can
handle the bit-stream data which the reference decoder can decode. Bit-streams data can be generated by any
encoder as long as the reference decoder can decode the bit stream data.
Number of reference decoders (for compatibility check): 1 reference decoder per codec. Number of encoders: any encoders compatible with the reference decoder. It is preferred that more than
one encoder is used. Number of decoders (for subjective tests and inputs to hybrid models): any decoders compatible with the
reference decoder. It is preferred that more than one decoder is used.
Currently, there are two candidate reference decoders for H.264:
Ericsson (available at http://???)
Yonsei University (available at http://???)
6.4.1 Ericsson Working System for QVGA
1 Overview
This document describes the Ericsson offline processing system for H.264 / RTP / UDP / IP. All applications
used can be run from the command line in Windows.
2 Application Usage
2.1 Encoding and RTP packetization
Example usage JM 15.1 encoder:
lencod.exe -d encoder_baseline.cfg -p InputFile=src.yuv -p OutputFile=encoded.rtp -p Framerate=30 -p
Bitrate=150000 -p Intraperiod=75
More encoding parameters can be set by overriding or changing the parameters in encoder_baseline.cfg.
Note: RTP timestamp increment is hardcoded to 1000 in the JM encoder. This should be changed for other
frame rates than 30fps.
2.2 Impairment
Page 39 of 87
EncodingJMenc
ImpairmentPacket removal tool
PCAP convrtp2pcap
PCAP convPcap2rtp
DepacketizeJMdec
PacketizeJMenc
RTPPCAPRTPRTPH264ES
DecodeJMdec
H264ES

Use either rtp_loss that comes with the JM distribution (http://iphome.hhi.de/suehring/tml/) or markovloss
developed at Ericsson. rtp_loss uses a simple uniform loss model while markovloss uses a simple bursty
markov model for rtp packet loss.
Example usage rtp_loss:
rtp_loss.exe encoded.rtp degraded.rtp 3 30
Example usage markovloss:
markovloss.exe encoded.rtp degraded.rtp 0.03 0.5 30
2.3 Pcap conversion
These conversion tools have been developed at Ericsson.
Example usage rtp2pcap:
rtp2pcap.exe degraded.rtp degraded.pcap
Example usage pcap2rtp:
pcap2rtp.exe degraded.pcap degraded2.rtp
2.4 Depacketization and decoding
Usage JM 15.1 decoder:
ldecod.exe decoder.cfg
which produces a decoded file decoded.yuv from the input file degraded2.rtp. The file names and a few other
parameters can be changed in decoder.cfg
6.4.1 Yonsei Working System
Capture(Wireshark)
PCAPHeader remove
(MPEG- TS)
Decoding(JM)
.pcap
.ts
Encoding &Encapsulation
(Elecard)
Raw file
Streaming(VLC server)
.ts
.ts
Server Client
channel
Page 40 of 87

Program Web address
EncoderElecard Converter
StudioVersion 3.1
MPEG-2H.264
http://www.elecard.com(AVI -> TS)
Server VLC media playerVersion 0.9.9
TCPUDPRTP
http://www.videolan.org/vlc/streaming.html
Packet Capture
WiresharkVersion 1.2.0
http://www.wireshark.org/ (TS->PCAP)
RemovePCAPheader
PCAPtoTS.exe .pcap -> .ts Home made program (PCAP->TS)
Decoder JM12.4 JM http://iphome.hhi.de/suehring/tml/ (TS->.264->YUV)
Page 41 of 87

38. Objective Quality Models
Figs. 7.1-3 show input parameters for FR, RR and NR hybrid perceptual bit-stream models. Fig. 4 illustrates the input parameters for the various models. Fig. 7.5 shows input parameters for P.NAMS and P.NBAMS. Fig. 7.6 illustrates how bit-stream data and PVSs are captured.
Fig. 7.1. Input parameters for FR hybrid perceptual bit-stream models.
Fig. 7.2. Input parameters for RR hybrid perceptual bit-stream models.
Page 42 of 87

Fig. 7.3. Input parameters for NR hybrid perceptual bit-stream models.
Fig. 7.4. Input parameters for various models. [??TBD] What’s the difference between the circle and the triangle in the last column?
Page 43 of 87

headerextractor
bit-stream data(trace dump with arrival time)
P.NBAMSbit-stream data(trace dump with arrival time)
P.NAMS
Fig. 7.5. Inputs for P.NAMS and P.NBAMS.
Fig. 7.6. Bit-stream capture and video capture procedure.
[Editor’s note: the following paragraph has to be decided].
In order to make sure that all models will understand the bit-stream data with/without transmission errors, open-source reference decoder and reference IP analyzer will be used to check the admissibility of bit-stream data (Figs. 7.7-8).
referencedecoder
bit-stream datawithout transmission errors
Fig. 7.7. Data compliance test for bit-stream data without transmission errors [??TBD].
Page 44 of 87

reference IPanalyzer &decoder
bit-stream datawith transmission errors
Fig. 7.8. Data compliance test for bit-stream data transmission errors [??TBD].
38.1. Model Type
VQEG Hybrid has agreed that ??TBDP.NAMS, P.NBAMS??, Full Reference, Reduced Reference and No Reference hybrid perceptual bit-stream models may be submitted for evaluation. The side-channels allowable for the RR hybrid perceptual bit-stream models are:
QVGA: (10kbps, 64kbps)
SD/HD (H.264): (15kbps, 56kbps, 128kbps, 256kbps)
SD (MPEG2): (10kbps, 64kbps)
Note that for each side-channel condition the limits defined here represent the maximum allowable side-channel data rate. For example, where the side-channel is limited to10 kbps, then valid side-channels are those that use a data rate of <=10 kbps and any data rates above 10 kbps are invalid. It is noted that 1kbps represents 1024 bits per second.
If there are proponents for NR models, such models will be also validated.
Proponents may submit one model of each type for all image size conditions. Note that where multiple models are submitted, additional model submission fees may apply.
38.2. Model Input and Output Data Format
Video will be full frame, full frame rate. The progressive and interlaced video format will be used in the test. The lengths of SRCs and PVSs are as follows:
SRC and PVS length for SD/HD: 15 sec (fixed)
SRC and PVS length for QVGA: 10 sec when the length is fixed (no rebuffering)
SRC and PVS length for QVGA: 16 seconds for SRCs and up to 24 seconds for PVSs when rebuffering is allowed.
Rebuffering is defined as freezing longer than 0.5 second without skipping.
7.2.1 P.NAMS Models in accordance with P.NAMS will receive TS, RTP, UDP, and IP headers. They may also optionally receive long freezing [proposal by NTT, ??TBD]. Furthermore, models may receive encapsulated bit-streams [proposal by BT, TBD].
7.2.2 P.NBAMSModels in accordance with P. NBAMS will receive TS, RTP, UDP, IP headers, and ES information. They may also optionally receive long freezing [proposal by NTT, ??TBD]. Furthermore, models may receive encapsulated bit-streams [proposal by BT, ??TBD].
Page 45 of 87

7.2.3 Full reference hybrid perceptual bit-stream models
In addition to the input parameters received by P.NBAMS, the FR hybrid perceptual bit-stream model will be given an ASCII file listing pairs of video sequence files to be processed. Each line of this file has the following format:
<source-file> <processed-file>
where <source-file> is the name of a source video sequence file and <processed-file> is the name of a processed video sequence file, whose format is specified in section 37.1.8 of this document. File names may include a path. For example, an input file should adhere to the following naming convention:
/video/hXX_YYY.avi /video/hXX_YYY.avi (Unix) or\video\hXX_YYY.avi \video\hXX_YYY.avi (Windows)
/video/sXX_YYY.avi /video/s_YYY.avi (Unix) or\video\sXX_YYY.avi \video\sXX_YYY.avi (Windows)
/video/qvXX_YYY.avi /video/qvXX_YYY.avi (Unix) or\video\qvXX_YYY.avi \video\qvXX_YYY.avi (Windows)
/video/qcXX_YYY.avi /video/qcXX_YYY.avi (Unix) or\video\qcXX_YYY.avi \video\qcXX_YYY.avi (Windows)
where ‘h’ represents HD, ‘s’ represents SD, “qv” represents QVGA, “c” represents QCIF, XX indicates the test number and YYY represents the video sequence index. The leading characters (v,c,qv,qc) and all extensions (“avi” and “dat”) should be in lower cases.
The output file is an ASCII file created by the model program, listing the name of each processed sequence and the resulting Video Quality Rating (VQR) of the model. The contents of the output file should be flushed after each sequence is processed, to allow the testing laboratories the option of halting a processing run at any time. Each line of the ASCII output file has the following format:
< source-file > <processed-file> VQR
Where < source-file > is the name of the source file run through this model, without any path information; and <processed-file> is the name of the processed sequence run through this model, without any path information. VQR is the Video Quality Ratings produced by the objective model. For the input file example, this file contains the following:
h01_ref.avi h01_001.avi 0.150 h01_ref.avi h01_002.avi 1.304 h01_ref.avi h01_003.avi 0.102 h01_ref.avi h01_004.avi 2.989
Each proponent is also allowed to output a file containing Model Output Values (MOVs) that the proponents consider to be important. The format of this file will be
h01_001.avi 0.150 MOV1 MOV2,… MOVN
h01_002.avi 1.304 MOV1 MOV2,… MOVN
h01_003.avi 0.102 MOV1 MOV2,… MOVN
h01_004.avi 2.989 MOV1 MOV2,… MOVN
Page 46 of 87

7.2.4 Reduced-reference Models
In an effort to limit the amount of variations and in agreement with all proponents attending the VQEG meeting consensus was achieved to allow only downstream video quality models.
7.2.4.1 Downstream Model Original Video Processing:
The software (model) for the original video side will be given the original test sequence in the final file format and produce a reference data file. The amount of reference information in this data file will be evaluated in order to estimate the bit rate of the reference data and consequently assign the class of the method (Section 7.1). The input file format of the full-reference model will be used for the RR model for the original video side. Deterministic RR models for the original video side may ignore the processed video file name which is the second argument. For example, given an input file:
/video/hXX_YYY.avi /video/hXX_ZZZ.avi (Unix example, for Windows OS the path conforms to Windows format)
Then, the model should produce reference data files whose file names are made in the following way:
/video/hXX_YYY_BBB.dat (deterministic models) or/video/hXX_YYY_ZZZ_BBB.dat (deterministic and non-deterministic models)
where BBB indicates side-channel bandwidth in kbps. For example, for a VGA RR model with the 10kbps side channel, the output file names should be as follows:
hXX_001_10.dat hXX_002_10.dat
or
hXX_001_023_10.dat hXX_002_100_10.dat.
The model should save the output files in the current directory. The ILG should make sure that PVS files are not available for the software for the original video side.
7.2.4.2 Downstream Model Processed Video Processing:
In addition to the input parameters received by P.NBAMS, the software (model) for the processed video side will be given the processed test sequence in the final file format and a reference data file that contains the reduced-reference information (see Model Original Video Processing). The input file format of the full-reference model will be used for the model for the processed video side. The format of this file will be
/video/hXX_YYY.avi /video/hXX_ZZZ.avi
where h indicates HD resolution, XX indicates the test number, YYY represents the source video sequence index and ZZZ represents the processed video sequence index. Then, the model should make reference data file names as follows:
/video/hXX_YYY_BBB.dat (deterministic models) OR
Page 47 of 87

/video/hXX_YYY_ZZZ_BBB.dat (deterministic and non-deterministic models)
where BBB indicates side-channel bandwidth in kbps. Finally, the model should use the processed video file and the reference data file, and produce a VQR for the processed video sequence. The ILG should make sure that SRC files are not available for the software for the processed video side.
The output file format of the RR model will be identical with that of the FR model (Section 7.2.1).
7.2.4.3 Input Parameters for RR hybrid perceptual bit-stream models.
Some RR models, the identical software may generate and process reference data files at various side-channel bandwidths. In this case, the software needs information on side-channel bandwidth. In order to provide the information, the software (model) for the original video side will be given two arguments as follows:
CompanyName_hRRsrc.exe hXX.txt BBB
where hXX.txt is the input file name, XX indicates the test number and BBB indicates side-channel bandwidth in kbps.
The software (model) for the processed video side will be given two arguments as follows:
CompanyName_hRRpvs.exe hXX.txt BBB
7.2.5 No-reference hybrid perceptual bit-stream models
In addition to the input parameters received by P.NBAMS, the NR model will be also given an ASCII file listing only processed video sequence files. Each line of this file has the following format:
<processed-file>
where <processed-file> is the name of a processed video sequence file, whose format is specified in section 37.1.8 of this document. File names may include a path. For example, an input file should adhere to the following naming convention:
/video/hXX_001.avi/video/hXX_002.avi
The output file format of the NR model will take the form
<processed-file> VQR
where <processed-file> is the name of the processed sequence run through this model, without any path information. VQR is the Video Quality Ratings produced by the objective model.
NR models will be required to predict the perceptual quality of both the source and processed video files used in subjective quality tests.
38.3. Submission of Executable Model
For each video format (QVGA, SD, and HD), a set of 2 source and processed video sequence pairs will be used as test vectors. They will be available for downloading on the VQEG web site http://www.vqeg.org/.
Page 48 of 87

Each proponent will send an executable of the model and the test vector outputs to the ILG by the date specified in action item “Proponents submit their models (executable and, only if desired, encrypted source code)” of Section 5.3. The executable version of the model must run correctly on one of the two following computing environments:
SUN SPARC workstation running the Solaris 2.3 UNIX operating system (SUN OS 5.5). [Ed. Note: The used of SUN workstation should be agreed]
WINDOWS 2000 workstation and Windows XP.
The use of other platforms will have to be agreed upon with the independent laboratories prior to the submission of the model.
The ILG will verify that the software produces the same results as the proponent with a maximum error of plus or minus 0.0001% of the proponents reported value. See Annex X for requirements on non-deterministic models. A maximum of 5 randomly selected files will be used for verification. If greater errors are found, the independent and proponent laboratories will work together to correct them. If the errors cannot be corrected, then the ILG will review the results and recommend further action.
38.4. Registration
Measurements will only be performed on the portions of PVSs that are not anomalously severely distorted (e.g. in the case of transmission errors or codec errors due to malfunction).
Models must include calibration and registration if required to handle the following technical criteria (Note: Deviation and shifts are defined as between a source sequence and its associated PVSs. Measurements of gain and offset will be made on the first and last seconds of the sequences. If the first and last seconds are anomalously severely distorted, then another 2 second portion of the sequence will be used.):
maximum allowable deviation in offset is ±20
maximum allowable deviation in gain is ±0.1
maximum allowable Horizontal Shift is +/- 1 pixel
maximum allowable Vertical Shift is +/- 1 pixel
maximum allowable Horizontal Cropping is 30 pixels for HD, 12 pixels for SD, 6 pixels for VGA, and 3 pixels for QCIF (for each side).
maximum allowable Vertical Cropping is 20 pixels for HD, 12 pixels for SD, 6 pixels for QVGA, and 3 pixels for QCIF (for each side).
no Spatial Rotation or Vertical or Horizontal Re-scaling is allowed
no Spatial Picture Jitter is allowed. Spatial picture jitter is defined as a temporally varying horizontal and/or vertical shift.
For a description of offset and gain in the context of this testplan see Annex IX. This Annex also includes the method for calculating offset and gain in PVSs.
No Reference Models should not need calibration.
Reduced Reference Models must include temporal registration if the model needs it. Temporal misalignment of no more than +/-0.25s is allowed. Please note that in subjective tests, the start frame of both the reference and its associated HRCs are matched as closely as possible. Spatial offsets are expected to be very rare. It is expected that no post-impairments are introduced to the outputs of the encoder before transmission. Spatial
Page 49 of 87
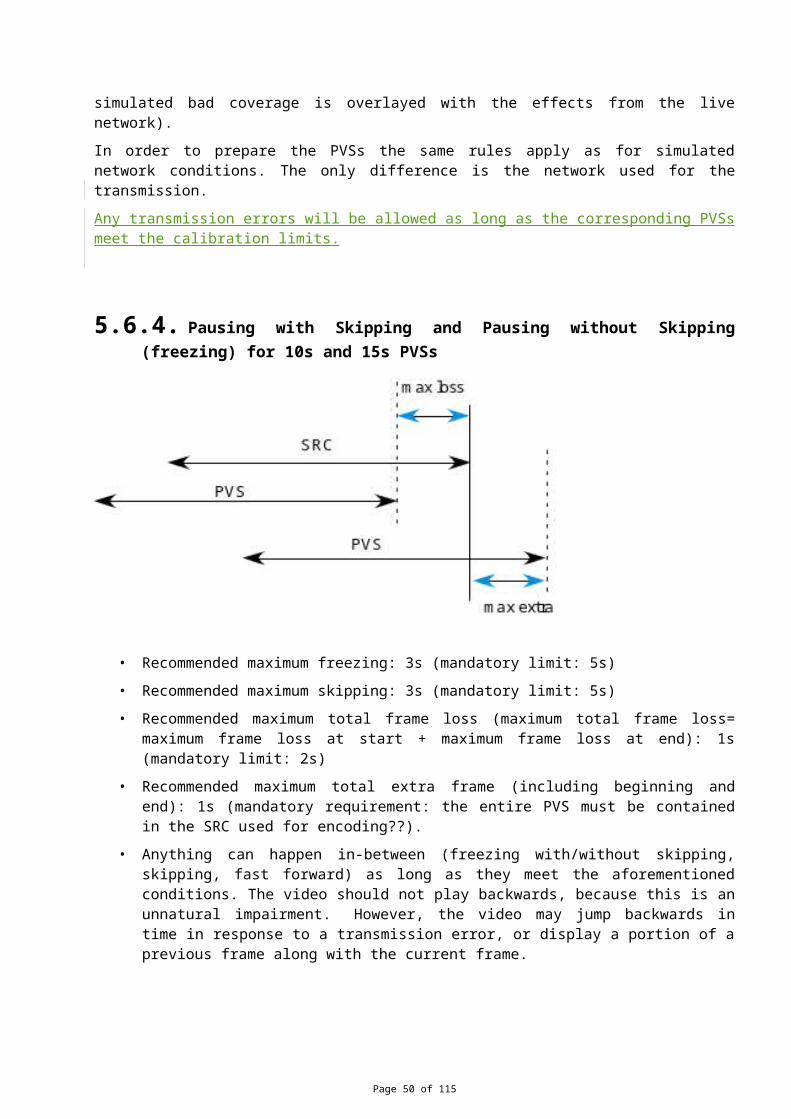
registration will be assumed to be within (1) pixel. Gain, offset, and spatial registration will be corrected, if necessary, to satisfy the calibration requirements specified in this test plan.
The organizations responsible for creating the PVSs shall check that they fall within the specified calibration and registration limits. The PVSs will be double-checked by one other organization. After testing has been completed any PVS found to be outside the calibration limits shall be removed from the data analyzes. ILG will decide if a suspect PVS is outside the limits.
Page 50 of 87

39. Objective Quality Model Evaluation Criteria
This chapter describes the evaluation metrics and procedure used to assess the performance of an objective video quality model as an estimator of video picture quality in a variety of applications.
39.1. Evaluation Procedure
The performance of an objective quality model is characterized by three prediction attributes: accuracy, monotonicity and consistency.
The statistical metrics root mean square (rms) error, Pearson correlation, and outlier ratio together characterize the accuracy, monotonicity and consistency of a model’s performance. These statiscical metrics are named evaluation metrics in the following. The calculation of each statistical metric is performed along with its 95% confidence intervals. To test for statistically significant differences among the performance of various models, the F-test will be used for each evaluation metric.
The evaluation metrics are calculated using the objective model outputs and the results from viewer subjective rating of the test video clips. The objective model provides a single number (figure of merit) for every tested video clip. The same tested video clips get also a single subjective figure of merit. The subjective figure of merit for a video clip represents the average value of the scores provided by all evaluators viewing the video clip.
Objective models cannot be expected to account for (potential) differences in the subjective scores for different viewers or labs. Such differences, if any, will be measured, but will not be used to evaluate a model’s performance. “Perfect” performance of a model will be defined so as to exclude the residual variance due to within-viewer, between-viewer, and between-lab effects
The evaluation analysis is based on DMOS scores for the FR and RR models, and on MOS scores for the NR model. Discussion below regarding the DMOS scores should be applied identically to MOS scores. For simplicity, only DMOS scores are mentioned for the rest of the chapter.
The objective quality model evaluation will be performed in three steps. The first step is a monotonic rescaling of the objective data to better match the subjective data. The second calculates the performance metrics for the model and their confidence intervals. The third tests for differences between the performances of different models using the F-test.
39.2. PSNR
PSNR will be calculated to provide a performance benchmark. Proponents are encouraged to calculate PSNR Ideally, PSNR should be calculated with a spatial registration accuracy 0.1 pixel. If this is not possible, then a maximum registration tolerance of 0.5 pixel spatial accuracy is required. The Pearson correlation evaluation metric defined in this section will be applied to determine the predictive performance of PSNR and this will be reported in the final report.
Due to complexity of some HRCs, it could be possible that there are spatial or temporal misalignments and gain/offset variations. Ideally, PSNR should be calculated after compensation of these effects. Therefore, a modified version of the standard PNSR is considered in this test plan. Here are the details of its computation:
o First step is a spatial filtering (median filter 3x3) applied on both source and processed video in order to remove the effects of noise in the capturing process,
o Second step consists in performing a first global spatial and temporal alignment searching the temporal and spatial shifts that provides the maximum SNR using the first second of the PVS under test. These shifts are then used to estimate the gain/offset alignment that provides the maximum SNR using the same first second of the PVS. Spatial and gain/offset align-ments are considered to be constant for the overall sequence. The PVS is therefore realigned
Page 51 of 87

using the estimated values before next step.
o Third step is a secondary temporal alignment process done locally (e.g. frame by frame and using a search window of several seconds). Each frame of the PVS is associated to one frame of the SRC.
o Finally, the usual PSNR is calculated on realign data but considering only Y component.
39.3. Data Processing
Prior to any data analysis, the ILG will perform an inspection of the subjective test data. Any source sequences presented in the test with a MOS rating of <4 will be identified and the file will be examined. If, in the opinion of the ILG the poor MOS values for these source sequences are due to inferior quality then they shall be removed and not included in the subsequent data analysis. This data inspection will be completed prior to proponents submitting their objective data to the ILG.
39.3.1. Calculating DMOS Values
The data analysis will be performed using the difference mean opinion score (DMOS). DMOS values are calculated on a per evaluator per PVS basis. The appropriate hidden reference (SRC) is used to calculate the DMOS value for each PVS. DMOS values will be calculated using the following formula:
DMOS = MOS (PVS) – MOS (SRC) + 5
In using this formula, a DMOS of 5 indicates ‘Excellent’ quality and a DMOS of 1 indicates ‘Bad’ quality. Any DMOS values greater than 5 (i.e. where the processed sequence is rated better quality than its associated hidden reference sequence) will be considered valid and included in the data analysis.
39.3.2. Mapping to the Subjective Scale
Subjective rating data often are compressed at the ends of the rating scales. It is not reasonable for objective models of video quality to mimic this weakness of subjective data. Therefore, in previous video quality projects VQEG has applied a non-linear mapping step before computing any of the performance metrics. A non-linear mapping function that has been found to perform well empirically is the cubic polynomial given in (1)
(1)
Where DMOSp is the predicted DMOS, and the VQR is the model’s computed value for a clip-HRC combination. The weightings a, b and c and the constant d are obtained by fitting the function to the data [DMOS, VCR]. The mapping function will maximize correlation between DMOSp and DMOS:
with constant k = 1, d = 0
This function must be constrained to be monotonic within the range of possible values for our purposes.
Then root mean squared error is minimized over k and d.
a = k*a’
b = k*b’
c = k*c’
Page 52 of 87
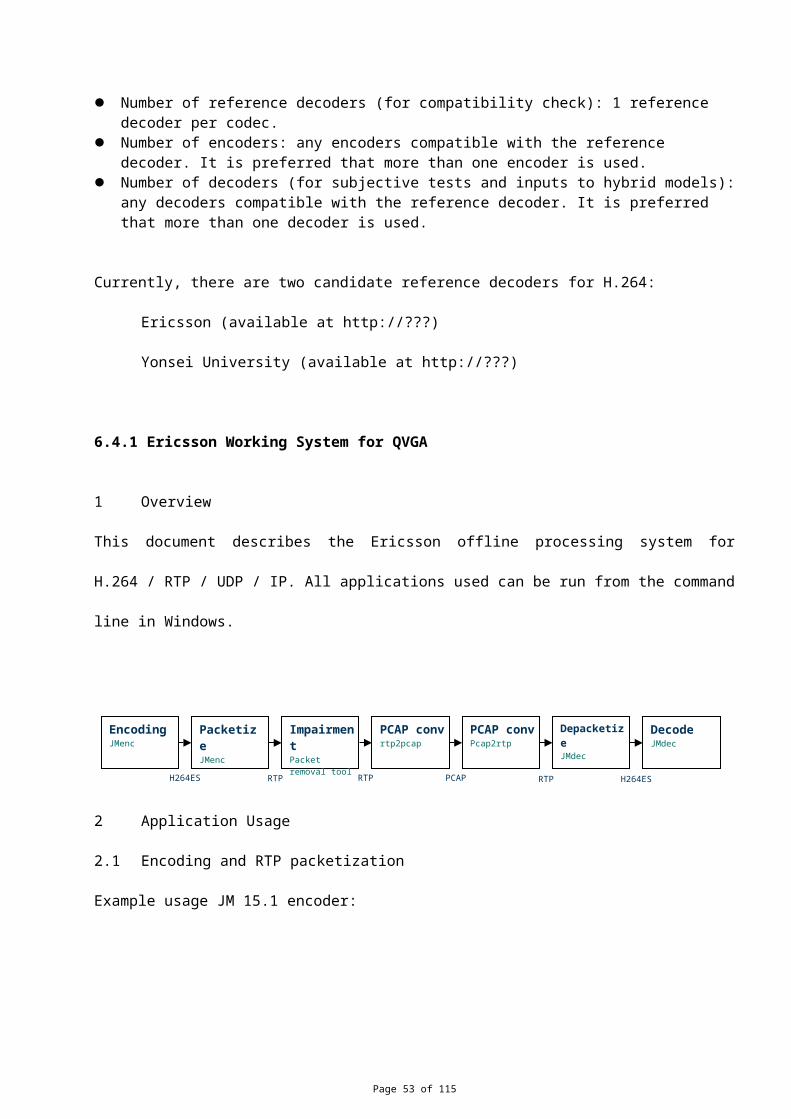
This non-linear mapping procedure will be applied to each model’s outputs before the evaluation metrics are computed.
Proponents, in addition to the ILG, may compute the coefficients of the mapping functions for their models and submit the coefficients to ILGs. The proponent who submits the coefficients should also submit his mapping tool (executable) to ILGs so that ILGs can use the mapping tool for other models. It is desirable that the proponent also submit the coefficients of the mapping functions for all the other proponents’ models. If a proponent chooses not to exercise this option to compute the coefficients of the mapping functions, the ILG will compute the coefficients of the mapping functions. The ILG will use the coefficients of the fitting function that produce the best correlation coefficient provided that it is a monotonic fit.
Any and all mapping algorithms used for the official data analysis must be referenced.
39.3.3. Averaging Process
Primary analysis of model performance will be calculated per processed video sequence.
Secondary analysis of model performance may be calculated and reported on (1) averaged data, by averaging all SRC associated with each HRC (DMOSH)(2) averaged data, by averaging all HRC associated with each SRC (DMOSS).
The common sequences (i.e., included in every experiment at one resolution) will not used for HRC analysis. This is in contrast to the primary data analysis, where the PVSs for each individual test and the common sequences were analyzed together. This secondary analysis used the same mapping as the primary analysis (e.g. computed on a per PVS basis). T
39.3.4. Aggregation Procedure
The evaluation of the objective metrics is performed in two steps. In the first step, the objective metrics are evaluated per experiment. In this case, the evaluation/statistical metrics are calculated for all tested objective metrics. A comparison analysis is then performed based on significance tests. In the second step, an aggregation of the performance results is considered. The aggregation will be performed by taking the average values for all three evaluation metrics for all experiments (see section 8.3).
The ILG has the option open to use some of the secret tests to replicate ILG experiments (i.e., run viewers through another lab’s experiment). Models’ performance evaluation will follow the procedures laid out above. The data collected will be not be considered an additional experiment for the purposes of model comparison--i.e. no double weight for any single experiment. The first experiment run will provide the data to be used for model performance evaluation. The replication data will be used for other analyses. This data will be shared with the proponents.
39.4. Evaluation Metrics
Once the mapping has been applied to objective data, the three evaluation metrics: root mean square error, Pearson correlation coefficient and outlier ratio are determined. The calculation of each evaluation metric is performed along with its 95% confidence interval.
39.4.1. Pearson Correlation Coefficient
The Pearson correlation coefficient R (see Equation 2) measures the linear relationship between a model’s performance and the subjective data. Its great virtue is that it is on a standard, comprehensible scale of -1 to 1 and it has been used frequently in similar testing.
Page 53 of 87

(2)
Xi denotes the subjective score DMOS and Yi the objective DMOSp one. N represents the total number of video samples considered in the analysis.
It is known [1] that the statistic z (3) is approximately normally distributed and its standard deviation is defined by (4). Equation (3) is called Fisher-z transformation.
(3)
(4)
The 95% confidence interval (CI) for the correlation coefficient is determined using the Gaussian distribution, which characterizes the variable z and it is given by (5)
CI = (5)
NOTE. If less than N<30 samples are used, then the Gaussian distribution needs to be replaced by the two-tailed t-Student distribution with t=1.96 [1].
.
39.4.2. Root Mean Square Error
The accuracy of the objective metric is evaluated using the root mean square error (rmse) evaluation metric.
The difference between measured and predicted DMOS is defined as the absolute prediction error Perror (6)
(6)
where the index i denotes the video sample.
The root-mean-square error of the absolute prediction error Perror is calculated with the formula (7)
(7)
.Where N denotes the number of samples and d the number of degrees of freedom of the mapping function (1).The root mean square error is approximately characterized by a ^2 (n) [1 [Ed. Note: a page number or equation should be given here], where n represents the degrees of freedom and it is defined by (8)
(8)
where N represents the total number of samples.Using the ^2 (n) distribution, the 95% confidence interval for the rmse is given by (9) [1]
(9)
Page 54 of 87

39.4.3. Outlier Ratio
The consistency attribute of the objective metric is evaluated by the outlier ratio OR which represents number of “outlier-points” to total points N.
(10)
where an outlier is a point for which
(11)
where σ(DMOS(i)) represents the standard deviation of the individual scores associated with the video clip i. The individual scores are approximately normally distributed and therefore twice the σ value represents the 95% confidence interval. Thus, 2 * σ(DMOS(i))value represents a good threshold for defining an outlier point.
The outlier ratio represents the proportion of outliers in N number of samples. Thus, the binomial distribution could be used to characterize the outlier ratio. The outlier ratio is represented by a distribution of proportions [1] characterized by the mean (12) and standard deviation (13)
(12)
(13)
For N>30, the binomial distribution, which characterizes the proportion p, can be approximated with the Gaussian distribution . Therefore, the 95% confidence interval (CI) of the outlier ratio is given by (14)
CI = (14)
NOTE. If less than N<30 samples are used, then the t-Student distribution with t=1.96 [1] can be used instead.
39.5. Statistical Significance of the Results
39.5.1. Significance of the Difference between the Correlation Coefficients
The test is based on the assumption that the normal distribution is a good fit for the video quality scores’ populations. The statistical significance test for the difference between the correlation coefficients uses the H0 hypothesis that assumes that there is no significant difference between correlation coefficients. The H 1
hypothesis considers that the difference is significant, although not specifying better or worse.
The test uses the Fisher-z transformation (3) [1]. The normally distributed statistic (15) is determined for each comparison and evaluated against the 95% t-Student value for the two–tail test, which is the tabulated value t(0.05) =1.96.
Page 55 of 87

(15)
where (16)
and (17)
σz1 and σz2 represent the standard deviation of the Fisher-z statistic for each of the compared correlation coefficients. The mean (16) is set to zero due to the H0 hypothesis and the standard deviation of the difference metric z1-z2 is defined by (17). The standard deviation of the Fisher-z statistic is given by (18):
(18)
where N represents the total number of samples used for the calculation of each of the two correlation coefficients.
39.5.2. Significance of the Difference between the Root Mean Square Errors
Considering the same assumption that the two populations are normally distributed, the comparison procedure is similarly to the one used for the correlation coefficients. The H0 hypothesis considers that there is no difference between rmse values. The alternative H1 hypothesis is assuming that the lower prediction error value is statistically significantly lower. The statistic defined by (19) has a F-distribution with n1 and n2 degrees of freedom [1].
(19)
rmse,max is the highest rmse and rmse,min is the lowest rmse involved in the comparison. The ζ statistic is evaluated against the tabulated value F(0.05, n1, n2) that ensures 95% significance level. The n1 and n2 degrees of freedom are given by N1-1, respectively and N2-1, with N1 and N2 representing the total number of samples for the compared average prediction errors.
39.5.3. Significance of the Difference between the Outlier Ratios
As mentioned in paragraph 39.4.3, the outlier ratio could be described by a binomial distribution of parameters (p, 1-p), where p is defined by (12). In this case p is equivalent with the probability of success of the binomial distribution.
The distribution of differences of proportions from two binomially distributed populations with parameters (p1, 1-p1) and (p2, 1-p2) (where p1 and p2 correspond to the two compared outlier ratios) is approximated by a normal distribution for N1, N2 >30, with the mean:
(20)
and standard deviation:
Page 56 of 87

(21)
The null hypothesis in this case considers that there is no difference between the population parameters p1 and p2, respectively p1=p2. Therefore, the mean (20) is zero and the standard distribution (21) becomes equation (22)
(22)
where N1 and N2 represent the total number of samples of the compared outlier ratios p1 versus p2. The variable p is defined by (23)
(23)
References[1] M. Spiegel, “Theory and problems of statistics”, McGraw-Hill, 1998.
Page 57 of 87

40. RecommendationThe VQEG will recommend methods of objective video quality assessment based on the primary evaluation metrics defined in Section 39. The Study Groups involved (ITU-T SG 12, ITU-T SG 9, and ITU-R SG 6) will make the final decision(s) on ITU Recommendations.
Page 58 of 87

41. Bibliography- VQEG Phase I final report.
- VQEG Phase I Objective Test Plan.
- VQEG Phase I Subjective Test Plan.
- VQEG FR-TV Phase II Test Plan.
- Vector quantization and signal compression, by A. Gersho and R. M. Gray. Kluwer Academic Publisher, SECS159, 0-7923-9181-0.
- Recommendation ITU-R BT.500-10.
- document 10-11Q/TEMP/28-R1.
- RR/NR-TV Test Plan
Page 59 of 87

ANNEX IINSTRUCTIONS TO THE EVALUATORS
Notes: The items in parentheses are generic sections for a Evaluator Instructions Template. They would be removed from the final text. Also, the instructions are written so they would be read by the experimenter to the participant(s).
(greeting) Thanks for coming in today to participate in our study. The study’s about the quality of video images; it’s being sponsored and conducted by companies that are building the next generation of video transmission and display systems. These companies are interested in what looks good to you, the potential user of next-generation devices.
(vision tests) Before we get started, we’d like to check your vision in two tests, one for acuity and one for color vision. (These tests will probably differ for the different labs, so one common set of instructions is not possible.)
(overview of task: watch, then rate) What we’re going to ask you to do is to watch a number of short video sequences to judge each of them for “quality” -- we’ll say more in a minute about what we mean by “quality.” These videos have been processed by different systems, so they may or may not look different to you. We’ll ask you to rate the quality of each one after you’ve seen it.
(physical setup) When we get started with the study, we’d like you to sit here (point) and the videos will be displayed on the screen there. You can move around some to stay comfortable, but we’d like you to keep your head reasonably close to this position indicated by this mark (point to mark on table, floor, wall, etc.). This is because the videos might look a little different from different positions, and we’d like everyone to judge the videos from about the same position. I (the experimenter) will be over there (point).
(room & lighting explanation, if necessary) The room we show the videos in, and the lighting, may seem unusual. They’re built to satisfy international standards for testing video systems.
(presentation timing and order; number of trials, blocks) Each video will be (insert number) seconds (minutes) long. You will then have a short time to make your judgment of the video’s quality and indicate your rating. At first, the time for making your rating may seem too short, but soon you will get used to the pace and it will seem more comfortable. (insert number) video sequences will be presented for your rating, then we’ll have a break. Then there will be another similar session. All our judges make it through these sessions just fine.
(what you do: judging -- what to look for) Your task is to judge the quality of each image -- not the content of the image, but how well the system displays that content for you. The images come in three different sizes; how you judge image quality for the different sizes is up to you. There is no right answer in this task; just rely on your own taste and judgment.
(what you do: rating scale; how to respond, assuming presentation on a PC) After judging the quality of an image, please rate the quality of the image. Here is the rating scale we’d like you to use (also have a printed version, either hardcopy or electronic):
5 Excellent4 Good3 Fair2 Poor1 Bad
??TBDPlease indicate your rating by pushing the appropriate numeric key on the keyboard (button on the screen). If you missed the scene and have to see it again, press the XXX key. If you push the wrong key and need to
Page 60 of 87

change your answer, press the YYY key to erase the rating; then enter your new rating. [Note, this assumes that a program exists to put a graphical user interface (GUI) on the computer screen between video presentations. It should feed back the most recent rating that the evaluator had input, should have a “next video” button and an “erase rating” button. It should also show how far along in the sequence of videos the session is at present. The program that randomly chooses videos for presentation, records the data, and contains the GUI, should be written in a language that is compatible with the most commonly used computers.]
(practice trials: these should include the different size formats and should cover the range of likely quality) Now we will present a few practice videos so you can get a feel for the setup and how to make your ratings. Also, you’ll get a sense of what the videos are going to be like, and what the pace of the experiment is like; it may seem a little fast at first, but you get used to it.
(questions) Do you have any questions before we begin?
(evaluator consent form, if applicable; following is an example) The Multimedia Quality Experiment is being conducted at the (name of your lab) lab. The purpose, procedure, and risks of participating in the Multimedia Quality Experiment have been explained to me. I voluntarily agree to participate in this experiment. I understand that I may ask questions, and that I have the right to withdraw from the experiment at any time. I also understand that (name of lab) lab may exclude me from the experiment at any time. I understand that any data I contribute to this experiment will not be identified with me personally, but will only be reported as a statistical average.
Signature of participant Signature of experimenterName of participant Date Name of experimenter
Page 61 of 87

ANNEX IIEXAMPLE EXCEL SPREADSHEET
lab test typeevaluat
or # month day Year session resolution rate age gender order scene hrcacr
scorentia mm1 compression 1000 10 3 2005 1 vga 30 47 m 1 susie hrc1 4ntia mm1 compression 1000 10 3 2005 1 vga 30 47 m 1 susie hrc2 2ntia mm1 compression 1000 10 3 2005 1 vga 30 47 m 1 susie hrc3 1ntia mm1 compression 1000 10 3 2005 1 vga 30 47 m 1 susie reference 5ntt mm2 robust 2003 10 18 2005 2 cif 25 38 f 2 calmob pktloss1 1ntt mm2 robust 2003 10 18 2005 2 cif 25 38 f 2 calmob pktloss2 2ntt mm2 robust 2003 10 18 2005 2 cif 25 38 f 2 calmob biterror1 1ntt mm2 robust 2003 10 18 2005 2 cif 25 38 f 2 calmob biterror2 3ntt mm2 robust 2003 10 18 2005 2 cif 25 38 f 2 calmob reference 4
yonsei mm3 livenetwork 3018 10 21 2005 1 qcif 30 27 m 1 football ip1 4yonsei mm3 livenetwork 3018 10 21 2005 1 qcif 30 27 m 1 football ip2 3yonsei mm3 livenetwork 3018 10 21 2005 1 qcif 30 27 m 1 football reference 5
ANNEX IIIBACKGROUND AND GUIDELINES ON TRANSMISSION ERRORS
Introduction
Transmission errors should be created to emulate a real video service to ensure that the proponents’ models are trained and tested with realistic video material. There are three major types of transmissions used for video services today:
Packet switched radio network
This kind of transmission is typical for video service in so called 3G mobile networks. Examples of services are video streaming service, such as streaming news and sports video clips to a mobile phone, mobile TV and video shared in parallel with a normal speech call. The transmission errors are characterized by packet delays, which can be in the range of 10 ms to several seconds, and packet losses that could be massive (ranging from no losses to 50%). The packet delay might case packet to be dropped by the video client because they are received too late, or causing the buffer to run empty in the client. If the buffer runs empty it causes frame freezing (not currently included in the test plan). Packet losses will cause image artifacts in the video and possibly video frame jitter.
Page 62 of 87

Transport errors should be created by running a video streaming service over a real-time link simulator, where packets can be delayed in with a delay pattern as in a typical mobile radio network. The link simulator should also be able to drop packets. Typically packets are dropped when a buffer somewhere in the network is full, and new packets arriving at the buffer are dropped. This situation can occur when the link to the mobile has a lower bandwidth than required by the video stream.
Packet losses are normally bursty, causing the video quality to vary a lot. A short video streaming sequence might even be played with best possible quality, even if the bandwidth is limited. Therefore, video streaming sequences should be longer than 8 to 10 seconds. An 8 to 10 seconds video clip can be cut out from the longer video sequence, from the part where the transmission errors have caused the desired video quality degradation. Note also that the packet size is related to video quality degradation for a certain packet loss ratio.
Wireline Internet
Typical service is video streaming to a PC with fixed Internet connection. Network congestion causes packet losses in the network switches. Random and periodic packet loss can occur due to faulty equipment. However, bursty packet losses are the most common loss type. Packet loss ratio is in the range from 0% to 50%. Packets are delayed with delay ranging from 2 ms to several seconds.
Transmission errors should be created with a bursty packet loss model, as expected for Internet bottlenecks.
Circuit switched radio network
A typical service is video telephony. The transmission errors are characterized by bursty loss of data. Chunks of data (packets are not used in circuit switched transmission) are lost. Block (radio blocks) error rates are typically ranging from 0.2% to 5% when averaged over a couple of seconds. Momentarily the error rate can be 100%.
Transport errors should be created by applying error masks on a bit stream. Errors in the mask should have a bursty pattern to mimic a radio interface, such as a WCDMA 64 kbps circuit switched radio bearer. Note that the size of the blocks over the simulated transport link is correlated to video quality. Within limits the larger block size the better quality for a certain block error rate. Block size can for example be 160 or 300 bytes.
Summary of transmission error simulators
Transport link type
Model Typical error rates
Packet switched radio network
Link simulator delaying and dropping packages. Delay based on bit/block errors over a radio link. Drop based on overflow in a network buffer due to low bandwidth. The packet delay should be introduced as in a real radio network. Typical target networks are GSM, WCDMA or CDMA radio networks.
Packet delay in the range from 10 ms to 5 s.Bursty packet loss in the range 0% to 50% (for an average over one or a few seconds)
Page 63 of 87

Wireline Internet
Link simulator dropping packets, as expected when the buffer in an Internet switch overruns. As described in literature packet losses can be modeled with a Markov chain with two states representing no loss/loss. See for example [2] below for example of link model.
Packet delay in the range 2 ms to 5 seconds (high value when for example a satellite link Is used). Bursty packet losses in range from 0% to 50%
Circuit switched radio network
Link simulator dropping chunks of data. Alternative is to apply an error mask to a bit stream. The error mask should have been made by simulating a radio link. The bit stream should be a H.223 bit stream, which is used for video telephony. See reference [1] below.
Typical block error rates (over a radio link) are ranging from 0.2% to 5% (average over a couple of seconds)
Table 1 Summary of transmission error simulators
Note: A video service might use multiple transport links. Thus, it is possible to use a combination of simulators to get realistic transport errors. A combination of wireline and wireless IP link simulators can be used to simulate a service, such as video streaming over Internet and a radio link
Page 64 of 87

Logging parameters
Table 2 below describes the parameters to be logged when introducing transmission errors with a simulator. All parameters are required, except those explicitly described as “optional”.
Logging Category
Logging details
Simulator description
Type of simulator (packet simulator, circuit switched simulator) Simulated network (GSM/WCDMA/CDMA/Wireline Internet) Version of simulator Hardware/system it was run on General description of how transport errors are introduced
Input parameters to simulator (depends on type of simulator. Only examples given here)
Bandwidth limit System buffer size Block or bit error rates Latency
Output parameters from simulator
Packet simulator (wireline and wireless) Average packet loss ratio in percent Length of window to calculate packet loss ratio Number of total packets Average packet delay in ms Sequence number of lost packets (optional) Distribution of packet delay (optional) Packet size distribution (optional)
Circuit switched simulator Average block and/or bit error rate (BLER/BER) Block size over transport link Maximum block error rate
Decoder General description of decoder (name, vendor) Version of decoder Post filter used (if known) Error concealment used (if known)
Table 2 Parameters to be logged when introducing transmission errors
.
References
[1] ITU-T Recommendation H.223, Multiplexing protocol for low bit rate multimedia communication.[2] B. Girod, K. Stuhlmüller, M. Link and U. Horn. “Packet Loss Resilient Internet Video Streaming”.
SPIE Visual Communications and Image Processing 99, January 1999, San Jose, CA
Page 65 of 87

ANNEX IV
Fee and Conditions
VQEG intends to enable everybody who is interested in contributing to the work as a proponent to participate in the assessment of video quality metrics and to do so even if the proponent is not able to finance more than the regular participation fee as laid forth in this Annex (see below for details of the fees). On the other side VQEG will produce video databases which are extremely valuable to those developing video metrics. An organization cannot get access to these databases without, at a minimum, substantially participating in the VQEG work. VQEG has decided that all proponents must provide at least one database (or a comparable contribution) which fulfils the requirements laid out in this testplan in order to gain access to the subjective databases produced in the Hybrid tests. A comparable contribution should be agreed by the other proponents and could include such things as providing test sequences and/or running HRCs.If an organization has no facilities to create such a database by itself, it may contract a recognized subjective test facility to do so on its behalf. If an organization is lacking the financial resources to fulfil this obligation, it can ask other proponents or the ILGs to run its model on the VQEG databases. In this case the party will not be granted direct access to the video databases, but the party is still able to participate in the assessment of their models after paying the regular participation fee to the Independent Lab Group (ILG).
Page 66 of 87

ANNEX V??TBD
(Owner: Kjell Brunnstrom)
Subjective Test Software Package and Required Computer Specification
IntroductionThe program acrvqwin-beta2 is a program to run subjective experiments for video quality in Windows envi-ronment, using the ACR-method It is designed to present the video on a computer screen, using the picture sizes QCIF, CIF and VGA, synchronized with the refresh of the display. This is implemented using DirectX.
System RequirementsThe program uses a multithread function, so it requires a Intel based (AMD has not been tested) computer with two processors or a processor that supports multithreading. The CPU speed should be at least 2 GHz. The graphics card should support yuv to rgb conversion and have at least 256 MByte of video memory. The system should have primary memory of at least 512 MB. The program can be run on Windows 2000 and Windows XP.
Using the program
Installation and preparation
After downloading and extracting the files, the file acrvqwin-beta2.exe has to be placed in the same library as the five dll files: libmatlb, libmcc,libmx, libmat and libut libut (should be obtained together i.e in the same distribution, with the executable file, so versions of the dlls match the executable). The setup-file (setup.seq) can be placed anywhere as the program will let you specify the path at the start of the experiment. To be able to run the experiment program a setup-file, see also below, has to be used in order to set some of the para-meters in the program and also specify the path and name of the avi-files that should be used during the ex -periment. To specify your avi-files you write the filenames just below the path to the directory they are in. Each filename must be written on a separate row, as the program will treat each line of text as a filename.
Running the program
The program is started in the normal way in Windows e.g double-clicking on the icon. The program will ini -tially present a dialog box for selecting setup-file (this makes it possible to have different setup-files for vari -ous experiment stored at the same time) to use for the experiment.
After choosing the setup-file the program will enter the experiment environment, the screen will have the same grey-level as has been specified with the parameter Background. To start the first sequence you can either press the s button on the keyboard or the left button on the mouse and the video sequence will be dis -played at the centre of the screen. When the sequence is finished a dialog box will appear in order to get the evaluators rating of the perceived video quality. This procedure will continue until the experiment is done and the program will automatically exit. You can at any time quit the current experiment by pressing the Esc key.
The order of the sequences does not match the order of the filenames in the setup-file. The program random-ises the order at the start of the program. The random numbers are drawn from a uniform distribution. The results are stored in two output-files that have the same name as the parameter SubjectId with an extension of either log or dat. The log-file shows the results in the exact order as the sequences have been shown. The dat-file sorts the data regardless of the randomisation that has been done by the program, in order to make it easier to analyse the results from a statistical point of view. The data in the dat-file are stored in exactly the same order as in the setup-file.
Page 67 of 87

If the Esc key is being pressed during an experiment the program will store the necessary data in a .svd file to be able to restore the experiment later. The .svd file will be created in the folder specified by the parameter Path and have the filename specified by the parameter SubjectId. Next time the program starts it will ask you if you want to restore the aborted experiment and if selecting yes the experiment will continue from where it was aborted. If you don’t want the program to keep asking you if you want to restore an experiment, simply delete the .svd file.For mixing 25-fps and 30-fps sequences, the parameter ScreenRefreshFreq must be set to 60 Hz. The program will then run the 30-fps sequences as normal and try to run the 25-fps sequences as close to 25 fps as possible. As 60 is evenly divided by 30, each frame will be displayed two screen refresh cycles and the timing between the frames will be constant in the 30-fps sequences. This can’t be done with the 25-fps sequences and the solution applied in this program is to alternate between displaying a frame 2 or 3 screen refresh cycles. The program uses the serie: 2, 3, 2, 3, 2. In order to distinguish between the differences in framerate of the sequences the framerate parameter in the avi-file infoheader must be valid.
Setup-file parameters
PixelDepth: The only supported mode for this version is 16 bit with the format YUV 4:2:2
ScreenHeight: The height of the screen measured in pixels.
ScreenWidth: The width of the screen measured in pixels.
ScreenRefreshFreq: The update frequency of the screen.
VideoFrameRate: The number of frames shown per second.
Background: The grey-level of the background in the experiment environment, where 0 is black and 255 is white.
NumberOfSeries: This parameter is used to set how many times each sequence will be played.
UseImageRatings: Decides whether to use an image or text to describe the different ratings for the viewer.
ImagePathRatings: Specifies the path to the image if the parameter UseImageRatings is set to true.
ImagePathNoRating: Specifies the path to the image to be shown if UseImageRatings is set to true and the evaluator has missed to rate the sequence.
Rating5-Rating1: The text used to describe the different ratings if UseImageRatings is set to false.
NoRating: This text is shown if the evaluator misses to rate the sequence and UseImageRat-ings is set to false.
SubjectId: Specifies the filename for the .dat and .log file.
Page 68 of 87
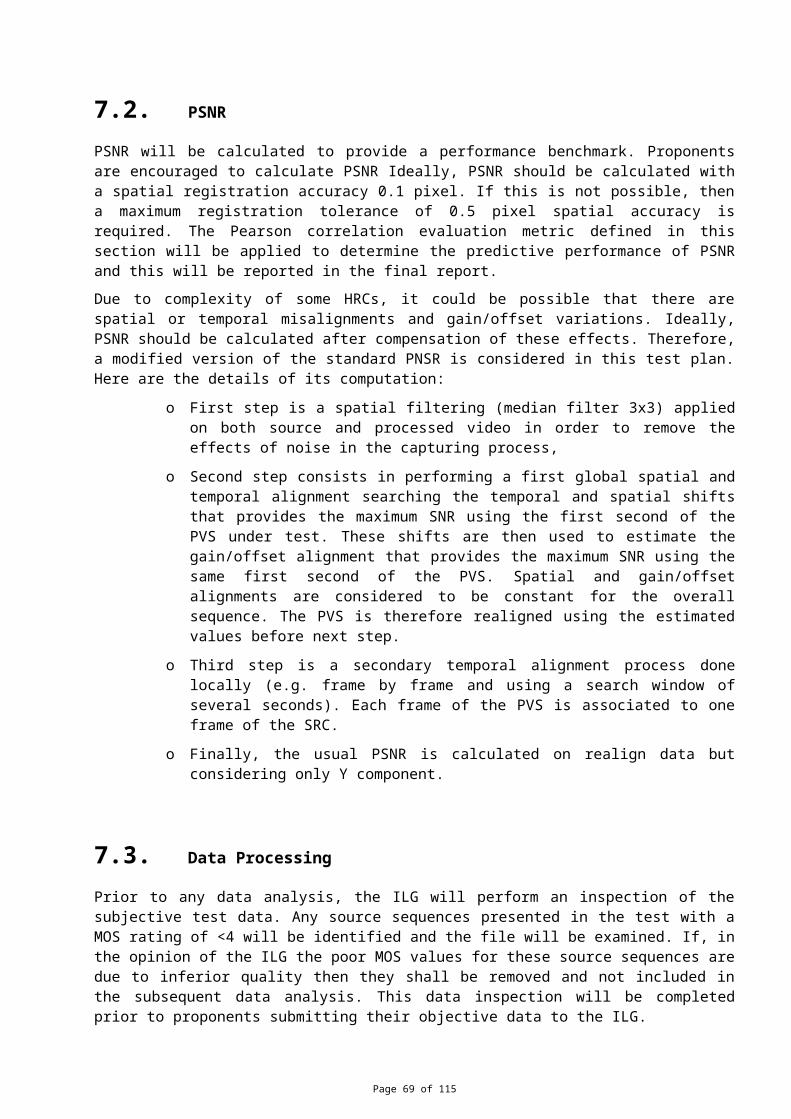
NoOfImagesInSeq: The number of frames that will be displayed from the avi-file. This parameter makes it possible to decide the length of the sequences from the setup-file.
Path: Specifies the path to the directory holding the avi-files to be used. The .dat and .log file will be placed here.
Example of a setup-file
[Sequence]PixelDepth = 16ScreenHeight = 1024ScreenWidth = 1280ScreenRefreshFreq = 60VideoFrameRate = 30Background = 128 NumberOfSeries =3UseImageRatings = FALSEImagePathRatings = "C:\MyPath\mybitmap1.bmp"ImagePathNoRating = "C:\MyPath\mybitmap2.bmp"Rating5 = "Excellent"Rating4 = "Good"Rating3 = "Fair"Rating2 = "Poor"Rating1 = "Bad"NoRating = "The sequence has not been rated"SubjectId = "Viewer"NoOfImagesInSequence = 300Path = "C:\MyPath"myavi1.avimyavi2.avimyavi3.avi
Note: Experimenter is required to change the ”SubjectId” for each evaluator in the MM test.
Term of usage
This software is provided as is. No warranty or support is given. It may be used within the VQEG for re -search purposes. Copyright 2005 Acreo AB, Sweden.
List of preferred LCD Monitors for use in subjective tests:
TCO ’06:
BenQ FP241W, FP241WZ, FP241VW Q24W5
EIZO FlexScan S2110W ColorEdge CE210W S2110W
Samsung 215TW DP21**
Page 69 of 87

TCO ‘03
Page 70 of 87

ANNEX VI
(Owner: Quan Huynh-Thu)
Method for Post-Experiment Screening of Evaluators
Method
The rejection criterion verifies the level of consistency of the raw scores of one viewer according to the corresponding average raw scores over all viewers. Decision is made using correlation coefficient. Analysis per PVS and per HRC is performed for decision.
Linear Pearson correlation coefficient per PVS for one viewer vs. all viewers:
Where
xi = MOS of all viewers per PVS
yi = individual score of one viewer for the corresponding PVS
n = number of PVSs
i = PVS index.
Linear Pearson correlation coefficient per HRC for one viewer vs. all viewers:
Where
xi = condition MOS of all viewers per HRC, i.e. condition MOS is the average value across all PVSs from the same HRC
yi = individual condition MOS of one viewer for the corresponding HRC
n = number of HRCs
i = HRC index
Page 71 of 87

Rejection criteria
1. Calculate r1 and r2 for each viewer
2. Exclude a viewer if (r1<0.75 AND r2 <0.8) for that viewer
Note: The reason for using analysis per HRC (r2) is that an evaluator can have an individual content preference that is different from other viewers, making r1 to decrease, although this evaluator may have voted consistently. Analysis per HRC averages out individual’s content preference and check consistency across error conditions.
xi = mean score of all observers for the PVS
yi = individual score of one observer for the corresponding PVS
n = number of PVSs
i = PVS index
R(xi or yi) is the ranking order
Final rejection criteria for discarding an observer of a test
The Spearman rank and Pearson correlations are carried out to discard observer(s) according to the following conditions:ANNEX VII
Encrypted Source Code Submitted to VQEG
Proponents are entitled to submit a file with encrypted source code along with their model’s object code. This submission is not required but is offered in case there is a bug in the software that can be fixed without changing the algorithm. Normally, there would be no software updates possible after the submission of the object code.
In order for this option to be exercised the proponent must encrypt the source code with a readily available encryption program (see below for a freeware example) and send the password protected file to two ILG labs (CRC and Acreo). If it is determined by the proponent that a bug is present in the software, then the proponent must discuss the situation with the ILG Co-Chairs. If the Co-Chairs agree that a bug fix should be tried, then a procedure must be agreed to in order for the proponent to make the change to the code in the presence of the ILG member. This could be done in person or perhaps by telephone.
The proponent would make the change and the ILG member would verify that it was not an algorithm change. The code would be recompiled and tested in the presence of the ILG member. The revised code should be re-encrypted with a different password.
The encrypted file can be transported electronically or physically. It needs to be sent to both ILG contacts below:
ILG contacts:
Page 72 of 87

Kjell Brunnstrom
Acreo
Stockholm, Sweden
+4686327732
Filippo Speranza
CRC
Ottawa, Canada
+1 613-998-7822
A good freeware encryption program:
Blowfish Advanced CS 2.57
http://www.hotpixel.net/software.html (click on Blowfish Advanced CS – Installer)
This software offers several encryption algorithms. The one that allows the largest key (448 bits) is Blowfish. It is also in German and English.
Source files should be zipped and then encrypted.
Other encryption programs can be used but if they are not free then the proponent is responsible for purchasing the program for the ILG if necessary.
Page 73 of 87

ANNEX VIII
Approved Conversion Tools
Transformation of source test sequences to UYVY AVI files
Transformation of the source test sequences as described in chapter 6.1 (e.g., from Rec. 601 525-line to QCIF) shall be performed using the following tools:
Tool Web Resources
Avisynth 2.5.5 http://www.avisynth.org/
AviSynth Filters(RawSource, KernelDeint)
http://www.avisynth.org/warpenterprises/
VirtualDub 1.6.11 http://www.virtualdub.org/
ffdshow 20050303 http://ffdshow.sourceforge.net/
For loading a sequence in raw uncompressed UYVY 4:2:2 format (as the VQEG format, see FRTV Phase I video file examples at ftp://vqeg.its.bldrdoc.gov/SDTV/VQEG_PhaseI/TestSequences/) the “Raw-Source” plugin for AviSynth is used. The sequences are opened with the "UYVY" mode.
De-interlacing will be performed according chapter 6.1.4 using the de-interlacing AviSynth plugin “Ker-nelDeint”. If the de-interlacing using KernelDeint results in source sequence that has serious artifacts, the Blendfield or Autodeint may be used as alternative methods for de-interlacing.
Cropping and Rescaling is done according chapter 6.1.5, using AviSynth build-in “LanczosResize” function.
The following script can be used as a template for the the transformations. See the Avisynth documentation for detailed information on what each command does.
# This function limits the memory space (in MB) used by the script (should be used)SetMemoryMax(100)
# The RawSource plugin loads raw YUV 4:2:2, 4:2:0, etc. videosRawSource("c:\calmob.yuv",720,486,"UYVY")
# AssumeFPS() forces the framerate of the video.AssumeFPS(30)
# DeinterlacingKernelDeint(order=0)
# Croppingcrop(36,3,-38,-3)
# ResizingLanczosResize(176,144)
The scripts are saved using the extension “.avs” and then loaded into VirtualDub (File->OpenVideoFile).
Within VirtualDub, video sequences will be saved to AVI files using Video Compression option (Video->Compressor) "ffdshow Video Codec", configured with the "Uncompressed" decoder and the UYVY color space. For the Color Depth (Video->Color Depth), the setting “4:2:2 YCbCr (UYUV)” is used as output format. The processing mode (Video->) is set to “Full processing mode”.
Page 74 of 87

The tools and scripts may be downloaded at:Tools/Approved/ directory on ftp://[email protected]/
AviSynth Scripts for the common transformations
PAL to QCIFSetMemoryMax(100)RawSource("c:\calmob.yuv",720,576,"UYVY")AssumeFPS(25)KernelDeint(order=1)crop(38,0,644,576)LanczosResize(176,144)
PAL to CIFSetMemoryMax(100)RawSource("c:\calmob.yuv",720,576,"UYVY")AssumeFPS(25)KernelDeint(order=1)crop(8,0,702,576)LanczosResize(352,288)
PAL to VGASetMemoryMax(100)RawSource("c:\calmob.yuv",720,576,"UYVY")AssumeFPS(25)KernelDeint(order=1)crop(38,0,644,576)LanczosResize(640,480)
NTSC to QCIFSetMemoryMax(100)RawSource("c:\calmob.yuv",720,486,"UYVY")AssumeFPS(30)KernelDeint(order=0)crop(36,3,-38,-3)LanczosResize(176,144)
NTSC to CIFSetMemoryMax(100)RawSource("c:\calmob.yuv",720,486,"UYVY")AssumeFPS(30)KernelDeint(order=0)crop(36,3,-38,-3)LanczosResize(352,288)
NTSC to VGA
SetMemoryMax(100)RawSource("c:\calmob.yuv",720,486,"UYVY")AssumeFPS(30)KernelDeint(order=0)crop(8,3,704,480)LanczosResize(640,480)
HD720 to QCIFSetMemoryMax(100)RawSource("c:\calmob.yuv",1280,720,"UYVY")AssumeFPS(30)crop(200,0,880,720)LanczosResize(176,144)
HD720 to CIFSetMemoryMax(100)RawSource("c:\calmob.yuv",1280,720,"UYVY")AssumeFPS(30)crop(200,0,880,720)
Page 75 of 87

LanczosResize(352,288)
HD720 to VGASetMemoryMax(100)RawSource("c:\calmob.yuv",1280,720,"UYVY")AssumeFPS(30)crop(160,0,960,720)LanczosResize(640,480)
HD1080 to QCIFSetMemoryMax(100)RawSource("c:\calmob.yuv",1920,1080,"UYVY")AssumeFPS(30)KernelDeint(order=1)crop(300,0,1320,1080)LanczosResize(176,144)
HD1080 to CIFSetMemoryMax(100)RawSource("c:\calmob.yuv",1920,1080,"UYVY")AssumeFPS(30)KernelDeint(order=1)crop(300,0,1320,1080)LanczosResize(352,288)
HD1080 to VGASetMemoryMax(100)RawSource("c:\calmob.yuv",1920,1080,"UYVY")AssumeFPS(30)KernelDeint(order=1)crop(240,0,1440,1080)LanczosResize(640,480)
UYVY Raw to UYVY AVIThese tools convert raw uncompressed UYVY 4:2:2 files to uncompressed UYVY AVI files. The following
tools are available:
AviSynth,VirtualDub, ffdshowUse the procedure described in “Transformation of source test sequences to UYVY AVI files” without
performing the cropping and resizing step within the AviSynth script.
The following tools are not approved in the MM test plan:
SwissQualTools/SwissQual/Conversion_Tools/UYVYIntoAVI/ directory on ftp://[email protected]/
NTIAThe “Laboratory VQM” tool available from NTIA has this capability. The UYVY AVI output file is limited
to 2GB (AVI Version 1.0). This tool may be obtained at:
http://www.its.bldrdoc.gov/n3/video/vqmsoftware.htm
UYVY Raw to RGB AVIThese tools convert raw uncompressed UYVY files to uncompressed RGB AVI files. The following tools are
available:
AviSynth,VirtualDub
Page 76 of 87

Use the procedure described in “Transformation of source test sequences to UYVY AVI files” without performing the cropping and resizing step within the AviSynth script and save the file as described next.
Within VirtualDub, video sequences will be saved to AVI files using Video Compression option (Video->Compressor) "Uncompressed RGB/YCbCr". For the Color Depth (Video->Color Depth), the setting “24 bit RGB (888)” is used as output format. The processing mode (Video->) is set to “Full processing mode”.
The following tool is not approved in the MM test plan:
SwissQualTools/SwissQual/Conversion_Tools/UYVYToAVI/ directory on ftp://[email protected]/
RGB AVI to UYVY AVI
These tools convert uncompressed RGB AVI files to uncompressed UYVY AVI files using the agreed color space conversion in section 6.1.3. The following tools are available:
VirtualDub, ffdshowThe RGB Avi file will be loaded into VirtualDub (File->OpenVideoFile) and then saved according the
following steps.
Within VirtualDub, video sequences will be saved to AVI files using Video Compression option (Video->Compressor) "ffdshow Video Codec", configured with the "Uncompressed" decoder and the UYVY color space. For the Color Depth (Video->Color Depth), the setting “4:2:2 YCbCr (UYUV)” is used as output format. The processing mode (Video->) is set to “Full processing mode”.
The following tool is not approved in the MM test plan:
SwissQualTools/SwissQual/Conversion_Tools/RGBtoYUV/ directory on ftp://[email protected]/
Processing and Editing Sequences
Two capture methods have been approved and descried in chapter 6.3.9. The tools will intercept RGB video being sent to a computer monitor and saves this video to an uncompressed AVI file.
SwissQualFree demonstration system for capturing streaming media (the full version can be bought from SwissQual):
Tools/SwissQual/Capturing/ directory on on ftp://[email protected]/
The full system is capable of capturing QuickTime, Real Media, and Windows Media streams and includes a Media Server. The tool captures the image shown on the monitor, or more precisely from the memory (space) that Windows sends to the graphics card. A frame is captured only if new data is available. That is why there is a file created that contains the variable frame rate information. Please see:
Tools/SwissQual/VQEG_SQ_Capturing_Sequences_V2.pdf on ftp://[email protected]/
Page 77 of 87

To meet the desired VQEG file format definitions, the captured video data must be converted to constant frame rate and from RGB to YUV. These conversions are already implemented in the full version of the capturing tools.
Please contact Pero Juric ([email protected]) for any further information.
NTTPIFREC 1.0 (Lossless PC Video & Voice Recorder). The PC capture system uses a capture board to receive
the signals passed from a PC to its monitor, without adding any processing load to the PC, and stores them while retaining high video quality.
More Information about PIFREC can be found at: http://www.ntt-at.com/products_e/pifrec/index.html
Please contact Mr. Takawo Adachi ([email protected]) for any further information.
The following tool is not approved in the MM test plan:
LinuxThese capture tools consist of a set of Linux system libraries that hijack the output of various players. The
captured video data as well as a file with time stamps is saved to the disk. The tools developed by Marcus Barkowski from the University of Erlangen are available at this location:
Tools/playout_capure.tgz on ftp://[email protected]/
CalibrationThese tools verify that the processed video sequences meet the calibration limits (e.g., temporal shifts, spatial
shifts, spatial scaling, gain and level offset) specified by the test plan.
The following tool is not approved in the MM test plan:
NTIAThe “Laboratory VQM” tool available from NTIA has the ability to estimate spatial registration, temporal
registration, and gain/level offset. This tool may be obtained at:
http://www.its.bldrdoc.gov/n3/video/vqmsoftware.htm
UYVY Decoder to UYVY Raw / UYVY AVIThis tool intercepts UYVY video from a video decoder (before being converted to RGB for monitor display)
and saves this video to a UYVY Raw or UYVY AVI file.
The following tools are not approved in the MM test plan:
The following video decoders output some form of uncompressed YUV video and hence RGB color space conversions can be avoided:
Tool Web Resources Output Format
MPEG-2 Reference Codec www.mpeg.org Outputs YUV 4:2:2 and YUV 4:2:0
Page 78 of 87

MainConcept MPEG-2 Codec www.mainconcept.com Since the MainConcept decoder is a DirectShow filter, its output can be an AVI file. DirectShow filter outputs a range of YUV formats in addition to RGB.
H.264 (AVC) Joint Video Team (JVT) Reference Codec
Outputs YUV 4:2:0
MainConcept H.264 codec www.mainconcept.com Outputs a range of YUV formats
Notes
VirtualDub is also capable of saving UYVY AVI files without using ffdshow. The following settings are used to get correct results.
The following procedure is not approved in the MM test plan:
Within VirtualDub, video sequences will be saved to AVI files using Video Compression option (Video->Compressor) "Uncompressed RGB/YCbCr". For the Color Depth (Video->Color Depth), the setting “4:2:2 YcbCr (UYUV)” is used as output format. The processing mode (Video->) is set to “Full processing mode”.
Page 79 of 87

ANNEX IX
Definition and Calculating Gain and Offset in PVSs
Before computing luma (Y) gain and level offset, the original and processed video sequences should be temporally aligned. One delay for the entire video sequence may be sufficient for these purposes. Once the video sequences have been temporally aligned, perform the following steps.
Horizontally and vertically cropped pixels should be discarded from both the original and processed video sequences.
The Y planes will be spatially sub-sampled both vertically and horizontally by the following factors: 16 for VGA, 8 for CIF and 4 for QCIF. This spatial sub-sampling is computed by averaging the Y samples for each block of video (e.g., for VGA one Y sample is computed for each 16 x 16 block of video). Spatial sub-sampling should minimize the impact of distortions and small spatial shifts (e.g., 1 pixel) on the Y gain and level offset calculations.
The gain (g) and level offset (l) are computed according to the following model:
(1)
where O is a column vector containing values from the sub-sampled original Y video sequence, P is a column vector containing values from the sub-sampled processed Y video sequence, and equation (1) may either be solved simultaneously using all frames, or individually for each frame using least squares estimation. If the latter case is chosen, the individual frame results should be sorted and the median values will be used as the final estimates of gain and level offset.
Least square fitting is calculated according the following formula:
g = ( ROP – RORP )/( ROO – RORO ), and (2)
l = RP - g RO (3)
where ROP, ROO, RO and RP are:
ROP = (1/N) O(i) P(i) (4)
ROO = (1/N) [O(i)]2 (5)
RO = (1/N) O(i) (6)
RP = (1/N) P(i) (7)
Page 80 of 87
APPENDIX ITerms of Reference of Hybrid Models
Editorial History
Version Date Nature of the modification
0.0 June 24, 2009 Initial Draft, edited by C. Schmidmer
1.0 June 24,2009 Approved at the Berlin meeting
Page 81 of 87

42. OverviewThis document defines the terms of reference for hybrid video quality estimation models to be evaluated by VQEG. The document describes the targeted application areas, the basic operational principle of such hybrid models and it clarifies the relation to other ongoing standardization activities within the ITU.
The intention of this document is to give a brief overview on the project, while the details will be covered in separate testplan. In case of doubt, the specifications in the testplan supersede those in this document.
Page 82 of 87

43. Terms of Reference – Hybrid models
43.1. Objectives and Application Areas
The objective of the hybrid project is to evaluate models that estimate the perceived video quality of short video sequence. The estimation shall be based on information taken from IP headers, bitstreams and the decoded video signal. Additionally, source video information may be used for some models. The bitstream demultiplexers are not part of the tested models. Decoded signals (PVS) along with bit-stream data will be inputs to the hybrid models. Models which do not make use of these decoded signals (PVS) will not be considered as Hybrid Models.
The idea is that such models can be implemented in set top boxes, where all these parameters are available.
The tested models shall be applicable for troubleshooting and network monitoring at the client side as well as in the middle of a network, provided that a separate decoder provides decoded signals.
Typical applications may include IPTV and Mobile Video Streaming STB/
Terminal(decoder)
DISPLAYbit-stream data
Hybrid NR (use signals,codec parameters, transmission information)
PVS
VQM
Figure. Model application at STB (set top box) or mobile terminal.
43.1.1. Model Types NR/RR/FR
Model types submitted for evaluation may comprise no-reference (NR), reduced reference (RR) as well as full reference (FR) methods.
43.1.2. Target Resolutions
Video resolutions under study will be QVGA and SD/HDTV. A model for SDTV must also handle HDTV and a model for HDTV must also handle SDTV. A proponent may submit different models for QVGA and SD/HDTV or a model for either QVGA or SD/HDTV.
Page 83 of 87

43.1.3. Target Distortions
The models shall be able of handling a wide range of distortions, from coding artifacts to transmission errors such as packet loss. Coding schemes which are currently discussed for use in this study are MPEG2 (SD) and H.264 (QVGA, SD, HD). The packet loss ratio ranges from ?? to ??TBD.
43.1.4. Model Input
Input to the models will be:
The source video sequence (Hybrid FR and Hybrid RR (headend) models only) Edit note:?? Clarification will be needed
Bitstreams (may be encrypted??TBD) which include, but are not limited to:
o transport header information
o Payload information
The decoded video sequence (PVS)
A reference decoder will be provided, which will be used to determine the admissibility of bit-stream data. The model should be able to handle the bit-stream data which can be decoded by the reference decoder. Multiple decoders/players can be used to generate PVSs as long as the decoders can handle the bit-stream data which the reference decoder can decode. Bit-stream data can be generated by any encoder as long as the reference decoder can decode the bit stream data.
43.1.5. Results
Models submitted for this benchmark shall make use of an 11-point MOS scale (0=worst, 10=best). This definition is to avoid numerical problems only. A mapping function will be used for each model to map its results to each subjective database separately.
43.1.6. Model Validation
The scores produced by the models will be compared to MOS scores achieved by subjective tests. The validation data will only be available to the proponents after the models have been submitted
43.1.7. Model Disclosure
One clear objective of VQEG is that the benchmark shall lead to the standardization of one or more of the tested models by standardization organizations (e.g. ITU). This may involve the need for each proponent to fully disclose its model when it is accepted for standardization.
43.1.8. Time Frame
The benchmark is expected to be conducted in …..
Page 84 of 87
43.2. Relation to other Standardization Activities [??TBD, scope]
It is known that the ITU groups conduct work in a similar field with the standardization activities for P.NAMS and P.BNAMS. The VQEG Hybrid project does not intend to compete with projects in ITU-T SG9, ITU-T SG12, and ITU-R WP6C and does not intend to duplicate their work. ??The distinction to these two recommendations is that the Hybrid project makes use of the same information as the ITU-T SG12 projects, but additionally uses the decoded video sequence.
In fact, parts of the P.NAMS and P.BNAMS models may optionally form part of a proposed hybrid model.
Page 85 of 87

ANNEX IIIEXAMPLE INSTRUCTIONS TO THE SUBJECTS
Notes: The items in parentheses are generic sections for a Subject Instructions Template. They would be removed from the final text. Also, the instructions are written so they would be read by the experimenter to the participant(s).
(greeting) Thanks for coming in today to participate in our study. The study’s about the quality of video images; it’s being sponsored and conducted by companies that are building the next generation of video transmission and display systems. These companies are interested in what looks good to you, the potential user of next-generation devices.
(vision tests) Before we get started, we’d like to check your vision in two tests, one for acuity and one for color vision. (These tests will probably differ for the different labs, so one common set of instructions is not possible.)
(overview of task: watch, then rate) What we’re going to ask you to do is to watch a number of short video sequences to judge each of them for “quality” -- we’ll say more in a minute about what we mean by “quality.” These videos have been processed by different systems, so they may or may not look different to you. We’ll ask you to rate the quality of each one after you’ve seen it.
(physical setup) When we get started with the study, we’d like you to sit here (point) and the videos will be displayed on the screen there. You can move around some to stay comfortable, but we’d like you to keep your head reasonably close to this position indicated by this mark (point to mark on table, floor, wall, etc.). This is because the videos might look a little different from different positions, and we’d like everyone to judge the videos from about the same position. I (the experimenter) will be over there (point).
(room & lighting explanation, if necessary) The room we show the videos in, and the lighting, may seem unusual. They’re built to satisfy international standards for testing video systems.
(presentation timing and order; number of trials, blocks) Each video will be (insert number) seconds (minutes) long. You will then have a short time to make your judgment of the video’s quality and indicate your rating. At first, the time for making your rating may seem too short, but soon you will get used to the pace and it will seem more comfortable. (insert number) video sequences will be presented for your rating, then we’ll have a break. Then there will be another similar session. All our judges make it through these sessions just fine.
(what you do: judging -- what to look for) Your task is to judge the quality of each image -- not the content of the image, but how well the system displays that content for you. There is no right answer in this task; just rely on your own taste and judgment.
(what you do: rating scale; how to respond, assuming presentation on a PC) After judging the quality of an image, please rate the quality of the image. Here is the rating scale we’d like you to use (also have a printed version, either hardcopy or electronic):
Please indicate your rating by adjusting the cursor on the scale accordingly.
(practice trials: these should include the different size formats and should cover the range of likely quality) Now we will present a few practice videos so you can get a feel for the setup and how to make your ratings. Also, you’ll get a sense of what the videos are going to be like, and what the pace of the experiment is like; it may seem a little fast at first, but you get used to it.
Page 86 of 87
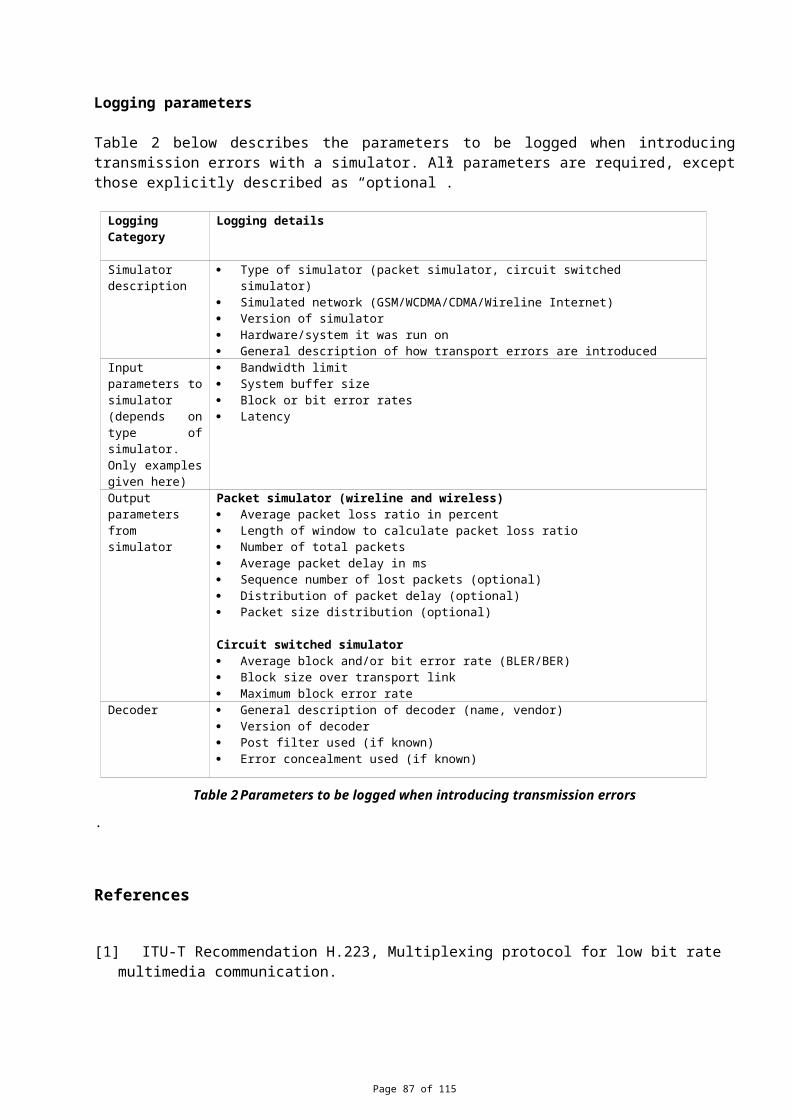
(questions) Do you have any questions before we begin?
(subject consent form, if applicable; following is an example) The HDTV Quality Experiment is being conducted at the (name of your lab) lab. The purpose, procedure, and risks of participating in the HDTV Quality Experiment have been explained to me. I voluntarily agree to participate in this experiment. I understand that I may ask questions, and that I have the right to withdraw from the experiment at any time. I also understand that (name of lab) lab may exclude me from the experiment at any time. I understand that any data I contribute to this experiment will not be identified with me personally, but will only be reported as a statistical average.
Signature of participant Signature of experimenterName of participant Date Name of experimenter
Page 87 of 87