norwegian university of science and technology - ntnu reports... · norwegian university of science...
TRANSCRIPT

Norwegian University of Science and Technology Faculty of Information Technology, Mathematics and Electrical Engineering Master of Science
Faculty of Information Technology, Mathematics and Electrical Engineering Address: Gamle Fysikk, Sem Sælands vei 5, 7034 Trondheim, tel: 73594202, www.ime.ntnu.no
MSc – Ph.D.
JOURNAL FROM 1ST SEMESTER PROJECT FALL 2010 TET4190 Power Electronics with Renewable Energy
Group 10
Point-to-point and multi-terminal HVDC
by
Lio, Ståle Morstad, Anders Nygård, Martin Taxt, Henning

Norwegian University of Science and Technology Faculty of Information Technology, Mathematics and Electrical Engineering Master of Science
NTNU takes no responsibility for the results and conclusions in this student journal
Faculty of Information Technology, Mathematics and Electrical Engineering
JOURNAL FROM 1ST SEMESTER PROJECT FALL 2010
Course: TET4190 Title: Power Electronics with Renewable Energy The journal is a part of the evaluation result for the course
Project group: Group 10 Availability: Open
Group participants: Lio, Ståle Morstad, Anders Nygård, Martin Taxt, Henning
Mentor: Haileselassie, Temesgen Censor: Undeland, Tore M.
Summary: This report presents the results from a mini project in the course Power Electronics at NTNU. The objective is to get a better understanding of HVDC power transmission with respect to different transmission methods. The HVDC technology has evolved over more than 100 years, and today thyristor based and VSC-based HVDC technologies are most common. Thyristor based HVDC is best suited for point-to-point HVDC transmission, while VSC-based HVDC is more useful in multi-terminal systems. The electrification of the Norwegian offshore industry may require the use of VSC-HVDC transmission, because the VSC technology enables a connection between Norway and the United Kingdom via the Ekofisk oil field, for instance. Simulations of the thyristor based and VSC-based HVDC technologies shows that the VSC can control the voltage and current independently and therefore produce or consume reactive power to the extent needed to control the AC voltage, while the thyristor based cannot.
It is evident that the HVDC technology will develop further as the focus on the environment and energy stability is becoming more and more important. HVDC transmission will contribute to reductions in greenhouse gas emissions by transferring renewable power at very long distances, making it less necessary to rely on power production from polluting technologies.

Norwegian University of Science and Technology Table of contents
Group 10 3
TABLE OF CONTENTS Table of contents .................................................................................................................. 3
1 Introduction ..................................................................................................................... 4
2 Ekofisk .............................................................................................................................. 5
3 HVDC history .................................................................................................................. 6
3.1 HVAC vs. HVDC .................................................................................................................................. 6
4 Energy and environment ................................................................................................ 7
4.1 Electrification of the Norwegian offshore industry ............................................................................ 7 4.2 SuperSmart Grid .................................................................................................................................. 7
5 Conventional thyristor-based HVDC ............................................................................ 8
5.1 Commutation ......................................................................................................................................... 8 5.2 Reactive Power Consumption .............................................................................................................. 8 5.3 Point-to-point......................................................................................................................................... 9 5.4 For larger power ratings ...................................................................................................................... 9
6 HVDC with Voltage Source Converter ....................................................................... 10
6.1 Topology of VSC-HVDC .................................................................................................................... 10 6.2 Control of Voltage Source Converters .............................................................................................. 11 6.3 Multi-terminal VSC-HVDC ............................................................................................................... 11
7 Two scenarios of HVDC transmission ......................................................................... 13
7.1 Thyristor HVDC transmission to the United Kingdom ................................................................... 13 7.1.1 Experience from work with HVDC projects ............................................................................... 14
7.2 VSC-HVDC transmission to Ekofisk ................................................................................................ 15 7.2.1 Energy demands .......................................................................................................................... 16 7.2.2 Converter modules and cables ..................................................................................................... 16
8 Simulations ..................................................................................................................... 19
8.1 Models .................................................................................................................................................. 19 8.2 Measurements of harmonics .............................................................................................................. 19 8.3 Simulation of active power step ......................................................................................................... 20
9 Concluding remarks ...................................................................................................... 21
References ........................................................................................................................... 22

Norwegian University of Science and Technology 1 Introduction
Group 10 4
1 INTRODUCTION This report presents the results from a mini project in the course Power Electronics at the Norwegian University of Science and Technology. The objective of the mini project is to get a better understanding of High Voltage Direct Current (HVDC) power transmission with respect to different transmission methods.
In Norway there has for some time been a focus on connecting Norway to the European power-grid. The large amount of hydro-power and storage capacity in Norway, constitutes a large advantage compared to the thermal power-based European energy market. These days, Statnett is planning HVDC-lines to several countries on the continent, such as the United Kingdom (UK). Related to this a scenario with point-to-point thyristor-based HVDC between Norway and the UK will be presented.
Electrification of the offshore industry is another hot topic. Our idea is to combine this with interconnection with other countries by presenting a scenario of a multi-terminal HVDC-connection with voltage source converter (VSC) from Norway to the UK, via the Ekofisk complex. This way the total cost of the two projects may be reduced, and the technology in addition allows connection from other sources or consumers in the future, such as offshore wind power farms.
The journal begins with an orientation of Ekofisk and electrification of the offshore industry, followed by the background for interconnections between different countries and offshore platforms. The basics of the two HVDC technologies are introduced with topologies and advantages, before a description of the two different transmission scenarios are presented. The end of the journal deals with the results from simulations of the two technologies performed in PSCAD, followed by a closure with concluding remarks.

Norwegian University of Science and Technology 2 Ekofisk
Group 10 5
2 EKOFISK The Ekofisk field was discovered in 1969 and the first oil was produced in 1971 as the first in Norway. The field is located nearly 300 km southwest of Stavanger and is operated by ConocoPhillips. Over the years the field has been through major expansions and old installations has been replaced by new and more efficient ones. The center of the Ekofisk field is mainly called the Ekofisk-center, with its surrounding platforms like Eldfisk, Cod, Albuskjell, Vest Ekofisk, Tor, Edda and Embla. In 2008 it was estimated that Ekofisk field still contains 791 million barrels of oil. [1][2]
Most of the emissions of climate-gasses from Ekofisk occur due to production of energy to supply the platforms. One of the most energy demanding processes at the field is to produce and compress injection-water to the wells. This process alone constitutes 30 % of the total CO2 emissions. Over the years it has been developed new technology to reduce the emission of climate-gasses such as CO2 and NOX. Comprehensive effort has made the processes more efficient and considerably lowered the emissions. In the period 1990-2010 the emissions of CO2 from the entire field has been decreased from approximately 2 500 000 to 1 000 000 tons per year. [2]
The energy-production at the Ekofisk-center mainly takes place on the two platforms Ekofisk 2/4 J and Ekofisk 2/4 K. The energy is produced by gas turbines which supply operations like gas compression, water injection and generation of electric power. Ekofisk 2/4 J has today six gas-turbines with a capacity of 59.5 MW each. Two of them provide generators which produce electric power and the other 4 turbines directly supply gas compressors. Ekofisk 2/4 K has three gas-turbines which drive water injection-pumps. The electric power is normally supplied by the 2/4 J platform but 2/4 K also contains three electric generators as reserve. The electric power is distributed through the platforms by subsea cables. [2]
The platforms outside the Ekofisk-center supply themselves with energy. As an example Eldfisk 2/7 E has a steam-turbine for production of electric power. This facility can produce around 10 MW, and supplies itself and the surrounding platforms Eldfisk 2/7 A, Eldfisk 2/7 FTP and the unmanned platform Embla. The platform Tor is self-contained with electric power through three diesel-engines which drive three generators with a capacity of 0.55 MW each. [2][3]
The total amount of energy produced at Ekofisk today is 902.5 MW. The Ekofisk field will remain self-contained with today`s solutions. With use of best available technology (BAT) the power-production at the Ekofisk-center is very effective. But there are constantly worked on studies and discussions of alternating power supplies like electrification. [2][3]
Norwegian University of Science and Technology 3 HVDC history
Group 10 6
3 HVDC HISTORY The first HVDC systems used to transmit electric power were put into service in the 1880’s. These systems used series-connected motor-generator sets, insulated from ground and driven by insulated shafts from a prime mover. This system was developed by René Thury, a Swiss engineer, and was in operation until the 1930’s. An example is the Moutiers-Lyon system, transmitting 8600 kW over a distance of approximately 200 km, where approximately 10 km was underground cable. Because of high maintenance costs and energy loss in the rotating machinery, this HVDC system was replaced by the grid controlled mercury arc valve. [4][5]
The grid controlled mercury arc valve was replaced by the fully static mercury arc valve. The first experimental transmission line of this type was installed in Russia, transporting electric power at 200 kV between Moscow and Kasira, a distance of 116 km. The first commercial system of this type was introduced in 1954 with a 98 km subsea cable with ground return between Västervik on the Swedish mainland, to Ygne on the island Gotland. The fully static mercury arc valve system was common in new HVDC installations until the late 1960’s, when thyristors were applied to HVDC transmission.
Between 1975 and 2000, line-commutated converters (LCC) with thyristor valves have been the main technology in use. In the latter years, technologies based on VSC’s have been introduced, creating more possibilities for HVDC power transmission. [6]
In 1998, the highest functional DC voltage for power transmission was +/- 600 kV for a distance of 785 km from Itaipu in Brazil. Today, DC transmission voltages can come up to +/- 800 kV. [7]
3.1 HVAC vs. HVDC
The major advantage of HVDC over HVAC (High Voltage Alternating Current) is the ability to transmit power over long distances at lower costs. In theory, HVAC can have the same transmission losses as a HVDC installation, but it will require large cross-sectional area of the AC conductors making the installation very expensive. [7]
In overhead line installations, DC installation can be made cheaper than AC installation per unit length, but the DC-to-AC converter stations at the end of the lines are very expensive compared to the AC terminating stations. Hence, there is a break-even distance where DC and AC installations will be equal in cost, but this distance is individual for each project. Above the break-even distance, HVDC is always cheaper, and in subsea cables the break-even distance is normally approximately 50 km. The reason for this short break-even distance is the relatively high reactive power flow in AC cables. [7][8]
HVDC conversion is also necessary when synchronizing two AC networks with different frequencies, like in Japan and South America where the frequency is either 50 Hz or 60 Hz. [8]

Norwegian University of Science and Technology 4 Energy and environment
Group 10 7
4 ENERGY AND ENVIRONMENT HVDC power transmission enables countries like Norway to directly interconnect their electric grid via subsea cables with for instance Denmark and Holland, making it possible to sell and buy power in an easy way. As an example, the NorNed cable generated revenues of approximately 50 million euro during its first two months of operation, recovering 8 % of the total cable costs [9]. Norway has currently HVDC connections to Denmark via three cables and as mentioned, one cable to Holland. A large amount of the energy production in these two countries comes from wind energy, and this renewable energy production is being expanded continuously. In periods with little wind there will be a high demand for supply of power from other sources, like Norwegian hydro power transported through HVDC cables. Because of this, the HVDC connections Skagerrak IV and NorNed II are being planned, in addition to HVDC connections to Germany and the United Kingdom. It is evident that interconnecting the European electricity grid will improve the power transmission reliability and in Norway’s case be of a financial advantage.
4.1 Electrification of the Norwegian offshore industry
The Norwegian government has a goal of reducing Norway’s CO2 emissions, and the main contributor to CO2 emissions by the Norwegian offshore industry comes from power production by natural gas turbines and diesel oil. By eliminating the CO2 emissions from natural gas turbines, it is possible to achieve a reduction in emissions of 4.7 Mt CO2, as of 2008. Substituting large amounts of the power production from gas with hydro power will be an important measure to reduce the CO2 emissions. Offshore wind turbines may also contribute to the electrification of the Norwegian offshore industry, but more research and development is necessary for wind turbines to become a reality at the deep sea levels found in the vicinity of the platforms. The CO2 emissions from Norwegian offshore industry can in principle be reduced to zero by electrification of the platforms from renewable energy on land, and from offshore wind turbines.
4.2 SuperSmart Grid
The European Union aims to reduce greenhouse gas emissions by 20-30 %, in addition to increase the utilization of renewable energies to 20 % of the total energy consumption by 2020. The potential for renewable energy within Europe is limited, but regions in North Africa and the North Sea have a large potential of renewable energy production from solar and wind power. By interconnecting the European electricity grid by an HVDC grid, and connect it to regions in North Africa and the North Sea, the European Union could be able to reach their goals. A grid like the one described is called a SuperSmart Grid, and would not only contribute to reduced greenhouse gas emissions, but would also ensure stable and reliable power supply. [10]

Norwegian University of Science and Technology 5 Conventional thyristor-based HVDC
Group 10 8
5 CONVENTIONAL THYRISTOR-BASED HVDC The converter is fundamentally built up on the same principle as the line-commutated thyristor converter. A good understanding of this converter is the first step to understand the construction of the HVDC converter. The full scale HVDC converter normally consists of various thyristor-bridges in series, in order to achieve a high voltage and to create a 12-pulse converter with less distortion. [11]
5.1 Commutation
The commutation is the time it takes for one thyristor to start leading at the same time as another one is closing. This is a critical operation in the power conversion, as it is the main source to losses and heating in the power converter. In a thyristor bridge, the sinusoidal line voltage is the driving force of commutation. For this reason the thyristor-based converter requires a strong AC-grid. [11]
5.2 Reactive Power Consumption
Another important consideration is the need for reactive power in the converter. Because a minimum extinction time, γmin, is needed to ensure a safe commutation in the inverter, the converter will always consume reactive energy. Due to similar ratings, the delay angle, and effectively the displacement power factor at the rectifier unit is also some 10 to 20 degrees. However, this is usually handled by introducing compensation capacitors and adjustable transformers at the stations. [11]
Figure 5-1: Three phase thyristor-based converter

Norwegian University of Science and Technology 5 Conventional thyristor-based HVDC
Group 10 9
5.3 Point-to-point
The thyristor-based converter requires a continuous current with as little ripple as possible in order to operate well. To achieve this, large inductors are placed on the DC-line. The current running in the line must be carefully supervised and controlled in order to avoid over voltages. This current source converter (CSC) is therefore efficient for point-to-point transmission, where currents can easily be kept track of. Multi-terminal HVDC, on the other hand, is more troublesome with this technology, because it is necessary to change the voltage polarity to reverse the power flow. [11]
5.4 For larger power ratings
The conventional thyristor-based HVDC is the most common form of HVDC today, and has the advantage of being well tested and developed. It has relatively modest losses and today this is the most used technology for transmission at large power levels. [11]

Norwegian University of Science and Technology 6 HVDC with Voltage Source Converter
Group 10 10
6 HVDC WITH VOLTAGE SOURCE CONVERTER The HVDC power transmissions to the offshore platforms Troll A and Valhall are carried out with the HVDC Light technology from ABB. This kind of HVDC technology is based on the use of VSC. The world’s first HVDC transmission with VSC was carried out between Hellsjön and Grängesberg in central Sweden in 1997 [12]. VSC-HVDC has the ability to transfer power in both directions with the same circuit configuration by changing the direction of the DC current. However the active power must be balanced, which means that the power flow out of the DC network must be equal to the power flow into the DC network minus the losses in the HVDC system [13]. Unlike the conventional HVDC technology, VSC makes use of semiconductors like transistors with high switching frequencies instead of thyristors.
Some of the advantages the VSC technology offers compared to conventional HVDC, in addition to the power control, are listed here [14]:
− No risk of commutation failures due to thyristors − No polarity reversal needed to reverse power direction − No restriction on multiple infeeds makes multi-terminal HVDC possible − Possibility of connection to very weak systems − Ability to operate at very low power
6.1 Topology of VSC-HVDC
HVDC Light converters are built up with Insulated Gate Bipolar Transistors (IGBT) [13]. Each IGBT has a rated voltage of 2.5 kV, which means that several transistors are connected in series and parallel to achieve the voltage demand where the converter is applied [14]. The topology of one end of the HVDC transmission with VSC is shown in Figure 6-1.
Figure 6-1: Simplified one line diagram of VSC transmission [13]

Norwegian University of Science and Technology 6 HVDC with Voltage Source Converter
Group 10 11
As shown in Figure 6-1 the IGBT’s function as valves to control the output and each IGBT is provided with an anti-parallel diode. On the DC side there’s a capacitor to reduce the ripple in the voltage and to provide a low inductance path for the turn-off current. The VSC is connected to the AC bus via reactors and a power transformer with a shunt connected AC filter. This kind of arrangement is used to minimize harmonic content produced by switching the transistors [14]. Figure 6-2 shows the three phased schematic diagram for VSC-based HVDC transmission from one AC grid to another.
Figure 6-2 Schematic diagram of an application of VSC in HVDC transmission [15]
6.2 Control of Voltage Source Converters
Because of the high switching frequencies, the VSC’s are usually built with Pulse Width Modulation (PWM) to obtain the desired voltages [15]. By changing the PWM signal it is possible to change both amplitude and phase angle, which means that also active and reactive power can be controlled independently [12]. Of this follows the ability to supply the grid with reactive power independent of the active power transmission with VSC-HVDC, in contradiction to the conventional HVDC which only consumes reactive power. The PWM is computerized to control the on- and off-switching of the transistors. This ensures a precise control of voltage, power and frequency according to the demands in the AC system [16].
6.3 Multi-terminal VSC-HVDC
The ability to change power direction by just changing direction of the DC current is the main reason why VSC-HVDC is the best suited technology for multi-terminal HVDC. With VSC-based multi-terminal HVDC three or more converters can be interconnected to form a HVDC

Norwegian University of Science and Technology 6 HVDC with Voltage Source Converter
Group 10 12
grid with several terminals. The VSC terminals can be connected to different points in the grid or to different AC grids [17]. Figure 6-3 shows the principle topology of a VSC-based multi-terminal HVDC grid.
Figure 6-3: Topology of multi-terminal VSC-HVDC
In Figure 6-3 power directions are indicated with arrows, but as mentioned earlier it can be reversed depending on the specified demands. The technology of multi-terminal VSC-HVDC makes an important part of future developments in integration of offshore wind farms and interconnected grids for exchange of energy between countries.

Norwegian University of Science and Technology 7 Two scenarios of HVDC transmission
Group 10 13
7 TWO SCENARIOS OF HVDC TRANSMISSION There has been worked on two scenarios of HVDC transmission which are discussed below. One scenario is to have a point-to-point thyristor based HVDC connection between Norway and the UK. The other scenario is a multi-terminal VSC based HVDC connection from Norway, via Ekofisk to the UK.
7.1 Thyristor HVDC transmission to the United Kingdom
The Scandinavian system in general, needs to increase the inflow of power from other systems. The condition which needs to be fulfilled is that both parts have a well developed power market and general terms that allow this kind of power exchange. The power markets which fulfill these demands are the Netherlands, Germany and the UK. Some examples of power markets which are not developed in the same manner are found in Russia, Poland, Estonia, Lithuania and Latvia. These power systems are not suitable for power exchange in both directions, besides the geographical distances between the systems are too long. [18]
A HVDC link between Norway and the UK will be beneficial for both countries. By connecting the UK and Nordic electricity power markets it is possible to utilize the economic potential by combining the thermally based power system in the UK and the hydro based power system in Norway. A two-way exchange of electricity is a good solution due to the differences in the power demands and the power production systems in the two countries. This will result in a more stable access to electric power and then reduce the peaks in the power price in both the UK and Norway. Norway will especially profit on this by increasing the access to electric power in the winter-season when the hydro power production is low and the demand of electric power is high. [20]
A HVDC link like this consists for the most part of a cable with a converter station in each end. The cable connection needs to have a return path in addition to the main connection. To minimize costs and the transmission losses the return path is often achieved by using the sea and earth as return path by means of electrodes, a so called monopole arrangement. This solution has been difficult to get approved in the North Sea because it results in a large magnetic field which leads to corrosion on other pipes and equipment in the sea. The magnetic field has also influence on the conditions and the life in the sea. The alternative is the bipole method where two fully isolated cables are used, but this is a more expensive solution. [18]
The performance of the HVDC transmission depends mostly on the cable, and today the maximum transmission capacity of a DC cable is 1800 MW. To achieve a higher capability it is necessary to use several cables in parallel. [19]
The plans for a HVDC link between Norway and the UK was initiated already in 1996 by Statnett in corporation with National Grid Transco (NGT). The capacity of the link should be 1200 MW with a dc voltage level of 500 kV. The length of the sea cable was planned to be 730
Norwegian University of Science and Technology 7 Two scenarios of HVDC transmission
Group 10 14
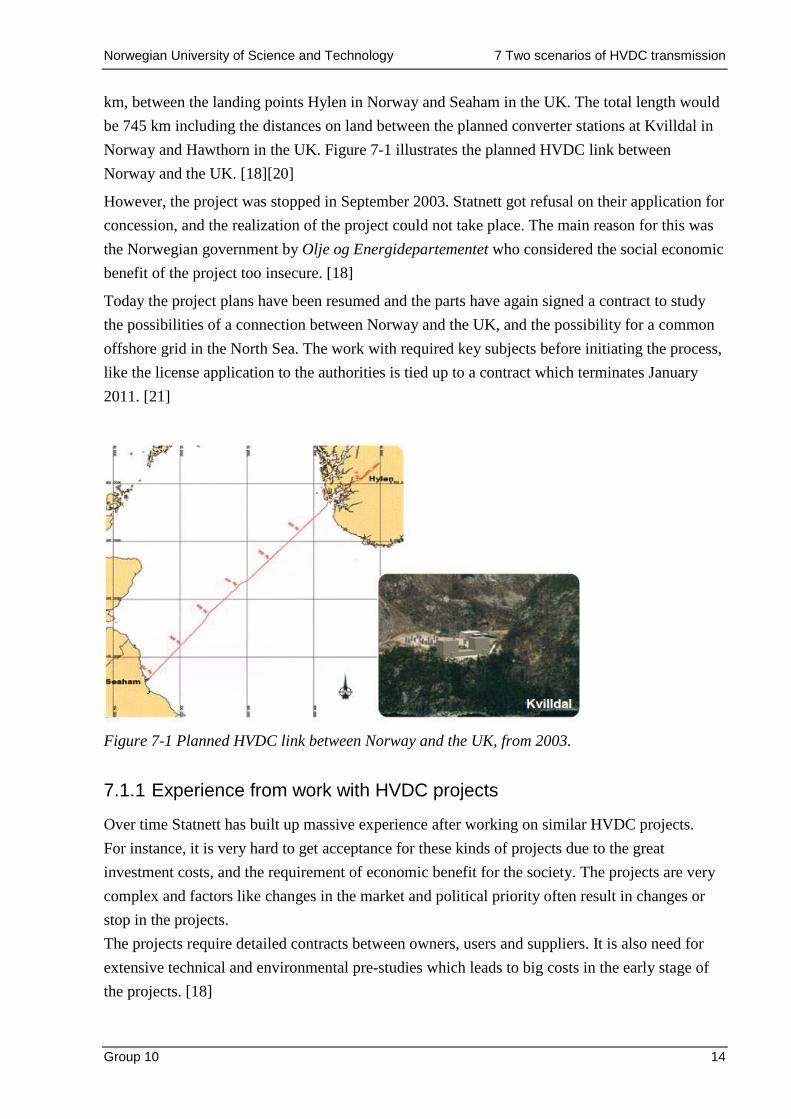
km, between the landing points Hylen in Norway and Seaham in the UK. The total length would be 745 km including the distances on land between the planned converter stations at Kvilldal in Norway and Hawthorn in the UK. Figure 7-1 illustrates the planned HVDC link between Norway and the UK. [18][20]
However, the project was stopped in September 2003. Statnett got refusal on their application for concession, and the realization of the project could not take place. The main reason for this was the Norwegian government by Olje og Energidepartementet who considered the social economic benefit of the project too insecure. [18]
Today the project plans have been resumed and the parts have again signed a contract to study the possibilities of a connection between Norway and the UK, and the possibility for a common offshore grid in the North Sea. The work with required key subjects before initiating the process, like the license application to the authorities is tied up to a contract which terminates January 2011. [21]
Figure 7-1 Planned HVDC link between Norway and the UK, from 2003.
7.1.1 Experience from work with HVDC projects
Over time Statnett has built up massive experience after working on similar HVDC projects. For instance, it is very hard to get acceptance for these kinds of projects due to the great investment costs, and the requirement of economic benefit for the society. The projects are very complex and factors like changes in the market and political priority often result in changes or stop in the projects. The projects require detailed contracts between owners, users and suppliers. It is also need for extensive technical and environmental pre-studies which leads to big costs in the early stage of the projects. [18]

Norwegian University of Science and Technology 7 Two scenarios of HVDC transmission
Group 10 15
7.2 VSC-HVDC transmission to Ekofisk
To realize electrification of Ekofisk with a connection to shore, an additional connection to other countries like the UK is almost inevitable. If thyristor-based HVDC was to be used for this purpose, it would require installation of extra converter stations because of the lack of possibility for multiple infeeds. Space and weight is of essence when it comes to expansions and improvements of offshore platforms, which makes a multi-terminal converter station more attractive. Because of this condition, the possibility of multi-terminal connection with VSC-HVDC makes it the most likely choice of transmission system for a suggested scenario with a connection from shore in Norway through Ekofisk and further on to the UK. An illustration of this kind of scenario is shown in Figure 7-2.
Figure 7-2 Map of scenario with VSC-HVDC connection to the UK via Ekofisk [22]
With a possibility for energy transmission to the UK in addition to a connection from shore to Ekofisk, the development cost would be shared with other parts and the parts involved would also get the ability to exchange energy to achieve higher efficiency.
The distance from the Ekofisk area to the nearest point on shore in Norway is 290 km [23]. With a distance of 350 km to the nearest point on shore in the UK the total cable length required
Norwegian University of Science and Technology 7 Two scenarios of HVDC transmission
Group 10 16
becomes 640 km [23]. This is an approximation since the exact locations of the converter stations are unknown. ABB’s VSC-based HVDC Light converter modules and cables are delivered for three different voltage levels; 80 kV, 150 KV and 300 kV [13]. With such distances as in this scenario it would be profitable to choose a higher voltage level with consideration on losses and cable cost.
7.2.1 Energy demands
As mentioned in chapter 2 the total energy demand at the Ekofisk area is 902.5 MW and the scenario with thyristor-based HVDC connection between Norway and the UK has a planned capacity of 1200 MW. Taken both these demands into consideration, the total capacity of the cables and converters would have to be 2102.5 MW to fully utilize the connection for both purposes. The possible power transmission with HVDC Light ranges from 50 to 1200 MW per converter [13]. The size and cost of the converters and cables increase with the output power, which makes it likely that the connection will be carried out in combination with other kinds of energy sources to fulfill the demands.
The existing energy production with fossil fuel on offshore platforms is divided into three parts [24]:
− Electrical power from gas or diesel oil turbines which runs electrical generators − Mechanical power from gas turbines which directly operates large engines for
compressors and pumps − Thermal power from boilers mounted on gas turbines used for heating
The VSC-HVDC transmission to respectively the platforms Troll A and Valhall has got capacity to fulfill the entire energy demands on those platforms. As an example this made Troll A reduce annual emissions of 230 000 tons of CO2 [25]. Since the Ekofisk area has got such a large energy demand, 100 % electrification will not be the best solution for all of the parts involved.
Much of the gas extracted at the oil platforms are waste products, which makes burning it for energy production cost efficient. One alternative then is the building of offshore wind farms for connection to the grid. Another solution is to keep some of the turbines used to produce mechanical and thermal power in operation, which makes it possible to make the connection to shore with a lower capacity than the total energy demands at Ekofisk. This would keep the efficiency of the existing energy production, in addition to a considerable reduction in CO2 emissions.
7.2.2 Converter modules and cables
Since the total energy demand is larger than the maximum capacity of one single HVDC Light converter, it would require two converter modules in parallel operation to fulfill the demands. An advantage with the use of two sets of converters and cables is the achievement of a highly

Norwegian University of Science and Technology 7 Two scenarios of HVDC transmission
Group 10 17
reliable link, in case of faults or maintenance. Because of the long distances a voltage level at 320 kV would be the most appropriate, since one step down to 150 kV would require the use of extra converter modules to deliver the required energy.
With the requirement of parallel operation follows the need to use converters and cables with equal capacity for the connection from Norway to Ekofisk. With distance of 290 km to shore there are two possible converters with HVDC Light Technology which are suited for delivering energy for the supply from Norway to Ekofisk and further on to the UK. Table 7-1 shows specifications for the two possible converter stations with appropriate cables.
Table 7-1: Specifications of converter stations and cables [13]
Converter M8 M9
Transmission capability [MW] 802.2 1224.2
Cross section of cable [mm2] 1200 2800
Ploss [W/m] 115 123
Voltage drop (ΔU) [V/km] 32 23
Since the M9 has got a transmission capability large enough for the 350 km transmission between UK and Ekofisk alone, it is sufficient with one M9 converter for this line. The scenario with suggested configuration of converters is shown in Figure 7-3.
Figure 7-3 Illustration of the transmission between Norway and UK via Ekofisk [13]

Norwegian University of Science and Technology 7 Two scenarios of HVDC transmission
Group 10 18
The use of two M8 converters at Norwegian soil makes a transmission capability of 1604.4 MW from Norway to Ekofisk. This corresponds to approximately 45 % electrification of Ekofisk in addition to 100 % capacity for transmission to the UK, before the losses are calculated. Table 7-2 shows calculated values for the total losses and voltage drops in the cables, both for the distance between Norway and Ekofisk and from Ekofisk to the UK with this kind of configuration.
Table 7-2: Calculated power loss and voltage drop in cables with M8 converters
Norway to Ekofisk Ekofisk to UK
Converter M8 M8 M9 Cable [mm] 1200 1200 2400 Ploss [MW] 33,4 33,4 43,1 ΔU [kV] 9,3 9,3 8,1 Pdelivered [MW] 768,9 768,9 1181,4 Udelivered [kV] 310,7 310,7 312,0 Ptotal [MW] 1537,7 1181,4
From the results in Table 7-2 it is shown that the chosen configuration has got a transmission capacity of a little less than 40 % electrification of Ekofisk, in addition to 100 % of the demand for the transmission to the UK.
The use of two M9 converters in Norway makes 100 % electrification of Ekofisk possible. Table 7-3 shows calculated values for the total losses and voltage drops in the cables with this kind of configuration.
Table 7-3: Calculated power loss and voltage drop in cables with M9 converters
Norway to Ekofisk Ekofisk to UK
Converter M9 M9 M9 Cable [mm] 2400 2400 2400 Ploss [MW] 35,7 35,7 43,1 ΔU [kV] 6,7 6,7 8,1 Pdelivered [MW] 1188,7 1188,7 1181,4 Udelivered [kV] 313,3 313,3 312,0 Ptotal [MW] 2377,5 1181,4
From the results in Table 7-3 it is shown that the configuration has got more than enough capacity to satisfy the total energy demand of 2102.5 MW.

Norwegian University of Science and Technology 8 Simulations
Group 10 19
8 SIMULATIONS Some of the differences between CSC’s and VSC’s can be demonstrated through the use of computer simulation tools, such as PSCAD. In this project, two simulations have been carried out. One shows the difference in harmonic distortion from the two converters, the other shows the reactive power consumption.
8.1 Models
The model of the classic current source HVDC converter was found in the examples library of the simulation program. The VSC model was provided from the master thesis of Temesgen Haileselassi. The models were edited slightly to facilitate the wanted measurement.
8.2 Measurements of harmonics
Based on the different switching technologies used in the converters, there is reason to believe that the production of harmonics will differ in the two. To measure this, blocks for fundamental frequency scanner (FFT block) were implemented in the models. Figure 8-1 shows the harmonic components produced by the CSC, with and without the standard filtering, and the harmonic components produced by the VSC.
Figure 8-1 Simulation of harmonics. The figure shows from the left, filtered CSC, unfiltered CSC and VSC

Norwegian University of Science and Technology 8 Simulations
Group 10 20
As seen from the simulation, large 11th and 13th harmonics are produced in the CSC, but almost completely filtered out. The harmonics of the VSC are considerably smaller. Harmonics at the frequency of the triangular wave is produced, but these are typically in the MHz-range and very easily filtered out.
Based on these simulations, harmonics cannot be considered a significant challenge for either of the converters.
8.3 Simulation of active power step
To see how each of these converters affects the power grid, a simulation of a scenario with a step in the active power transferred in the DC-link was carried out. This step will affect the current on the AC-side, depending on the switching technology applied. See Figure 8-2.
Figure 8-2 To the left: Simulation of response from step in active power with CSC. Green and blue lines representing reactive and active power, respectively. To the right: Simulation of response from step in active power with VSC. Green and blue lines representing reactive and active power,
As can be observed above, the resultant reactive power is the main difference between these two converters in this simulation. While the VSC can control the reactive power independently of the active power, the CSC cannot. Because the CSC is dependent on the grid voltage to commutate, the reactive power consumption changes with the fire angle of the thyristors. This is a significant disadvantage of the CSC.
The VSC, on the other hand, can control the voltage and current independently and therefore produce or consume reactive power to the extent needed to control the AC voltage. This is a large advantage to the grid stability, and to the ability of operating an “island grid”.

Norwegian University of Science and Technology 9 Concluding remarks
Group 10 21
9 CONCLUDING REMARKS HVDC transmission at long distances is advantageous compared to HVAC transmission, and there is a break even distance where HVDC will always be the preferred choice of transmission. This break even distance is different considering the type of transmission medium, being several times shorter in cables than in overhead lines.
The two HVDC technologies studied in this report differ from each other in several ways when it comes to technology and area of use. CSC is the dominating technology when it comes to point-to-point transmission, where it is well tested and developed, and has relatively modest losses. VSC is advantageous when it comes to multi-terminal HVDC because of its ability to change power direction by just changing direction of the DC current. The technology of multi-terminal VSC HVDC makes an important part of future developments in integration of offshore wind farms and interconnection of the European electricity grid.
Simulation of the two converters shows that harmonics cannot be considered a significant challenge when harmonic filters are properly installed. In addition, the simulation shows that the VSC can control the reactive power independent of the active power, while the CSC cannot. This is a serious disadvantage of the CSC, because the reactive power consumption changes with the fire angle of the thyristors. The VSC can control the voltage and current independently and therefore produce or consume reactive power to control the AC voltage, making it easier to control the grid stability and making operation of an island grid possible.
It is evident that the HVDC technology will develop rapidly as the focus on the environment and energy stability is becoming more and more important. HVDC transmission will contribute to reductions in greenhouse gas emissions by transferring renewable power at very long distances, making it less necessary to rely on power production from polluting technologies.

Norwegian University of Science and Technology References
Group 10 22
REFERENCES [1] SUBSEAIQ. Ekofisk Center (2010). Accessed 5. October 2010 at the World Wide Web:
http://subseaiq.com/data/Project.aspx?project_id=556 [2] Conoco Philips. PL 018 Ekofisk Sør, Videre utikling av Ekofisk Feltet (March 2010).
Accessed 5. October 2010 at the World Wide Web: http://www.conocophillips.no/internet/main.nsf/id/2740F97FE50FEE8CC12576E40032FF7F/$File/EkofiskSoer_KUPForslag_11Mars10.pdf
[3] Conoco Philips. Vurdering av Ekofisk-områdets energianlegg og informasjon om utslipp av NOx (1. May 2005). Accessed 5. October 2010 at the World Wide Web: http://www.klif.no/nyheter/arkiv/conoco31_1.pdf
[4] Global Oneness. High-voltage direct current – History of HVDC transmission (2010). Accessed 4. October 2010 at the World Wide Web: http://www.experiencefestival.com/a/High-voltage_direct_current_-_History_of_HVDC_transmission/id/1449350
[5] Still, A. Overhead Electric Power Transmission. McGraw Hill [6] Serving History. HVDC: History of HVDC Transmission (2010). Accessed 23. October
2010 at the World Wide Web: http://www.servinghistory.com/topics/HVDC::sub::History_Of_HVDC_Transmission
[7] Woodford, D.A. HVDC Transmission. Manitoba Research Centre, Canada, 1998 [8] Larruskain, D.M. Zamora, I. Mazón, A.J. Abarrategui, O. Monsterio, J. Transmission and
Distribution Networks: AC versus DC. Dept. of Electrical Engineering, University of the Basque Country , Bilbao, Spain
[9] Tennet. NorNed cable off to a promising start (9. July 2008). Accessed 4. October 2010 at the World Wide Web: http://www.tennet.org/english/tennet/news/veelbelovende_start_voor_nornedkabel.aspx
[10] SSG – SuperSmart Grid (2010). SuperSmart Grid. Accessed 20. October 2010 at the World Wide Web: http://www.supersmartgrid.net/
[11] Mohan, N. Undeland, T. Robbins, W. Power Electronics – Converters, applications and design (Media enhanced third edition, 2003). USA, John Wiley & Sons, Inc.
[12] ABB Power Systems. Application of HVDC Light to power system enhancement (2000). Accessed 1. October 2010 at the World Wide Web: http://library.abb.com/GLOBAL/SCOT/scot221.nsf/VerityDisplay/3EB0F6E03F83F511C1256FDA004C8CA6/$File/Panelsession.pdf
[13] ABB AS. It’s time to connect – Technical description of HVDC Light technology (2008). Accessed 1. October 2010 at the World Wide Web: http://www.abb.com/industries/ap/db0003db004333/9c43e75526ca8b96c12574a900338059.aspx
[14] ABB AS. VSC Transmission technologies. Accessed 1. October 2010 at the World Wide Web: http://www05.abb.com/global/scot/scot221.nsf/veritydisplay/65a1b7673f405632c1256fda003b4d44/$File/VSC%20TRANSMISSION%20TECHNOLOGIES.pdf
[15] Yazdani, A., Iravani, R. Voltage Sourced Converters in Power Systems. USA. John Wiley & Sons, Inc. 2010.

Norwegian University of Science and Technology References
Group 10 23
[16] ABB Power Systems. HVDC Light – A new technology for a better environment. Accessed 1. October 2010 at the World Wide Web: http://www05.abb.com/global/scot/scot221.nsf/veritydisplay/f36cd044acafdf47c1256fda004c8caa/$File/environment.pdf
[17] IEEE. AC Grid with Embedded VSC-HVDC for Secure and Efficient Power Delivery (2008). Accessed 22. October 2010 at the World Wide Web: http://www05.abb.com/global/scot/scot221.nsf/veritydisplay/d732fdf148faffe8c125753e0061d8cc/$file/ac%20grid%20with%20embedded%20vsc-hvdc%20energy2030_1069-1.pdf
[18] Statnett. Alternative kabler (2004). Accessed 10. October 2010 at the World Wide Web: http://www.statnett.no/Documents/Prosjekter/Kabel%20til%20Nederland%20(NorNed)/Dokumentliste/Konsesjonss%C3%B8knad%20og%20konsekvensutredning/Alternative%20kabelprosjekter.pdf
[19] ABB AS. HVDC Light® Cables (2006). Accessed 27. October 2010 at the World Wide Web: http://www05.abb.com/global/scot/scot245.nsf/veritydisplay/1591f139098f62e5c1257154002f9801/$File/HVDC%20Light%20power%20cables.pdf
[20] Statnett. North Sea Interconnector HVDC Project (2002). Accessed 10. October 2010 at the World Wide Web: http://www.statnett.no/Documents/Consultancy%20services/Worldwide%20projects/north_sea_.pdf
[21] Statnett. Will explore HVDC connection between Norway and Great Britain (2009). Accessed 20. October 2010 at the World Wide Web: http://www.statnett.no/en/News/News-archive-Temp/News-archive-2009/Will-explore-HVDC-connection-between-Norway-and-Great-Britain/
[22] ConocoPhillips. Norway. Accessed 21. October 2010 at the World Wide Web: http://www.conocophillips.com/EN/about/worldwide_ops/country/europe/pages/norway.aspx
[23] Store Norske Leksikon. Ekofisk. Accessed 18. October 2010 at the World Wide Web: http://www.snl.no/Ekofisk
[24] Aker Kværner Engineering & Technology AS. Elektrifisering – Kraft fra land og samkjøring mellom innretninger (2008). Accessed 1. Oct, 2010 at the World Wide Web: http://www.klif.no/nyheter/dokumenter/elektrifisering_samkjoring_akerkvaerner290108.pdf
[25] ABB AS. HVDC light transmission technology presentation. Accessed 1. October 2010 at the World Wide Web: http://dok.ebl-kompetanse.no/Foredrag/2008/Reg%20og%20sentralnett/Stendius.pdf