northwest power planning council commercial hvac - envelope crac july 2, 2003
TRANSCRIPT

Northwest PowerPlanning Council
Commercial HVAC - EnvelopeCommercial HVAC - Envelope
CRAC July 2, 2003CRAC July 2, 2003

slide 2
Northwest PowerPlanning Council
Today:Today:
New Stock EstimateNew Stock Estimate WindowsWindows InsulationInsulation Premium HVAC EquipmentPremium HVAC Equipment Package Roof Top Optimization Package Roof Top Optimization Built-up System Optimization/CommissioningBuilt-up System Optimization/Commissioning Grocery RefrigerationGrocery Refrigeration HVAC Fans Pumps and DrivesHVAC Fans Pumps and Drives Plug Loads, Fume Hoods, Power SuppliesPlug Loads, Fume Hoods, Power Supplies

slide 3
Northwest PowerPlanning Council
2.35 Billion Square Feet 20012.35 Billion Square Feet 2001Floor Area Dodge (New) Compared to Model
0
500,000,000
1,000,000,000
1,500,000,000
2,000,000,000
2,500,000,000
3,000,000,000
1987
1989
1991
1993
1995
1997
1999
2001
StockEstimate(PNonRes+DodgeNew-Demo)
ModelStock95D2M

slide 4
Northwest PowerPlanning Council
Latest Trend Data Latest Trend Data Historical e-EUI All kWh / All Floor Area
0.00
5.00
10.00
15.00
20.00
25.0019
87
1988
1989
1990
1991
1992
1993
1994
1995
1996
1997
1998
1999
2000
2001
kWh
/sf
Discontinuity in the Electricity Data

slide 5
Northwest PowerPlanning Council
Caveats: These estimates will changeCaveats: These estimates will change
Floor Area estimates need to be adjustedFloor Area estimates need to be adjusted– Will impact forecast floor area mostlyWill impact forecast floor area mostly
Some key assumptions will be adjusted as Some key assumptions will be adjusted as more data arrives from CBSAmore data arrives from CBSA– End use and equipment saturationsEnd use and equipment saturations– Space heat fuel, EUIs, LPDs, hoursSpace heat fuel, EUIs, LPDs, hours
Does not include New Building PotentialDoes not include New Building Potential

slide 6
Northwest PowerPlanning Council
WindowsWindows
slide 7
Northwest PowerPlanning Council
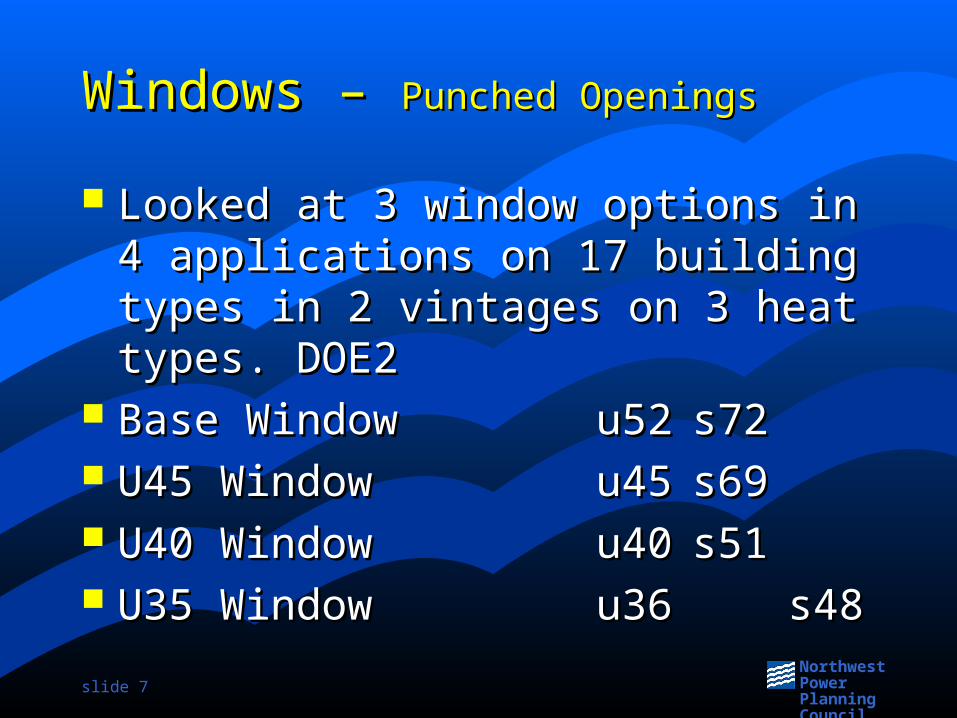
Windows – Windows – Punched OpeningsPunched Openings
Looked at 3 window options in 4 Looked at 3 window options in 4 applications on 17 building types in 2 applications on 17 building types in 2 vintages on 3 heat types. DOE2vintages on 3 heat types. DOE2
Base Window Base Window u52u52 s72s72 U45 WindowU45 Window u45u45 s69s69 U40 WindowU40 Window u40u40 s51s51 U35 WindowU35 Window u36 u36 s48s48

slide 8
Northwest PowerPlanning Council
Code BaselineCode Baseline
Oregon: Oregon: <30% glass U54 SC57<30% glass U54 SC57
>30% glass U37-SC35*>30% glass U37-SC35* Washington:Washington: Elec: U40-SHCG40*, exceptions Elec: U40-SHCG40*, exceptions
Other: U90, U75, U60, U50 >25%Other: U90, U75, U60, U50 >25% Seattle: Seattle: Elec: U40-SHCG 40*, exceptionsElec: U40-SHCG 40*, exceptions
Other: U55, U45>30% g SHGC40Other: U55, U45>30% g SHGC40 Common practice U50 SHGC45Common practice U50 SHGC45 * No cost-effective measure found for these cases* No cost-effective measure found for these cases

slide 9
Northwest PowerPlanning Council
Cost Estimates Cost Estimates
Component CostsComponent Costs
– Low-e to 0.1 emissivity Low-e to 0.1 emissivity $1.00/sf$1.00/sf
– Low-e to 0.04 emissivityLow-e to 0.04 emissivity $1.50/sf$1.50/sf
– Argon fill Argon fill $0.75/sf$0.75/sf
– Thermally Improved Metal frameThermally Improved Metal frame $3.00/sf$3.00/sf
– Replacement VinylReplacement Vinyl$16/sf$16/sf
– Replacement Curtain WallReplacement Curtain Wall $30/sf$30/sf

slide 10
Northwest PowerPlanning Council
Cost EstimatesCost Estimates
Incremental Product CostIncremental Product Cost– Code to u45 Code to u45 $1.00/sf$1.00/sf– Code to u40Code to u40 $1.50/sf$1.50/sf– Code to u35Code to u35 $4.50/sf$4.50/sf
Full Product CostFull Product Cost– Vinyl to u40Vinyl to u40 $17.75/sf$17.75/sf– Vinyl to u35Vinyl to u35 $18.25/sf$18.25/sf
40 year measure life40 year measure life

slide 11
Northwest PowerPlanning Council
Other Key AssumptionsOther Key Assumptions
Punched openings are half the stockPunched openings are half the stock Window/Wall with <30% by building typeWindow/Wall with <30% by building type
– 30% of Office, School, Lodging, Hosp.30% of Office, School, Lodging, Hosp.– 80% of Retail, Restaurant, Warehouse, 80% of Retail, Restaurant, Warehouse,
OtherOther Natural replacement rate 1/50 per yearNatural replacement rate 1/50 per year Space heat type by building type per surveySpace heat type by building type per survey

slide 12
Northwest PowerPlanning Council
Windows – Results Windows – Results
Cooling savings are small Cooling savings are small Range from (-0.4 to +0.6 kWh/sf glass)Range from (-0.4 to +0.6 kWh/sf glass)
– More negatives than positives on suite of More negatives than positives on suite of prototypes and applications examinedprototypes and applications examined
Heating savings 0.5 to 6.0 kWh/sf Heating savings 0.5 to 6.0 kWh/sf Gas savings credit does not make windows in Gas savings credit does not make windows in
gas buildings cost effective on electric TRCgas buildings cost effective on electric TRC

slide 13
Northwest PowerPlanning Council
Windows: Windows: Replacement CaseReplacement Case Results weighted by applicabilityResults weighted by applicability Pay only incremental cost over codePay only incremental cost over code
– u52 base code window u52 base code window Code to u40 is cost-effective (36 mills/kWh)Code to u40 is cost-effective (36 mills/kWh)
– Code to u35 not cost-effective (63 mills/kWh)Code to u35 not cost-effective (63 mills/kWh)– Code to u45 not cost-effective (85 mills/kWh)Code to u45 not cost-effective (85 mills/kWh)
Depends on building type, locationDepends on building type, location At a replacement rate of 1/50 each yearAt a replacement rate of 1/50 each year
– Annually 0.07 MWa/yearAnnually 0.07 MWa/year– 1.3 MWa by 20251.3 MWa by 2025

slide 14
Northwest PowerPlanning Council
Windows: Windows: New Building CaseNew Building Case
Code captured most savings Code captured most savings Where code is u52, upgrade is cost-effectiveWhere code is u52, upgrade is cost-effective
– Code to u40 at 31 mills/kWhCode to u40 at 31 mills/kWh– Code to u35 at 18 mills/kWh Code to u35 at 18 mills/kWh
Assume 50/50 split u40 and u35Assume 50/50 split u40 and u35– 3 MWa in 2025 at 30 mills/kWh3 MWa in 2025 at 30 mills/kWh– Annually 0.15 MWa/yearAnnually 0.15 MWa/year

slide 15
Northwest PowerPlanning Council
Windows – Retrofit CaseWindows – Retrofit Case
Replacing single glaze windows considering Replacing single glaze windows considering full cost and full savingsfull cost and full savings
Both cooling and heating savings are largeBoth cooling and heating savings are large– Typically 5 kWh/sf glass coolingTypically 5 kWh/sf glass cooling– 20+ kWh/sf glass heating20+ kWh/sf glass heating
Cost-effective in electric heat buildings at full Cost-effective in electric heat buildings at full incremental cost of $18/sfincremental cost of $18/sf
Potential free-rider problem. Is it a Potential free-rider problem. Is it a conservation resource?conservation resource?
Total potential is 21 MWa at 33 mills/kWhTotal potential is 21 MWa at 33 mills/kWh

slide 16
Northwest PowerPlanning Council
InsulationInsulation
Add insulation at Re-RoofingAdd insulation at Re-Roofing– Flat built-up roofs onlyFlat built-up roofs only– R0 to R22 at $1.90/sfR0 to R22 at $1.90/sf– R11 to R22 at $1.00/sfR11 to R22 at $1.00/sf
Applies at 12-year re-roof cycle to:Applies at 12-year re-roof cycle to:– Pre 1987 stock remaining in 2005Pre 1987 stock remaining in 2005– Estimates of existing insulation by building type Estimates of existing insulation by building type
from 1996 Puget studyfrom 1996 Puget study DOE 2 modeling on 21 prototypesDOE 2 modeling on 21 prototypes
– Three space heat typesThree space heat types
slide 17
Northwest PowerPlanning Council
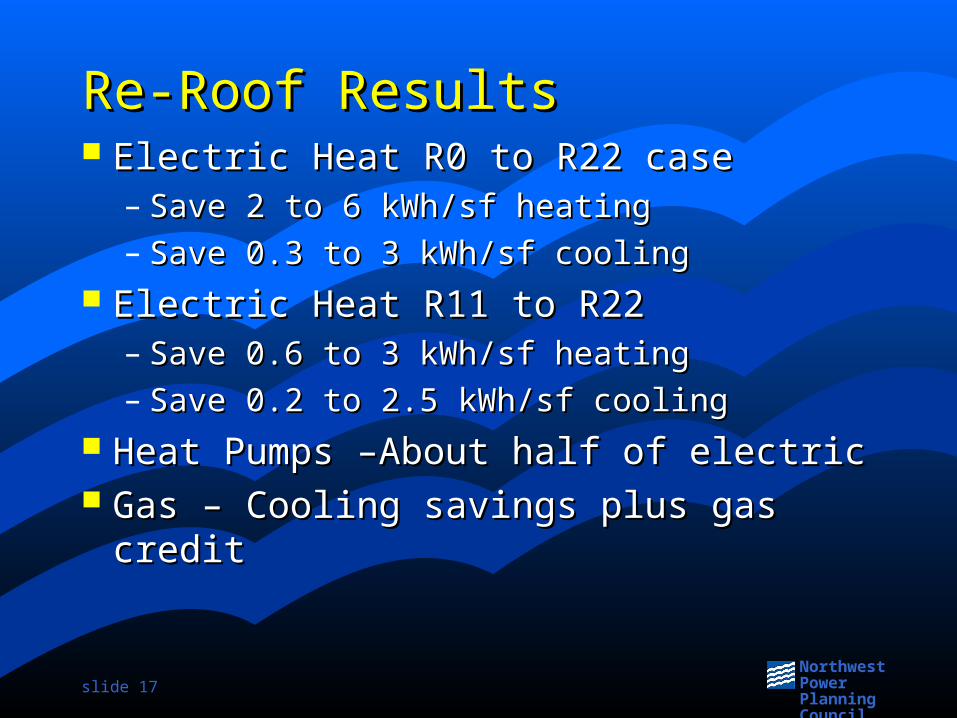
Re-Roof ResultsRe-Roof Results Electric Heat R0 to R22 caseElectric Heat R0 to R22 case
– Save 2 to 6 kWh/sf heatingSave 2 to 6 kWh/sf heating– Save 0.3 to 3 kWh/sf coolingSave 0.3 to 3 kWh/sf cooling
Electric Heat R11 to R22Electric Heat R11 to R22– Save 0.6 to 3 kWh/sf heatingSave 0.6 to 3 kWh/sf heating– Save 0.2 to 2.5 kWh/sf coolingSave 0.2 to 2.5 kWh/sf cooling
Heat Pumps –About half of electricHeat Pumps –About half of electric Gas – Cooling savings plus gas creditGas – Cooling savings plus gas credit

slide 18
Northwest PowerPlanning Council
Re-Roof with InsulationRe-Roof with Insulation
Mostly cost-effective for electric HPMostly cost-effective for electric HP– 62 of 68 cases cost effective62 of 68 cases cost effective– Total of 29 MWa in 2025Total of 29 MWa in 2025– 1.9 MWa per year – lost opportunity1.9 MWa per year – lost opportunity
Cost-effective for cooling-only savingsCost-effective for cooling-only savings– Only 2 of 68 casesOnly 2 of 68 cases

slide 19
Northwest PowerPlanning Council
Premium HVAC EquipmentPremium HVAC Equipment

slide 20
Northwest PowerPlanning Council
Premium HVAC EquipmentPremium HVAC EquipmentAssumptionsAssumptions
At equipment replacement @ 15 years At equipment replacement @ 15 years Based on simulation runs by PNNL Based on simulation runs by PNNL
done for national standards workdone for national standards work– 33 prototypes in the PNW33 prototypes in the PNW– Characteristics from CBECSCharacteristics from CBECS– CEE Tier1 to Tier 2 deltas in EER/IPLVCEE Tier1 to Tier 2 deltas in EER/IPLV
» EER 10.1 to 11.0 for 7.5 tonEER 10.1 to 11.0 for 7.5 ton» EER 9.5 to 11.0 for smaller and largerEER 9.5 to 11.0 for smaller and larger
– Cost on tear-down plus mark-up basis Cost on tear-down plus mark-up basis

slide 21
Northwest PowerPlanning Council
Premium HVAC EquipmentPremium HVAC EquipmentSavings AdjustmentsSavings Adjustments
Savings derated by 10% for interaction Savings derated by 10% for interaction Savings derated by 10% for new buildingsSavings derated by 10% for new buildings Savings account for working economizerSavings account for working economizer Considered cooling-only savingsConsidered cooling-only savings Weighted savings <5, 7.5 and 15 ton unitsWeighted savings <5, 7.5 and 15 ton units
– 60% capacity 7.5 ton, 40% smaller and larger 60% capacity 7.5 ton, 40% smaller and larger
Weighted savings east versus westWeighted savings east versus west– East side uses 1.8 times compressor energyEast side uses 1.8 times compressor energy

slide 22
Northwest PowerPlanning Council
Premium HVAC EquipmentPremium HVAC EquipmentCost AssumptionsCost Assumptions
Costs: Several source consideredCosts: Several source considered– LBL, Eley, Xenergy, DEER, EcotopeLBL, Eley, Xenergy, DEER, Ecotope
Incremental CostsIncremental Costs– $50/ton for packaged equipment 5 to 15 $50/ton for packaged equipment 5 to 15
tonstons– $20/ton for chillers$20/ton for chillers
15 year measure life15 year measure life

slide 23
Northwest PowerPlanning Council
Premium HVAC EquipmentPremium HVAC EquipmentResultsResults
Cooling loads run 1.4 to 10.0 kWh/sf Cooling loads run 1.4 to 10.0 kWh/sf – Building type, location, characteristicsBuilding type, location, characteristics
Upgrade buys about 10% reduction Upgrade buys about 10% reduction energyenergy
Average savings Average savings – 0.3 kWh/sf west side0.3 kWh/sf west side– 0.5 kWh/sf east side0.5 kWh/sf east side

slide 24
Northwest PowerPlanning Council
Premium HVAC EquipmentPremium HVAC EquipmentResultsResults
Cost-effective, but not cheapCost-effective, but not cheap– Marginal for Schools, Warehouse, GroceryMarginal for Schools, Warehouse, Grocery
Replacement Market SavingsReplacement Market Savings– 3.6 MWa/Year at 50 mills/kWh3.6 MWa/Year at 50 mills/kWh– 50 MWa in 202550 MWa in 2025
New Equipment MarketNew Equipment Market– 0.6 MWa/Year at 47 mills/kWh0.6 MWa/Year at 47 mills/kWh– 12.5 MWa in 2025 12.5 MWa in 2025

slide 25
Northwest PowerPlanning Council
Premium HVAC EquipmentPremium HVAC EquipmentNext StepsNext Steps
Initiatives to redefine premium efficiencyInitiatives to redefine premium efficiency– It’s not your father’s EERIt’s not your father’s EER– Huge potential in premium economizerHuge potential in premium economizer– Some potential in direct/indirect Some potential in direct/indirect
evaporativeevaporative– Controls/staging/sizing are critical Controls/staging/sizing are critical
componentscomponents Needs considerable attention at national Needs considerable attention at national
level and with manufacturerslevel and with manufacturers

slide 26
Northwest PowerPlanning Council
slide 27
Northwest PowerPlanning Council
Packaged Roof-Top OptimizationPackaged Roof-Top OptimizationCommissioningCommissioning

slide 28
Northwest PowerPlanning Council
Packaged Roof-Top OptimizationPackaged Roof-Top OptimizationCommissioningCommissioning
Packaged Roof Top Units Packaged Roof Top Units – Near 80% of new building HVAC capacity Near 80% of new building HVAC capacity – Near 60% in older buildings and increasing Near 60% in older buildings and increasing
Most are gas fueledMost are gas fueled Out-of-sight out of mindOut-of-sight out of mind Recent studies in PNW and CA findRecent studies in PNW and CA find
– 80% are sub-optimal80% are sub-optimal– Lots of economizer errorLots of economizer error

slide 29
Northwest PowerPlanning Council
Packaged Roof-Top OptimizationPackaged Roof-Top OptimizationCommissioningCommissioning
Several pilots and programs underwaySeveral pilots and programs underway– EWEB, Puget, NEEA, CAEWEB, Puget, NEEA, CA
Estimates taken from current workEstimates taken from current work– Used Ecotope analysis on both costs and Used Ecotope analysis on both costs and
savingssavings– Developed weighted average package of Developed weighted average package of
costs and savingscosts and savings

slide 30
Northwest PowerPlanning Council
Packaged Roof-Top OptimizationPackaged Roof-Top OptimizationAssumptionsAssumptions
Measure bundle conservativeMeasure bundle conservative– Economizer controller to differential control or to Economizer controller to differential control or to
change over at 65Fchange over at 65F– Min/Max OA adjustmentMin/Max OA adjustment– Two-stage stat adjustmentTwo-stage stat adjustment– OA control on heating warm upOA control on heating warm up– Demand Control Ventilation (DCV) on someDemand Control Ventilation (DCV) on some– Air flow check, coil cleaning, charge correctionAir flow check, coil cleaning, charge correction

slide 31
Northwest PowerPlanning Council
Packaged Roof-Top OptimizationPackaged Roof-Top OptimizationAssumptionsAssumptions
Two climate zones - Seattle and BoiseTwo climate zones - Seattle and Boise Considered mix of OA settingsConsidered mix of OA settings Two building types with 3 internal gain Two building types with 3 internal gain
levelslevels Typical existing EERsTypical existing EERs $350 per 7-ton unit$350 per 7-ton unit $600 per 7-ton unit with DCV$600 per 7-ton unit with DCV

slide 32
Northwest PowerPlanning Council
Packaged Roof-Top OptimizationPackaged Roof-Top OptimizationTypical Savings from Optimization PackageTypical Savings from Optimization Package
Seattle Seattle Cooling Cooling Savings Savings (kWh/sf)(kWh/sf)
BoiseBoise
Cooling Cooling Savings Savings (kWh/sf)(kWh/sf)
DCV DCV Savings Savings Cooling + Cooling + Heating Heating (kWh/sf)(kWh/sf)
OfficeOffice .48.48 0.420.42 0.5 + 3.80.5 + 3.8
Retail High Retail High Internal GainInternal Gain
1.191.19 1.21.2 1.3 + 2.51.3 + 2.5
Retail Low Retail Low Internal GainInternal Gain
.87.87 .66.66 0.9 + 3.40.9 + 3.4

slide 33
Northwest PowerPlanning Council
Packaged Roof-Top OptimizationPackaged Roof-Top OptimizationCost Assumptions Cost Assumptions
$350 per 7-ton unit$350 per 7-ton unit $600 per 7-ton unit with DCV$600 per 7-ton unit with DCV Five-year measure life Five-year measure life

slide 34
Northwest PowerPlanning Council
Packaged Roof-Top OptimizationPackaged Roof-Top OptimizationAssumptionsAssumptions
Modeled savings adjusted for “As Found” by assuming 80% with problemsModeled savings adjusted for “As Found” by assuming 80% with problems Credit cooling savings at cooling load shapeCredit cooling savings at cooling load shape
– Summer savings highly valuableSummer savings highly valuable Fraction of roof top units and space heat fuel at recent historical mixFraction of roof top units and space heat fuel at recent historical mix
– Assumes old systems convert to roof top unitsAssumes old systems convert to roof top units Applied DCV to fraction of occupancies where it is applicable (need min OA 35%)Applied DCV to fraction of occupancies where it is applicable (need min OA 35%) Used incremental DCV cost and savingsUsed incremental DCV cost and savings

slide 35
Northwest PowerPlanning Council
Packaged Roof-Top OptimizationPackaged Roof-Top OptimizationResultsResults
Both Measures almost always cost-effectiveBoth Measures almost always cost-effective 152 MWa in 2025 at 33 mills/kWh152 MWa in 2025 at 33 mills/kWh
Package Roof Top Optimization
0.0
5.0
10.0
15.0
20.0
25.0
30.0
35.0
40.0
45.0
50.0
<10 <20 <30 <40 <50 <60 <70
Levelized Cost Bin (mills/kWh)
MW
a in
202
5

slide 36
Northwest PowerPlanning Council
Built-Up Systems Built-Up Systems HVAC Controls and CommissioningHVAC Controls and Commissioning

slide 37
Northwest PowerPlanning Council
Built-Up Systems Built-Up Systems HVAC Controls and CommissioningHVAC Controls and Commissioning
Measure applies to larger buildings and to older buildingsMeasure applies to larger buildings and to older buildings Reviewed Commissioning LiteratureReviewed Commissioning Literature Precious few data pointsPrecious few data points Wide range of costs and savingsWide range of costs and savings Looked at individual measure metricsLooked at individual measure metrics

slide 38
Northwest PowerPlanning Council
Built-Up Systems Built-Up Systems HVAC Controls and CommissioningHVAC Controls and Commissioning
Schedule and Overrides
Air and Water Flow Adjustments and Balancing
OA Control
Economizer Control
Damper Control
Chiller Control
Cooling Tower Approach Temperature
Pressure Reset
Temperature Reset
Simultaneous Heating Cooling
EMS Adjustment
Sensor Error and Calibration
Sensor Placement
VSD Control Air
VSD Control Water
Control Valves
Warm-Up Sequence
Night Purge Sequence

slide 39
Northwest PowerPlanning Council
Built-Up Systems Built-Up Systems HVAC Controls and CommissioningHVAC Controls and Commissioning
Retro CX Costs by Size
$0.00
$0.50
$1.00
$1.50
$2.00
$2.50
$3.00
$3.50
- 50,000 100,000 150,000 200,000 250,000
Floor Area
$/sf
Direct Cost Adjusted Direct Cost Total Cost
Source: NEEA Study

slide 40
Northwest PowerPlanning Council
Built-Up Systems Built-Up Systems HVAC Controls and CommissioningHVAC Controls and Commissioning
New CX Costs by Size
$0.00
$0.20
$0.40
$0.60
$0.80
$1.00
$1.20
$1.40
$1.60
$1.80
$2.00
- 50,000 100,000 150,000 200,000 250,000 300,000 350,000 400,000
Floor Area
Cos
t $/s
f
Direct Cost Adjusted Direct Cost Total Cost
Source: NEEA Study

slide 41
Northwest PowerPlanning Council
Built-Up Systems Built-Up Systems HVAC Controls and CommissioningHVAC Controls and Commissioning
Savings estimatesSavings estimates– Range (–5%) to +45%Range (–5%) to +45%
NEEA Study (existing bldgs) well documentedNEEA Study (existing bldgs) well documented– Range 1% to 38% electric on n=8Range 1% to 38% electric on n=8
Other studies similar rangeOther studies similar range– SMUDSMUD– TexasTexas– PECI summaryPECI summary

slide 42
Northwest PowerPlanning Council
Built-Up Systems Built-Up Systems HVAC Controls and CommissioningHVAC Controls and Commissioning
Source: NEEA Study
Electric Savings versus Electric EUI
y = 0.5512x - 4.3082
R2 = 0.9146
0
1
2
3
4
5
6
7
8
9
- 5 10 15 20 25
Electric EUI Baseline (kWh/sf)
Sa
vin
gs
kW
h/s
f

slide 43
Northwest PowerPlanning Council
Built-Up Systems Built-Up Systems HVAC Controls and CommissioningHVAC Controls and CommissioningInput AssumptionsInput Assumptions
Source: NEEA Study
15% savings off baseline HVAC EUI15% savings off baseline HVAC EUI 6 year measure life6 year measure life By building type and space heat fuelBy building type and space heat fuel Cost $0.35/sf to $1.50/sf depending on sizeCost $0.35/sf to $1.50/sf depending on size Gas savings get O&M creditGas savings get O&M credit Assume 70% applicabilityAssume 70% applicability Only on built-up systemsOnly on built-up systems

slide 44
Northwest PowerPlanning Council
Built-Up Systems Built-Up Systems HVAC Controls and CommissioningHVAC Controls and CommissioningResultsResults
Source: NEEA Study
57 MWa at 19 mills/kWh 202557 MWa at 19 mills/kWh 2025

slide 45
Northwest PowerPlanning Council
Grocery Refrigeration BundleGrocery Refrigeration Bundle

slide 46
Northwest PowerPlanning Council
Grocery Refrigeration BundleGrocery Refrigeration Bundle Night Covers for Display Night Covers for Display
Cases - VerticalCases - Vertical Night Covers for Display Night Covers for Display
Cases - HorizontalCases - Horizontal Strip Curtains for Walk-in Strip Curtains for Walk-in
BoxesBoxes Glass Doors on Open Display Glass Doors on Open Display
Cases (LT)Cases (LT) Glass Doors on Open Display Glass Doors on Open Display
Cases (MT)Cases (MT) New Refrigeration Display New Refrigeration Display
Case with Doors (LT)Case with Doors (LT) New Refrigeration Display New Refrigeration Display
Case with Doors (MT)Case with Doors (MT) Special Doors with Low/No Special Doors with Low/No
Anti-Sweat HeatAnti-Sweat Heat
Anti-Sweat Heat ControlsAnti-Sweat Heat ControlsAuto-Closers for Coolers Auto-Closers for Coolers and Freezersand FreezersEvaporative fan controller on Evaporative fan controller on walk-inwalk-inAir-cooled to Evaporative Air-cooled to Evaporative Cooled CondenserCooled CondenserEnergy Efficient CondenserEnergy Efficient CondenserFloating Head Pressure Floating Head Pressure ControllerControllerEfficient Evaporator Fan Efficient Evaporator Fan Motor - ECMMotor - ECMEfficient Evaporator Fan Efficient Evaporator Fan Motor - PSCMotor - PSCEnergy Efficient Energy Efficient CompressorsCompressors

slide 47
Northwest PowerPlanning Council
Grocery Refrigeration BundleGrocery Refrigeration Bundle
Costs, Savings and Measure Life from:Costs, Savings and Measure Life from:– CA Express Efficiency Work PapersCA Express Efficiency Work Papers– XenergyXenergy
Remaining measure targetsRemaining measure targets– 50% on Floating Head, Multiplex, System Opt50% on Floating Head, Multiplex, System Opt– 10-40% on glass door cases10-40% on glass door cases– 50% on tripple low-e doors50% on tripple low-e doors– 80% Anti-Sweat Heater Control80% Anti-Sweat Heater Control– 95% PSC and ECM motors95% PSC and ECM motors

slide 48
Northwest PowerPlanning Council
Grocery Refrigeration BundleGrocery Refrigeration Bundle
All measures cost effective exceptAll measures cost effective except– ECM and PSC motors on the marginECM and PSC motors on the margin
Potential of 40 MWa at 20 mills/kWh 2025Potential of 40 MWa at 20 mills/kWh 2025

slide 49
Northwest PowerPlanning Council
VSDsVSDs
Looked at air and water systemsLooked at air and water systems VSDs on fans are cost-effectiveVSDs on fans are cost-effective
– Have become standard practiceHave become standard practice– Included in many package unitsIncluded in many package units– Small remaining savings in built-up systemsSmall remaining savings in built-up systems– 2.5 MWa2.5 MWa
VSDs on chilled water loopsVSDs on chilled water loops– Cost-effective in very large systemsCost-effective in very large systems– Small remaining potentialSmall remaining potential– 1.5 MWa1.5 MWa

slide 50
Northwest PowerPlanning Council
Plug Load ControllerPlug Load Controller
Power strip for offices and cubes with integral Power strip for offices and cubes with integral occupancy sensoroccupancy sensor
Control cubicle task lightsControl cubicle task lights Cost-effective at $15 incremental cost Cost-effective at $15 incremental cost
assuming at least 30 watts connectedassuming at least 30 watts connected At 50 watts controllable savings potential isAt 50 watts controllable savings potential is
– 16 MWa at 32 mills/kWh16 MWa at 32 mills/kWh

slide 51
Northwest PowerPlanning Council
Premium Fume HoodPremium Fume Hood flume hood.mpg
Typical HoodTypical Hood– Like trying to suck a candle out from ten pacesLike trying to suck a candle out from ten paces– Labs starved for airLabs starved for air– Large HVAC interaction a savings multiplierLarge HVAC interaction a savings multiplier
New design boosts flow at edges with ECMsNew design boosts flow at edges with ECMs– Blow the candle out with laminar flowBlow the candle out with laminar flow– Savings 25% at hood 75% make-up conditioningSavings 25% at hood 75% make-up conditioning– Save 8500 kWh/hood, cost $5000-$6000 incrementalSave 8500 kWh/hood, cost $5000-$6000 incremental
PNW share down estimatePNW share down estimate– 19 MWa on 20,000 hoods, verge of cost-effectiveness19 MWa on 20,000 hoods, verge of cost-effectiveness

slide 52
Northwest PowerPlanning Council
Power SupplyPower SupplyAC to DC Conversion in Appliances, Computers, WidgitsAC to DC Conversion in Appliances, Computers, Widgits
Previous estimate 14 MWa for PNWPrevious estimate 14 MWa for PNW Reviewed estimate with Ecos ConsultingReviewed estimate with Ecos Consulting Revised estimate: 142 MWa for PNWRevised estimate: 142 MWa for PNW Example: Efficient Power Supply for a PCExample: Efficient Power Supply for a PC
– Save 147 kWh/year – 20MWa all PNW PCsSave 147 kWh/year – 20MWa all PNW PCs– 8 mills/kWh new8 mills/kWh new– 50 mills/kWh retrofit50 mills/kWh retrofit

slide 53
Northwest PowerPlanning Council
HVAC Retrofit and Replacement Potential
0.0
20.0
40.0
60.0
80.0
100.0
120.0
<10 <20 <30 <40 <50 <60 <70
Cost Bin (mills/kWh)
MW
a in
202
5
Premium Fume Hood-New
Plug Load Sensor-Retro
Grocery Refrigeration Bundle-Retro
ReRoof-NR
VSD, ASD-Retro
Built-Up HVAC Control Retrofit-Retro
Built-Up HVAC Controls Optimization-Retro
Controls Commission-New
Package Roof Top Optimization & Repair-RetroGlass-Retro
Glass-NR
Glass-New
Premium HVAC Equipment-NR
Premium HVAC Equipment-New

slide 54
Northwest PowerPlanning Council
HVAC Retrofit and Replacement Savings Cumulative 2025
0
50
100
150
200
250
300
350
400
450
500
<10 <20 <30 <40 <50 <60 <70
Cost Bin (mills/kWh)
MW
a in
202
5