northwest power and conservation council 6 th plan conservation resource cost- effectiveness...
TRANSCRIPT
Northwest Power and ConservationCouncil
66thth Plan Plan Conservation Resource Cost-Conservation Resource Cost-
EffectivenessEffectiveness
Conservation Resource Advisory CommitteeConservation Resource Advisory Committee
March 12, 2009March 12, 2009

slide 2
Northwest Power and ConservationCouncil
How the Plan’s Cost-Effectiveness How the Plan’s Cost-Effectiveness Analysis Impacts Regional Conservation Analysis Impacts Regional Conservation
ProgramsPrograms Council Plan Council Plan
– Establishes regional conservation targets based its Establishes regional conservation targets based its interpretation of the Act’s requirementsinterpretation of the Act’s requirements
– Contains methodology and assumptions (e.g., future market Contains methodology and assumptions (e.g., future market prices, measure cost & savings) for determining cost-prices, measure cost & savings) for determining cost-effectivenesseffectiveness
– Contains specific “measure level” (e.g. high efficiency Contains specific “measure level” (e.g. high efficiency electric water heaters) determinations of cost-effectivenesselectric water heaters) determinations of cost-effectiveness
Bonneville’s resource acquisitions are to be Bonneville’s resource acquisitions are to be consistent with the Council’s Planconsistent with the Council’s Plan
Utilities covered by I-937 in Washington state must Utilities covered by I-937 in Washington state must adhere to the Council’s “methodology”adhere to the Council’s “methodology”

slide 3
Northwest Power and ConservationCouncil
The Plan’s Definition of Resource Cost-The Plan’s Definition of Resource Cost-Effectiveness Comes From the Regional ActEffectiveness Comes From the Regional Act
""Cost-effectiveCost-effective,”,” means that a measure or means that a measure or resource must be forecast:resource must be forecast:– to be to be reliable and availablereliable and available within the time it is within the time it is
neededneeded– to meet or reduce the electric power demand to meet or reduce the electric power demand
of the consumers of the consumers at an estimated incremental at an estimated incremental system cost no greater than that of the least-system cost no greater than that of the least-cost similarly reliable and available alternativecost similarly reliable and available alternative measure or resource, or any combination measure or resource, or any combination thereof. thereof.
slide 4
Northwest Power and ConservationCouncil
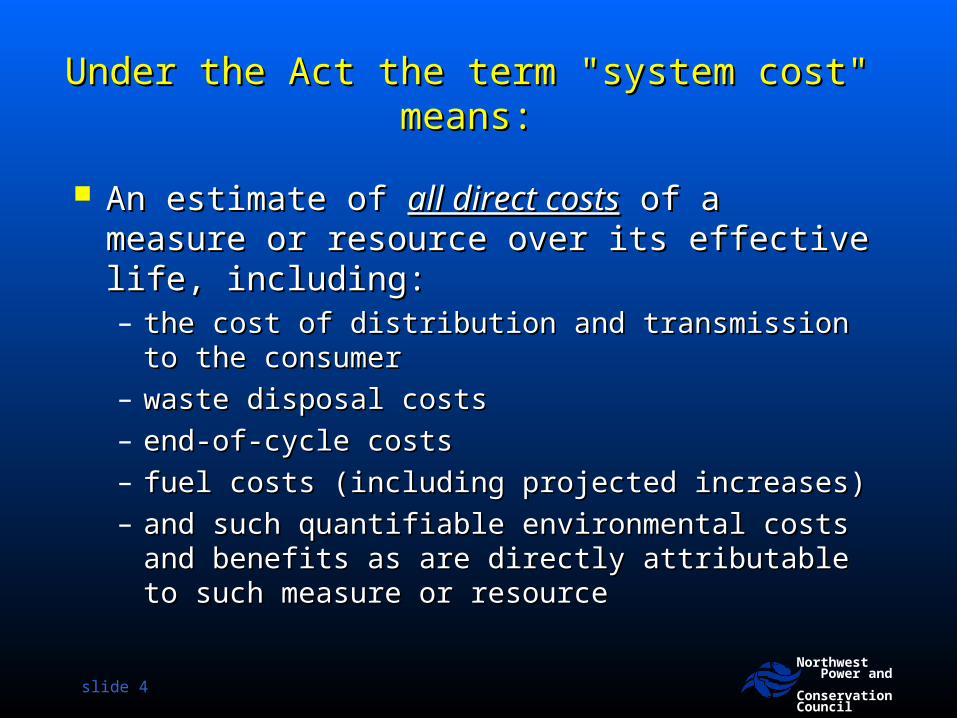
Under the Act the term "system cost" means:Under the Act the term "system cost" means:
An estimate of An estimate of all direct costsall direct costs of a measure or of a measure or resource over its effective life, including:resource over its effective life, including:– the cost of distribution and transmission to the the cost of distribution and transmission to the
consumerconsumer– waste disposal costswaste disposal costs– end-of-cycle costsend-of-cycle costs– fuel costs (including projected increases)fuel costs (including projected increases)– and such quantifiable environmental costs and and such quantifiable environmental costs and
benefits as are directly attributable to such benefits as are directly attributable to such measure or resourcemeasure or resource

slide 5
Northwest Power and ConservationCouncil
The Act’s Definition of Cost-The Act’s Definition of Cost-EffectivenessEffectiveness
Seeks to minimize the Seeks to minimize the total costtotal cost of of meeting the region’s need for the meeting the region’s need for the services provided by electricity, i.e., its services provided by electricity, i.e., its goal is goal is economic efficiency.economic efficiency.
Does not address the distribution of Does not address the distribution of these costs among parties in the regionthese costs among parties in the region

slide 6
Northwest Power and ConservationCouncil
The Council Does Not Use A Single The Council Does Not Use A Single Regional Avoided Cost To Determine Regional Avoided Cost To Determine
Conservation’s Cost-EffectivenessConservation’s Cost-Effectiveness
We Use What We Learn from the Portfolio We Use What We Learn from the Portfolio ModelModel
1)1) Pick any forecast of future market pricesPick any forecast of future market prices
2)2) Add “Risk Premiums” for conservation’s Add “Risk Premiums” for conservation’s hedge value to that forecast (different ones hedge value to that forecast (different ones for lost-opportunity & dispatchable) for lost-opportunity & dispatchable)
3)3) Use this risk adjusted price to determine the Use this risk adjusted price to determine the value of the energy savings value of the energy savings

slide 7
Northwest Power and ConservationCouncil
IRP MethodologyIRP Methodology
66thth Plan is testing thousands of “plans” Plan is testing thousands of “plans” against 750 futuresagainst 750 futures
Model identifies “plans” with the lowest cost Model identifies “plans” with the lowest cost for a given level of riskfor a given level of risk
Model tests alternative conservation Model tests alternative conservation deployment schedules (amount and timing) deployment schedules (amount and timing) as well as “risk mitigation” benefits of buying as well as “risk mitigation” benefits of buying conservation above forecast avoided costconservation above forecast avoided cost
Regional Conservation Targets are derived Regional Conservation Targets are derived from Plans on lowest-cost lowest-risk from Plans on lowest-cost lowest-risk frontierfrontier

slide 8
Northwest Power and ConservationCouncil
Council Process for Estimating Cost-Effective Council Process for Estimating Cost-Effective Conservation Resource Potential & Setting Acquisition Conservation Resource Potential & Setting Acquisition
TargetsTargets
MeasureMeasure CostCost
Measure SavingsMeasure Savings and Load Shapeand Load Shape
MeasureMeasureLifetimeLifetime
• Program DataProgram Data• Contractor BidsContractor Bids• Retail Price SurveysRetail Price Surveys
• End Use Load ResearchEnd Use Load Research• Engineering ModelsEngineering Models• Billing History AnalysisBilling History Analysis• Independent Testing Labs
• EvaluationsEvaluations• Census DataCensus Data• Manufacturers DataManufacturers Data• Engineering EstimatesEngineering Estimates
MarketModel
Provides 20-year Provides 20-year Forecast of Hourly Forecast of Hourly Wholesale Market Wholesale Market Prices & CO2 Prices & CO2 Emission/kWh Under Emission/kWh Under Average Water Average Water Conditions, Medium Conditions, Medium Gas Price Forecast Gas Price Forecast for Medium Load for Medium Load Growth ScenarioGrowth Scenario
Cost-Effectiveness ModelCost-Effectiveness ModelDetermines measure and program level “cost-Determines measure and program level “cost-effectiveness” using:effectiveness” using:• Measure costs, savings & load shapeMeasure costs, savings & load shape• Aurora Market pricesAurora Market prices•T&D savings (losses & deferred $)T&D savings (losses & deferred $)•10% Act Credit10% Act Credit•Quantifiable non-energy costs & benefitsQuantifiable non-energy costs & benefits•Financial Assumptions (e.g. Discount Rate)Financial Assumptions (e.g. Discount Rate)•Risk “Premium” from Porfolio ModelRisk “Premium” from Porfolio Model
PortfolioPortfolioModelModel
Determines NPV of Portfolios with Determines NPV of Portfolios with Alternative Levels of Conservation Alternative Levels of Conservation vs Other Resources Under Wide vs Other Resources Under Wide Range for Future ConditionsRange for Future Conditions
Plan’s Conservation TargetPlan’s Conservation Target
$35,500
$36,000
$36,500
$37,000
$37,500
$23,500 $24,000 $24,500 $25,000
NPV System Risk (2004$Millions)
NP
V S
yste
m C
ost
(20
04
$M
illion
s)

Portfolio Analysis Determines How Much Energy Efficiency Portfolio Analysis Determines How Much Energy Efficiency to Develop in the Face of Uncertaintyto Develop in the Face of Uncertainty
0%
2%
4%
6%
8%
10%
12%
14%
16%
0.0% 1.0% 2.0% 3.0% 4.0% 5.0%
Annual Load Growth
Pro
bab
ilit
y (
%)
0%
2%
4%
6%
8%
10%
12%
14%
16%
18%
0% 1% 2% 3% 4% 5%
Real Natural Gas Escalation Rate% )
Pro
bab
ilit
y (
%)
0%
5%
10%
15%
20%
25%
30%
3.27% 3.80% 3.85% 3.93% 2.50%
Nominal Annual Electricity Price Escalation Rate
Pro
bab
ilit
y (
%)
0
20
40
60
80
100
120
98
467
705
842
1,06
9
1,19
1
1,28
3
1,33
5
1,35
3
1,37
3
1,65
0
Resource Potential
Levelize
d C
ost
0%2%4%6%8%
10%12%14%16%18%20%
Carbon Tax Implementation Date
Pro
bab
ilty
(%
)
0
5000
10000
15000
20000
25000
1925 1930 1935 1940 1945 1950 1955 1960 1965 1970 1975
Hydrosytem Year
Cap
acit
y (
MW
)
0%2%4%6%8%
10%12%14%16%18%20%
Pro
bab
ilit
y
$0 $6 $12 $18 $24 $30 $36
Carbon Tax
Frequency Chart
Dollars
Mean = $689.000
.011
.022
.032
.043
0
10.75
21.5
32.25
43
($3,509) ($1,131) $1,247 $3,625 $6,003
1,000 Trials 1,000 Displayed
Portfolio Portfolio Analysis Analysis ModelModel
$35,500
$36,000
$36,500
$37,000
$37,500
$23,500 $24,000 $24,500 $25,000
NPV System Risk (2004$Millions)
NPV
Syst
em
Cost
(2
00
4$
Mill
ion
s)
Efficient FrontierEfficient Frontier
NPV System Cost
slide 10
Northwest Power and ConservationCouncil
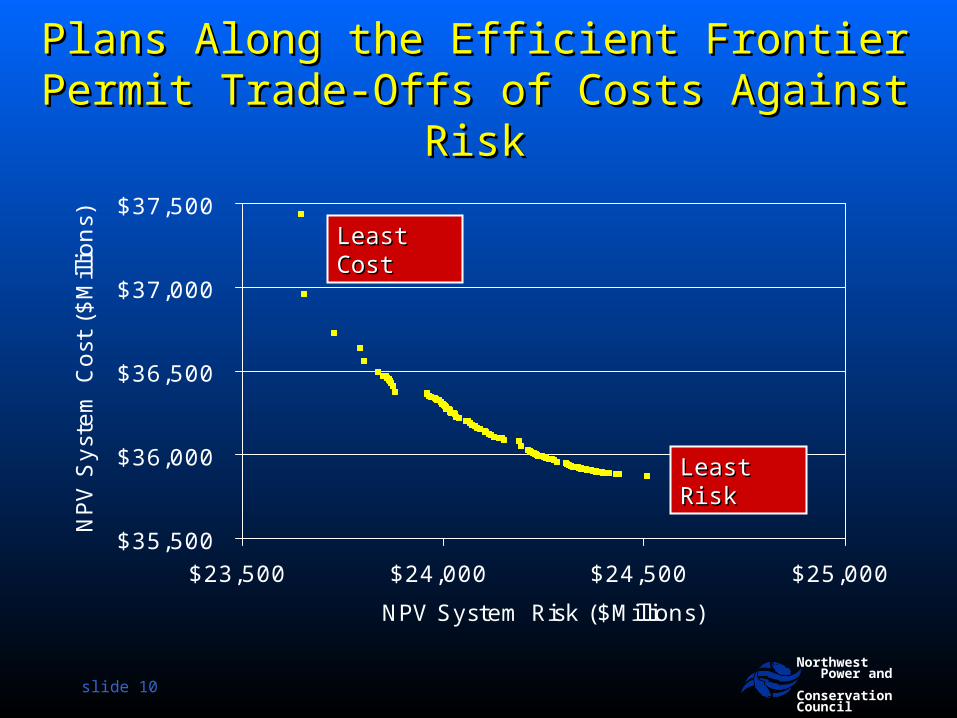
Plans Along the Efficient Frontier Permit Plans Along the Efficient Frontier Permit Trade-Offs of Costs Against RiskTrade-Offs of Costs Against Risk
$35,500
$36,000
$36,500
$37,000
$37,500
$23,500 $24,000 $24,500 $25,000
NPV System Risk ($Millions)
NPV
Syst
em
Cost
($
Mill
ion
s)
Least RiskLeast Risk
Least CostLeast Cost

slide 11
Northwest Power and ConservationCouncil
Alternative Alternative Cost-Effectiveness TestsCost-Effectiveness Tests
Participant Cost Test (PTC)Participant Cost Test (PTC)– Costs and benefits to the program participantCosts and benefits to the program participant
Total Resource Cost (TRC)Total Resource Cost (TRC)– All Quantifiable costs & benefits regardless of who All Quantifiable costs & benefits regardless of who
accrues them. Includes participant and others’ costsaccrues them. Includes participant and others’ costs Utility Cost Test (UTC)Utility Cost Test (UTC)
– Quantifiable costs & benefits that accrue only to the Quantifiable costs & benefits that accrue only to the utility system. Specifically excludes participant costsutility system. Specifically excludes participant costs
Rate Impact Measure (RIM)Rate Impact Measure (RIM)– Net change in electricity utility revenue requirements.Net change in electricity utility revenue requirements.
» AttemptsAttempts to measure rate impact on all utility customers especially to measure rate impact on all utility customers especially those that do not directly participate in the conservation programthose that do not directly participate in the conservation program
» Treats “lost revenues” (lower participant bills) as a costTreats “lost revenues” (lower participant bills) as a cost
slide 12
Northwest Power and ConservationCouncil
Plan Uses Total Resource Cost Plan Uses Total Resource Cost (& Benefits) Perspective(& Benefits) Perspective
Best meets the requirements of the Regional ActBest meets the requirements of the Regional Act Considers all quantifiable costs & benefits regardless of Considers all quantifiable costs & benefits regardless of
who accrues themwho accrues them Ensures that conservation expenditures are good for the Ensures that conservation expenditures are good for the
power system, the customer and societypower system, the customer and society Allows conservation to be compared to other resources Allows conservation to be compared to other resources
considered for development by including all quantifiable considered for development by including all quantifiable costs & benefitscosts & benefits
Was Was stronglystrongly recommended by utilities in first Council recommended by utilities in first Council PlanPlan
Plan targets would be significantly higher if Plan had Plan targets would be significantly higher if Plan had considered only “Utility Cost”considered only “Utility Cost”
slide 13
Northwest Power and ConservationCouncil
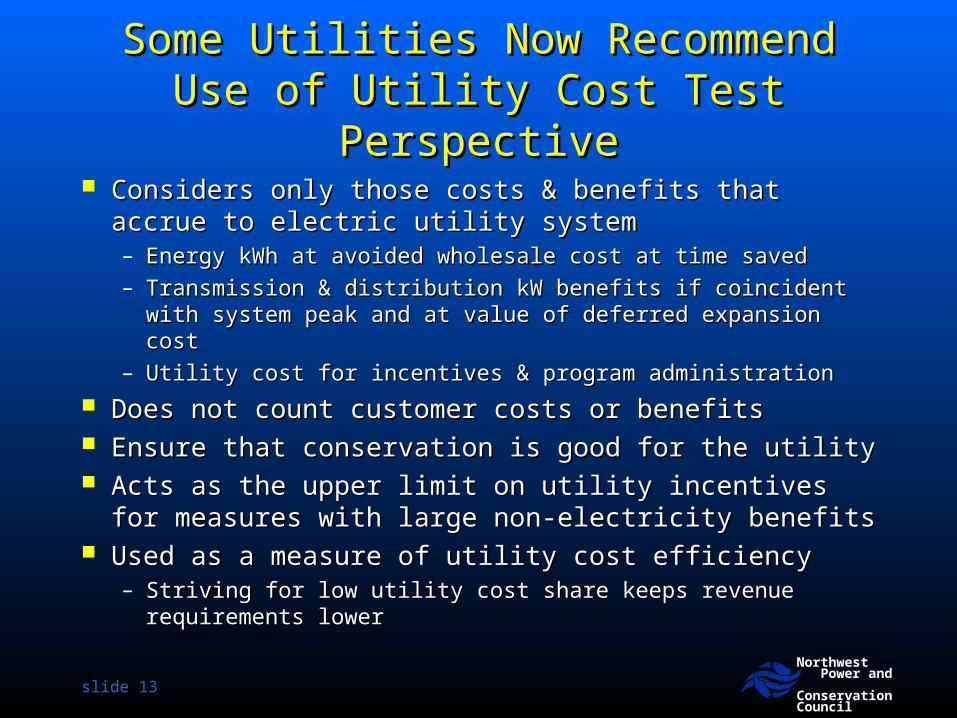
Some Utilities Now Recommend Use Some Utilities Now Recommend Use of Utility Cost Test Perspectiveof Utility Cost Test Perspective
Considers only those costs & benefits that accrue to Considers only those costs & benefits that accrue to electric utility systemelectric utility system– Energy kWh at avoided wholesale cost at time savedEnergy kWh at avoided wholesale cost at time saved– Transmission & distribution kW benefits if coincident with Transmission & distribution kW benefits if coincident with
system peak and at value of deferred expansion costsystem peak and at value of deferred expansion cost– Utility cost for incentives & program administrationUtility cost for incentives & program administration
Does not count customer costs or benefitsDoes not count customer costs or benefits Ensure that conservation is good for the utilityEnsure that conservation is good for the utility Acts as the upper limit on utility incentives for Acts as the upper limit on utility incentives for
measures with large non-electricity benefitsmeasures with large non-electricity benefits Used as a measure of utility cost efficiency Used as a measure of utility cost efficiency
– Striving for low utility cost share keeps revenue requirements Striving for low utility cost share keeps revenue requirements lowerlower

slide 14
Northwest Power and ConservationCouncil
NEET Process Raised Additional NEET Process Raised Additional IssuesIssues
Review method of calculating cost-effectivenessReview method of calculating cost-effectiveness– Is the Council’s existing interpretation of the Act’s Is the Council’s existing interpretation of the Act’s
definition “too conservative”?definition “too conservative”?
At what “level of aggregation” should the calculation At what “level of aggregation” should the calculation of costs and benefits be performed?of costs and benefits be performed?– MeasureMeasure– SystemSystem– BuildingBuilding– ProgramProgram– PortfolioPortfolio
slide 15
Northwest Power and ConservationCouncil
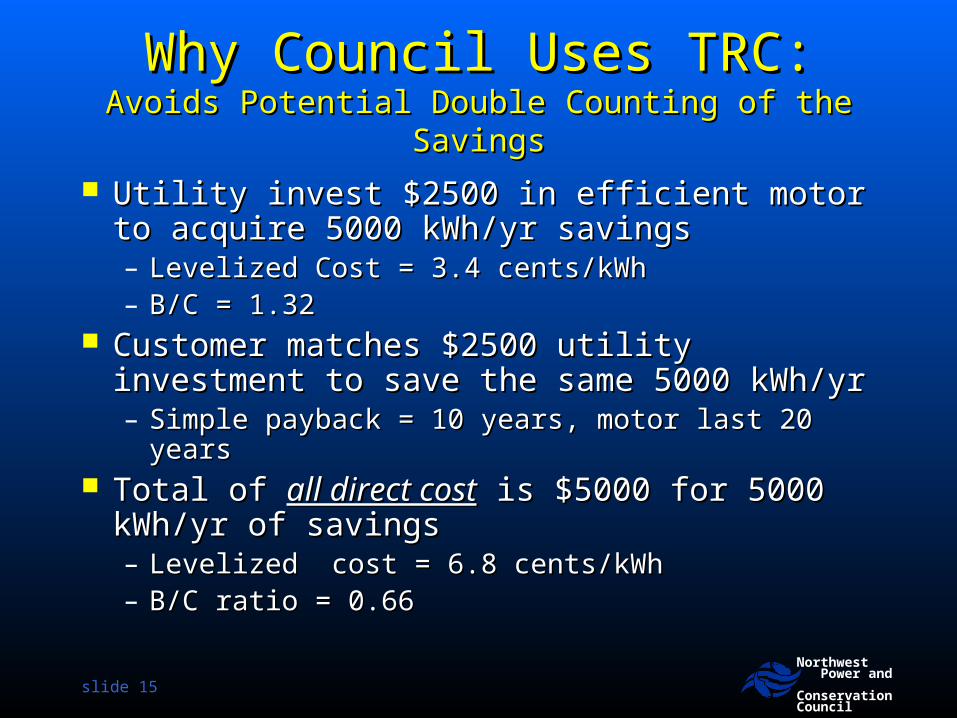
Why Council Uses TRC:Why Council Uses TRC:Avoids Potential Double Counting of the SavingsAvoids Potential Double Counting of the Savings
Utility invest $2500 in efficient motor to Utility invest $2500 in efficient motor to acquire 5000 kWh/yr savingsacquire 5000 kWh/yr savings– Levelized Cost = 3.4 cents/kWhLevelized Cost = 3.4 cents/kWh– B/C = 1.32B/C = 1.32
Customer matches $2500 utility investment to Customer matches $2500 utility investment to save the same 5000 kWh/yrsave the same 5000 kWh/yr– Simple payback = 10 years, motor last 20 yearsSimple payback = 10 years, motor last 20 years
Total of Total of all direct costall direct cost is $5000 for 5000 is $5000 for 5000 kWh/yr of savingskWh/yr of savings– Levelized cost = 6.8 cents/kWhLevelized cost = 6.8 cents/kWh– B/C ratio = 0.66B/C ratio = 0.66

slide 16
Northwest Power and ConservationCouncil
Why Council Uses TRCWhy Council Uses TRCDirects Funds Toward Measures That Optimize Directs Funds Toward Measures That Optimize TotalTotal
Utility and Customer InvestmentsUtility and Customer Investments
Utility invest $600 toward cost of $6000 Utility invest $600 toward cost of $6000 solar PV system that saves 1200 solar PV system that saves 1200 kWh/yrkWh/yr– Alternatively utility and consumer could:Alternatively utility and consumer could:
» Invest $160 in 40 CFLs to save 1200 kWh, Invest $160 in 40 CFLs to save 1200 kWh, reducing cost $440 reducing cost $440
» Invest $600 to buy 150 CFLs, saving 5000 Invest $600 to buy 150 CFLs, saving 5000 kWh, quadrupling savingskWh, quadrupling savings
Especially important when budgets are Especially important when budgets are limitedlimited

slide 17
Northwest Power and ConservationCouncil
Why Council Uses TRCWhy Council Uses TRCAvoids promoting measures that may impose non-Avoids promoting measures that may impose non-
energy costs on othersenergy costs on others
Act directs the Council give second priority to Act directs the Council give second priority to the use of renewable resourcesthe use of renewable resources
Analysis in 1Analysis in 1stst Plan concluded that cost of Plan concluded that cost of using wood stoves to offset use of electric using wood stoves to offset use of electric heat was below cost of electricity from new heat was below cost of electricity from new generating facilitiesgenerating facilities
11stst Plan Plan excludedexcluded use of wood heat due to use of wood heat due to “non-energy” cost (air pollution) imposed on “non-energy” cost (air pollution) imposed on the regionthe region

slide 18
Northwest Power and ConservationCouncil
Why Council Uses TRCWhy Council Uses TRCExpands list of conservation options by allowing Expands list of conservation options by allowing
consideration of quantifiable “non-energy” benefitsconsideration of quantifiable “non-energy” benefits
Energy Star Clothes Washer in Homes with Gas Energy Star Clothes Washer in Homes with Gas Water Heater and DryerWater Heater and Dryer – Present Value Capital Cost Present Value Capital Cost
== $58/MWh$58/MWh– Present Value to Power SystemPresent Value to Power System
= $17/MWh (B/C = 0.3)= $17/MWh (B/C = 0.3)– Value to Region/Society (includes natural gas, detergent & Value to Region/Society (includes natural gas, detergent &
water savings)water savings)= $110/MWh (B/C = 2.0)= $110/MWh (B/C = 2.0)
Power system’s “willingness-to-pay” for these savings Power system’s “willingness-to-pay” for these savings should be limitedshould be limited to its present value benefits to its present value benefits
» Electric Utility could provide incentive up to $17/MWh for Electric Utility could provide incentive up to $17/MWh for washer in a home with gas water and dryer heatwasher in a home with gas water and dryer heat

slide 19
Northwest Power and ConservationCouncil
Consideration of Non-Energy Benefits Consideration of Non-Energy Benefits Expands the Conservation Supply CurveExpands the Conservation Supply Curve
0
500
1,000
1,500
2,000
2,500
3,000
$0 $10 $20 $30 $40 $50 $60 $70 $80 $90 $100
Real Levelized Cost (2000$/MWh)
Cum
ula
tive S
avin
gs
(aM
W)
Economically Achievable Potential w/o Non-Energy Benefits
Economically Achievable Potential w/Non-Energy Benefits
Conservation Resources in Plan Createdby Consideration of Non-Energy Benefits
slide 20
Northwest Power and ConservationCouncil
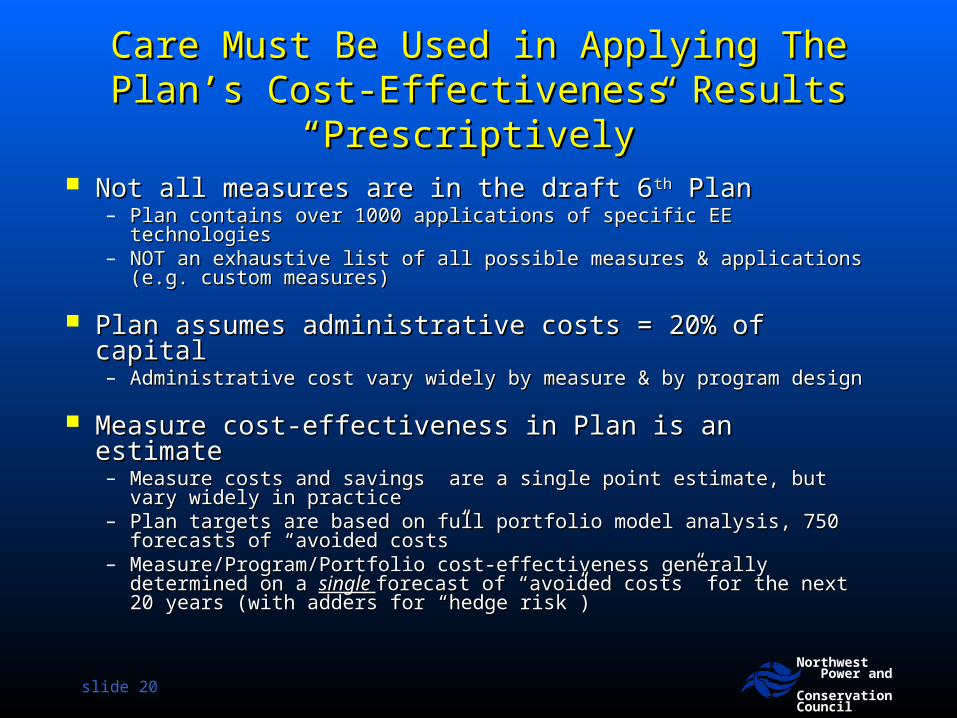
Care Must Be Used in Applying The Plan’s Care Must Be Used in Applying The Plan’s Cost-Effectiveness Results “Prescriptively”Cost-Effectiveness Results “Prescriptively”
Not all measures are in the draft 6Not all measures are in the draft 6thth Plan Plan– Plan contains over 1000 applications of specific EE technologiesPlan contains over 1000 applications of specific EE technologies– NOT an exhaustive list of all possible measures & applications (e.g. NOT an exhaustive list of all possible measures & applications (e.g.
custom measures)custom measures)
Plan assumes administrative costs = 20% of capital Plan assumes administrative costs = 20% of capital – Administrative cost vary widely by measure & by program designAdministrative cost vary widely by measure & by program design
Measure cost-effectiveness in Plan is an estimateMeasure cost-effectiveness in Plan is an estimate– Measure costs and savings are a single point estimate, but vary Measure costs and savings are a single point estimate, but vary
widely in practicewidely in practice– Plan targets are based on full portfolio model analysis, 750 forecasts Plan targets are based on full portfolio model analysis, 750 forecasts
of “avoided costs”of “avoided costs”– Measure/Program/Portfolio cost-effectiveness generally determined Measure/Program/Portfolio cost-effectiveness generally determined
on a on a single single forecast of “avoided costs” for the next 20 years (with forecast of “avoided costs” for the next 20 years (with adders for “hedge risk”) adders for “hedge risk”)

slide 21
Northwest Power and ConservationCouncil
Granularity/Bundling – Granularity/Bundling – So What’s “A Measure”?So What’s “A Measure”?
"Resource" means-- electric power, "Resource" means-- electric power, including the actual or planned electric including the actual or planned electric power capability of generating facilities, power capability of generating facilities, or actual or planned load reduction or actual or planned load reduction resulting from direct application of a resulting from direct application of a renewable energy resource by a renewable energy resource by a consumer, or from consumer, or from a conservation a conservation measuremeasure. .

slide 22
Northwest Power and ConservationCouncil
Why “Bundle”Why “Bundle”
Measures are interactive, so total savings are not the Measures are interactive, so total savings are not the sum of their “parts”sum of their “parts”– Example: Heat pumps, duct sealing and commissioningExample: Heat pumps, duct sealing and commissioning
““Deeper” savings are lower costDeeper” savings are lower cost– Example: Conversions and/upgrades to HSPF 9.0 have a Example: Conversions and/upgrades to HSPF 9.0 have a
higher TRC B/C ratio than to HSPF 8.5higher TRC B/C ratio than to HSPF 8.5
Adding a “non-cost effective” measure reduces cost Adding a “non-cost effective” measure reduces cost per unit of savings by increasing market penetrationper unit of savings by increasing market penetration– Example: Adding “prime window replacements” increases Example: Adding “prime window replacements” increases
participation in weatherization program, spreading fixed cost participation in weatherization program, spreading fixed cost over more savingsover more savings

slide 23
Northwest Power and ConservationCouncil
Risks of BundlingRisks of Bundling
Reduces in economic benefits of Reduces in economic benefits of conservationconservation– If the average cost of all conservation equals the If the average cost of all conservation equals the
avoided cost, there’s no room for a mistakesavoided cost, there’s no room for a mistakes If “non-cost effective” measure dominates If “non-cost effective” measure dominates
program/portfolio, it places all savings program/portfolio, it places all savings at risk at risk (i.e., not recoverable, not counted toward (i.e., not recoverable, not counted toward target)target)
Slippery slope – Can bundling of any Slippery slope – Can bundling of any measures (e.g. PVs w/CFLs) be justified?measures (e.g. PVs w/CFLs) be justified?– Is there a need for consistent application across Is there a need for consistent application across
the region?the region?

slide 24
Northwest Power and ConservationCouncil
Care Must Be Used in Applying The Plan’s Care Must Be Used in Applying The Plan’s Cost-Effectiveness Results “Prescriptively”Cost-Effectiveness Results “Prescriptively”
Plan’s cost & savings estimates are “averages”Plan’s cost & savings estimates are “averages”– Site-specific applications may be Site-specific applications may be more or lessmore or less “cost- “cost-
effective” than in Planeffective” than in Plan– The Plan “average” may not accurately reflect specific The Plan “average” may not accurately reflect specific
program conditionsprogram conditions Programs should be tailored to reflect specific Programs should be tailored to reflect specific
program designs, delivery mechanisms, measure program designs, delivery mechanisms, measure applications, location and other key cost or savings applications, location and other key cost or savings factorsfactors
Program estimates need to be Program estimates need to be more or lessmore or less granular granular than Plan estimatesthan Plan estimates– Individual measures evaluated in Plan are aggregated into Individual measures evaluated in Plan are aggregated into
programs/portfolios (e.g., Plan doesn’t have “Energy Star programs/portfolios (e.g., Plan doesn’t have “Energy Star New Homes” as a measure)New Homes” as a measure)
slide 25
Northwest Power and ConservationCouncil
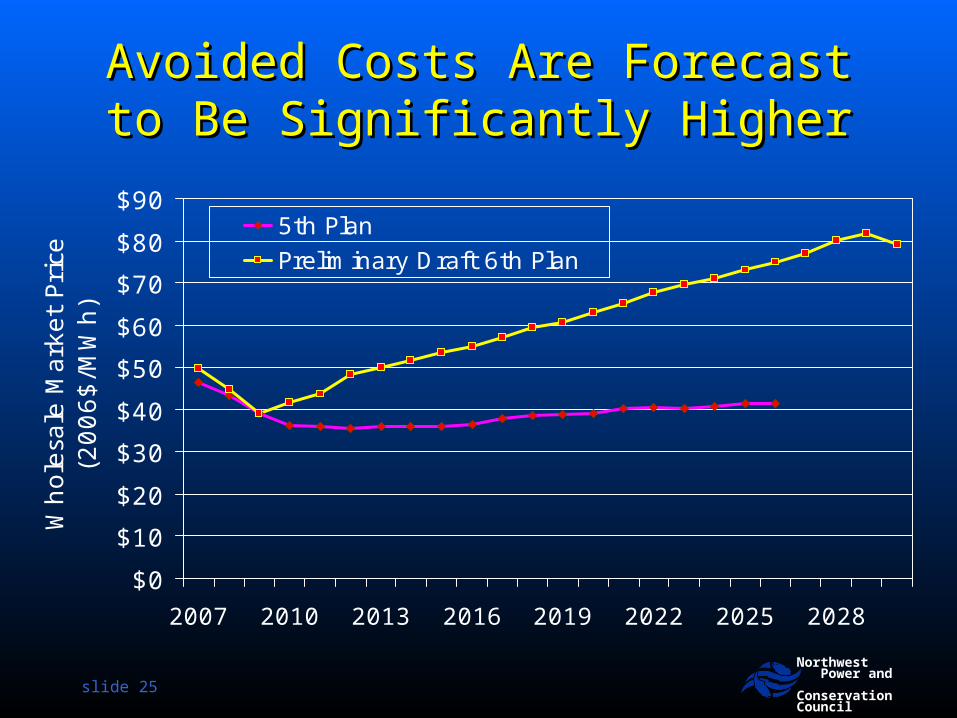
Avoided Costs Are Forecast to Avoided Costs Are Forecast to Be Significantly HigherBe Significantly Higher
$0
$10
$20
$30
$40
$50
$60
$70
$80
$90
2007 2010 2013 2016 2019 2022 2025 2028
Wh
ole
sale
Mark
et
Pri
ce
(20
06
$/M
Wh
)
5th Plan
Preliminary Draft 6th Plan

slide 26
Northwest Power and ConservationCouncil
Energy Efficiency is Still the Energy Efficiency is Still the Cheapest OptionCheapest Option
Assumptions :
Efficiency Cost = Average Cost of All Conservation Targeted in 5th Power Plan
Transmission cost & losses to point of LSE wholesale delivery
No federal investment or production tax credits
Baseload operation (CC - 85%CF, Nuclear 87.5% CF, SCPC 85%, Wind 32% CF)
Medium NG and coal price forecast (Proposed 6th Plan)
Bingaman/Specter safety valve CO2 cost
$0
$20
$40
$60
$80
$100
$120
$140
$160
Energ
y Effic
iency
Gas C
omb
Cycle
MT
Wind
(Loc
al)
Advan
ced N
uclea
r
Super
critic
al PC (W
A/OR)
Colum
bia B
asin
Wind
AB Wind
> W
A/OR
ID W
ind (L
ocal)
MT
Wind
> W
A/OR
Le
veliz
ed
Life
cycl
e C
ost
(2
00
6$
/MW
h)
Emission (CO2) cost
Transmission & Losses
System Integration
Plant costs

slide 27
Northwest Power and ConservationCouncil
Draft 6Draft 6thth MWa of “Technically MWa of “Technically Achievable” Conservation PotentialAchievable” Conservation Potential
0
1,000
2,000
3,000
4,000
5,000
6,000
7,000
< 0
<10
<20
<30
<40
<50
<60
<70
<80
<90
<10
0
<11
0
<12
0
<13
0
<14
0
<15
0
<16
0
<17
0
<18
0
<19
0
<20
0
>20
0
Real Levelized Cost (2006$/MWh)
Tech
nic
alll
y A
chie
vable
Pote
nti
al (M
Wa) DEI_Non-LO
Agr_Non-LOInd_Non-LOCom_Non-LORes_Non-LOCom_LORes_LO

slide 28
Northwest Power and ConservationCouncil
Draft 6Draft 6thth MWa of “Technically MWa of “Technically Achievable” Conservation PotentialAchievable” Conservation Potential
0
1,000
2,000
3,000
4,000
5,000
6,000
7,000
< 0 <20 <40 <60 <80 <100 <120 <140 <160 <180 <200
Real Levelized Cost (2006$/MWH)
Ave
rage M
egaw
att
s by
2030
Dispatchable Lost-Opportunity
5th Plan Estimate

slide 29
Northwest Power and ConservationCouncil
Backup SlidesBackup Slides
slide 30
Northwest Power and ConservationCouncil
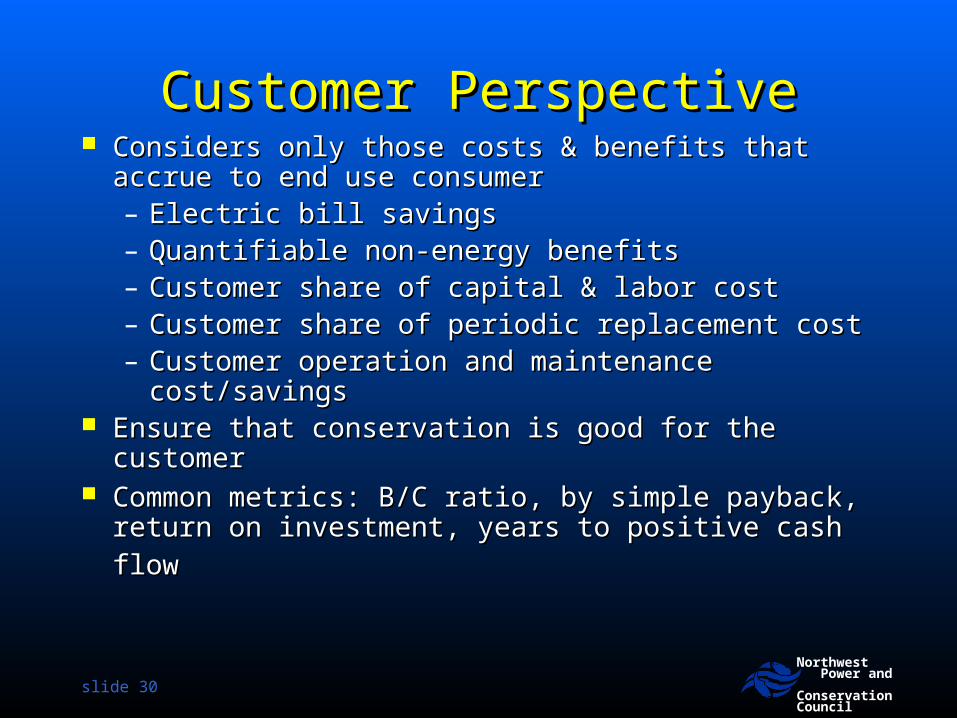
Customer PerspectiveCustomer Perspective Considers only those costs & benefits that accrue to Considers only those costs & benefits that accrue to
end use consumerend use consumer– Electric bill savings Electric bill savings – Quantifiable non-energy benefits Quantifiable non-energy benefits – Customer share of capital & labor cost Customer share of capital & labor cost – Customer share of periodic replacement costCustomer share of periodic replacement cost– Customer operation and maintenance Customer operation and maintenance
cost/savingscost/savings Ensure that conservation is good for the customerEnsure that conservation is good for the customer Common metrics: B/C ratio, by simple payback, Common metrics: B/C ratio, by simple payback,
return on investment, years to positive cash flowreturn on investment, years to positive cash flow

slide 31
Northwest Power and ConservationCouncil
Common Expressions of Cost-Common Expressions of Cost-EffectivenessEffectiveness
PaybackPayback– Expressed as time to recoup investmentExpressed as time to recoup investment
Benefit/Cost ratioBenefit/Cost ratio– Expressed as a ratioExpressed as a ratio
Net Present ValueNet Present Value– Expressed as dollar valueExpressed as dollar value
Levelized CostLevelized Cost– Expressed as cost per kWh or $/MWhExpressed as cost per kWh or $/MWh
slide 32
Northwest Power and ConservationCouncil
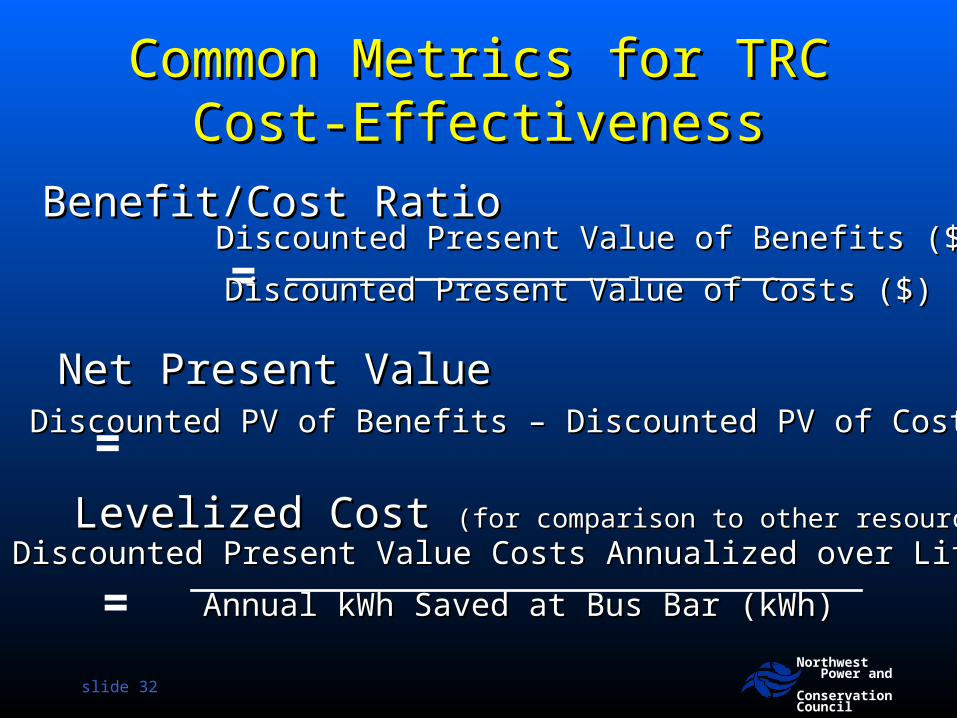
Common Metrics for TRC Cost-Common Metrics for TRC Cost-EffectivenessEffectiveness
=Discounted Present Value of Benefits ($)Discounted Present Value of Benefits ($)
Discounted Present Value of Costs ($)Discounted Present Value of Costs ($)
=Discounted Present Value Costs Annualized over Life ($)Discounted Present Value Costs Annualized over Life ($)
Annual kWh Saved at Bus Bar (kWh)Annual kWh Saved at Bus Bar (kWh)
Benefit/Cost RatioBenefit/Cost Ratio
Net Present ValueNet Present Value
Levelized Cost Levelized Cost (for comparison to other resources)(for comparison to other resources)
= Discounted PV of Benefits – Discounted PV of Costs ($)Discounted PV of Benefits – Discounted PV of Costs ($)
slide 33
Northwest Power and ConservationCouncil
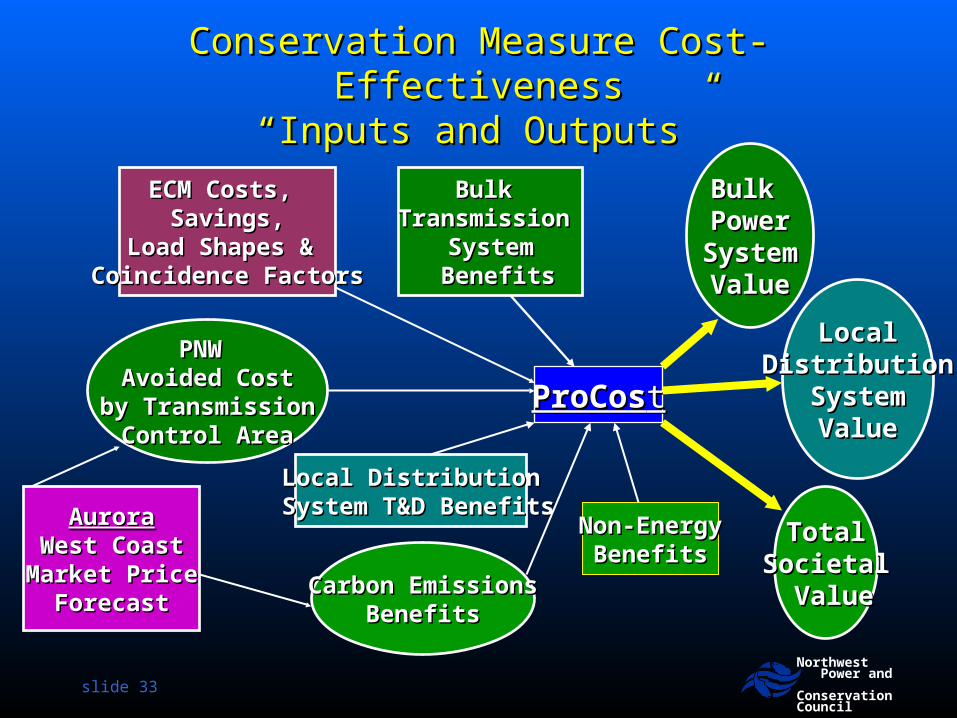
Conservation Measure Cost-EffectivenessConservation Measure Cost-Effectiveness“Inputs and Outputs”“Inputs and Outputs”
AuroraAuroraWest CoastWest Coast
Market PriceMarket PriceForecastForecast
ECM Costs, ECM Costs, Savings,Savings,
Load Shapes & Load Shapes & Coincidence FactorsCoincidence Factors
PNW PNW Avoided CostAvoided Cost
by Transmissionby TransmissionControl AreaControl Area
ProCosProCostt
Bulk Bulk PowerPowerSystemSystemValueValue
Carbon EmissionsCarbon EmissionsBenefitsBenefits
Local DistributionLocal Distribution System T&D BenefitsSystem T&D Benefits
Bulk Bulk Transmission Transmission
SystemSystem BenefitsBenefits
LocalLocalDistributionDistribution
SystemSystemValueValue
TotalTotalSocietalSocietal ValueValue
Non-EnergyNon-EnergyBenefitsBenefits
slide 34
Northwest Power and ConservationCouncil
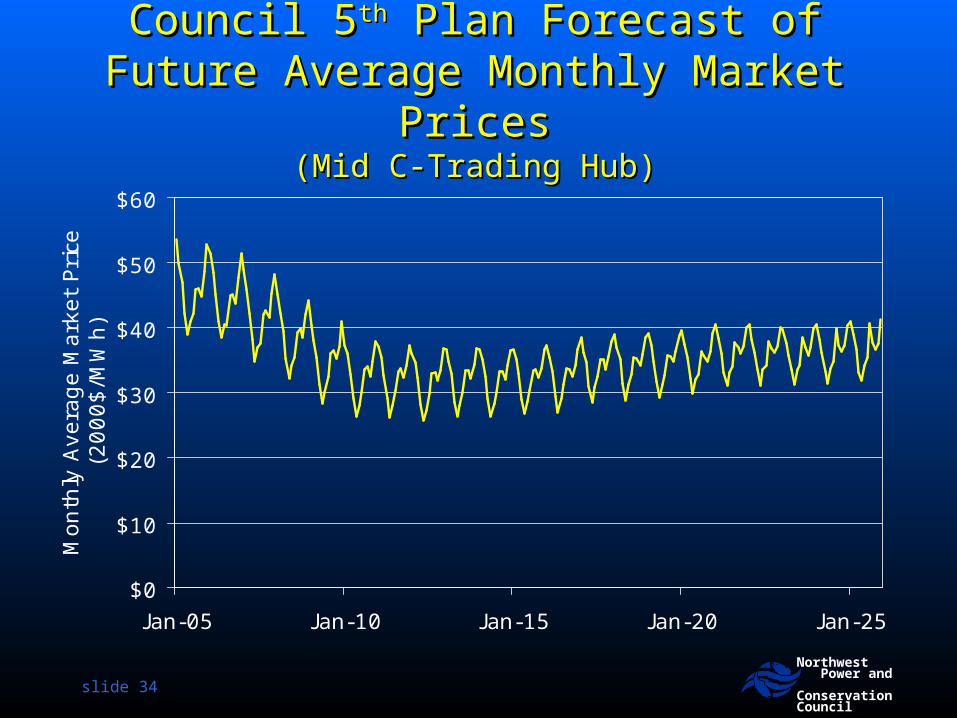
Council 5Council 5thth Plan Forecast of Future Plan Forecast of Future Average Monthly Market PricesAverage Monthly Market Prices
(Mid C-Trading Hub)(Mid C-Trading Hub)
$0
$10
$20
$30
$40
$50
$60
Jan-05 Jan-10 Jan-15 Jan-20 Jan-25
Month
ly A
vera
ge M
ark
et
Pri
ce
(2000$/M
Wh)

slide 35
Northwest Power and ConservationCouncil
Typical “On-Peak” Load ProfilesTypical “On-Peak” Load Profiles
0%
5%
10%
15%
20%
25%
30%
35%
J an Feb Mar Apr May J un J ul Aug Sep Oct Nov Dec
Perc
ent
of
Annual U
se
Res. Space Heating
Res. Central AC
Irrg. Agriculture
Commerical HVAC

slide 36
Northwest Power and ConservationCouncil
Forecast On-Peak Market Power Forecast On-Peak Market Power Prices by Month and YearPrices by Month and Year
$0
$50
$100
$150
$200
$250
$300
Jan Feb Mar Apr May Jun Jul Aug Sep Oct Nov Dec
Whole
sale
Mark
et
Pow
er
Pri
ce (
Mid
C -
$/M
Wh 2
000$)
20052010201520202025

slide 37
Northwest Power and ConservationCouncil
Typical Off-Peak Load ProfilesTypical Off-Peak Load Profiles
0%
1%
2%
3%
4%
5%
6%
7%
8%
Jan Feb Mar Apr May Jun Jul Aug Sep Oct Nov Dec
Per
Cent
of
Annual U
se
Res. Space HeatingRes. Central ACI rrg. AgricultureCommerical HVAC

slide 38
Northwest Power and ConservationCouncil
Forecast Off-Peak Market Power Forecast Off-Peak Market Power Prices by Month and YearPrices by Month and Year
$0
$5
$10
$15
$20
$25
$30
$35
J an Feb Mar Apr May J un J ul Aug Sep Oct Nov Dec
Whole
sale
Mark
et
Pow
er
Pri
ce (
Mid
C -
$/M
Wh 2
00
0$
)
20052010201520202025

slide 39
Northwest Power and ConservationCouncil
The Council’s Conservation’s Cost-Effectiveness The Council’s Conservation’s Cost-Effectiveness Analysis Compares Savings with Forecast Market Analysis Compares Savings with Forecast Market
Prices Prices at the time the savings occurat the time the savings occur
Four “Load Segments” are used to Four “Load Segments” are used to compute the value of savings:compute the value of savings:– Weekday Weekday “Peak”“Peak” Load Hours Load Hours – Weekday Weekday “Ramp Up/Ramp Down”“Ramp Up/Ramp Down”
hours and hours and “Weekend Peak”“Weekend Peak” Load Load HoursHours
– Weekday and Weekday and “Weekend Off-Peak”“Weekend Off-Peak” hourshours
– Weekend and Holiday Weekend and Holiday “Very-Low”“Very-Low”

slide 40
Definition of Load Segment Hours
Hour Monday Tuesday WednesdayThursday Friday Saturday Sunday Holiday1 3 3 3 3 3 4 4 42 3 3 3 3 3 4 4 43 3 3 3 3 3 4 4 44 3 3 3 3 3 4 4 45 2 2 2 2 2 2 2 46 2 2 2 2 2 2 2 37 2 2 2 2 2 2 2 38 2 2 2 2 2 2 2 39 1 1 1 1 1 2 2 2
10 1 1 1 1 1 2 2 211 1 1 1 1 1 2 2 212 1 1 1 1 1 2 2 213 1 1 1 1 1 2 2 214 1 1 1 1 1 2 2 215 1 1 1 1 1 2 2 216 1 1 1 1 1 2 2 217 1 1 1 1 1 2 2 218 1 1 1 1 1 2 2 219 2 2 2 2 2 2 2 320 2 2 2 2 2 2 2 321 2 2 2 2 2 2 2 322 2 2 2 2 2 2 2 423 3 3 3 3 3 4 4 424 3 3 3 3 3 4 4 4

slide 41
Northwest Power and ConservationCouncil
Each Conservation Measure Has a Each Conservation Measure Has a Different “Cost-Effectiveness” Limit Based Different “Cost-Effectiveness” Limit Based
on When It’s Savings Occuron When It’s Savings Occur
$0
$10
$20
$30
$40
$50
$60
$70
$80
Jan Feb Mar Apr May Jun Jul Aug Sep Oct Nov Dec
PV
Mon
thly
Mar
ket
Pric
e ($
/MW
h 20
00$)
0%
10%
20%
30%
40%
50%
60%
70%
80%
Sha
re o
f M
onth
ly S
avin
gs
Space Heating Market Price Central AC Market Price
Space Heating Savings Central AC Savings
Weighted Average Value of Space Heating Savings = $41/MWh
Weighted Average Value of Space CoolingSavings = $78/MWh

slide 42
Northwest Power and ConservationCouncil
Impact Load Shape on Regional Bulk Impact Load Shape on Regional Bulk Power System ValuePower System Value
Impact on Present Value Benefit (20-year Impact on Present Value Benefit (20-year measure life)measure life)– Low EndLow End
»Street Lighting - $41/MWhStreet Lighting - $41/MWh»Residential Space Heating - $41/MWhResidential Space Heating - $41/MWh
– High EndHigh End»Central AC - $78/MWhCentral AC - $78/MWh»Solar Water Heating - $74/MWhSolar Water Heating - $74/MWh
slide 43
Northwest Power and ConservationCouncil
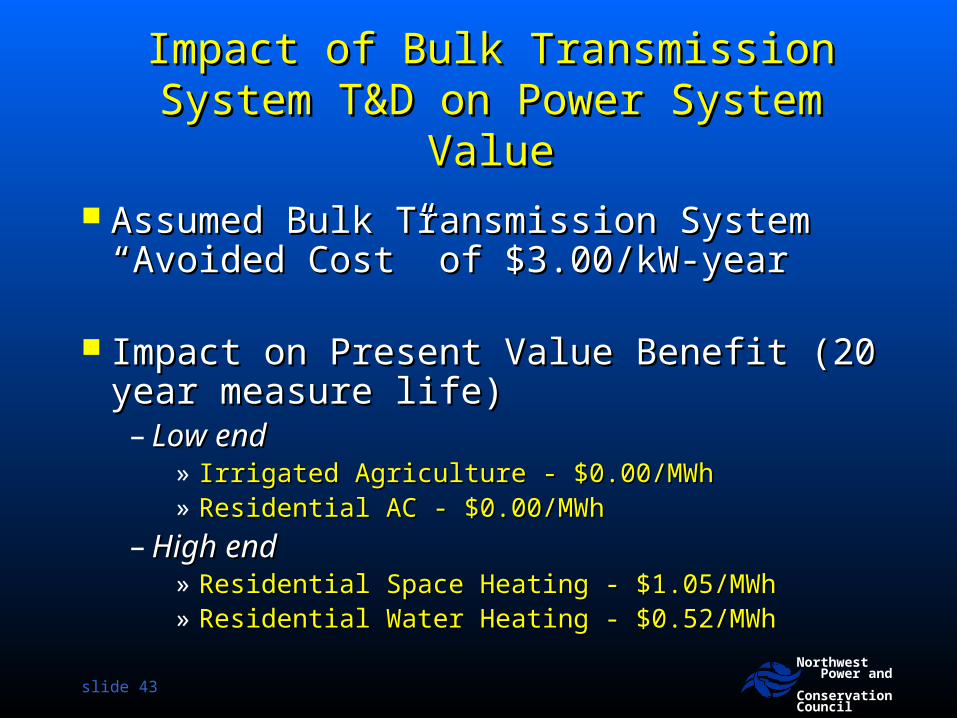
Impact of Bulk Transmission System Impact of Bulk Transmission System T&D on Power System ValueT&D on Power System Value
Assumed Bulk Transmission System “Avoided Assumed Bulk Transmission System “Avoided Cost” of $3.00/kW-year Cost” of $3.00/kW-year
Impact on Present Value Benefit (20 year Impact on Present Value Benefit (20 year measure life)measure life)– Low endLow end
» Irrigated Agriculture - $0.00/MWhIrrigated Agriculture - $0.00/MWh» Residential AC - $0.00/MWhResidential AC - $0.00/MWh
– High endHigh end» Residential Space Heating - $1.05/MWhResidential Space Heating - $1.05/MWh» Residential Water Heating - $0.52/MWhResidential Water Heating - $0.52/MWh
slide 44
Northwest Power and ConservationCouncil
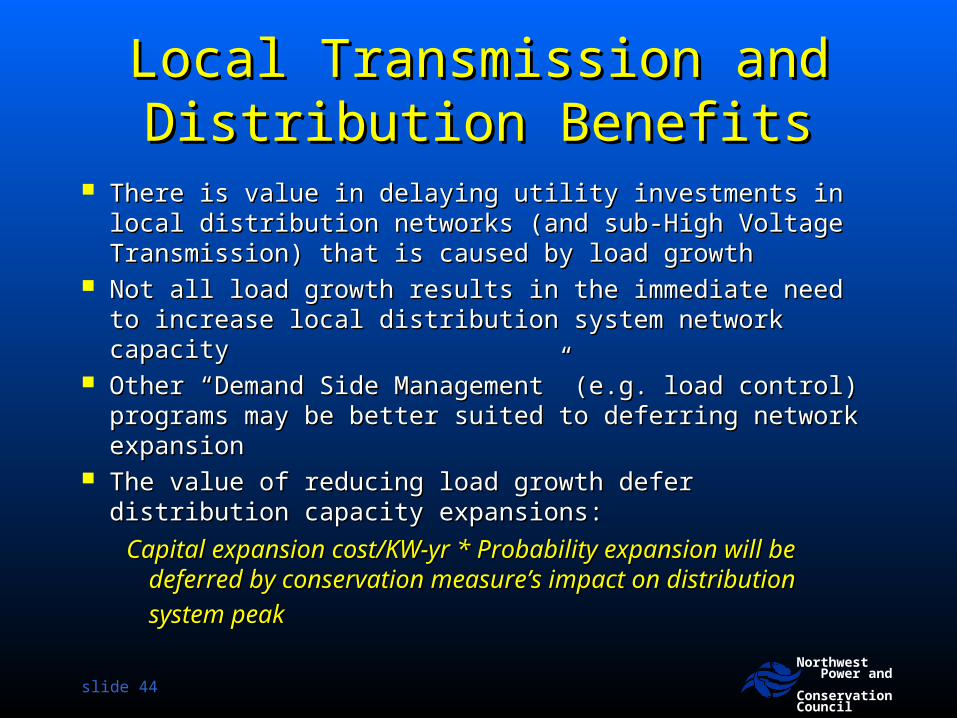
Local Transmission and Local Transmission and Distribution BenefitsDistribution Benefits
There is value in delaying utility investments in local distribution There is value in delaying utility investments in local distribution networks (and sub-High Voltage Transmission) that is caused by networks (and sub-High Voltage Transmission) that is caused by load growthload growth
Not all load growth results in the immediate need to increase Not all load growth results in the immediate need to increase local distribution system network capacitylocal distribution system network capacity
Other “Demand Side Management” (e.g. load control) programs Other “Demand Side Management” (e.g. load control) programs may be better suited to deferring network expansionmay be better suited to deferring network expansion
The value of reducing load growth defer distribution capacity The value of reducing load growth defer distribution capacity expansions:expansions:
Capital expansion cost/KW-yr * Probability expansion will be Capital expansion cost/KW-yr * Probability expansion will be deferred by conservation measure’s impact on distribution deferred by conservation measure’s impact on distribution
system peaksystem peak

slide 45
Northwest Power and ConservationCouncil
Illustrative Local Distribution Illustrative Local Distribution System T & D BenefitsSystem T & D Benefits
Company Transmission Distribution Total
PacifiCorp $21.40/ kW-yr $57.59/ kW-yr $78.99/ kW-yr
PGE $7.18/ kW-yr $15.40/ kW-yr $22.58/ kW-yr
SnohPUD NA $9.50/ kW-yr $NA

slide 46
Northwest Power and ConservationCouncil
Impact of Local T&D on Impact of Local T&D on Power System ValuePower System Value
Assumed Local Distribution System “Avoided Cost” of Assumed Local Distribution System “Avoided Cost” of $20/kW-year$20/kW-year
Impact on Present Value Benefit (20-year measure Impact on Present Value Benefit (20-year measure life)life)– Low endLow end
» Solar PV - $0.14/MWhSolar PV - $0.14/MWh» Solar Water Heating - $0.30 MWhSolar Water Heating - $0.30 MWh
– High endHigh end» Residential Ovens - $26/MWhResidential Ovens - $26/MWh» Residential Air Source Heat Pumps - $19/MWhResidential Air Source Heat Pumps - $19/MWh

slide 47
Northwest Power and ConservationCouncil
Environmental Externalities Environmental Externalities ValueValue
Based on Carbon Dioxide Emissions from Based on Carbon Dioxide Emissions from West Coast Power SystemWest Coast Power System
Consensus that $0 is wrongConsensus that $0 is wrong Used $5- $40/ton of CO2 emittedUsed $5- $40/ton of CO2 emitted Varied amount and future date of carbon Varied amount and future date of carbon
control implementationcontrol implementation Adds about $3/MWh to Present Value Benefit Adds about $3/MWh to Present Value Benefit
of Savings (also varies by shape of savings)of Savings (also varies by shape of savings)

slide 48
Northwest Power and ConservationCouncil
Expected Value of CO2 Expected Value of CO2 Control Cost by YearControl Cost by Year
$0
$1
$2
$3
$4
$5
$6
$7
$8
$9
$10
S-05 S-09 S-13 S-17 S-21 S-25Year
Expect
ed V
alu
e C
arb
on C
ost
(2
004$/t
on)

slide 49
Northwest Power and ConservationCouncil
COCO22/MWh Trends for Conservation /MWh Trends for Conservation Savings by Load SegmentSavings by Load Segment
0
0.2
0.4
0.6
0.8
1
2005 2010 2015 2020 2025
CO
2 O
ffse
t (t
on
s/M
Wh
saved
)
Segment 1
Segment 2
Segment 3Segment 4

slide 50
Northwest Power and ConservationCouncil
““Cost-Effectiveness” of Conservation Varies by Cost-Effectiveness” of Conservation Varies by PerspectivePerspective
Energy Star Clothes Washer (MEF 2.2) Energy Star Clothes Washer (MEF 2.2) with Electric Water Heating and Electric Dryerwith Electric Water Heating and Electric Dryer
Present Value Capital Cost = $0.44/kWhPresent Value Capital Cost = $0.44/kWh– Value to Bulk Power SystemValue to Bulk Power System
= $53/MWh (B/C = 1.17)= $53/MWh (B/C = 1.17)– Value to Local Distribution System (includes bulk Value to Local Distribution System (includes bulk
power system value)power system value)= $66/MWh (B/C = 1.47)= $66/MWh (B/C = 1.47)
– Value to Region/Society (includes detergent & water Value to Region/Society (includes detergent & water savings, plus carbon credit)savings, plus carbon credit)= $123/MWh (B/C = 2.8)= $123/MWh (B/C = 2.8)
slide 51
Northwest Power and ConservationCouncil
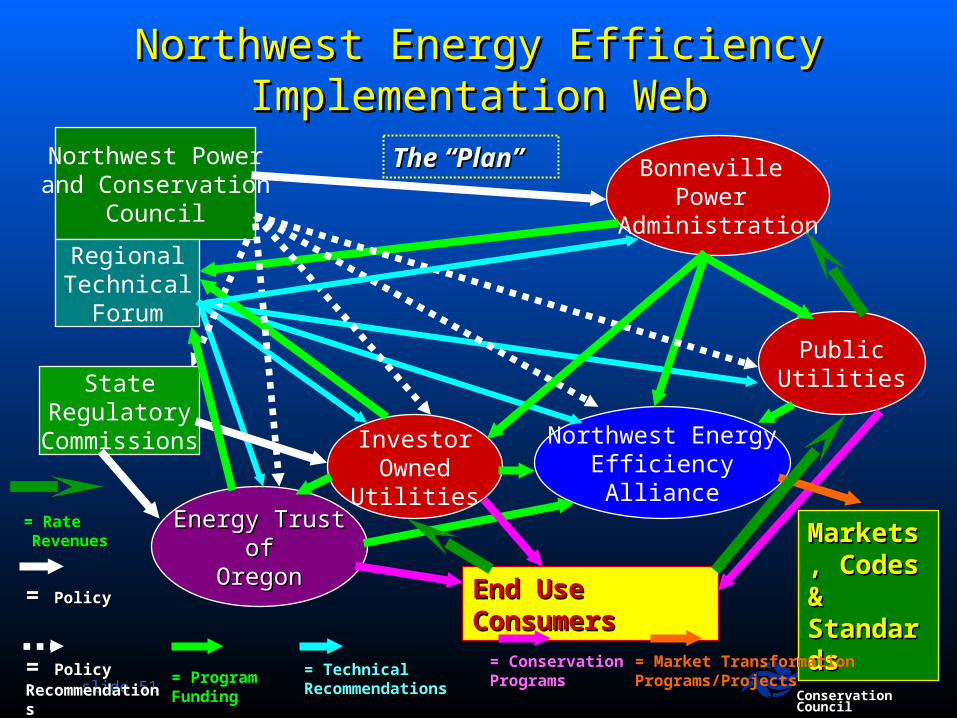
Northwest Energy Efficiency Northwest Energy Efficiency Implementation WebImplementation Web
Bonneville Power
Administration
PublicUtilities
InvestorOwnedUtilities
Northwest Powerand Conservation
Council
StateRegulatory
Commissions Northwest EnergyEfficiencyAlliance
Energy TrustEnergy Trustofof
OregonOregon
RegionalTechnical
Forum
End Use ConsumersEnd Use Consumers
Markets, Markets, Codes & Codes & StandardsStandards
= = Policy Policy RecommendationsRecommendations
= Technical= TechnicalRecommendationsRecommendations
= Program= ProgramFundingFunding
= Conservation= ConservationProgramsPrograms
= Market TransformationPrograms/Projects
The “Plan”The “Plan”
= = Policy Policy
= Rate= Rate RevenuesRevenues

slide 52
Northwest Power and ConservationCouncil
55thth Plan Identified Nearly 4,600 MWa Plan Identified Nearly 4,600 MWa of “Technically Available” of “Technically Available”
Conservation PotentialConservation Potential
0
500
1,000
1,500
2,000
2,500
3,000
3,500
4,000
4,500
5,000
$10 $20 $30 $40 $50 $60 $70 $80 $90 $100 $100+
Real Levelized Cost (2000$/MWH)
Ave
rag
e M
eg
aw
att
s b
y 2
02
5 Lost Opportunity Conservation
Dispatchable Conservation

slide 53
Northwest Power and ConservationCouncil
Adjustments to 5Adjustments to 5thth Plan’s Plan’s Conservation Resource PotentialConservation Resource Potential Reductions in Available PotentialReductions in Available Potential
– Program AccomplishmentsProgram Accomplishments– Changes in Law Changes in Law
» Federal Standards for general service lightingFederal Standards for general service lighting» State Building CodesState Building Codes
– Changes in MarketsChanges in Markets» Improved “Current Practice” due to Energy Star, LEED, Improved “Current Practice” due to Energy Star, LEED,
Programs, Market TransformationPrograms, Market Transformation» Other Changes to Federal Standards (10 adopted, 21 Other Changes to Federal Standards (10 adopted, 21
under revision, and 12 with effective dates by 2014)under revision, and 12 with effective dates by 2014)– Changes in ForecastChanges in Forecast
» Less new commercial floor areaLess new commercial floor area» Lower industrial forecastLower industrial forecast
slide 54
Northwest Power and ConservationCouncil
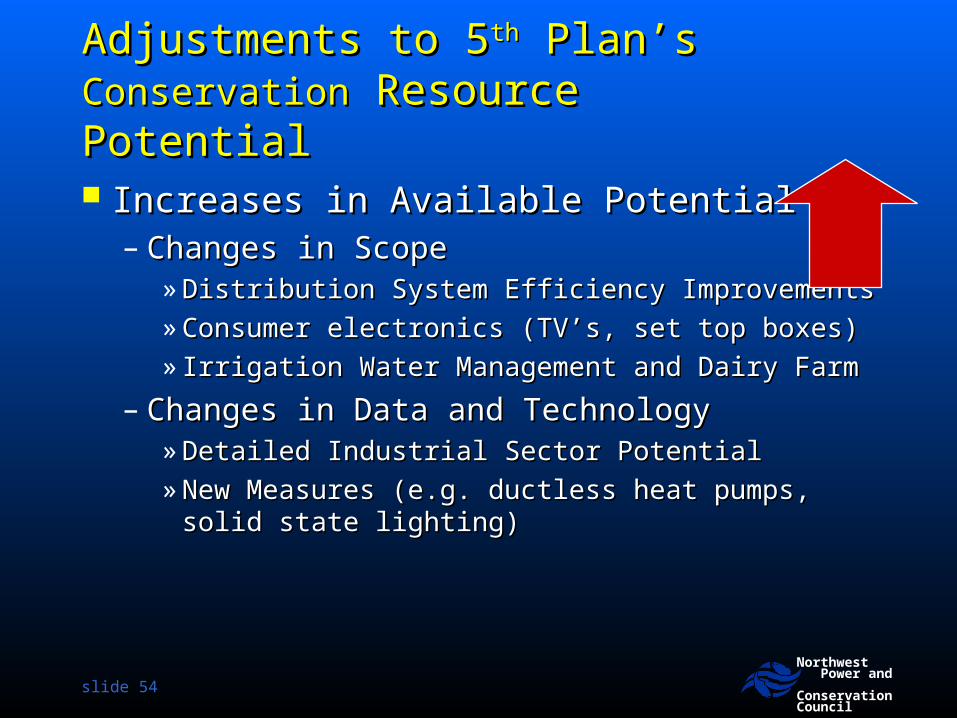
Adjustments to 5Adjustments to 5thth Plan’s Plan’s ConservationConservation Resource Potential Resource Potential
Increases in Available PotentialIncreases in Available Potential– Changes in ScopeChanges in Scope
» Distribution System Efficiency ImprovementsDistribution System Efficiency Improvements» Consumer electronics (TV’s, set top boxes)Consumer electronics (TV’s, set top boxes)» Irrigation Water Management and Dairy FarmIrrigation Water Management and Dairy Farm
– Changes in Data and TechnologyChanges in Data and Technology» Detailed Industrial Sector PotentialDetailed Industrial Sector Potential» New Measures (e.g. ductless heat pumps, solid New Measures (e.g. ductless heat pumps, solid
state lighting)state lighting)

slide 55
Northwest Power and ConservationCouncil
Avoided Costs Are Forecast to Avoided Costs Are Forecast to Be Significantly HigherBe Significantly Higher
$0
$10
$20
$30
$40
$50
$60
$70
$80
$90
2007 2010 2013 2016 2019 2022 2025 2028
Wh
ole
sale
Mark
et
Pri
ce
(20
06
$/M
Wh
)
5th Plan
Preliminary Draft 6th Plan

slide 56
Northwest Power and ConservationCouncil
Energy Efficiency is Still the Energy Efficiency is Still the Cheapest OptionCheapest Option
Assumptions :
Efficiency Cost = Average Cost of All Conservation Targeted in 5th Power Plan
Transmission cost & losses to point of LSE wholesale delivery
No federal investment or production tax credits
Baseload operation (CC - 85%CF, Nuclear 87.5% CF, SCPC 85%, Wind 32% CF)
Medium NG and coal price forecast (Proposed 6th Plan)
Bingaman/Specter safety valve CO2 cost
$0
$20
$40
$60
$80
$100
$120
$140
$160
Energ
y Effic
iency
Gas C
omb
Cycle
MT
Wind
(Loc
al)
Advan
ced N
uclea
r
Super
critic
al PC (W
A/OR)
Colum
bia B
asin
Wind
AB Wind
> W
A/OR
ID W
ind (L
ocal)
MT
Wind
> W
A/OR
Le
veliz
ed
Life
cycl
e C
ost
(2
00
6$
/MW
h)
Emission (CO2) cost
Transmission & Losses
System Integration
Plant costs
slide 57
Northwest Power and ConservationCouncil
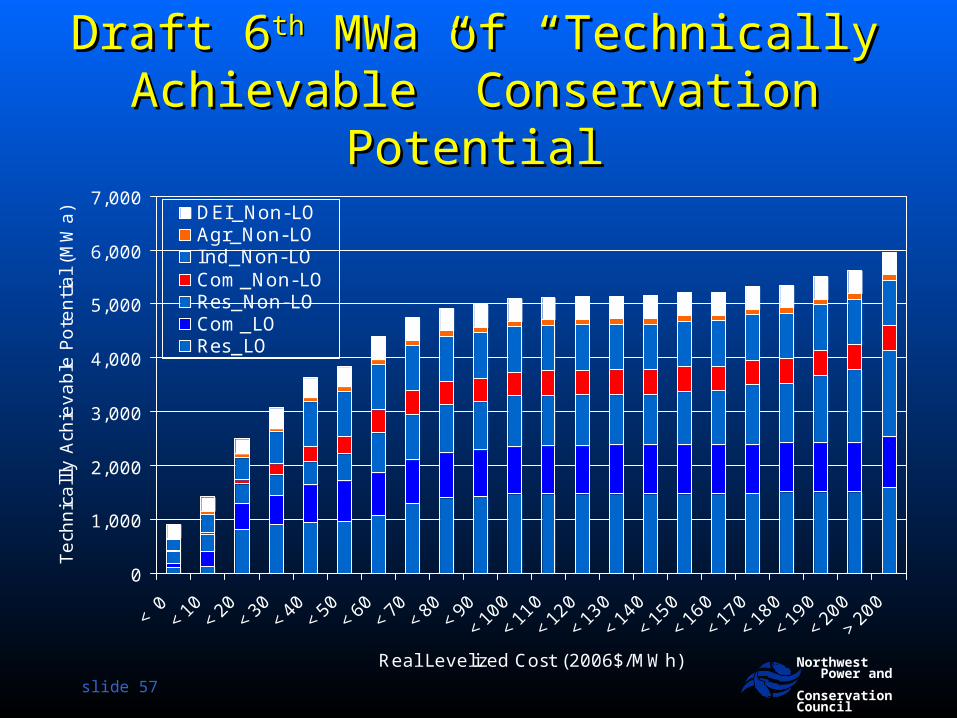
Draft 6Draft 6thth MWa of “Technically MWa of “Technically Achievable” Conservation PotentialAchievable” Conservation Potential
0
1,000
2,000
3,000
4,000
5,000
6,000
7,000
< 0
<10
<20
<30
<40
<50
<60
<70
<80
<90
<10
0
<11
0
<12
0
<13
0
<14
0
<15
0
<16
0
<17
0
<18
0
<19
0
<20
0
>20
0
Real Levelized Cost (2006$/MWh)
Tech
nic
alll
y A
chie
vable
Pote
nti
al (M
Wa) DEI_Non-LO
Agr_Non-LOInd_Non-LOCom_Non-LORes_Non-LOCom_LORes_LO
slide 58
Northwest Power and ConservationCouncil
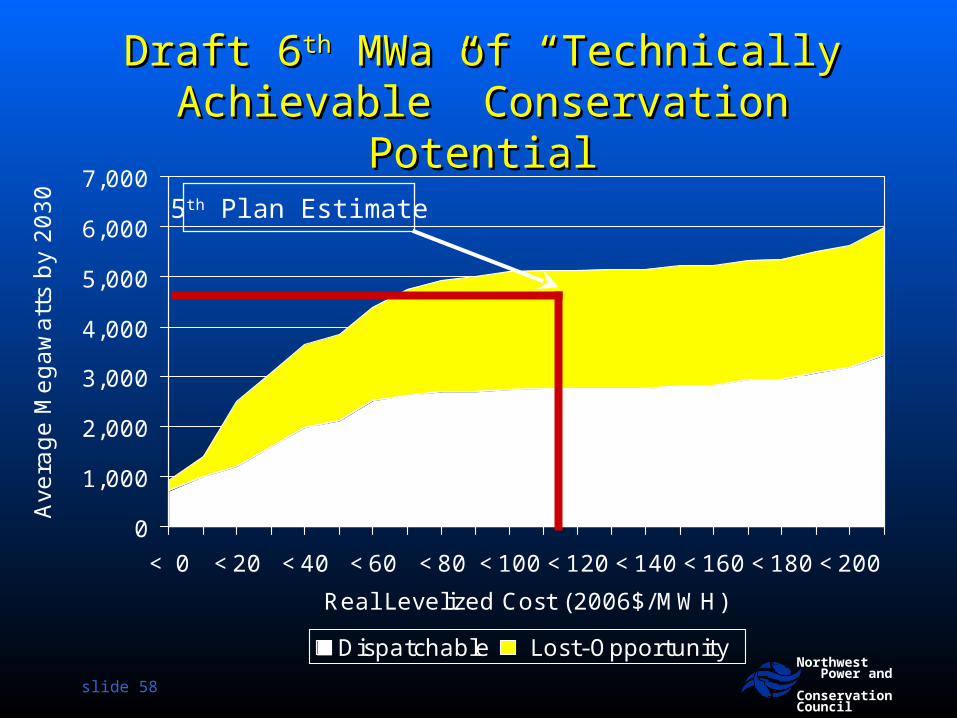
Draft 6Draft 6thth MWa of “Technically MWa of “Technically Achievable” Conservation PotentialAchievable” Conservation Potential
0
1,000
2,000
3,000
4,000
5,000
6,000
7,000
< 0 <20 <40 <60 <80 <100 <120 <140 <160 <180 <200
Real Levelized Cost (2006$/MWH)
Ave
rage M
egaw
att
s by
2030
Dispatchable Lost-Opportunity
5th Plan Estimate