northwest alliance for computational science & engineering oregon state university usability...
TRANSCRIPT
Northwest Alliance for Computational Science & Engineering Oregon State University
Usability Considerations in Designing Tools for the Grid
Cherri Pancake
NW Alliance for Computational Science & Engineering
Oregon State University

Northwest Alliance for Computational Science & Engineering
Tools for the Grid Are the Hardest Yet
Like predecessors (parallel tools), must deal with• Extreme variations in scale• Rapidly evolving hardware/software environment• Competing demands of OS and middleware
Grid tools add new challenges as well• Heterogeneous resources• Extremely dynamic resource availability• Lack of central management

Northwest Alliance for Computational Science & Engineering
And Then Consider the Users...
"Grid users" are much more diverse than parallel users
Direct (primary) users• Grid application developers• Resource providers• Resource managers
Indirect (secondary) users• End-users of applications • End-users of data• End-users of second-order products
(analyses/visualization)

Northwest Alliance for Computational Science & Engineering
NEES Example: Resource/User Diversity
NEESConsortium
ExperimentalData Repositories
ComputationalData Repositories
Unique LaboratoryFacilitiesEquipment
Site 1
EquipmentSite 2
EquipmentSite 3
EquipmentSite 15
. .
.
OtherSite A
OtherSite B
Practitioners
EmergencyCommunities
K-14Education
UserCommunities
Earth.Eng.Researchers
NEESgrid

Northwest Alliance for Computational Science & Engineering
Electrical Power Telephones1 or 2 choices 10-20 optionsPlug it in Dial 7 or 10 or 11 or ~15
or (N+14) digits
Charged for usage Charged fee + (fee + usage)
+ (fee+usage+premium)
…
Usability Is More Important Than Ever
Back to the public utilities analogy…1. The resources consumers want – when they want
2. Consumers don’t care how it really works
3. Consumers pay for what they use
Grids100s-millionsFew clicks to total
rewriteOpen issue (but will be complex)
Northwest Alliance for Computational Science & Engineering
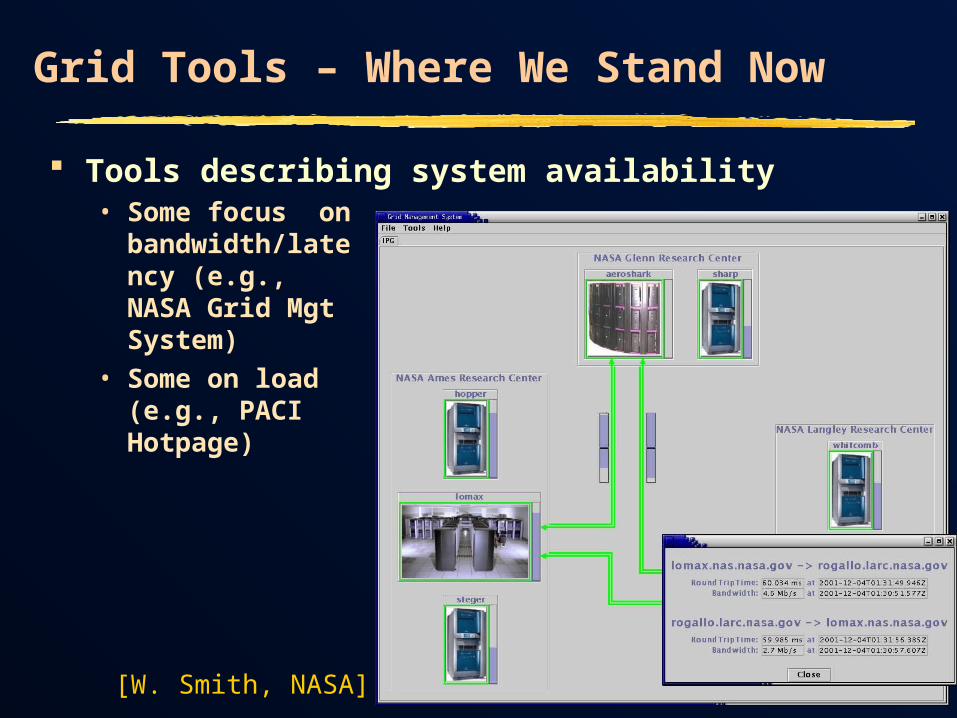
Grid Tools – Where We Stand Now
Tools describing system availability• Some focus on
bandwidth/latency (e.g., NASA Grid Mgt System)
• Some on load (e.g., PACI Hotpage)
[W. Smith, NASA]

Northwest Alliance for Computational Science & Engineering
Grid Tools – Where We Stand Now (2)
Environments for launching/monitoring applications• Some specifically for
parameter studies (e.g., Nimrod/G) – no special code needed
• Some are programming/execution environments (Legion, GrADS)
Cost
Legion hosts
Globus Hosts
Bezek is in both domains
Deadline
[Abramson/Buyya/Giddy,Monash U]
Northwest Alliance for Computational Science & Engineering
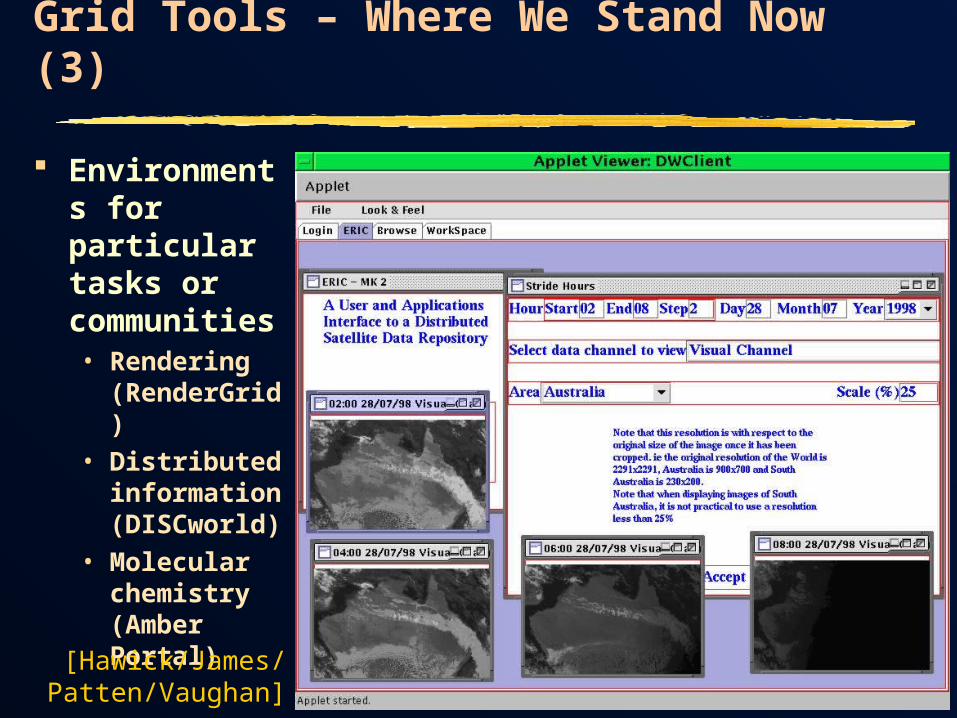
Grid Tools – Where We Stand Now (3)
Environments for particular tasks or communities• Rendering
(RenderGrid)• Distributed
information (DISCworld)
• Molecular chemistry (Amber Portal)
[Hawick/James/Patten/Vaughan]

Northwest Alliance for Computational Science & Engineering
Do They Look Familiar?
Initial grid tools simply extend parallel tools• No significant new conventions or techniques
• No notable improvements in usability
… although we know the challenges are tougher
… although users have never liked parallel tools

Northwest Alliance for Computational Science & Engineering
The resources consumers want – when they want Consumers don’t care how it really works Consumers pay for what they use
What Grid Users Are Expecting …

Northwest Alliance for Computational Science & Engineering
Usability Goals for Grid Infrastructures
If our intention is
1. The resources consumers want – when they want
2. Consumers don’t care how it really works
3. Consumers pay for what they use
Our immediate goal should be
Make complex, multi-dimensional environments intelligible
Encourage users to "let the system do it“
Make cost-effective alternatives clear

Northwest Alliance for Computational Science & Engineering
Portraying Grid Info Effectively
Grid = complex, dynamic resource landscape Requires multidimensional representations• Identifying needed resources (e.g., data, specialized
equipment)• Mapping application components to resources• Understanding state of application and resources• Studying performance (now or post-mortem)• Maintenance (adding resources, assigning costs,
analyzing system performance, etc.)
Graphical techniques that help improve usability
Northwest Alliance for Computational Science & Engineering
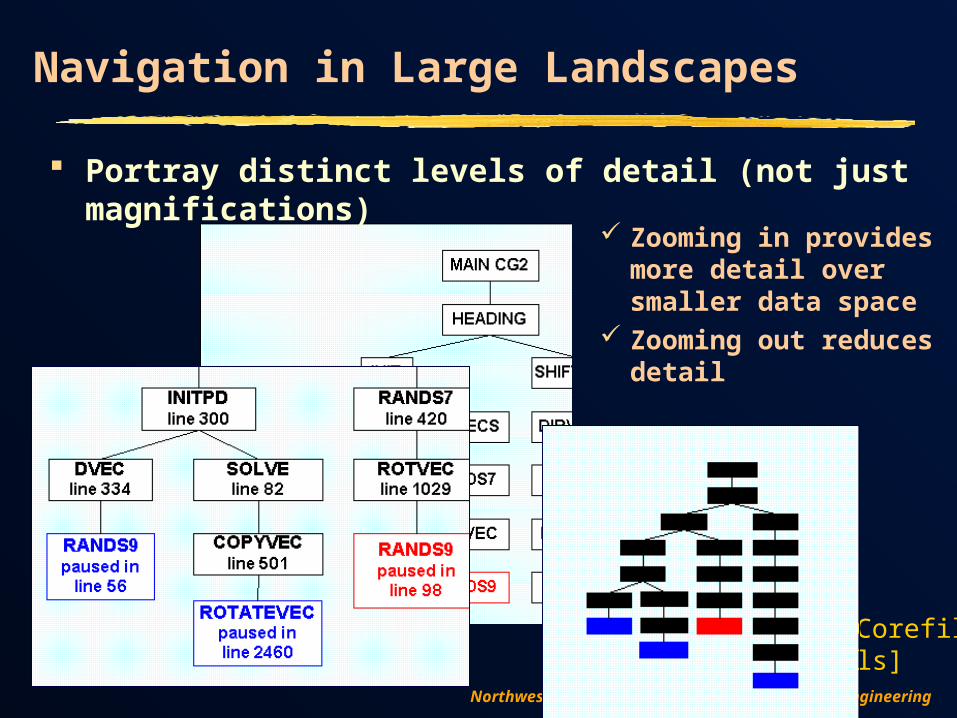
[Lightweight CorefileBrowser, Ptools]
Zooming in provides more detail over smaller data space
Zooming out reduces detail
Navigation in Large Landscapes
Portray distinct levels of detail (not just magnifications)

Northwest Alliance for Computational Science & Engineering
Navigation in Large Landscapes (2)
Large data spaces (even 2-D) require special navigational aids
Thumbnail images Give user sense
of context Support fast
movement through large data space
[xprofiler, IBM]

Northwest Alliance for Computational Science & Engineering
Navigation in Large Landscapes (3)
Caveat: “Thumbnail” may end up much larger than “main” image
[xprofiler, IBM]

Northwest Alliance for Computational Science & Engineering
Navigation in Large Landscapes (4)
Navigation through time-series info can be similar
Strip mural images Provide
context Support
movement Can be
extended to support comparison
[Jerding & Stasko,Ga Tech]
Northwest Alliance for Computational Science & Engineering
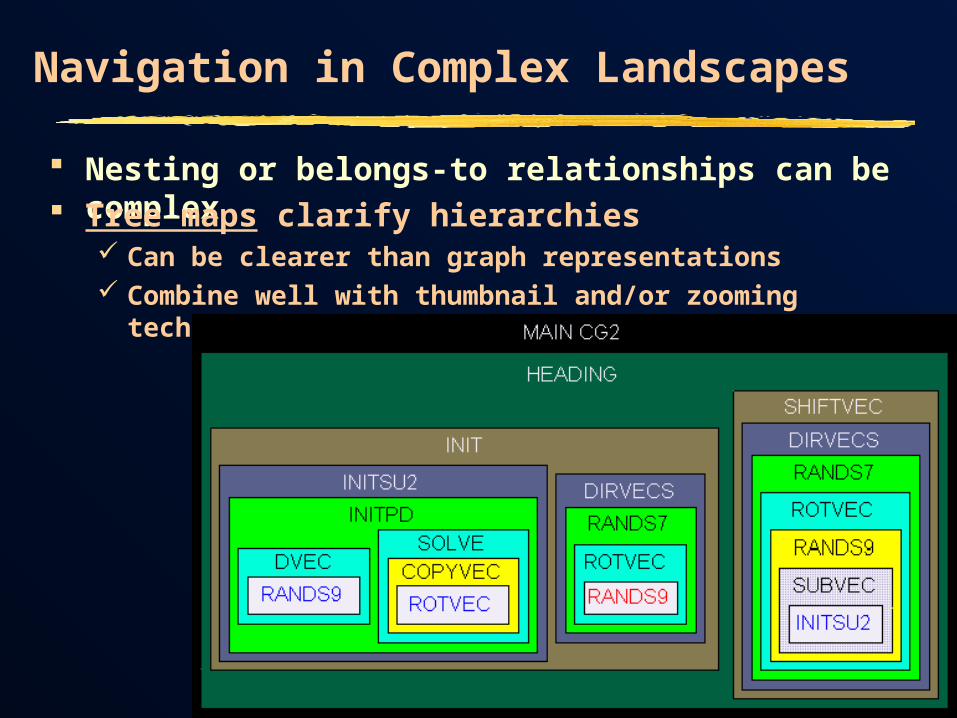
Navigation in Complex Landscapes
Nesting or belongs-to relationships can be complex Tree maps clarify hierarchies
Can be clearer than graph representations Combine well with thumbnail and/or zooming techniques
Northwest Alliance for Computational Science & Engineering
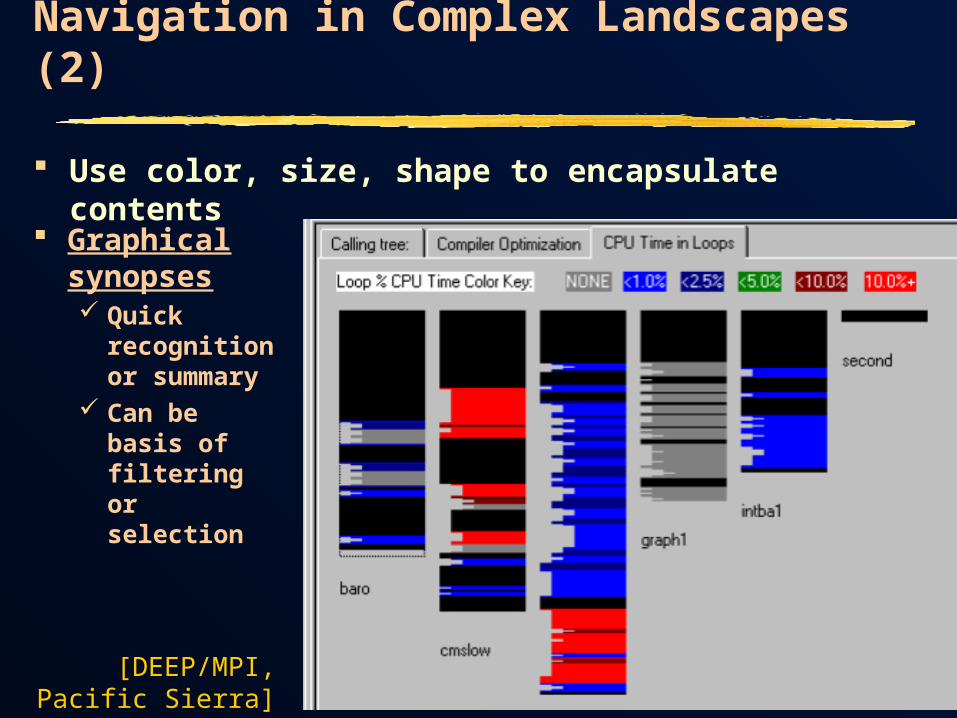
Navigation in Complex Landscapes (2)
Use color, size, shape to encapsulate contents
Graphical synopses Quick
recognition or summary
Can be basis of filtering or selection
[DEEP/MPI,Pacific Sierra]

Northwest Alliance for Computational Science & Engineering
Integrating Multidimensional Data
Can also use thumbnails/murals to integrate distinct types of data
Synchronized summaries Selection in one
data space triggers corresponding movement in another
[Lightweight CorefileBrowser, Ptools]
Northwest Alliance for Computational Science & Engineering
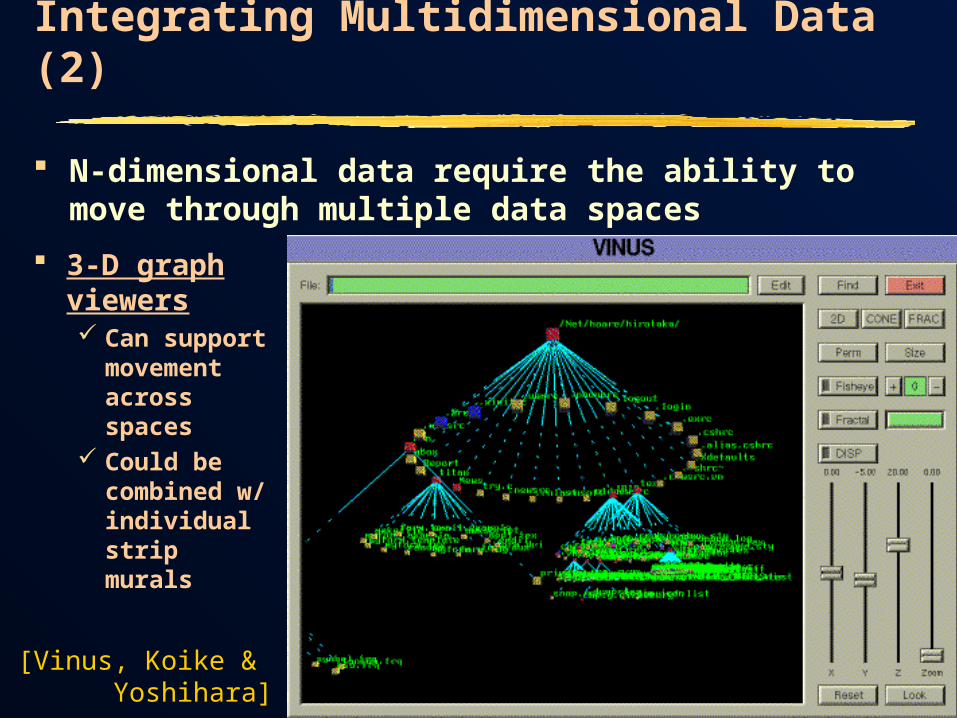
Integrating Multidimensional Data (2)
N-dimensional data require the ability to move through multiple data spaces
3-D graph viewers Can support
movement across spaces
Could be combined w/ individual strip murals
[Vinus, Koike & Yoshihara]
Northwest Alliance for Computational Science & Engineering
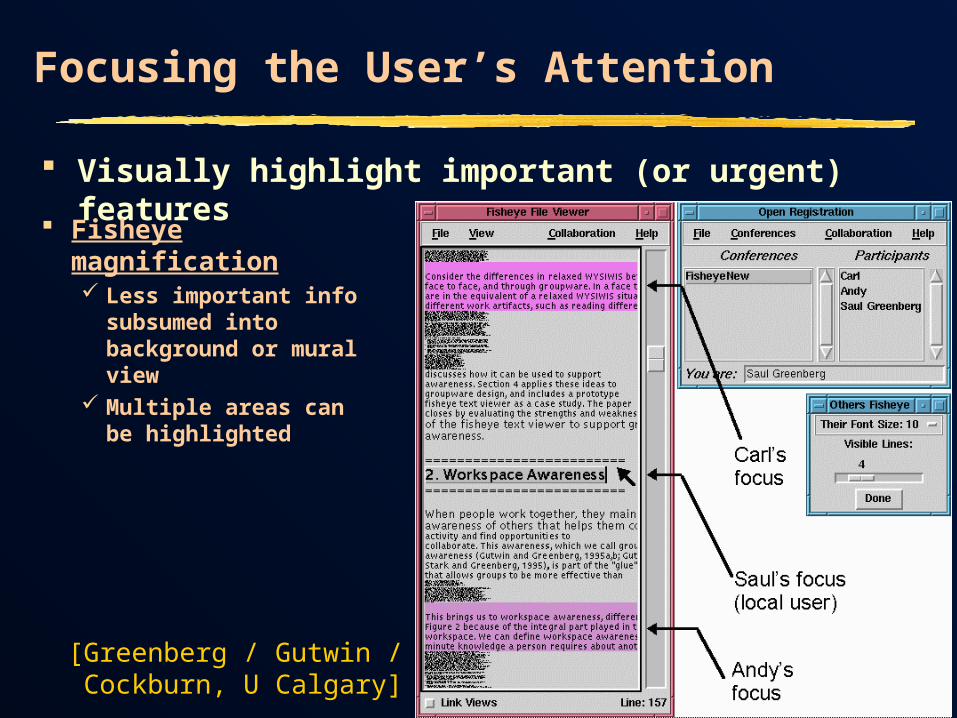
Focusing the User’s Attention
Visually highlight important (or urgent) features
Fisheye magnification Less important info
subsumed into background or mural view
Multiple areas can be highlighted
[Greenberg / Gutwin /Cockburn, U Calgary]
Northwest Alliance for Computational Science & Engineering
Focusing the User’s Attention (2)
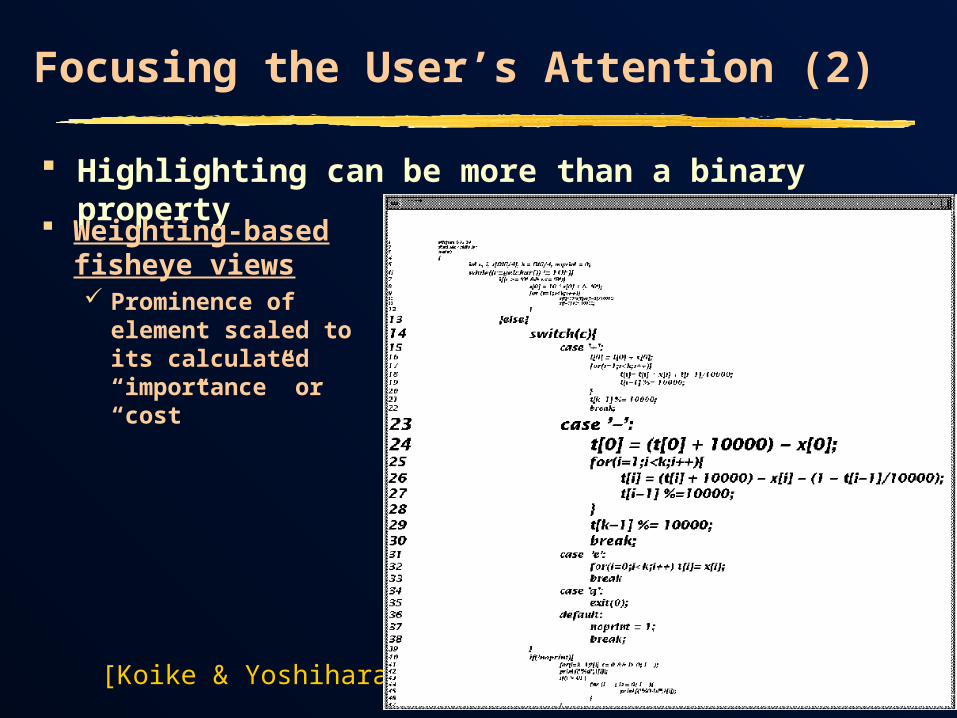
Highlighting can be more than a binary property
Weighting-based fisheye views Prominence of
element scaled to its calculated “importance” or “cost”
[Koike & Yoshihara]

Northwest Alliance for Computational Science & Engineering
Conclusions
Grid tools face more & harder challenges than parallel tools• We can’t continue basing tool strategies on parallel
solutions
Meanwhile, many new techniques have emerged• How to represent large, multidimensional data
spaces• How users like to navigate through information
Need to leverage that work – to ensure that grid tools meet key usability goals

Northwest Alliance for Computational Science & Engineering
“Think back … which keys did you press?”
Grid User of the Future???