northern trust asset management passive investing with impact · (fgr) 25+ years experience...
TRANSCRIPT

1 northerntrust.com | © Northern Trust 2017 northerntrust.com | © Northern Trust 2017
Passive Investing with Impact Having Cost Efficient Impact
NORTHERN TRUST ASSET MANAGEMENT
Financial Investigator - The Evolving Landscape of ESG & Impact Investing
Amsterdam. May 23, 2017
Mamadou-Abou Sarr
Global Head of Environmental, Social and Governance Investing

2 northerntrust.com | © Northern Trust 2017
A Few Words About Us

3 northerntrust.com | © Northern Trust 2017
NORTHERN TRUST ASSET MANAGEMENT A leading global investment manager with a client-centric culture rooted in a fiduciary heritage.
TOTAL ASSETS UNDER MANAGEMENT
World’s 13th largest
asset manager $1.0 trillion
TOTAL AUM*
Leveraging the strength of
Northern Trust
Global network of investment
professionals with deep expertise
Demonstrated ability to thrive in
various market environments
Progressive thought leadership
and unique insights
Solving complex global challenges
with innovative solutions
Focused on placing the needs
of our clients above all else
A TRUSTED PARTNER
Institutional 74%
Active $455B
Passive $472B
Multi-Manager
$53B
Other $21B
Equity $517B
Fixed Income $463B
Other $21B Wealth & Retail
26%
Asset Class
Style Client Type
*Represents total assets managed by Northern Trust as of March 31, 2017. The above rankings are not indicative of future performance. Unless otherwise noted, rankings are based on total worldwide assets under management of $875.3 billion as of December 31, 2015 by Pensions & Investments magazine’s 2016 Special Report on the Largest Money Managers.

4 northerntrust.com | © Northern Trust 2017
ASSET MANAGEMENT EXPERTISE Investment solutions and asset allocation informed by deep capital markets analysis. Comprehensive asset
class capabilities from passive and factor-based, to fundamental active and multi-manager.
GLOBAL PRODUCT VEHICLES
Collective Funds | Common Contractual Funds (CCF) | Common Funds | Exchange Traded Funds (ETFs) | Fonds vor Gemene Rekening (FGR) Investment
Company Variable Capital (IVCV) | Managed Accounts | Mutual Funds | Separate Accounts
Factor-Based
Active
Passive
Customized Indexing
Active
Passive
Cash Management
Hedge Funds
Private Equity
Natural Resources
Infrastructure
Real Estate
ESG
Multi-Manager
Investment Advisory
Bespoke
Strategic
Tactical
Equity Fixed
Income
Alternatives Solutions Asset
Allocation
Forward-looking, historically aware investment approach
Capital Markets Expertise
5 northerntrust.com | © Northern Trust 2017
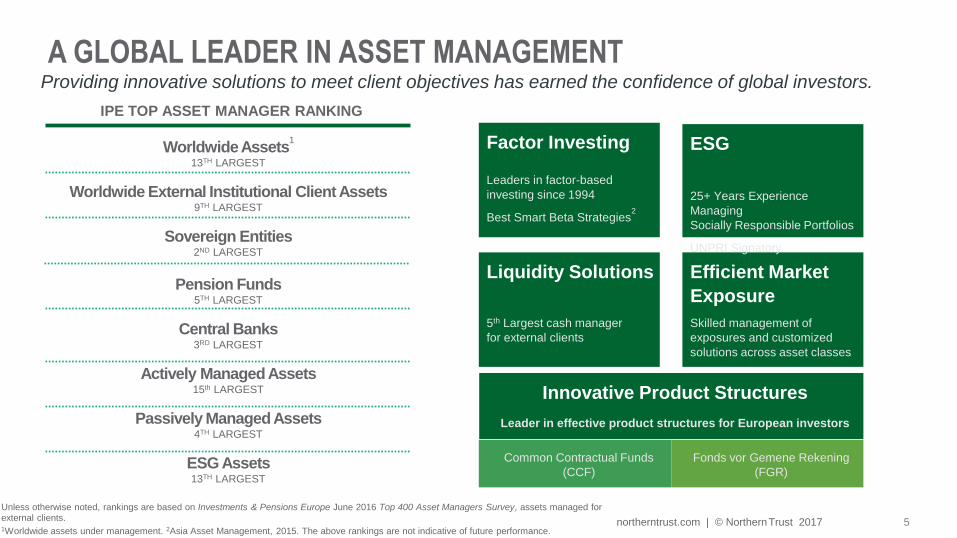
A GLOBAL LEADER IN ASSET MANAGEMENT Providing innovative solutions to meet client objectives has earned the confidence of global investors.
Worldwide Assets1
13TH LARGEST
Worldwide External Institutional Client Assets
9TH LARGEST
Sovereign Entities
2ND LARGEST
Pension Funds
5TH LARGEST
Central Banks
3RD LARGEST
Actively Managed Assets
15th LARGEST
Passively Managed Assets
4TH LARGEST
ESG Assets
13TH LARGEST
IPE TOP ASSET MANAGER RANKING
Factor Investing
Leaders in factor-based
investing since 1994
Best Smart Beta Strategies2
Liquidity Solutions
5th Largest cash manager
for external clients
Efficient Market
Exposure
Skilled management of
exposures and customized
solutions across asset classes
Innovative Product Structures
Leader in effective product structures for European investors
Common Contractual Funds
(CCF)
Fonds vor Gemene Rekening
(FGR)
ESG
25+ Years Experience
Managing
Socially Responsible Portfolios
UNPRI Signatory
Unless otherwise noted, rankings are based on Investments & Pensions Europe June 2016 Top 400 Asset Managers Survey, assets managed for external clients. 1Worldwide assets under management. 2Asia Asset Management, 2015. The above rankings are not indicative of future performance.

6 northerntrust.com | © Northern Trust 2017
NORTHERN TRUST APPROACHES TO INTEGRATING ESG
1
Benchmark to
Sustainable and
Responsible
Investing Indices
2
Custom ESG
indices designed
by Northern Trust
and MSCI ESG
Research
3 Engineered
Equity strategy
4 Client-directed
screens
Engagement

7 northerntrust.com | © Northern Trust 2017
Down To Business

8 northerntrust.com | © Northern Trust 2017
ESG INVESTING IN EUROPE EuroSIF conducts studies every two or three years, where it asks investors about their sustainable
investing strategies and calculates CAGR for different types
Data from the 2016 EuroSIF report
20,269.00
58,961.00
353,555.00
1,900,040.00
3,275,930.00
3,633,794.00
6,853,954.00
98,329.00
145,249.00
493,375.00
2,646,346.00
4,270,045.00
5,087,774.00
10,150,595.00
0 2000000 4000000 6000000 8000000 10000000 12000000
Impact Investing
Sustainability Themed
Best-in-Class
ESG Integration
Enagagement & Voting
Norms-based Screening
Exclusions
2015 2013

9 northerntrust.com | © Northern Trust 2017
THE STRUCTURE OF ESG INVESTMENTS
Impact
& Thematic
Best-in-class screenings or tilts based on ESG ratings or their
components
Norms-based exclusions (UN Compact Principles, ILO Guidelines, etc.)
Values-based exclusions (Tobacco, Alcohol, Weapons, Pornography, Nuclear, etc.)
Scale of Implementation
Evolution of SRI: Complexity, Availability of data, Concentration

10 northerntrust.com | © Northern Trust 2017
IMPACT INVESTING OR IMPACTFUL
INVESTMENTS

11 northerntrust.com | © Northern Trust 2017
HOW TO IMPLEMENT THIS?
Determine Values
Assess Portfolio Risk
Establish Goals
Implement
What would
your client like
to achieve?
What is the
greatest ESG
risk in your
client’s
portfolio?
Investment
and impact
performance
goals & time
horizon
Strategy
selection and
implementation

12 northerntrust.com | © Northern Trust 2017
DETERMINE VALUES: UN SUSTAINABLE DEVELOPMENT GOALS 17 SDGs were established in 2015. UN also defined 169 targets to orient the world on a path towards
sustainable development over the next 15 years
Source: https://sustainabledevelopment.un.org

13 northerntrust.com | © Northern Trust 2017
ASSESS PORTFOLIO RISKS: “TRAGEDY OF TRACKING ERROR” Higher ESG impact goes hand in hand with higher active risk (tracking error)
As of March 31, 2016. Source: Northern Trust, MSCI. For illustrative purposes, we create a frontier of 25 portfolios
that each minimizes tracking error for a given level of Carbon Intensity reduction (starting with zero reduction and
ending with 95% reduction. No other constraints were applied.
-100%
-90%
-80%
-70%
-60%
-50%
-40%
-30%
-20%
-10%
0%
0.0% 0.2% 0.4% 0.6% 0.8% 1.0%
Ca
rbo
n In
ten
sity R
ed
uctio
n (
%)
Ex Ante Tracking Error (%)

14 northerntrust.com | © Northern Trust 2017
ESTABLISH GOALS Approached to ESG investing vary depending on the overall investment strategies
Prepared to take
active risk Avoiding the worst Generic ESG
Willing to keep
passive exposure Selecting the best
Specific
themes/targets
15 northerntrust.com | © Northern Trust 2017
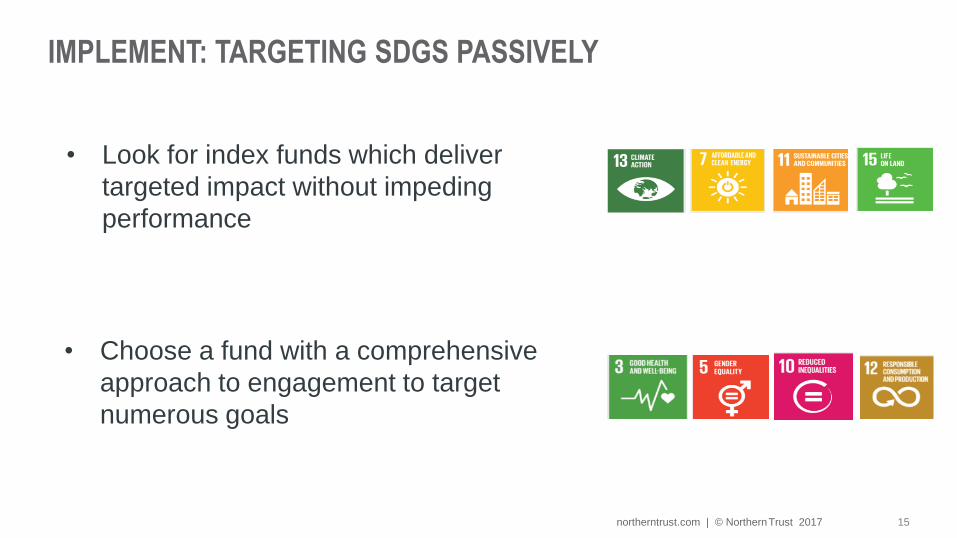
IMPLEMENT: TARGETING SDGS PASSIVELY
• Choose a fund with a comprehensive
approach to engagement to target
numerous goals
• Look for index funds which deliver
targeted impact without impeding
performance

16 northerntrust.com | © Northern Trust 2017
Optimization • Market-cap of index will be
at least 50% of parent
• Sector/ Country weights
Carbon emission exclusions • Top 10% of securities with high
emissions*
Potential Carbon exclusions • Constituents ranked by potential
carbon emission and high
emitters are eliminated until
potential emission is 50% of the
benchmark*
ESG Universe
MSCI Custom Low Carbon
Leaders ex REITs 10/50 Index
MSCI Emerging Markets Index
(832 securities)
Excluding REITs
Carbon
emission
reduction
Potential
Carbon
reduction
NT Emerging Markets
Low Carbon Optimized
Equity Index Fund
CASE STUDY 1: TARGETING CLIMATE ACTION WITH A PASSIVE SOLUTION
* See Appendix 1 for more details on carbon risks

17 northerntrust.com | © Northern Trust 2017
NORTHERN TRUST ESG FUNDS AND STRATEGIES: CARBON INTENSITY Carbon Intensity reduction is one of the key impact areas; it is a target of the Low Carbon Indices and
strategies, but to a certain extend can be an outcome of ESG indices and strategies
Source: Northern Trust, MSCI, as of 21 Oct 2016. Tracking Error is ex-ante using GEM2 Risk Model
Benchmark MSCI Emerging Markets
Portfolio NT EM Low Carbon Leaders
CO2 Intensity
(t/USD million sales) 312.47 157.54
Total Potential Emissions Intensity (t/USD million mkt cap)
13,715.31 5,385.27
49.6% reduction
60.7% reduction
0.76% Tracking Error

18 northerntrust.com | © Northern Trust 2017
CASE STUDY 2: PROMOTING SUSTAINABLE CITIES WITH PASSIVE FUND
Source GRESB and Northern Trust 2017
Global Rank
Number Companies %
Weight Northern
Trust/GRESB
Index
5 41 26.28% 30.21%
4 36 23.08% 39.63%
3 23 14.74% 14.13%
2 30 19.23% 16.02%
1 26 16.67% 0.00%
TOTALS 156 100% 100%

19 northerntrust.com | © Northern Trust 2017
HAVING IMPACT WITH ENGAGEMENT Climate
Change
Pollution &
Waste Mngt
Water Bribery &
Corruption
Conduct &
Culture
Cyber
Security
Diversity Human
Rights
Labour
Rights
Supply
Chain Mngt
NO POVERTY ■ ■ ■ ■
ZERO HUNGER ■ ■ ■
GOOD HEALTH/WELL-BEING ■ □ □
QUALITY EDUCATION □ ■
GENDER EQUALITY □ □ ■
CLEAN WATER/SANITATION ■ □ □
AFFORDABLE & CLEAN ENERGY □ ■
DECENT WORK & ECONOMIC GROWTH □ ■ □ □
INDUSTRY, INNOVATION & INFRASTRUCTURE ■ ■ ■ ■
REDUCED INEQUALITIES ■ ■ ■
SUSTAINABLE CITIES & COMMUNITIES ■ □ ■
RESPONSIBLE CONSUMPTION & PRODUCTION □ □ ■
CLIMATE ACTION □
LIFE BELOW WATER □ ■
LIFE ON LAND □ ■ ■
PEACE, JUSTICE & STRONG INSTITUTIONS □ □ ■ ■ ■
PARTNERSHIP FOR THE GOALS ■
□ Direct ■ Indirect
Source:
Source: Hermes EOS, Q1 2017

CONCLUSION
Ultimately with ESG there is no one way for
investors to make an impact
• MAXIMIZING INVESTOR IMPACT ON PUBLIC COMPANIES
CAN TAKE MANY DIFFERENT FORMS – ENGAGING AS
AN INVESTOR CAN HAVE MORE IMPACT THAN
SCREENING OUT
• IN CHOOSING THE SPECIFIC FORM IT IS IMPORTANT TO
DEFINE HOW NARROW OR HOW BROAD, AND HOW FAR
FROM THE MAIN BENCHMARK YOUR CLIENT IS
COMFORTABLE TO BE
• THERE ARE COST EFFECTIVE SOLUTIONS THAT
OPTIMIZE INVESTOR IMPACT TAKING THE
CONCENTRATION CONSIDERATIONS INTO ACCOUNT

21 northerntrust.com | © Northern Trust 2017
Appendices

22 northerntrust.com | © Northern Trust 2017
Graphics
What’s this layout for?
Plain slide without a text box –
used for inserting graphics e.g.
pies, bars or images
APPENDIX 1. DISTRIBUTION OF CLIMATE RISKS BY SECTORS
Source: MSCI, Northern Trust. As of 31st May 2016
• Carbon intensity represents carbon emissions
normalized by $MM sales
• Carbon intensity is concentrated in Utilities, Materials,
and Energy
• Total potential emissions are normalized by $MM
market cap
• Energy and Materials sectors own the bulk of fossil fuel
reserves that contribute to total potential emissions
0%5%
10%15%20%25%30%35%40%45%50%
% Sector Contribution to Carbon Intensity
% Sector % Emissions Intensity
0%
10%
20%30%
40%
50%
60%
70%
80%
% Sector Contribution to Total Potential Emissions
% Sector % Reserves Intensity

23 northerntrust.com | © Northern Trust 2017
NORTHERN TRUST ESG FUNDS AND STRATEGIES: CARBON INTENSITY Carbon Intensity reduction is one of the key impact areas; it is a target of the Low Carbon Indices and
strategies, but to a certain extend can be an outcome of ESG indices and strategies
Source: Northern Trust, MSCI, as of 21 Oct 2016. Tracking Error is ex-ante using GEM2 Risk Model
Portfolio Benchmark Tracking
Error
Portfolio
Index CO2
Intensity
(t/USD
million
sales)
B’mark CO2
Intensity
CO2
Intensity
Reduction
Portfolio
Total
Potential
Emissions
Intensity
(t/USD million
mkt cap)
B’mark Total
Potential
Emissions
Intensity
(t/USD
million mkt
cap)
Total
Potential
Emissions Reduction
NT EM Custom ESG MSCI Emerging
Markets 1.00% 300.38 312.47 3.9% 8,082.45 13,715.31 41.1%
NT World Custom ESG MSCI World 0.34% 206.67 206.71 0.0% 2,218.40 2,766.58 19.8%
NT Europe Custom ESG MSCI Europe 0.80% 168.81 173.37 2.6% 3,260.24 4,604.33 29.2%
NT EM Low Carbon
Leaders MSCI Emerging
Markets 0.76% 157.54 312.47 49.6% 5,385.27 13,715.31 60.7%
NT Quality ESG MSCI World 1.28% 127.97 206.71 38.1% 574.55 2,766.58 79.2%
NT Quality Low Carbon MSCI World 1.03% 40.76 206.71 80.3% 466.83 2,766.58 83.1%

24 northerntrust.com | © Northern Trust 2017
IMPORTANT INFORMATION This material is directed to eligible counterparties and professional clients only and should not be relied upon by retail investors. This presentation is intended only for the exclusive
benefit and use of our clients. Northern Trust and its affiliates may have positions in, and may effect transactions in, the markets, contracts and related investments described herein, which
positions and transactions may be in addition to, or different from, those taken in connection with the investments described herein. The information in this presentation reflects prevailing
market conditions and our judgment as of this date, which are subject to change. Past performance is no guarantee of future results. All material has been obtained from sources believed to
be reliable, but the accuracy, completeness and interpretation cannot be guaranteed. This presentation is for your private information and is intended for one-on-one use with current or
prospective clients of Northern Trust. The information does not constitute investment advice or a recommendation to buy or sell any security and is subject to change without notice
Issued by Northern Trust Global Investments Limited (NTGIL). NTGIL is authorised and regulated by the Financial Conduct Authority in the United Kingdom. Registered in
England 03929218. Registered Office: 50 Bank Street, London E14 5NT.
Northern Trust Asset Management is composed of Northern Trust Investments, Inc., Northern Trust Global Investments Limited, Northern Trust Global Investments Japan, K.K., NT Global
Advisors, Inc., 50 South Capital Advisors, LLC, and personnel of The Northern Trust Company of Hong Kong Limited and The Northern Trust Company. For Asia Pacific markets, this
material is directed to expert, institutional, professional and wholesale investors only and should not be relied upon by retail clients or investors.
Northern Trust Global Investments Japan, K.K. is regulated by the Japan Financial Services Agency. The Northern Trust Company has a branch in China mainly regulated by the China
Banking Regulatory Commission, People’s Bank of China and State Administration of Foreign Exchange. The Northern Trust Company of Hong Kong Limited is regulated by the Hong Kong
Securities and Futures Commission. In Singapore, Northern Trust Global Investments Limited (NTGIL), Northern Trust Investments, Inc. and The Northern Trust Company of Connecticut
(NTCC) are exempt from the requirement to hold a Financial Adviser's Licence under the Financial Advisers Act and a Capital Markets Services Licence under the Securities and Futures Act
with respect to the provision of certain financial advisory services and fund management activities. In Australia, The Northern Trust Company of Hong Kong Limited (TNTCHK) is exempt
from the requirement to hold an Australian Financial Services Licence under the Corporations Act. TNTCHK is authorized and regulated by the SFC under Hong Kong laws, which differ from
Australian laws.
Important Information Regarding Hypothetical Returns- Where hypothetical portfolio data is presented, the portfolio analysis assumes the hypothetical portfolio maintained a consistent asset
allocation (rebalanced monthly) for the entire time period shown. Hypothetical portfolio data is based on publicly available index information. All information is assumed to be accurate and
complete but is not guaranteed.
Hypothetical portfolio data contained herein does not represent the results of an actual investment portfolio but reflects the historical index performance of the strategy described which were
selected with the benefit of hindsight. Components of the hypothetical portfolio were selected primarily utilizing actual historic market risk and return data. If the hypothetical portfolio would
have been actively managed, it would have been subject to market conditions that could have materially impacted performance and possibly resulted in a significant decline in portfolio value.
As of 03/31/17, Northern Trust Corporation had assets under management totalling $1.0 trillion. For purposes of compliance with the Global Investment Performance Standards (GIPS®), we
have defined our firm as Northern Trust Asset Management Services, a subset of Northern Trust Asset Management, and includes those investment products managed by NTI, NTGIL,
NTGIJ, and TNTC that are distributed through national channels. As of 03/31/2017 Northern Trust Asset Management Services had assets under management totalling $804.5 billion.