north york solar final report - york university
TRANSCRIPT

0
FACULTY OF ENVIRONMENTAL STUDIES
York University
Final Report: GIS-based Analysis of a Solar Panel Implementation Project in the
North York Region
ES/ENVS 4520 - Geographical Information Systems Applications in Environmental
Studies (Advanced GIS)
Course Director: Dr. Justin Podur
TA: Tannaz Zargarian
Report submitted by:
Muniba AbdulAziz
Samer Habbal
José Hinterholzer
This report is released under a CC-BY license (Content licensed under a Creative Commons Attribution
3.0 Unported License)

1
Table of Contents
Introduction ................................................................................................................... 2
Background: North York Region.................................................................................. 3
Hypothesis ..................................................................................................................... 3
Data Acquisition ............................................................................................................ 4
Meta Data .................................................................................................................... 5
GIS Analysis .................................................................................................................. 8
Figure 1 ........................................................................................................................ 8
Figure 2 ........................................................................................................................ 9
Figure 3 ...................................................................................................................... 10
Figure 4 ...................................................................................................................... 12
Table 1……………………………………………………………………………………..…15
Feed-in Tariffs (FIT) ..................................................................................................... 17
Cost Analysis .............................................................................................................. 18
Environmental and Social Benefits ........................................................................... 19
Conclusion ................................................................................................................... 20
Recommendations ...................................................................................................... 20
Reference……………………………………………………………………………………...21
Appendices A - C
Appendix A - Solar SF 160 Brochure
Appendix B - Solar Insolation Data
Appendix C - PV Panel Visual Diagram

2
Introduction
Renewable technologies such as solar panels are clean energy alternatives that have
much lower negative environmental impacts than conventional energy technologies.
They contribute to mitigate the issue of global warming/climate change (“Why is
renewable,” 2015) and can help in the transition of our current conventional energy
infrastructures into clean energy production systems. It is not only important to consider
and analyze the solar potential (“The energy report,” n.d.) that an area can generate,
but also to understand the cost and benefits this solar energy can produce. The
scenario of the North York region shows a trend of economic growth and increasing
electrical demand (“York Region Solar,” n.d.) which makes it a suitable candidate for the
study area for this report.
Due to the increasing electrical demands in the North York region, there would be an
increase in greenhouse gas emissions and further problems of shortage of electrical
power supply and management during the winter storms and other weather events.
Therefore, this report conducts a GIS-based analysis of the highest buildings in the
proposed study area to calculate the solar potential that can be generated. This analysis
through the GIS software allows for determination of the potential of urban solar energy
implementation in the North York region and possibly in the entire city of Toronto.

3
Background: North York Region
The Region of North York is a municipality located in Toronto, Ontario, Canada. The
North York area comprises of a population density of approximately 4,100 people per
Km2 and has a total population of 667,840 people. Around 300,500 or 45% of this
population lives in apartment buildings with five or more stories (Statistics Canada,
2015). The North York area contains the North York Civic Center, Bayview Village, the
Toronto District School Board, and encompasses commercial and financial centers such
as Proctor and Gamble, Xerox, Nestle, Cadbury Adams and other offices.
Even though North York is a crucial business and a growing economic region of
Toronto, its total land use area only contains approximately 176.87 Km2 (Statistics
Canada, 2015). Given the trend of increasing economic intensification, North York will
have to increase its energy supply to meet the demands of its ongoing expansion.
Therefore, this report conducts an analysis to obtain the solar potential of a small strip
of the North York region which may allow us to understand the capacity of this area and
its ability to incorporate a feasible solar energy project that is both profitable and
promotes sustainability.
Hypothesis
The data acquired from the North York area will be analyzed to identify the tallest
buildings in the study area selected. This report will calculate and show the solar
potential that the proposed study area can attain using a standard solar panel module
and GIS software. By using QGIS and ARCGIS we will be able to identify the most

4
appropriate buildings with the highest solar potential to propose a solar panel
installation. In addition, using the regulations and policies within Ontario’s Feed-in Tariff
(FIT) Program launched by Ontario’s Green Energy and Economy Act (GEAEA) we
hypothesize that the landlords of the selected buildings would decrease their energy
bills and make profits from installing solar panels while taking advantage of the FIT
program. We predict that these FIT calculations paired with solar insolation results will
provide us with cost-effective benefits for North York region’s potential solar panel
implementation.
Data Acquisition
1. Study Area Projection
A common projection that was used for all data layers is WGS 84/UTM zone 17n
EPSG:32617. The WGS 84 is used due to its 3D modeling preference, unlike NAD 83
which is based on a 2D datum (RMSI, 2010).
2. Data Requested and Acquired
Data was requested through the GAIA system form the York University Library and
Geoportal Scholar. Janet Neate provided us with the data requested below.
1. Contours of the Greater Toronto Area
http://gaia.library.yorku.ca/uploads/attachment/file/115/Contours_GTA_05.zip
2) Data elevation files of the GTA, Greater Toronto Area, Ontario
http://gaia.library.yorku.ca/uploads/attachment/file/114/DEM_GTA_05.zip

5
3) Buildings, Places, DEM files for the North York Region
http://gaia.library.yorku.ca/uploads/attachment/file/113/NorthYork.zip
4) Digital Terrain files of North York, Toronto, Ontario
http://www.qgistutorials.com/en/docs/working_with_terrain.html
5) Annual mean daily global insolation for a South-facing surface with latitude tilt
http://pv.nrcan.gc.ca/index.php?lang=e&m=d
6) Photovoltaic (PV) potential (kWh/kW) and mean daily global insolation (MJ/m2 and
kWh/m2) data for the region of North York by Natural Resources Canada.
http://pv.nrcan.gc.ca/index.php?lang=e
Metadata Area: 3.6 Square Kilometres Theme: Building Vectors, Clutter, DEM, Vector and Places data Data Format & Resolution: Format –ESRI Shape & Grid Output Resolution – 5 meters Projection System
Projection UTM
Units Meters
Zone 17
Hemisphere N
Datum WGS-84
Central meridian 81° W

6
Extent of the Data for North York city
Grid Meters Geographic
XMIN 626651.00 79° 25' 36.589872" W
YMIN 4845603.00 43° 45' 9.527616" N
XMAX 628661.00 79° 24' 2.772288" W
YMAX 4850203.00 43° 47' 37.326588" N
Vector Classes
Code Class
1 Highways
2 Main Roads
3 Other Roads
4 Streets
5 Railways
6 Airstrip
7 Lakes
8 River
Clutter Classes
Clutter Code Clutter Class
-9999 Unclassified
1 Inland Water
2 Open
3 Low tree density
4 High Tree density
5 Buildings < 5
6 Buildings < 10

7
7 Buildings < 15
8 Buildings < 20
9 Buildings < 30
10 Buildings < 40
11 Buildings < 50
12 Buildings > 50
13 Industrial area
14 Airstrip
15 River
16 Coast
17 Agriculture
18 Stadium / Play Ground
Data Organization:
Folder Hierarchy Data Content Data Description
\North_York\ Building, Clutter, Dem, Vector and Places.
Data Folders
\North_York\Esri\buildings 1 Building vector Shape file
Building vectors of North York city.
\North_York\Esri\Clutter 1 ESRI grid file. Land use/land cover of North York city.
\North_York\Esri\dem 1 ESRI grid file. Digital Elevation Model of North York city.
\North_York\Esri\vector 1 Vector shape file. Road Network of North York city.
\North_York\Esri\Places 1 Places shape file. Landmark of North York city.
(RMSI, 2010

8
GIS Analysis
The raw data acquired above is processed and displayed on four maps. Figure 1 below
shows the general study area of interest located within the North York Region that is
bounded by Finch Ave. East on the North, Sheppard Ave. East on the South, Doris Ave.
on the East and Beecroft Road on the West. A map of this study area can be seen
below in Figure 1. The raw data showing random buildings all over the region was
clipped to only include the buildings in the proposed study area.
Figure 1. North York region’s selected study area.

9
From the acquired data of North York, the shape files of places and buildings were
overlapped and clipped to obtain a combined attribute shape file with the heights and
areas of all buildings within the study area. As Figure 2 below shows, a map was
created to illustrate a graduated legend of buildings with their relative heights.
Figure 2. Graduated heights map of buildings in the study area.

10
This data is further analyzed by using only buildings that have a height greater than 80
meters. As Figure 3 below shows, a map was created to show a building classification
based on the size of the rooftop areas. This helps recognize the quantity and location of
buildings with the largest rooftop areas in the selected location.
Figure 3. Graduated area map of buildings in the study area.
11
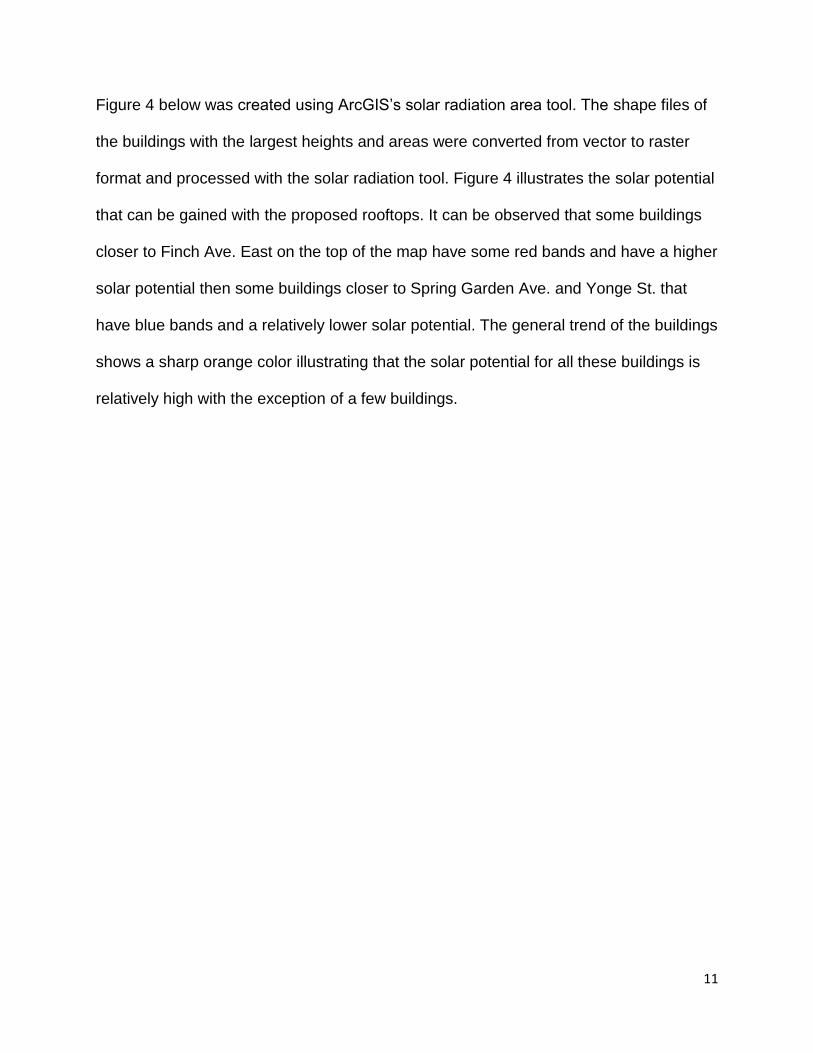
Figure 4 below was created using ArcGIS’s solar radiation area tool. The shape files of
the buildings with the largest heights and areas were converted from vector to raster
format and processed with the solar radiation tool. Figure 4 illustrates the solar potential
that can be gained with the proposed rooftops. It can be observed that some buildings
closer to Finch Ave. East on the top of the map have some red bands and have a higher
solar potential then some buildings closer to Spring Garden Ave. and Yonge St. that
have blue bands and a relatively lower solar potential. The general trend of the buildings
shows a sharp orange color illustrating that the solar potential for all these buildings is
relatively high with the exception of a few buildings.

12
Figure 4. Solar radiation of the highest buildings within the selected study area.

13
In order to understand the solar potential for the proposed study area, we require solar
panel calculations that would show the amount of energy generated by the area
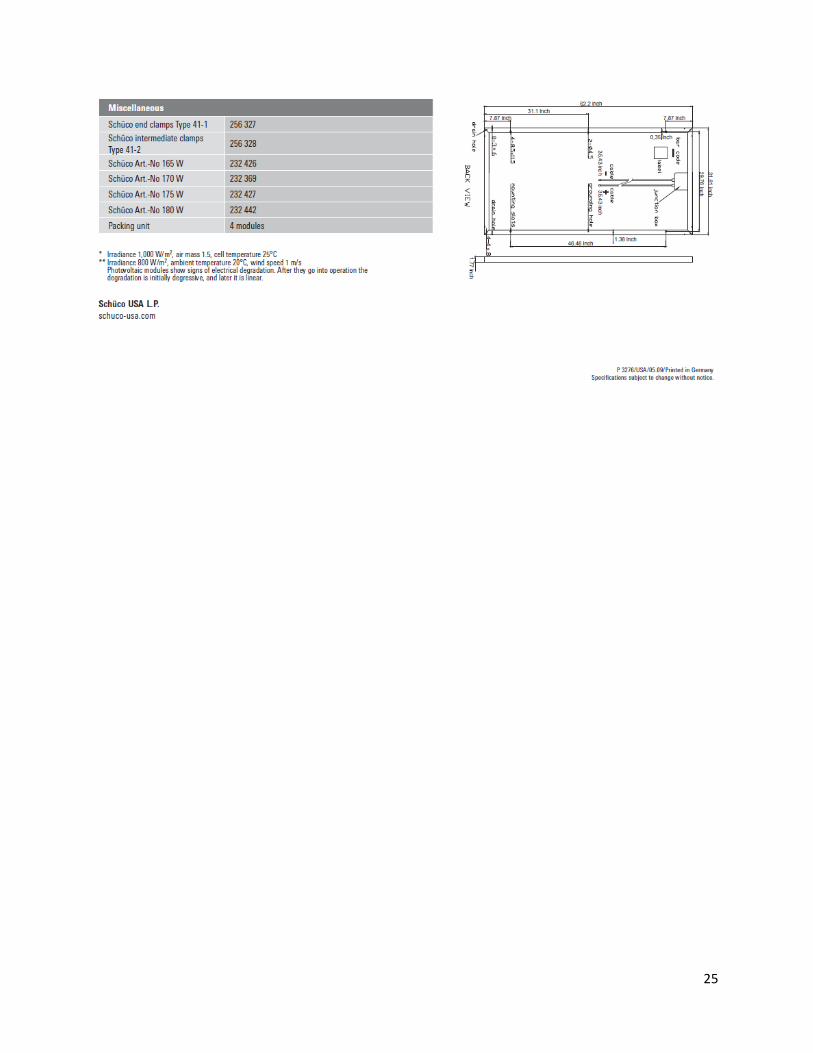
available. The solar panel chosen for this project is a polycrystalline photovoltaic
module called Solar SF160-24-P PV. It has an area of 62.2 inch x 31.8 inch or 1977.96
in2 (1.28 m2) and has a depth of 1.8 inches. The Solar SF 160-24-P PV Module was
selected for this project due to its properties of anti-reflective coatings, high efficiency
and long life cells. The manufacturing process of this PV panel includes a double
oxidation coating making it resistant to the rugged Canadian weather conditions,
guaranteeing long lasting quality under adverse weather events. Furthermore, this PV
module has a bearing capacity against wind and snow of about 50lbs/sq ft, meeting the
standards of ISO 9001 and ISO 14001 quality regulations that ensure quality and
environmental expectations. This photovoltaic panel provides a warranty of performance
of 80% of its energy production capacity after 25 years (Solar SF 160-24-P PV Modules
– Schüco, n.d.). The maximum power generated ranges from 165 to 180 watts. For the
purpose of solar potential calculations, 165 Watts will be used as the least power
generated in the worst-case scenario.
Using data collected from Natural Resources Canada’s photovoltaic and solar maps,
tabular data was examined and showed the mean daily global insolation in kWh/m2 for
the area of Toronto (Appendix B) . The insolation data collected by Natural Resources
Canada used PV panels all facing south with different tilts including a 2-axis tracking PV
panel (Appendix C). The solar panels are positioned south with different tilts because
the testing methods used by Natural Resources Canada provided the best exposure

14
and results when faced south. According to the data, when using a 2-axis tracking PV
panel the mean annual average of insolation in the North York region contains a range
from a minimum of 2900 W/m2 to a maximum of 5900 W/m2 of irradiance. We use the
minimum irradiance for a worst case scenario analysis with the intention to show that
future results could only improve from these numbers.
The chosen Solar SF 160 PV panel produces an output of 165W of power when tested
under the irradiance of 1000 W/m2. What this means for photovoltaic potential In the
North York Region is that even if we took the lowest insolation results tested of 2900
W/m2 the North York Region’s insolation capacity will be well over the tested standard
of 1000 W/m2. For statistical assurance we are using the production of lowest 165W of
power per panel although the actual solar insolation in the North York Region far
surpasses the standard testing of 1000W/m2.
1000 W/m2 irradiance = 165 Watts X Watts = 475 Watts generated at 2900W/m2 2900 W/m2 irradiance X Watts irradiance
This demonstrates that the irradiance exposed in the North York region gives 475 Watts
and is capable of being harnessed three times more power than what the Solar SF 160
panels are currently harnessing. This means future panels could be designed to
harness the full potential of the irradiance exposed proving that results and benefits
would increase with technological advancements, while still being profitable with the
current technology.
For the purpose of this report, the solar potential calculations will include the buildings
whose height is greater than 80 meters, since they are least affected by traffic pole

15
shadows, building shadows and other shadow covers. However, there may be some
systematic errors as certain rooftop areas may contain maintenance tanks or
equipment, which may not allow the entire rooftop of the building to be used to place
solar panels. The attribute data of these buildings is shown below in Table 1.
Table 1. Attribute Table of Buildings With Height Greater Than 80 Meters
NAME AREA (m2) HEIGHT (m)
HEWITT ASSOCIATES 440 97
CONTINENTAL CONDO 241 82
MINTO RADIANCE 431 105
NORTH YORK ACUPUNCTURE CLINIC 275 80
HEWITT ASSOCIATES TORONTO 203 81
CADBURY BUILDING 1810 86
SKYMARK CENTRE 749 102
NESTLE BUILDING 815 104
NORTH AMERICAN CENTRE 1784 89
SYNERGY TRAINING STUDIO 425 82
BROADWAY RESIDENCES 745 91
ULTIMA AT BROADWAY SOUTH TOWER 510 102
BOMBAY BHEL 293 93
MONET CONDO 846 90
THE MADISON 190 82
YORK COLLEGE OF BUSINESS 1121 82
NEVIAN CONSULTING & PLACEMENT SERVICES 613 85
MAJESTIC II 1196 81
Total Area (m2) 12687

16
As Table 1 shows, the buildings with height greater than 80 meters are selected in the
North York Region for an estimated energy potential of buildings with high generation
probability. Their total roof areas are summed to acquire the total area available to hold
solar panels. This total area available is 12686.84 square meters and can hold 9912
solar polycrystalline panels. The amount of energy that 9912 panels can generate is
1,635 Kilowatts. This calculation is shown below.
To calculate the total watts generated:
12686.84 m2 = 9911.59 or 9912 Panels can be installed 1.280 Panel Area (m2)
1 Panel Rated Power Given = 165 Watt/Hr (Appendix A)
9912 panels x 165 watts = 1,635,480 Watts or 1,635 Kilowatts
Therefore, all the panels of the buildings whose height is greater than 80 meters would
generate 1,635 Kilowatts/Hr collectively. The cost of energy per watt from Schuco is
approximately $2.30 to $2.55, however, $2.40 was used as an average for a
commercial project in Canada (F. Cortese, personal communication, 2015).
9912 panels x $2.40 = $23,788.8 or $ 23,789
Collectively these buildings would have to spend about $23,789 to install these solar
panels.

17
Feed-In Tariffs (FIT)
The Green Energy Act helps incorporate renewable energy into the electrical system by
introducing the system of Feed-In Tariffs (FITs). Adopting the FIT program requires a
contract between the interested party and the FIT organization for a period of 20 years
(Renewable energy feed-in tariff program, n.d.), so it is highly important to select the PV
panels that ensure energy production during the respective period.
The FIT program allows the PV panel users to make a profit when there is an excess of
energy produced over the energy consumed, by feeding it back into the electrical grid.
The FIT program is open to projects with a rated electricity generating capacity greater
than 10 Kilowatts (KW) and up to 500 KW, which is suitable for this project. The FIT
prices for Ontario are given at 0.316 cents for energy generated that is greater than 100
and less than 500 Kilowatts per project (“Renewable energy,” n.d.). The total energy
saved by using solar panels in the proposed region would be approximately 1,635
Kilowatt/Hr. The annual savings of the proposed buildings are calculated and shown
below.
The FIT Ontario offers 0.316 cents per KW/Hr
Energy generated per day = 1,635 Kilowatt/ Hr x 0.316 cents per Kilowatt/Hr
= $516.66 Kilowatts/Hr
Energy Savings per day = $516.66 Kilowatts/Hr x 24 Hr
= $12,399.84 or $12,400 per day

18
Thus, the buildings higher than 80 meters in the North York region will generate profits
of about $12,400 CAD by employing the FIT program. If this were extended to all
buildings in the North York region, their owners would still make more profits while
reducing their electricity bills and simultaneously reducing the greenhouse gas emission
rates and mitigating climate change.
Cost Analysis
With the cost of $23,789 and the generation of energy of 1,635 kilowatts/Hr that gives a
FIT benefit of about $ 12,400 per day or about $688 profit to each of the 18 buildings.
After paying off costs such as installation fees, maintenance or repairs, each building
will make a profit of about $20,640 per month.
These buildings can pay off their one-time cost of installing solar panels in about two
days of energy generation and would keep getting profitable returns by feeding energy
back into the collective grid. If this sample set provides benefits for the highest 18
buildings, doing further spatial analysis on other buildings can ensure profits for other
buildings interested and many more that could manage a decent amount of solar
radiation to generate the required capacity. Further, City of Toronto or private
entrepreneurs could propose a solar panel plan or a by-law for collective buildings to
transition the North York Region’s conventional electricity sources into a renewable
energy production and consumption system.

19
Environmental and Social Benefits
In addition to the economic benefits, this adaptation of renewable energy will not only
produce eco-friendly energy, but also contribute to the social and environmental aspects
of the community. Through the FIT program, renewable energy implementation can
greatly reduce CO2 emissions. Since PV modules generate electricity without producing
air, noise and water pollution, these energy sources will have obvious advantages over
conventional electricity supply options. Also, as renewable energy replaces the use of
lead-acid batteries, the chances of their improper disposal, which is harmful to the
environment, would be reduced.
If the North York area were to implement solar energy projects, it will create incentives
for similar townships to follow suit in the adoption of solar energy as a sustainable
source of energy, while socially demonstrating leadership in the region. Using solar
energy would reduce fuel imports, as less natural gas would be used for electricity
generation in the North York area. As our economy becomes less dependent on natural
gas for fuel, the increase of livings costs due to the increasing fuel and energy prices
would not make our society as vulnerable as it is today. As the practice of integration of
solar energy becomes customary, the lower dependence on fuel and its world-price
fluctuations can create a more stable economy for the North York region and Toronto as
a whole.

20
Conclusion
In conclusion, after collecting raw data and processing it to analyze the solar potential of
the North York region, calculations of the building areas and heights were made and the
potential of solar radiation was obtained. The results from harnessing the solar radiation
were employed to determine cost effectiveness and general feasibility for the project
implementation in the North York Region. The buildings selected for the North York
region generated 1,635 Kilowatts/Hr of energy and gained a $12,400 profit collectively.
Overall, the results proved better than our hypothesis. As the North York region has
three times the insolation capacity, a greater amount of energy and profits can be
generated by future technologies more advanced than the Solar SF160 panel. This
report can be used for further spatial and cost analysis pertaining to the solar renewable
initiatives in the North York Region.
Recommendations
It is highly recommended for the building owners of the North York Region and other
potential parties to invest in solar energy projects such as this, due to the long term
benefits that are clearly stated in our study. As a growing financial district, the North
York area will unavoidably increase its demographic density, thus, it would be more
profitable to invest in a renewable energy initiative to meet the future electrical demands
of the growing community while mitigating the problem of climate change and its
detrimental effects on the environment.

21
References
Photovoltaic potential and solar resource maps of Canada. (2014, November 27).
Retrieved February 10, 2015, from http://pv.nrcan.gc.ca/index.php
Renewable energy feed-in tariff program. (n.d.). Retrieved April 8, 2015 from http://fit.powerauthority.on.ca/what-fee d-tariff-program
RMSI Ltd. (2010). North York (Yonge Street) building outlines with heights, clutter data, DEM, contours and places [electronic resource: raster and vector]. Newark, California: RMSI Ltd. Solarfun SF 160-24-P PV Modules - Schüco. (n.d.). Retrieved April 21, 2015, from www.schueco.com/web/.../solarfun_sf_160-24-p_pv_module.pdf Statistics Canada. (2015). 2011 Census of Toronto Community Council Profiles Area B-North York. Statistics Canada. (Catalogue no. 98-301-X 2011). Retrieved April 7, 2015 from Statistics Canada: http://www1.toronto.ca/City%20Of%20Toronto/City%20Planning/Wards /Files/pdf/C/CCANNY%20Census%20Profile%202011.pdf The energy report: 100 per cent renewable – We can do it. (n.d.). Retrieved on April 8, 2015, from http://www.wwf.ca/conservation/global_warming/energy_report.cfm Why is renewable energy important? (2015). Retrieved April 1, 2015, from http://www.renewableenergyworld.com/rea/tech/why York Region Solar PV & Smart Grid Technologies. (n.d.). Retrieved April 8, 2015, from http://www.investinyork.ca/wp-content/uploads/2012/10/Solar- 1.2web.pdf

22
APPENDIX A
Technical Brochure of Solar SF 160-24-P PV Modules

23

24
25

26
APPENDIX B
Solar Insolation Data

27
Solar insolation data of the Toronto region collected by Natural Resources
Canada, 2014

28
APPENDIX C
A visual diagram of the PV panels used to obtain global insolation (Natural Resources
Canada, 2014)

29
Solar insolation data of the Toronto region collected by Natural Resources
Canada, 2014