north shore of long island, asharoken, new york coastal...
TRANSCRIPT

North Shore of Long Island,
Asharoken, New York
Coastal Storm Risk Management
Feasibility Study
Appendix C
Cost Engineering
November 2015
Asharoken, New York Feasibility Report
APPENDIX C
COST ESTIMATES
Asharoken, New York Feasibility Report
NORTH SHORE OF LONG ISLAND
COASTAL STORM RISK MANAGEMENT – FEASIBILITY STUDY
ASHAROKEN, NY
APPENDIX C - COST ESTIMATES
Table of Contents Introduction ...................................................................................................................................C1
Basis of Cost ........................................................................................................................ C3
Contingencies ..................................................................................................................... C4
Lands and Damages ............................................................................................................. C9
Planning, Engineering and Design ...................................................................................... . C9
Construction Management .................................................................................................. C9
Interest During Construction ............................................................................................... C9
Renourishment ................................................................................................................... C9
Major Rehabilitation ......................................................................................................... C10
Operation and Maintenance .............................................................................................. C10
Coastal and Environmental Monitoring............................................................................... C10
Estimated Annual Charges ................................................................................................. C10
Cost Summary.................................................................................................................... C12
List of Tables Table C1 – Alternative Phase First Cost Summary ........................................................................C1
Table C2 – Project First Cost ................................................................................................ C2
Table C3 – Contingencies .................................................................................................. C4-8
Table C4 – Real Estate Costs ................................................................................................ C9
Table C5 – Annualized Cost ............................................................................................... C11
Table C6 – Annualized Cost Comparison ............................................................................. C11

Asharoken, New York Feasibility Report
List of Figures Figure C1– Construction Schedule .................................................................................................C1
Figure C2– Construction Schedule .................................................................................................C3
Figure C3 – Total Project Cost Summary ................................................................. C9 thru C11
List of Attachments Attachment C1 – MII Report
Attachment C2 – District Quality Control (DQC)
Asharoken, New York Feasibility Report
C1
INTRODUCTION
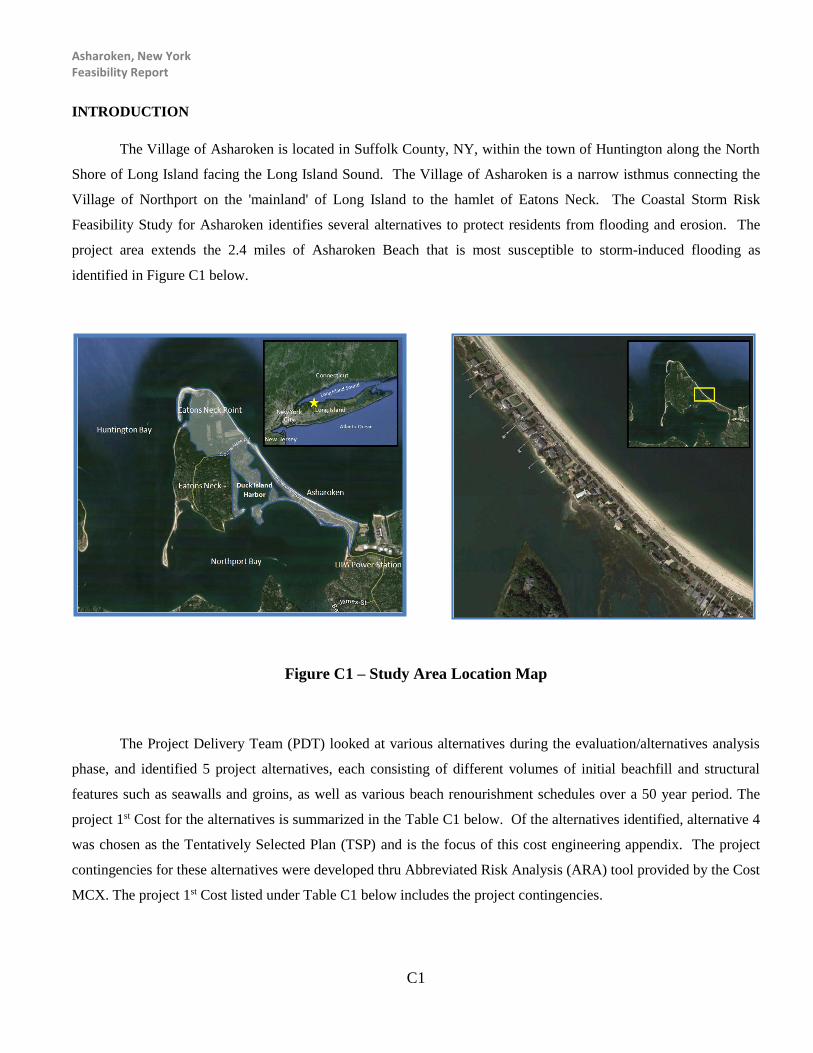
The Village of Asharoken is located in Suffolk County, NY, within the town of Huntington along the North
Shore of Long Island facing the Long Island Sound. The Village of Asharoken is a narrow isthmus connecting the
Village of Northport on the 'mainland' of Long Island to the hamlet of Eatons Neck. The Coastal Storm Risk
Feasibility Study for Asharoken identifies several alternatives to protect residents from flooding and erosion. The
project area extends the 2.4 miles of Asharoken Beach that is most susceptible to storm-induced flooding as
identified in Figure C1 below.
Figure C1 – Study Area Location Map
The Project Delivery Team (PDT) looked at various alternatives during the evaluation/alternatives analysis
phase, and identified 5 project alternatives, each consisting of different volumes of initial beachfill and structural
features such as seawalls and groins, as well as various beach renourishment schedules over a 50 year period. The
project 1st Cost for the alternatives is summarized in the Table C1 below. Of the alternatives identified, alternative 4
was chosen as the Tentatively Selected Plan (TSP) and is the focus of this cost engineering appendix. The project
contingencies for these alternatives were developed thru Abbreviated Risk Analysis (ARA) tool provided by the Cost
MCX. The project 1st Cost listed under Table C1 below includes the project contingencies.

Asharoken, New York Feasibility Report
C2
Table C1 – Alternative Phase First Cost Summary
Alternative 4 was chosen as the Tentatively Selected Plan (TSP), providing the most increased storm damage
protection at the northwest steel bulkhead seawall; retains the minimum design width at the southeast timber
bulkhead section; and has a reduced erosion rate, nourishment frequency, and quantity at the critical erosion reaches.
The TSP consists an initial placement of 600,000 cy of dredged beachfill, the construction of three Rock Groins of
120 ft, 100 ft and 80 ft in length, and a renourishment cycle of 80,000 cy of beachfill every 5 years for 50 years The
Total First Cost developed for the initial construction project elements is presented in Table C2
Table C2- First Cost
Feat.
Acct. Description Qty UoM Subtotal Contingency % Cont $$ Total Cost
10 Breakwaters and Seawalls 1 LS 1,265,000$ 33% 417,703$ 1,682,703$
17 Beach Replenishment
Hydraulic Beach Fill 1 LS 9,831,485.47$ 21% 2,101,972$ 11,933,457$
Timber Pedestrian Dune Walkover 1 LS 315,514.53$ 21% 67,457$ 382,972$
CONSTRUCTION ESTIMATE TOTALS: 1 LS 11,412,000$ 23% 2,587,132$ 13,999,132$
01 Lands and Damages 1 LS 5,247,000$ 12% 624,624$ 5,871,624$
30 Planning, Engineering & Design 1 LS 2,570,000$ 8% 198,276$ 2,768,276$
31 Construction Management 1 LS 967,685$ 6% 58,061$ 1,025,746$
TOTAL FIRST COST 21,461,685$ 3,885,795$ 23,664,777$
Asharoken, Long Island NYOCT 2014 Price Level
Alternative 4 Total First Cost
Asharoken, New York Alternative 1 Alternative 2 Alternative 3 Alternative 4 Alternative 5
Beachfill and Buried Beachfill and Buried Beachfill and Beachfill and Beachfill Only Seawall-full shoreline Seawall-half shoreline Three West Groins 3 West, 8 East Groins
Initial Fill Volume (CY) 600,000 375,000 450,000 600,000 600,000 Coastal Structures n/a buried seawall partial buried seawall 3 rock groins 11 rock groins Nourishment (cy/period) 60,000 cy/3 yrs 200,000 cy/10 yrs 200,000 cy/10 yrs 80,000 cy/5 yrs 100,000 cy/10 yrs Total Nourishment in 50yrs 1,000,000 cy 1,000,000 cy 1,000,000 cy 800,000 cy 500,000 cy
COSTS Initial Construction Cost $21,552,000 $66,931,000 $45,940,000 $23,665,000 $32,426,000

Asharoken, New York Feasibility Report
C3
BASIS OF COST
The construction cost estimate was developed using the Corps of Engineers Dredge Estimating Program
(CEDEP) and Micro-Computer Aided Cost Estimating System (MCACES), Second Generation (MII) using the
appropriate Work Breakdown Structure (WBS), based on current estimated quantities provided by the Design and
Hydraulics & Hydrology engineers. Using the quantities, the cost estimate was developed utilizing cost resources
such as RSMeans, historical data on similar construction features, contractor quotes, and MII Cost Libraries. The
contingencies for the plans were developed based on the PDT discussion on various features of the project using the
Abbreviated Risk Analysis (ARA) template provided by the Cost Mandatory Center of Expertise (MCX), Walla
Walla District. These contingencies were applied to the construction cost estimates to develop the Total Project First
Cost. The construction duration for the TSP was estimated at 8 months, as show on Figure C2 below. The
construction schedule for the plan was developed based on the crew outputs referenced from RSMeans and assuming
multiple crews working simultaneously.
Figure C2 – Construction Schedule
CONTINGENCIES
As stated in ER 1110-2-1302, the goal in contingency development is to identify the uncertainty associated
with an item of work or task to an acceptable degree of confidence. Consideration must be given to the detail
available at each stage of planning, design, or construction for which a cost estimate is being prepared.
Contingencies may vary throughout the cost estimate and could constitute significant portion of the overall costs
when the lack of investigated data or design details are available. Final contingency development and assignment
that describes the potential for cost growth is included in the cost estimate. During development of the cost

Asharoken, New York Feasibility Report
C4
estimates, sufficient contingencies developed via PDT discussion during CSRA were applied to develop the Total
Project First Cost. The CSRA for the TSP is show in Table C3 in the following page.
Table C3 – Contingencies
Project (less than $40M):
Project Development Stage/Alternative:
Risk Category: Meeting Date: 2/12/2015
Total Estimated Construction Contract Cost = 55,273,250$
CWWBS Feature of Work Contract Cost % Contingency $ Contingency Total
01 LANDS AND DAMAGES Real Estate 5,247,000$ 11.90% 624,416$ 5,871,416$
10 BREAKWATERS AND SEAWALLS Groins 1,265,079$ 33.02% 417,785$ 1,682,864$
17 BEACH REPLENISHMENT Beach Fill 9,831,657$ 21.38% 2,102,296$ 11,933,953$
17 BEACH REPLENISHMENT Crossover 315,514$ 21.93% 69,204$ 384,718$
17 BEACH REPLENISHMENT Renourishment 43,861,000$ 12.63% 5,541,362$ 49,402,362$
-$ 0.00% -$ -$
-$ 0.00% -$ -$
-$ 0.00% -$ -$
-$ 0.00% -$ -$
-$ 0.00% -$ -$
-$ 0.00% -$ -$
-$ 0.00% -$ -$
All Other Remaining Construction Items -$ 0.0% 0.00% -$ -$
30 PLANNING, ENGINEERING, AND DESIGN Planning, Engineering, & Design 6,187,000$ 7.72% 477,328$ 6,664,328$
31 CONSTRUCTION MANAGEMENT Construction Management 5,184,000$ 6.00% 310,798$ 5,494,798$
FIXED DOLLAR RISK ADD (EQUALLY DISPERSED TO ALL, MUST INCLUDE JUSTIFICATION SEE BELOW) -$
KEEP
KEEP Totals
KEEP Real Estate 5,247,000$ 11.90% 624,416$ 5,871,416.09$
KEEP Total Construction Estimate 55,273,250$ 14.71% 8,130,648$ 63,403,898$
KEEP Total Planning, Engineering & Design 6,187,000$ 7.72% 477,328$ 6,664,328$
KEEP Total Construction Management 5,184,000$ 6.00% 310,798$ 5,494,798$ KEEP
KEEP Total 71,891,250$ 13% 9,543,190$ 81,434,440$
RANGE Base 50% 80%
RANGE Range Estimate ($000's) $71,891k $77,617k $81,434k
Abbreviated Risk Analysis
Project Example
Alternative Formulation
Moderate Risk: Typical Project Construction Type
Alternative #4Alternative:
Meeting Date: 11-Feb-15
PDT Members
Project Management: Ronald Pinzon
Planner: Gregory B. Aponte
Engieering Manager: Seth Greenwald
Contracting:
Real Estate: Robert Vohden
Relocations:
Economist: Johnny Chan
Engineering & Design:
Technical Lead:
Geotech:
H&H
Civil: David Yang
Structural:
Mechanical:
Electrical:
Cost Engineering: Cynthia Zhang
Cost Engineering: Emily Eng
Note: PDT involvement is commensurate with project size and involvement.
Asharoken, New York Feasibility Report
C5
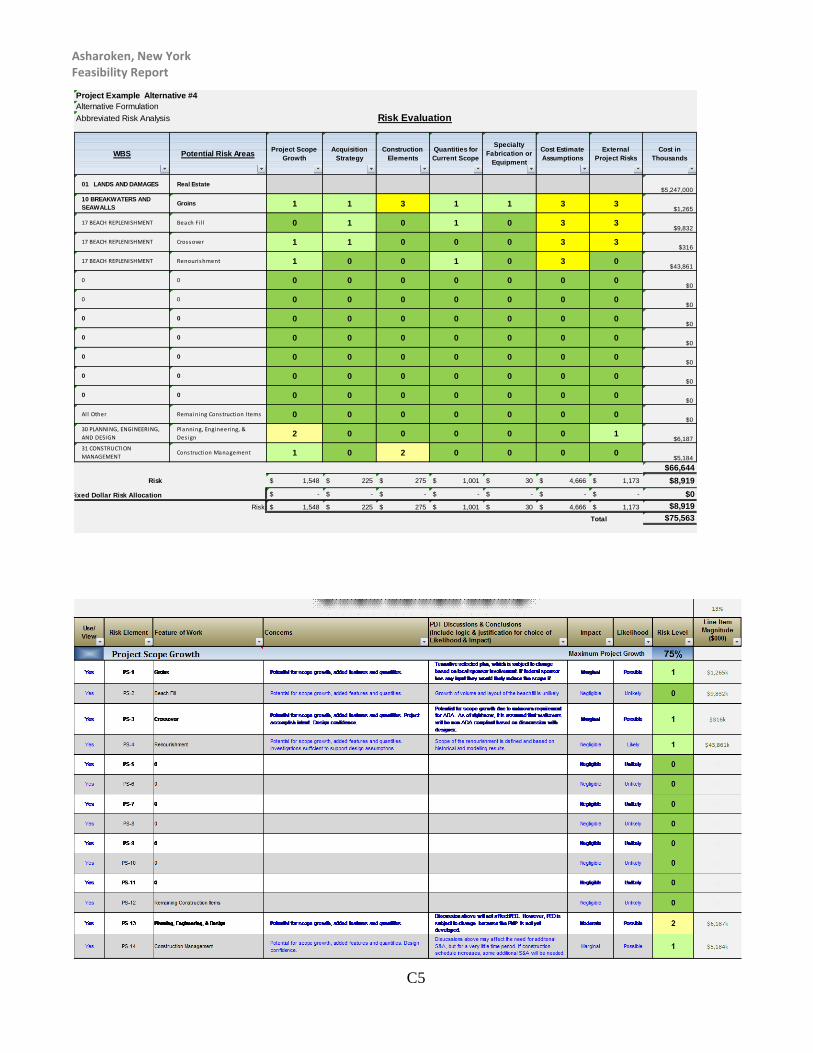
Project Example Alternative #4
Alternative Formulation
Abbreviated Risk Analysis Risk Evaluation
WBS Potential Risk AreasProject Scope
Growth
Acquisition
Strategy
Construction
Elements
Quantities for
Current Scope
Specialty
Fabrication or
Equipment
Cost Estimate
Assumptions
External
Project Risks
Cost in
Thousands
01 LANDS AND DAMAGES Real Estate$5,247,000
10 BREAKWATERS AND
SEAWALLSGroins 1 1 3 1 1 3 3
$1,265
17 BEACH REPLENISHMENT Beach Fi l l 0 1 0 1 0 3 3$9,832
17 BEACH REPLENISHMENT Crossover 1 1 0 0 0 3 3$316
17 BEACH REPLENISHMENT Renourishment 1 0 0 1 0 3 0$43,861
0 0 0 0 0 0 0 0 0$0
0 0 0 0 0 0 0 0 0$0
0 0 0 0 0 0 0 0 0$0
0 0 0 0 0 0 0 0 0$0
0 0 0 0 0 0 0 0 0$0
0 0 0 0 0 0 0 0 0$0
0 0 0 0 0 0 0 0 0$0
Al l Other Remaining Construction Items 0 0 0 0 0 0 0$0
30 PLANNING, ENGINEERING,
AND DESIGN
Planning, Engineering, &
Des ign 2 0 0 0 0 0 1$6,187
31 CONSTRUCTION
MANAGEMENTConstruction Management 1 0 2 0 0 0 0
$5,184
$66,644
Risk 1,548$ 225$ 275$ 1,001$ 30$ 4,666$ 1,173$ $8,919
Fixed Dollar Risk Allocation -$ -$ -$ -$ -$ -$ -$ $0
Risk 1,548$ 225$ 275$ 1,001$ 30$ 4,666$ 1,173$ $8,919
Total $75,563

Asharoken, New York Feasibility Report
C6
Acquisition Strategy Maximum Project Growth 30%
Yes
AS-1 Groins
Requirement for subcontracting.
It is likely that the Dredging Contractor w ill bid on the project
as a prime and sub out the groins. We don't anticipate
impact to the cost as it is a typical strategy. How ever,
changed bid environment can affect price such as availibility
of subcontractor.
Negligible Likely 1 $1,265k
Yes AS-2 Beach Fill Requirement for subcontracting
It is likely that the Dredging Contractor w ill bid on the project
as a prime and sub out the shore w ork. We don't anticipate
impact to the cost as it is a typical strategy. How ever,
changed bid environment can affect price such as availibility
of subcontractor.
Negligible Likely 1 $9,832k
Yes AS-3 Crossover Requirement for subcontracting Likely to be subbed out, but given the small cost of the
w ork, therefore it w ill not greatly increse the overcost
Negligible Likely 1 $316k
Yes AS-4 Renourishment Limited bid competition anticipatedCompetition of delivery of sand is competitive due to the
number of sand quarries in the countyNegligible Unlikely 0 $43,861k
Yes AS-5 0 Negligible Unlikely 0 $k
Yes AS-6 0 Negligible Unlikely 0 $k
Yes
AS-7 0Negligible Unlikely 0 $k
Yes
AS-8 0Negligible Unlikely 0 $k
Yes
AS-9 0Negligible Unlikely 0 $k
Yes
AS-10 0Negligible Unlikely 0 $k
Yes
AS-11 0Negligible Unlikely 0 $k
Yes
AS-12 Remaining Construction Items Negligible Unlikely 0 $k
Yes AS-13 Planning, Engineering, & Design N/A N/A Negligible Unlikely 0 $6,187k
Yes AS-14 Construction Management N/A N/A Negligible Unlikely 0 $5,184k
Construction Elements Maximum Project Growth 25%
Yes CE-1 GroinsAccerlerated schedule or harsh w eather schedule. High risk or
complex construction elements, site access, in-w ater?
Environmental w indow s w ill limit the time period to
construct. How ever environmental w indow s are know n
and w ill be factor into the construction w indow s. Unsure of
delivery method of stones (barge vs. trucking).
Signif icant Possible 3 $1,265k
Yes CE-2 Beach Fill Accelerated schedule or harsh w eather schedule.
Bad w eather days area already factor into our design.
Therefore it is not a concern. Environmental w indow s are
know n and w ill be factor into the construction w indow s.
Negligible Possible 0 $9,832k
Yes CE-3 Crossover N/A N/A Negligible Unlikely 0 $316k
Yes CE-4 Renourishment Accelerated schedule or harsh w eather schedule.
Bad w eather days area already factor into our design.
Therefore it is not a concern. Environmental w indow s are
know n and w ill be factor into the construction w indow s.
Negligible Possible 0 $43,861k
Yes CE-5 0 Negligible Unlikely 0 $k
Yes CE-6 0 Negligible Unlikely 0 $k
Yes
CE-7 0Negligible Unlikely 0 $k
Yes
CE-8 0Negligible Unlikely 0 $k
Yes
CE-9 0Negligible Unlikely 0 $k
Yes
CE-10 0Negligible Unlikely 0 $k
Yes
CE-11 0Negligible Unlikely 0 $k
Yes
CE-12 Remaining Construction Items Negligible Unlikely 0 $k
Yes CE-13 Planning, Engineering, & Design N/A N/A Negligible Unlikely 0 $6,187k
Yes CE-14 Construction Management High risk or complex construction elements, site access, in w ater.Miitigation monitoring needs to be done during
construction. The extend of monitoring is unknow n.Marginal Likely 2 $5,184k

Asharoken, New York Feasibility Report
C7
Quantities for Current Scope Maximum Project Growth 20%
Yes
Q-1 Groins
Appropriate methods applied to calculate quantities. Level of
confidence based on design and assumptions.
Design are confident in the quantities of groins. Quantities
may change based on new survey data.Marginal Possible 1 $1,265k
Yes Q-2 Beach Fill
Appropriate methods applied to calculate quantities. Level of
confidence based on design and assumptions. Possibility for
increased quantities due to loss, w aste or subsidence.
Confident in current quantities and method of calculation.
Quantities base on older survey. Contingency factors
already considered to cover the the storm conditions that
can impact the quantities due to loss of beach..
Marginal Possible 1 $9,832k
Yes Q-3 Crossover N/A N/A Negligible Unlikely 0 $316k
Yes Q-4 Renourishment
Possibility for increased quantities due to loss, w aste, or
subsidence. Level of confidence based on design and assumptions.
Appropriate methods applied to calculated quantities.
We don't anticipate changes in quantities base on
historical analysis. Contingency factors already build into
the quantity.
Moderate Unlikely 1 $43,861k
Yes Q-5 0 Negligible Unlikely 0 $k
Yes Q-6 0 Negligible Unlikely 0 $k
Yes
Q-7 0Negligible Unlikely 0 $k
Yes
Q-8 0Negligible Unlikely 0 $k
Yes
Q-9 0Negligible Unlikely 0 $k
Yes
Q-10 0Negligible Unlikely 0 $k
Yes
Q-11 0Negligible Unlikely 0 $k
Yes Q-12 Remaining Construction Items Negligible Unlikely 0 $k
Yes Q-13 Planning, Engineering, & Design N/A N/A Negligible Unlikely 0 $6,187k
Yes Q-14 Construction Management N/A N/A Negligible Unlikely 0 $5,184k
Specialty Fabrication or Equipment Maximum Project Growth 75%
Yes
FE-1 Groins Specialty equipment Crane/barge may be required for groin placementMarginal Possible 1 $1,265k
Yes FE-2 Beach Fill N/A N/A Negligible Unlikely 0 $9,832k
Yes FE-3 Crossover N/A N/A Negligible Unlikely 0 $316k
Yes FE-4 Renourishment N/A N/A Negligible Unlikely 0 $43,861k
Yes FE-5 0 Negligible Unlikely 0 $k
Yes FE-6 0 Negligible Unlikely 0 $k
Yes
FE-7 0Negligible Unlikely 0 $k
Yes
FE-8 0Negligible Unlikely 0 $k
Yes
FE-9 0Negligible Unlikely 0 $k
Yes
FE-10 0Negligible Unlikely 0 $k
Yes
FE-11 0Negligible Unlikely 0 $k
Yes FE-12 Remaining Construction Items Negligible Unlikely 0 $k
Yes FE-13 Planning, Engineering, & Design N/A N/A Negligible Unlikely 0 $6,187k
Yes FE-14 Construction Management N/A N/A Negligible Unlikely 0 $5,184k
Asharoken, New York Feasibility Report
C8
LANDS AND DAMAGES
In order to construct the proposed plan of improvement, local interests would be required to provide certain
lands and easements. The total lands and damages costs provided by the real estate PDT member are identified in
the table below, and are included in the total project cost.
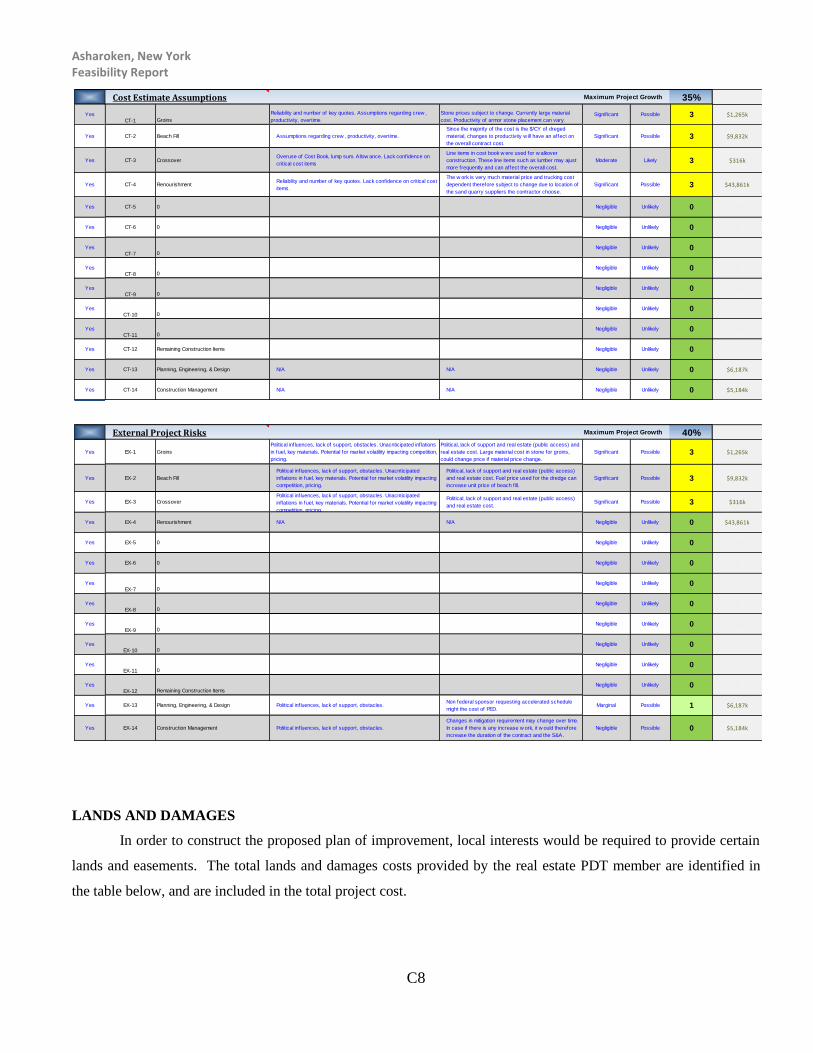
Cost Estimate Assumptions Maximum Project Growth 35%
Yes
CT-1 Groins
Reliability and number of key quotes. Assumptions regarding crew ,
productivity, overtime.
Stone prices subject to change. Currently large material
cost. Productivity of armor stone placement can vary.Signif icant Possible 3 $1,265k
Yes CT-2 Beach Fill Assumptions regarding crew , productivity, overtime.
Since the majority of the cost is the $/CY of dreged
material, changes to productivity w ill have an affect on
the overall contract cost.
Signif icant Possible 3 $9,832k
Yes CT-3 Crossover Overuse of Cost Book, lump sum. Allow ance. Lack confidence on
critical cost items
Line items in cost book w ere used for w alkover
construction. These line items such as lumber may ajust
more frequently and can affect the overall cost.
Moderate Likely 3 $316k
Yes CT-4 RenourishmentReliability and number of key quotes. Lack confidence on critical cost
items.
The w ork is very much material price and trucking cost
dependent therefore subject to change due to location of
the sand quarry suppliers the contractor choose.
Signif icant Possible 3 $43,861k
Yes CT-5 0 Negligible Unlikely 0 $k
Yes CT-6 0 Negligible Unlikely 0 $k
Yes
CT-7 0Negligible Unlikely 0 $k
Yes
CT-8 0Negligible Unlikely 0 $k
Yes
CT-9 0Negligible Unlikely 0 $k
Yes
CT-10 0Negligible Unlikely 0 $k
Yes
CT-11 0Negligible Unlikely 0 $k
Yes CT-12 Remaining Construction Items Negligible Unlikely 0 $k
Yes CT-13 Planning, Engineering, & Design N/A N/A Negligible Unlikely 0 $6,187k
Yes CT-14 Construction Management N/A N/A Negligible Unlikely 0 $5,184k
External Project Risks Maximum Project Growth 40%
Yes EX-1 Groins
Political influences, lack of support, obstacles. Unacnticipated inflations
in fuel, key materials. Potential for market volatility impacting competition,
pricing.
Political, lack of support and real estate (public access) and
real estate cost. Large material cost in stone for groins,
could change price if material price change.
Signif icant Possible 3 $1,265k
Yes EX-2 Beach Fill
Political influences, lack of support, obstacles. Unacnticipated
inflations in fuel, key materials. Potential for market volatility impacting
competition, pricing.
Political, lack of support and real estate (public access)
and real estate cost. Fuel price used for the dredge can
increase unit price of beach fill.
Signif icant Possible 3 $9,832k
Yes EX-3 Crossover
Political influences, lack of support, obstacles. Unacnticipated
inflations in fuel, key materials. Potential for market volatility impacting
competition, pricing.
Political, lack of support and real estate (public access)
and real estate cost. Signif icant Possible 3 $316k
Yes EX-4 Renourishment N/A N/A Negligible Unlikely 0 $43,861k
Yes EX-5 0 Negligible Unlikely 0 $k
Yes EX-6 0 Negligible Unlikely 0 $k
Yes
EX-7 0Negligible Unlikely 0 $k
Yes
EX-8 0Negligible Unlikely 0 $k
Yes
EX-9 0Negligible Unlikely 0 $k
Yes
EX-10 0Negligible Unlikely 0 $k
Yes
EX-11 0Negligible Unlikely 0 $k
Yes
EX-12 Remaining Construction Items Negligible Unlikely 0 $k
Yes EX-13 Planning, Engineering, & Design Political influences, lack of support, obstacles.Non federal sponsor requesting accelerated schedule
might the cost of PED.Marginal Possible 1 $6,187k
Yes EX-14 Construction Management Political influences, lack of support, obstacles.
Changes in mitigation requirement may change over time.
In case if there is any increase w ork, it w ould therefore
increase the duration of the contract and the S&A.
Negligible Possible 0 $5,184k

Asharoken, New York Feasibility Report
C9
Table C4 – Real Estate Costs
PLANNING, ENGINEERING AND DESIGN
The costs were developed for all activities associated with the planning, engineering and design effort. The
cost for this account includes the preparation of Design Documentation Reports and plans and specifications for the
TSP and engineering support during construction through project completion. It includes all the in-house labor based
upon work-hour requirements, material and facility costs, travel and overhead. The percentage breakout in the Total
Project Cost Summary (TPCS) was developed based on input from respective offices in accordance with the CWBS
as well as historical prices.
CONSTRUCTION MANAGEMENT
The costs were developed for all construction management activities from pre-award requirements through
final contract closeout. These costs include the in-house labor based upon work-hour requirements, materials, facility
costs, support contracts, travel and overhead. Costs were developed based on the input from the construction division
in accordance with the CWBS and include but are not limited to anticipated items such as the salaries of the resident
engineer and staff, survey men, inspectors, draftsmen, clerical, and custodial personnel; operation, maintenance and
fixed charges for transportation and for other field equipment; field supplies; construction management, general
construction supervision; project office administration, distributive cost of area office and general overhead charged
to the project. The work items and activities would include, but not be limited to: the salaries of all supervisory,
engineering, office and safety field personnel; all on site expenses.
INTEREST DURING CONSTRUCTION
Interest during construction (IDC) is the cost of construction money invested before the beginning of the
period of economic analysis and before the accumulation of benefits by the project. IDC costs have been added to
the project cost to determine investment costs. Average annual costs were determined based on investment costs
which include IDC. The pre-base year costs were estimated using the Federal interest rate of 3.375 percent (FY15).
RENOURISHMENT COSTS
TOTAL PROJECT REAL ESTATE COSTS Non-Federal Federal Project Cost
ASHAROKEN
Cost Summary:
Incidental Costs (01A) $3,022,200 $3,022,200
Real Estate Acquisition Costs (01B) $2,224,989 $0 $2,224,989
Subtotal: $5,247,189 $0 $5,247,189
20% Contingency, Less Land Payments (01B1 ) $624,440 $0 $624,440
01 LANDS AND DAMAGES $5,871,628 $0 $5,871,628
Project Mangement Costs (30) $501,100 $501,100
Subtotal: $501,100 $501,100
20% Contingency $100,220 $100,200
30 PROJECT MANAGEMENT $601,320 $601,320

Asharoken, New York Feasibility Report
C10
The Renourishment costs for Alternative 4 are based on a renourishment cycle of 80,000 cubic yards of
beach fill placed every 5 years for 50 years.
MAJOR REHABILTATION COSTS
The Major Rehabilitation costs were estimated to represent the cost for possible emergency placement of
beach fill, resulting from 200 year, 100 year, 50 year and 20 year storms, over the 50 year life of the project, and are
weighted by the probability of such a storm occurring between renourishment cycles.
OPERATION AND MAINTENANCE
The Operation and Maintenance (O&M) costs were estimated to represent the anticipated annual costs
necessary to maintain the project throughout the project life. The majority of the maintenance cost is due to groin
maintenance, which is calculated as 0.5% of the total cost of the groin construction, based on historical maintenance
costs for groins and seawalls. Additionally, minor maintenance costs are attributed to annual dune maintenance.
COASTAL AND ENVIRONMENTAL MONITORING
Coastal and environmental monitoring costs have been provided by the costal and environmental section
PDT members, and represent the annualized cost for the monitoring of flora and fauna, and surveying of borrow
source and beach fill during construction. The majority of these costs occur during years 1 through 5 of the 50 year
project life.
ESTIMATED ANNUAL COSTS
Annual costs are based on an economic project life of 50 year and an interest rate of 3.375%. The annual
charges include the annualized investment costs along with annual operation and maintenance costs. A detailed
breakdown of annual costs for the TSP is presented in Table C5 below.

Asharoken, New York Feasibility Report
C11
Table C5 – Annualize Cost
When compared to the five project alternatives, alternative 4 provides the least annual cost, as shown in table
C6 below.
Table C6 – Annual Cost Comparison
Project First Cost 23,665,000$
Interest During Construction 230,698$
Total Investment Cost: 23,895,698$
Annual CostsAnnualized Initial Construction Cost (a) 806,000$
Annualized Scheduled Renourishment (b) 883,000$
Annualized Major Rehab Cost (c) 130,000$
Annual Dune & Groin Maintenance Cost (d) 26,000$
Annual Coastal Monitoring Cost 9,000$
Annual Environmental Monitoring Cost 41,000$
Total Annual Cost* 1,895,000$
*OCT 2014 Price Level
Section I
(a) I = 3.38% and n = 50 yrs
(b) From Renourishment table, 80,000 cy every 5 yrs, for 50 yrs
(c) From Annualized Major Rehabilitation Cost Table
(d) Based 0.5% of initial new groin, groin extension and groin rehabilitation costs from First Cost table on TPCS.

Asharoken, New York Feasibility Report
C12
COST SUMMARY
The Total Fully Funded Project cost for the TSP (Alternative 4) is $24,721,000 for initial nourishment and
$124,607,000 for renourishment over a 50 year time period. The costs are to be 65% federally funded and 35% non-
federally funded for initial construction and 50% federally funded and 50% non-federally funded for renourishment.
Figure C2 below provides the Total Project Cost Summary for alternative 4, which includes contingencies and
escalation. The project first cost is escalates each WBS cost to the project program year, and the fully funded total
project cost is escalated through the 50 year project life to total project completion.
Figure C3 – Total Project Cost Summary
PROJECT: DISTRICT: NAN New York PREPARED: 9/26/2015
PROJECT NO:- POC: CHIEF, COST ENGINEERING, Mukesh Kumar
LOCATION: Asharoken, Long Island
This Estimate reflects the scope and schedule in report; -
Program Year (Budget EC): 2017
Effective Price Level Date: 1 OCT16
Spent Thru:
WBS Civil Works COST CNTG CNTG TOTAL ESC COST CNTG TOTAL 26-Sep-15 COST CNTG FULL
NUMBER Feature & Sub-Feature Description ($K) ($K) (%) ($K) (%) ($K) ($K) ($K) ($K) ($K) ($K) ($K)
A B C D E F G H I J K L M N O
10 BREAKWATER & SEAWALLS $1,265 $418 33% $1,683 2.2% $1,293 $427 $1,719 $0 $1,323 $437 $1,760
17 BEACH REPLENISHMENT $10,147 $2,169 21% $12,316 2.2% $10,368 $2,217 $12,585 $0 $10,561 $2,258 $12,819
CONSTRUCTION ESTIMATE TOTALS: $11,412 $2,587 $13,999 2.2% $11,661 $2,644 $14,304 $0 $11,884 $2,695 $14,579
01 LANDS AND DAMAGES $5,247 $625 12% $5,872 2.2% $5,361 $638 $6,000 $0 $5,410 $644 $6,054
30 PLANNING, ENGINEERING & DESIGN $2,570 $198 8% $2,768 4.9% $2,695 $208 $2,903 $0 $2,747 $212 $2,959
31 CONSTRUCTION MANAGEMENT $968 $58 6% $1,026 4.9% $1,015 $61 $1,076 $0 $1,065 $64 $1,128
PROJECT COST TOTALS: $20,197 $3,468 $23,665 $20,733 $3,551 $24,283 $0 $21,106 $3,615 $24,721
17 BEACH REPLENISHMENT renourishments $43,861 $5,540 13% $49,400 2.2% $44,817 $5,660 $50,477 $0 $80,996 $10,230 $91,226
RENOURISHMENT ESTIMATE TOTALS: $43,861 $5,540 $49,400 2.2% $44,817 $5,660 $50,477 $0 $80,996 $10,230 $91,226
30 PLANNING, ENGINEERING & DESIGN renourishments $3,617 $279 8% $3,896 4.9% $3,794 $293 $4,086 $0 $10,881 $839 $11,721
31 CONSTRUCTION MANAGEMENT renourishments $4,216 $253 6% $4,469 4.9% $4,422 $265 $4,687 $0 $20,434 $1,226 $21,660
PROJECT COST TOTALS: $51,694 $6,072 $57,765 $53,032 $6,218 $59,251 $0 $112,311 $12,295 $124,607
Mandatory by Regulation CHIEF, COST ENGINEERING, Mukesh Kumar
ESTIMATED FEDERAL COST: 65% $16,069
PROJECT MANAGER, Ron Pinzon ESTIMATED NON-FEDERAL COST: 35% $8,652
CHIEF, REAL ESTATE, Noreen Dresser ESTIMATED TOTAL PROJECT COST: $24,721
CHIEF, PLANNING,Frank Santomauro ESTIMATED FEDERAL COST: 50% $62,303
ESTIMATED NON-FEDERAL COST: 50% $62,303
CHIEF, ENGINEERING, Arthur Connolly
ESTIMATED RENOURISHMENT TOTAL PROJECT COST: $124,607
CHIEF, OPERATIONS, Tom Creamer
CHIEF, CONSTRUCTION, Gerald Byrne
CHIEF, CONTRACTING,Frank Cashman
CHIEF, PM-PB, Anthony Ciorra
CHIEF, DPM, Joseph Seebode
Asharoken - Alternative 4
Civil Works Work Breakdown Structure ESTIMATED COSTPROJECT FIRST COST
(Constant Dollar Basis)
Mandatory by Regulation
Mandatory by Regulation
TOTAL PROJECT COST (FULLY FUNDED)

Asharoken, New York Feasibility Report
C13
**** CONTRACT COST SUMMARY ****
PROJECT: DISTRICT: NAN New York PREPARED: 9/26/2015
LOCATION: Asharoken, Long Island POC: CHIEF, COST ENGINEERING, Mukesh Kumar
This Estimate reflects the scope and schedule in report; -
9/26/2015 2017
26-Sep-2015 1 Oct16
RISK BASED
WBS Civil Works COST CNTG CNTG TOTAL ESC COST CNTG TOTAL Mid-Point INFLATED COST CNTG FULL
NUMBER Feature & Sub-Feature Description ($K) ($K) (%) ($K) (%) ($K) ($K) ($K) Date (%) ($K) ($K) ($K)
A B C D E F G H I J P L M N O
Contract #1
10 BREAKWATER & SEAWALLS $1,265 $418 33% $1,683 2.2% $1,293 $427 $1,719 2018Q2 2.3% $1,323 $437 $1,760
17 BEACH REPLENISHMENT $10,147 $2,169 21% $12,316 2.2% $10,368 $2,217 $12,585 2018Q1 1.9% $10,561 $2,258 $12,819
__________ __________ _________ ____________ _________ _________ _____________ _________ _________ ____________
CONSTRUCTION ESTIMATE TOTALS: $11,412 $2,587 23% $13,999 $11,661 $2,644 $14,304 $11,884 $2,695 $14,579
01 LANDS AND DAMAGES $5,247 $625 12% $5,872 2.2% $5,361 $638 $6,000 2017Q3 0.9% $5,410 $644 $6,054
30 PLANNING, ENGINEERING & DESIGN
2.5% Project Management $285 $22 8% $307 4.9% $299 $23 $322 2017Q3 1.9% $305 $24 $328
1.0% Planning & Environmental Compliance $114 $9 8% $123 4.9% $120 $9 $129 2017Q3 1.9% $122 $9 $131
8.8% Engineering & Design $999 $77 8% $1,076 4.9% $1,048 $81 $1,129 2017Q3 1.9% $1,068 $82 $1,150
1.0% Reviews, ATRs, IEPRs, VE $114 $9 8% $123 4.9% $120 $9 $129 2017Q3 1.9% $122 $9 $131
0.3%
Life Cycle Updates (cost, schedule,
risks) $29 $2 8% $31 4.9% $30 $2 $33 2017Q3 1.9% $31 $2 $33
0.3% Contracting & Reprographics $29 $2 8% $31 4.9% $30 $2 $33 2017Q3 1.9% $31 $2 $33
1.5% Engineering During Construction $171 $13 8% $184 4.9% $179 $14 $193 2017Q3 1.9% $183 $14 $197
2.0% Planning During Construction $228 $18 8% $246 4.9% $239 $18 $258 2017Q3 1.9% $244 $19 $263
Real Estate Management $601 $46 8% $647 4.9% $630 $49 $679 2017Q3 1.9% $642 $50 $692
31 CONSTRUCTION MANAGEMENT
8.5% Construction Management $968 $58 6% $1,026 4.9% $1,015 $61 $1,076 2018Q2 4.9% $1,065 $64 $1,128
0.0% Project Operation: $0 $0 6% $0 0.0% $0 $0 $0 0-Jan-1900 0.0% $0 $0 $0
0.0% Project Management $0 $0 6% $0 0.0% $0 $0 $0 0-Jan-1900 0.0% $0 $0 $0
CONTRACT COST TOTALS: $20,197 $3,468 $23,665 $20,733 $3,551 $24,283 $21,106 $3,615 $24,721
Estimate Prepared:
TOTAL PROJECT COST (FULLY FUNDED)
Effective Price Level:
Program Year (Budget EC):
Effective Price Level Date:
Asharoken - Alternative 4
ESTIMATED COSTPROJECT FIRST COST
(Constant Dollar Basis)Civil Works Work Breakdown Structure
**** CONTRACT COST SUMMARY ****
PROJECT: DISTRICT: NAN New York PREPARED: 9/26/2015
LOCATION: Asharoken, Long Island POC: CHIEF, COST ENGINEERING, Mukesh Kumar
This Estimate reflects the scope and schedule in report; -
PERIODIC RENOURISHMENT 9/26/2015 2017
(every 3 yrs) 26-Sep-2015 1 OCT 16
RISK BASED
WBS Civil Works COST CNTG CNTG TOTAL ESC COST CNTG TOTAL Mid-Point INFLATED COST CNTG FULL
NUMBER Feature & Sub-Feature Description ($K) ($K) (%) ($K) (%) ($K) ($K) ($K) Date (%) ($K) ($K) ($K)
A B C D E F G H I J P L M N O
17 BEACH REPLENISHMENT Year 5 $5,426 $685 13% $6,111 2.2% $5,544 $700 $6,244 2023Q1 12.4% $6,232 $787 $7,020
17 BEACH REPLENISHMENT Year 10 $4,351 $549 13% $4,900 2.2% $4,445 $561 $5,007 2028Q1 24.1% $5,518 $697 $6,215
17 BEACH REPLENISHMENT Year 15 $4,261 $538 13% $4,799 2.2% $4,353 $550 $4,903 2033Q1 37.0% $5,966 $754 $6,720
17 BEACH REPLENISHMENT Year 20 $4,261 $538 13% $4,799 2.2% $4,353 $550 $4,903 2038Q1 51.3% $6,587 $832 $7,419
17 BEACH REPLENISHMENT Year 25 $4,261 $538 13% $4,799 2.2% $4,353 $550 $4,903 2043Q1 67.1% $7,273 $919 $8,191
17 BEACH REPLENISHMENT Year 30 $4,261 $538 13% $4,799 2.2% $4,353 $550 $4,903 2048Q1 84.4% $8,029 $1,014 $9,044
17 BEACH REPLENISHMENT Year 35 $4,261 $538 13% $4,799 2.2% $4,353 $550 $4,903 2053Q1 103.6% $8,865 $1,120 $9,985
17 BEACH REPLENISHMENT Year 40 $4,261 $538 13% $4,799 2.2% $4,353 $550 $4,903 2058Q1 124.8% $9,788 $1,236 $11,024
17 BEACH REPLENISHMENT Year 45 $4,261 $538 13% $4,799 2.2% $4,353 $550 $4,903 2063Q1 148.2% $10,807 $1,365 $12,171
17 BEACH REPLENISHMENT Year 50 $4,261 $538 13% $4,799 2.2% $4,353 $550 $4,903 2068Q1 174.1% $11,931 $1,507 $13,438
__________ __________ _________ ____________ _________ _________ _____________ _________ _________ ____________
CONSTRUCTION ESTIMATE TOTALS: $43,861 $5,540 13% $49,400 $44,817 $5,660 $50,477 $80,996 $10,230 $91,226
30 PLANNING, ENGINEERING & DESIGN Year 5 $362 $28 8% $390 4.9% $379 $29 $409 2022Q3 23.8% $470 $36 $506
30 PLANNING, ENGINEERING & DESIGN Year 10 $362 $28 8% $390 4.9% $379 $29 $409 2027Q3 52.2% $578 $45 $622
30 PLANNING, ENGINEERING & DESIGN Year 15 $362 $28 8% $390 4.9% $379 $29 $409 2022Q3 23.8% $470 $36 $506
30 PLANNING, ENGINEERING & DESIGN Year 20 $362 $28 8% $390 4.9% $379 $29 $409 2027Q3 52.2% $578 $45 $622
30 PLANNING, ENGINEERING & DESIGN Year 25 $362 $28 8% $390 4.9% $379 $29 $409 2032Q3 90.9% $724 $56 $780
30 PLANNING, ENGINEERING & DESIGN Year 30 $362 $28 8% $390 4.9% $379 $29 $409 2037Q3 143.9% $925 $71 $997
30 PLANNING, ENGINEERING & DESIGN Year 35 $362 $28 8% $390 4.9% $379 $29 $409 2042Q3 212.4% $1,185 $91 $1,277
30 PLANNING, ENGINEERING & DESIGN Year 40 $362 $28 8% $390 4.9% $379 $29 $409 2047Q3 300.1% $1,518 $117 $1,635
30 PLANNING, ENGINEERING & DESIGN Year 45 $362 $28 8% $390 4.9% $379 $29 $409 2052Q3 412.5% $1,944 $150 $2,094
30 PLANNING, ENGINEERING & DESIGN Year 50 $362 $28 8% $390 4.9% $379 $29 $409 2057Q3 556.4% $2,490 $192 $2,682
__________ __________ _________ ____________ _________ _________ _____________ _________ _________ ____________
PLANNING, ENGINEERING & DESIGN TOTALS: $3,617 $279 8% $3,896 $3,794 $293 $4,086 $10,881 $839 $11,721
31 CONSTRUCTION MANAGEMENT Year 5 $422 $25 6% $447 4.9% $442 $27 $469 2023Q1 26.3% $558 $34 $592
31 CONSTRUCTION MANAGEMENT Year 10 $422 $25 6% $447 4.9% $442 $27 $469 2028Q1 55.6% $688 $41 $729
31 CONSTRUCTION MANAGEMENT Year 15 $422 $25 6% $447 4.9% $442 $27 $469 2033Q1 95.5% $864 $52 $916
31 CONSTRUCTION MANAGEMENT Year 20 $422 $25 6% $447 4.9% $442 $27 $469 2038Q1 150.0% $1,105 $66 $1,172
31 CONSTRUCTION MANAGEMENT Year 25 $422 $25 6% $447 4.9% $442 $27 $469 2043Q1 220.2% $1,416 $85 $1,501
31 CONSTRUCTION MANAGEMENT Year 30 $422 $25 6% $447 4.9% $442 $27 $469 2048Q1 310.1% $1,813 $109 $1,922
31 CONSTRUCTION MANAGEMENT Year 35 $422 $25 6% $447 4.9% $442 $27 $469 2053Q1 425.3% $2,323 $139 $2,462
31 CONSTRUCTION MANAGEMENT Year 40 $422 $25 6% $447 4.9% $442 $27 $469 2058Q1 572.8% $2,975 $178 $3,153
31 CONSTRUCTION MANAGEMENT Year 45 $422 $25 6% $447 4.9% $442 $27 $469 2063Q1 761.8% $3,810 $229 $4,039
31 CONSTRUCTION MANAGEMENT Year 50 $422 $25 6% $447 4.9% $442 $27 $469 2068Q1 1003.8% $4,880 $293 $5,173
__________ __________ _________ ____________ _________ _________ _____________ _________ _________ ____________
CONSTRUCTION MANAGEMENT TOTALS: $4,216 $253 6% $4,469 $4,422 $265 $4,687 $20,434 $1,226 $21,660
CONTRACT COST TOTALS: $51,694 $6,072 $57,765 $53,032 $6,218 $59,251 $112,311 $12,295 $124,607
TOTAL PROJECT COST (FULLY FUNDED)Civil Works Work Breakdown Structure ESTIMATED COSTPROJECT FIRST COST
(Constant Dollar Basis)
Estimate Prepared:
Effective Price Level:
Asharoken - Alternative 4
Program Year (Budget EC):
Effective Price Level Date:

Asharoken, New York Feasibility Report
C14
MII Reports

Asharoken, New York Feasibility Report
C15

Asharoken, New York Feasibility Report
C1
District Quality Control (DQC)