north carolina supplemental retirement plans neuberger berman … · 2019-02-14 · february 19,...
TRANSCRIPT

North Carolina Supplemental Retirement PlansNeuberger Berman Large Cap Disciplined GrowthRetention ReviewFebruary 2014

MERCER 1
Summary and Observations
• Neuberger Berman was hired to provide a lower beta / higher quality portfolio to the largecap growth fund– Performance is expected to be better in down markets than up markets
• Neuberger Berman has a strong long term track record but performance has beendisappointing over last four years– Primary issue was mistakes in 2011– Team structure changes exacerbated mistakes
• Very tenured PM team (+20 Years together) and a long track record indicates more skill thanluck
• Mercer Assessment:– 2011 was likely an anomaly– 2012 and 2013 performance consistent with expectations– 2014 likely to be a “normal” year, with fundamentals driving results– We recommend retaining Neuberger, with action to be taken if they do not outperform
in a normal or down year

MERCER
Evaluating Managers on Watch ListProcess
• Objective: Evaluate confidence in manager’s ability to succeed in the future
• Watch List Manager Retention Evaluation– What is the manager’s process and philosophy– When should it be effective and when should it struggle– Is recent performance consistent with expected pattern of performance– Can the team execute the strategy successfully
- Is past performance indicative of ability or luck– Can the strategy succeed in the future
- Stable Team- Process and Philosophy expected to work- Process and Philosophy can be implemented by manager
2February 19, 2014

MERCER
Neuberger BermanPhilosophy and Process
• Growth oriented strategy seeking accelerating earnings growth driven by an identified catalyst
• Valuation discipline enhanced by requirement for attractive free cash flow yield
• Companies must have strong and conservative balances sheets, with ample liquidity tofinance growth
• Experienced management teams with proven ability to execute
• This philosophy should produce a portfolio that will– perform well in most market environments– will excel in down markets– struggle in exuberant markets
3February 19, 2014

MERCER 4February 19, 2014
2009
• Dramatic underperformance• Biased towards quality and
large cap• Risky and small stocks led
market• New PMs added to team.• # of stocks in portfolio begins
to increase to around ~65• turnover decreased
2011
• Lagged index by 6.3% in 2011• Poor stock selection• Underperformed significantly in 2Q11 and 3Q11
when quality was in favor• Netflix and Illumina were major detractors.
• 2012 underperformance was smaller and inline with process for a rising market
• PM team reduced to original 2 members in2012
• 2013 underperformance expected insharply rising market
• # stocks back down to <55, decisionprocess streamlining
2012/2013
Neuberger BermanPerformance Overview
Underperformance in 2009 and 2013expected, 2011/2012 were not expected.

MERCER 5February 19, 2014
Neuberger BermanLong Term Performance Cycle
MERCER
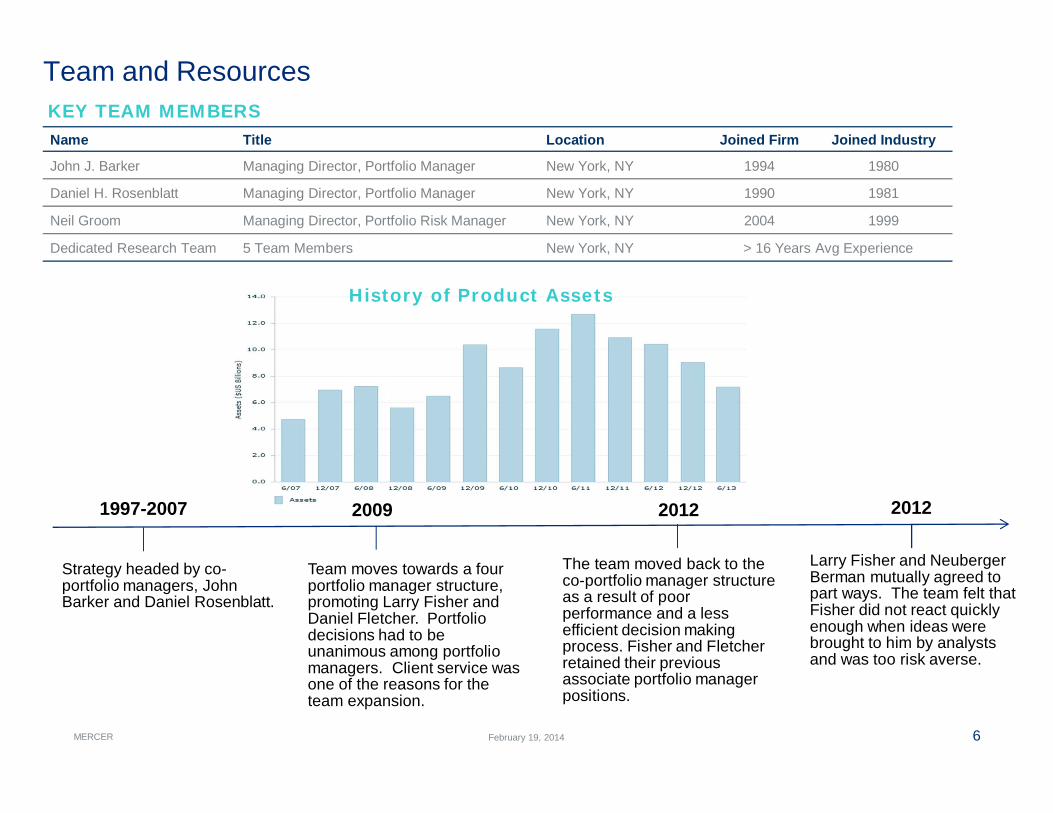
Team and Resources
Name Title Location Joined Firm Joined Industry
John J. Barker Managing Director, Portfolio Manager New York, NY 1994 1980
Daniel H. Rosenblatt Managing Director, Portfolio Manager New York, NY 1990 1981
Neil Groom Managing Director, Portfolio Risk Manager New York, NY 2004 1999
Dedicated Research Team 5 Team Members New York, NY > 16 Years Avg Experience
6February 19, 2014
KEY TEAM MEMBERS
History of Product Assets
Strategy headed by co-portfolio managers, JohnBarker and Daniel Rosenblatt.
1997-2007
Team moves towards a fourportfolio manager structure,promoting Larry Fisher andDaniel Fletcher. Portfoliodecisions had to beunanimous among portfoliomanagers. Client service wasone of the reasons for theteam expansion.
2009 2012
The team moved back to theco-portfolio manager structureas a result of poorperformance and a lessefficient decision makingprocess. Fisher and Fletcherretained their previousassociate portfolio managerpositions.
2012
Larry Fisher and NeubergerBerman mutually agreed topart ways. The team felt thatFisher did not react quicklyenough when ideas werebrought to him by analystsand was too risk averse.

MERCER
Neuberger BermanAsset & Rating History
7February 19, 2014
Date Assets($B)
Clients MercerRating
Comment
May 20091 $6.5 649 B+ Mercer initially rated theDisciplined Growth Strategy
November 20102 $11.6 641 A Mercer upgraded rating to “A”based on the impressive team and
investment process
September 2012 $10.5 530 B+ Mercer downgraded the fund to a“B+” due to the personnel changes
within the team as well asstructure change that took place in
2011
September 2013 $6.6 422 B+ Mercer reaffirmed the “B+” ratingon the strategy
1 Assets and clients as of June 30th 20092 Assets and clients as of December 31, 2010

MERCER
Neuberger BermanStrategy ProfileKey Decision Makers: The core investment team consists of co-portfolio managers Dan Rosenblatt and John Barker who arethe final decision makers. The investment team is supported by four research analysts, one portfolio risk manager, and oneportfolio specialist. Additionally, the team has access to Neuberger's centralized buy-side analysts.
Investment Style/Philosophy: The Large Cap Disciplined Growth team invests in companies with prospective acceleratinggrowth metrics (earnings per share, cash flow, or number of subscribers) driven by an identifiable catalyst. The team seekscompanies that have an experienced and accessible management team, ample liquidity, manageable leverage, and/or the abilityto generate both free cash flow and operating income growth over time. The team believes companies with these qualities havethe potential for price appreciation through earnings growth and an expanding valuation brought about by improved investorperception.
Investment Process: The initial step in the investment process is a simple quantitative screen to identify stocks with market-capitalizations above $3 billion and daily dollar trading volume greater than $100 million. Additionally, debt as a percent of totalcapitalization and price-to-earnings ratios for each respective industry group is considered. These screens typically yieldapproximately 400 companies. Fundamental analysis is then performed to identify potential catalysts that could accelerategrowth at particular companies. This typically reduces the field to approximately 150 names. Examples of identifiable catalystsinclude: new product development, regulatory change, management changes, mergers, acquisitions, demographic shifts andcorporate reorganizations. Next, the team analyzes the significance of the catalyst and quantifies its impact on a company'sgrowth. As a final step, the team will often meet with company management. The investment process typically produces five orsix companies at any given time that meet the team's criteria. While the dedicated team maintains ownership of the process, itsresearch is supplemented with the firm's centralized analyst team throughout the entire process.
The team will sell a stock if one of the following occurs: full accretion of catalyst into relevant metrics or stock price, or failure ofinitial catalyst. A stock will be reviewed if it declines 10% from cost or 15% from its 52-week high.
The portfolio consists of 50 to 70 holdings with no one single position exceeding the maximum of 5% or 1.5x the index weight atcost. Sector weights are restricted to fall between 50% and 150% relative to the benchmark sector (up to +/- 10% for smallersectors). Cash is limited to 5%, ADRs are capped at 15%, and portfolio turnover averages 80%-100%.
8February 19, 2014

MERCER
Strategy ProfileMercer Evaluation Summary
Factor Rating(-, =, + or ++)
Comments
Idea Generation + The generation of ideas is the responsibility of each team member, but ideas are approved by Rosenblatt and Barker. Thisgrowth oriented investment team seeks stocks with accelerating growth metrics, as opposed to those that meet certain highgrowth hurdle rates, and very specific quality metrics. This 'second derivative' approach to growth investing, while reflective of aforward looking, non-consensus oriented investment philosophy, does not necessarily translate into a defensive investmentstrategy on a consistent basis. Neuberger has restructured its large cap growth team over the last several years to generatemore investment ideas for Rosenblatt and Barker to consider and lessen its reliance on the firm's centralized buy-side analysts(used primarily for industry overviews), but has encountered some personnel issues in doing so. On the positive side, theinvestment process is considered sound and research is focused on developing a non-consensus edge. We think ideageneration benefits from the team being specifically dedicated to this one strategy and from the insulation of key team membersfrom most non-investment distractions.
PortfolioConstruction
+ The portfolio is well diversified but is subject to the sector tilts of the growth benchmark (Neuberger generally refrains fromtaking large sector bets relative to the index). Positions are weighted based on index weight plus (or minus) conviction. NeillGroom, as portfolio risk manager, is responsible for tracking the portfolio's risk exposures on a daily basis. BARRA is used toanalyze ex-ante tracking error and the portfolio's Active Share is explicitly managed but not particularly high. Groom's dailydashboard review monitors multiple exposures versus the benchmark and he works very closely with the portfolio managers. Aquarterly portfolio review is conducted which focuses on strategy, style, performance attribution, and risk analysis, mostly for thebenefit of the firm's head of portfolio analysis and equities CIO.
Implementation + Trading resources are sophisticated and capacity/liquidity issues are not a concern at this time.BusinessManagement
+ In December 2008, following the bankruptcy of Lehman, a group of senior investment and management professionals agreed toacquire a majority interest in Lehman's Investment Management Division. We viewed this as a positive development forinvestors in Neuberger Berman and Lehman Brothers funds as the alignment of interests and the longer-term direction of thebusiness was made more stable and clear. Since then, the firm has demonstrated its ability to operate as a stand alone entitywhile retaining talent within the firm and is moving toward 100% employee ownership over the next three years. The firmremains in a strong financial position with revenues from approximately $214 billion in assets under management. Neuberger'scompensation scheme includes a deferred element of up to 25% that, for the Disciplined Large Cap Growth investment team, isinvested in either Neuberger shares or this strategy.
Overall Rating(A, B+, B or C)
B+
The insistence on both free cash flow yield and operating income growth ensure some portfolio emphasis on quality over time, but the strategy is byits nature somewhat chameleonic (i.e., not always defensive) as the team seeks companies with acceleration of a key business metric that can differfrom company to company. Growth and seasoning of the team over the years has added depth to Neuberger's research capabilities. Personnel andstructural changes have been somewhat disruptive, albeit beneficial. While the team leverages the Neuberger's centralized buy-side analyst team tosupplement its research, this group is not utilized for idea generation. The team is knowledgeable and Rosenblatt and Barker provide solid but notnecessarily passionate leadership. Moreover, the support provided by the organization allows the team the luxury of singularity of focus and aminimization of distractions within the context of a firm with an expanding product lineup.
AdditionalObservations
The strategy is considered to be traditional growth and has the potential to perform well in most market environments. Those favoring lower quality orsmaller cap names within the Russell 1000 Growth Index may present performance headwinds for Neuberger.
9February 19, 2014

MERCER
Performance Analysis
10February 19, 2014
The market benchmark ranked high in the universe; thiswas a difficult environment for active managers in this
space

MERCER
Performance Analysis
11February 19, 2014
The market benchmark ranked high in the universe; thiswas a difficult environment for active managers in this
space

MERCER
Performance Analysis
12February 19, 2014
Risk-adjusted return as expected.Strategy exhibited lower risk,
though with lower return.

MERCER 13February 19, 2014
-4.0
-3.0
-2.0
-1.0
0.0
1.0
2.0
3.0
4.0
Book
toPr
ice
Divid
end
Yield
C'Fl
owYi
eld
Sales
toPr
ice
IBES
Engs
Yld
EBIT
DAto
EV
Earn
ingsG
rowt
h
Sales
Grow
th
IBES
12M
thGr
IBES
Engs
LTG
Susta
inable
Grow
th
Mar
ketC
ap
Mar
ketB
eta
Mom
entu
mST
Mom
entu
mM
T
IBES
1YrR
ev
Rtn
onEq
uity
Low
Gear
ing
Earn
ingsG
rSta
bility
Styl
eTi
lt™
'Value' Factors 'Growth' Factors Other Style Factors
Sep 2013 vs Historical Tilt Range - Sep 2007 to Sep 2013 (21)Neuberger Berman vs. Russell 1000 Growth
Holdings Based Style Analysis
• Portfolio exposures generally in line with philosophy
• Low Gearing (financial leverage) indicates conservative balance sheet
• Low Sustainable Growth and RoE indicate portfolio holds stocks whose financial results have not
been strong (and may be poised for an improvement)
• Moderate exposure to forecast earnings growth consistent with buying stocks where market does not
recognize future growth
• Low Cash Flow yield is out of character, but most recent period shows this metric increasing

MERCER
Transition Costs & Risks
Visible Commissions
Taxes
Not Visible Bid/Ask Spreads
Market Impact
Market Movement
(a.k.a., Tracking Error or
Opportunity Cost)
Implicit Costs(Price Movement
or Degradation)
Explicit Costs(Fees)
Known costs –Negotiable(excluding taxes)
Uncertain – Canonly be managed
Can be estimated
Generally greaterthan explicit costs
Uncertain – Cannotbe managed(potentially largestcosts)
Total Cost for US Large Cap Transition 12bp ($408,000) +/- 20bp
(4 ~ 12 bps)
(3 ~ 6 bps)
( +/- 15 ~ 25 bps, @1 std.dev.)

MERCER 15February 19, 2014
Multi-Manager Diversification

MERCER 16
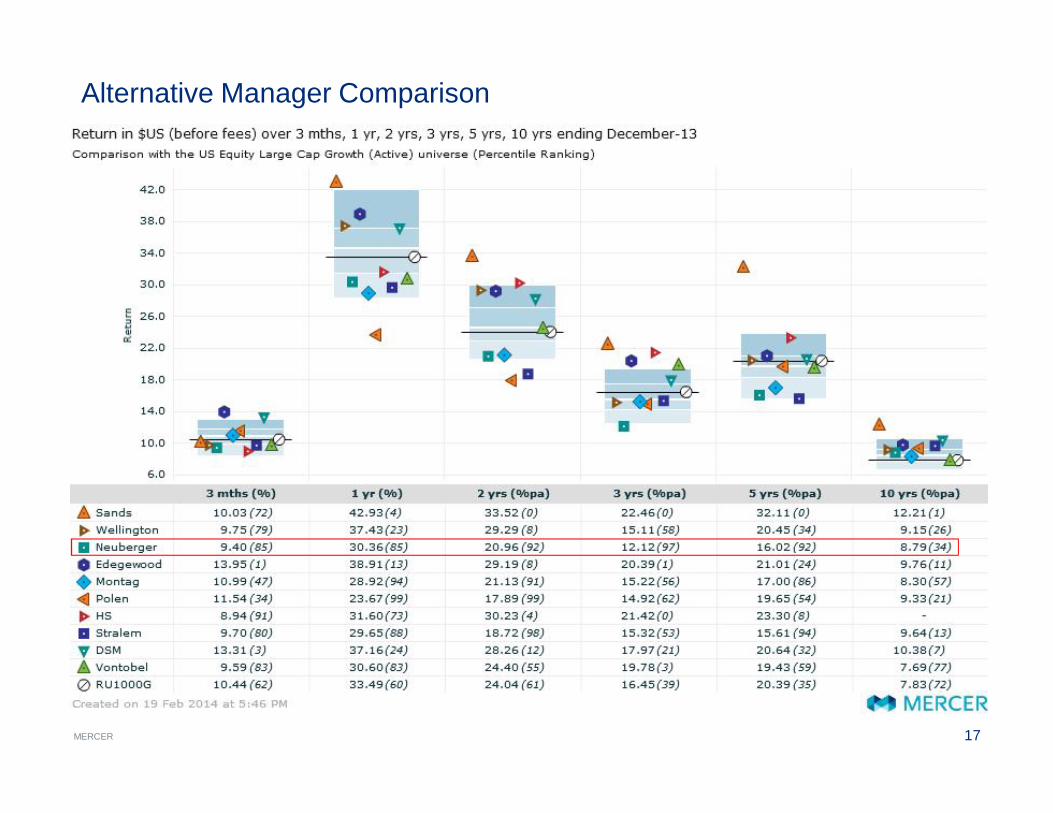
Alternative Manager Comparison
Rating StrategyAssets (M) Inception Beta
(10 Year Hist)Neuberger Berman B+ 6,812 1987 0.91Edgewood A(T) 8,969 1974 1.01Montag & Caldwell B+ 13,138 1945 0.86Polen B+(T) 4,987 1989 0.84HS B+(T) 2,392 2007 0.88*Stralem B+(T) 3,409 1966 0.76DSM A(T) 4,661 2002 1.03Vontobel B+(T) 1,687 1990 0.69
*5 year beta
MERCER 17
Alternative Manager Comparison

MERCER 18
Alternative Manager Comparison

MERCER 19
Alternative Manager Comparison

MERCER 20
Alternative Manager Comparison

MERCER 21
Alternative Manager Comparison

MERCER
Correlation of Excess Returns vs. Russell 1000 Growth in $US (before fees) over 10 yrs ending December-13(quarterly calculations)
Notes:Correlation is shown in the right hand side of the table.Risk Reduction is shown in the left hand side of the table.Risk Reduction is defined as the reduction in tracking error from diversification when using a 50:50 mix of the two managers.
22
Alternative Manager ComparisonFit with Existing Managers
SANLCG1 WECLCG1 NBRLCG2 EMCLCG MONLCG PLNLCG SRLLCG DSMLCG VONLCV1
Sands CapitalLarge Cap Growth SANLCG1 0.43 -0.25 0.15 -0.40 -0.13 -0.57 0.17 -0.49WellingtonOpportunisticGrowth
WECLCG1 -1.02 0.04 -0.01 -0.29 -0.36 -0.35 0.26 -0.56
Neuberger Berman- Large CapDisciplinedGrowth
NBRLCG2 -2.08 -1.29 0.19 0.42 0.29 0.47 0.30 0.04
Edgewood -Institutional LargeCap Growth
EMCLCG -1.64 -1.62 -1.08 0.06 0.12 -0.21 0.39 -0.25
Montag - LargeCap Growth MONLCG -2.55 -1.95 -0.67 -1.34 0.34 0.54 0.19 0.20
Polen - Large CapGrowth Equity PLNLCG -2.35 -2.41 -0.94 -1.45 -0.91 0.27 0.00 0.44
Stralem - US LargeCap EquityStrategy
SRLLCG -3.91 -2.50 -0.71 -2.23 -0.64 -1.23 0.04 0.60
DSM - Large CapGrowth Equity DSMLCG -1.45 -1.04 -0.86 -0.86 -1.05 -1.54 -1.53 -0.27
Vontobel (US) - USEquity VONLCV1 -4.17 -3.32 -1.48 -2.54 -1.27 -1.03 -0.76 -2.35

23February 19, 2014
Appendix

MERCER 24
DisclaimerImportant NoticesReferences to Mercer shall be construed to include Mercer LLC and/or its associated companies.
© 2014 Mercer LLC. All rights reserved.
This contains confidential and proprietary information of Mercer and is intended for the exclusive use of the parties to whom it was provided by Mercer. Its content may not be modified, soldor otherwise provided, in whole or in part, to any other person or entity, without Mercer’s prior written permission.
The findings, ratings and/or opinions expressed herein are the intellectual property of Mercer and are subject to change without notice. They are not intended to convey any guarantees as tothe future performance of the investment products, asset classes or capital markets discussed. Past performance does not guarantee future results. Mercer’s ratings do not constituteindividualized investment advice.
Information contained herein has been obtained from a range of third party sources. While the information is believed to be reliable, Mercer has not sought to verify it independently. As such,Mercer makes no representations or warranties as to the accuracy of the information presented and takes no responsibility or liability (including for indirect, consequential or incidentaldamages), for any error, omission or inaccuracy in the data supplied by any third party.
This does not constitute an offer or a solicitation of an offer to buy or sell securities, commodities and/or any other financial instruments or products or constitute a solicitation on behalf of anyof the investment managers, their affiliates, products or strategies that Mercer may evaluate or recommend.
For the most recent approved ratings of an investment strategy, and a fuller explanation of their meanings, contact your Mercer representative.
For Mercer’s conflict of interest disclosures, contact your Mercer representative or see www.mercer.com/conflictsofinterest.
Mercer universes: Mercer’s universes are intended to provide collective samples of strategies that best allow for robust peer group comparisons over a chosen timeframe. Mercer does notassert that the peer groups are wholly representative of and applicable to all strategies available to investors.
The value of your investments can go down as well as up, and you may not get back the amount you have invested. Investments denominated in a foreign currency will fluctuate with thevalue of the currency. Certain investments, such as securities issued by small capitalization, foreign and emerging market issuers, real property, and illiquid, leveraged or high-yield funds,carry additional risks that should be considered before choosing an investment manager or making an investment decision.
Returns for periods greater than one year are annualized. Returns are calculated net of investment management fees, unless noted as gross of fees.
Style analysis graph time periods may differ reflecting the length of performance history available.
THE FOLLOWING PROVISIONS APPLY TO DATA OR OTHER SERVICES PROVIDED BY THE FOLLOWING COMPANIES: Where “End User” appears before the Vendor name, a directend-user license with the Vendor is required to receive some indices. You are responsible for ensuring you have in place all such licenses as are required by Vendors.
BARCLAYS: © Barclays Bank PLC 2014. This data is provided by Barclays Bank PLC. Barclays Bank PLC and its affiliated companies accept no liability for the accuracy, timeliness orcompleteness of such data which is provided “as is.” All warranties in relation to such data are hereby extended to the fullest extent permitted under applicable law.
BARCLAYS CAPITAL: The Barclays Indices are a proprietary product of Barclays. Barclays shall maintain exclusive ownership of and rights to the Barclays Indices and that inclusion of theBarclays Indices in this Service shall not be construed to vest in the subscriber any rights with respect to the Indices. The subscriber agrees that it will not remove any copyright notice orother notification or trade name or marks of Barclays that may appear in the Barclays Indices and that any reproduction and/or distribution of the Barclays Indices (if authorized) shall containsuch notices and/or marks.
BLOOMBERG L.P.: © 2014 Bloomberg L.P. All rights reserved. BLOOMBERG, BLOOMBERG PROFESSIONAL, BLOOMBERG FINANCIAL MARKETS, BLOOMBERG NEWS,BLOOMBERG TRADEMARK, BLOOMBERG BONDTRADER, AND BLOOMBERG TELEVISION are trademarks and service marks of Bloomberg L.P. a Delaware Limited Partnership.

MERCER 25
DisclaimerImportant NoticesBNY Mellon Asset Servicing: Source: © 2014 BNY Mellon Performance Risk and Analytics, LLC. All Rights Reserved.
CITIGROUP GLOBAL MARKETS (formerly SALOMON SMITH BARNEY): Smith Barneysm and Citigroup Global Equity Indexsm are service marks of Citigroup Inc. "BECAUSE ACCURACYCOUNTS®" is a registered service mark of Citigroup Inc. FloatWatch© is a trade mark of Citigroup Inc. Citigroup Global Equity Index Systemsm, Citigroup Broad Market Indexsm, CitigroupPrimary Market Indexsm, Citigroup Extended Market Indexsm, Citigroup Cap-Range Indexsm, Citigroup Internet Index (NIX)sm, Citigroup Style Indices (Growth/Value)sm, Citigroup PropertyIndexsm are service marks of Citigroup Inc. ©2014 Citigroup Inc All rights reserved. Any unauthorized use, duplication or disclosure is prohibited by law and may result in prosecution.Citigroup, including its parent, subsidiaries and/or affiliates ("the Firm"), usually makes a market in the securities discussed or recommended in its report and may sell to or buy fromcustomers, as principal, securities discussed or recommended in its report. The Firm or employees preparing its report may have a position in securities or options of any company discussedor recommended in its report. An employee of the Firm may be a director of a company discussed or recommended in its report. The Firm may perform or solicit investment banking or otherservices from any company discussed or recommended in its report. Securities recommended, offered, or sold by SSB: (i) are not insured by the Federal Deposit Insurance Corporation; (ii)are not deposits or other obligations of any insured depository institution (including Citibank); and (iii) are subject to investment risks, including the possible loss of the principal amountinvested. Although information has been obtained from and is based upon sources SSB believes to be reliable, we do not guarantee its accuracy and it may be incomplete or condensed. Allopinions and estimates constitute SSB’s judgment as of the date of the report and are subject to change without notice. Its report is for informational purposes only and is not intended as anoffer or solicitation for the purchase or sale of a security. Its report does not take into account the investment objectives or financial situation of any particular person. Investors should obtainadvice based on their own individual circumstances before making an investment decision.
CREDIT SUISSE FIRST BOSTON LLC. (CSFB): Copyright © 1996 – 2014 Credit Suisse First Boston LLC and/or its affiliate companies. All rights reserved.
DataStream: Source: ThomsonReuters Datastream
Dow Jones: The Dow Jones IndexesSM are proprietary to and distributed by Dow Jones & Company, Inc. and have been licensed for use. All content of Dow Jones IndexesSM © 2014 isproprietary to Dow Jones & Company, Inc.
“End User” FTSE™: is a trade mark of the London Stock Exchange PLC and The Financial Times Limited and is used by FTSE International Limited under license. Russell InvestmentGroup Europe Ltd is licensed by FTSE International Limited to distribute FTSE Advanced Service and other FTSE indices. FTSE shall not be responsible for any error or omission in FTSEdata. All copyright and database rights in FTSE products belong to FTSE or its licensors. Redistribution of the data comprising the FTSE products is not permitted. You agree to comply withany restrictions or conditions imposed upon the use, access, or storage of the data as may be notified to you by FTSE or Russell/Mellon Europe Ltd. You are not permitted to receive theFTSE Advanced Service unless you have a separate agreement with FTSE. “FTSE™”, “FT-SE™” and “Footsie™” are trade marks of London Stock Exchange PLC and The Financial TimesLimited and are used by FTSE International Limited under license.
The FTSE Private Investor Indices are owned and calculated by FTSE International and are produced in association with APCIMS (Association of Private Client Investment Managers andStockbrokers). ã FTSE International Limited 2014The UK Value and Growth Indices are owned and calculated by FTSE International Limited in association with Russell Investment Group. ã FTSE International Limited 2014.
RUSSELL INVESTMENT GROUP: Russell Investment Group is the source and owner of certain of the data contained or reflected in this material and all trademarks and copyrights relatedthereto. The material may contain confidential information and unauthorized use, disclosure, copying, dissemination or redistribution is strictly prohibited. This is a user presentation of thedata. Russell Investment Group is not responsible for the formatting or configuration of this material or for any inaccuracy in presentation thereof. Returns and security data for the Russellindices are provided by Mellon Analytical Solutions. Russell indices are trademarks/service marks of the Russell Investment Group. Russell® is a trademark of the Russell Investment Group.
HFRI: Source: Hedge Fund Research, Inc., © HFR, Inc. 2014, www.hedgefundresearch.com
JPMORGAN: The JPMorgan EMBI Index (i) is protected by copyright and JPMorgan claims trade secret rights, (ii) is and shall remain the sole property of JPMorgan, and (iii) title and fullownership in the JPMorgan EMBI Index is reserved to and shall remain with JPMorgan. All proprietary and intellectual property rights of any nature, including patents, copyrights, trademarksand trade secrets regarding the JPMorgan EMBI Index, and any and all parts, copies, modifications, enhancements and derivative works are owned by, and shall remain the property ofJPMorgan and its affiliates. The JPMorgan EMBI Index and related materials and software were developed, compiled, prepared and arranged by JPMorgan through expenditure ofsubstantial time, effort and money and constitute valuable intellectual property and trade secrets of JPMorgan. The JPMorgan EMBI Index shall not be used in a manner that would infringethe property rights of JPMorgan or others or violate the laws, tariffs, or regulations of any country.

MERCER 26
DisclaimerImportant NoticesLIPPER: Performance data was supplied by Lipper, A Thomson Reuters Company, subject to the following: Copyright 2014 © Thomson Reuters. All rights reserved. Any copying,republication or redistribution of Lipper Information, including by caching, framing or similar means, is expressly prohibited without the prior written consent of Lipper. Lipper shall not be liablefor any errors or delays in the Information, or for any actions taken in reliance thereon. Lipper performance data is total return, and is preliminary and subject to revision. The data containedherein has been obtained from company reports, financial reporting services, periodicals, and other resources believed to be reasonable. Although carefully verified, data on compilations isnot guaranteed by Lipper Inc. - A Reuters Company and may be incomplete. No offer or solicitations to buy or sell any of the securities herein is being made by Lipper. Portions of theinformation contained in this report was derived by Mercer using Content supplied by Lipper, A Thomson Reuters Company.
MERRILL LYNCH: The Merrill Lynch Indices are used with permission. Copyright 2014, Merrill Lynch, Pierce, Fenner & Smith Incorporated. All rights reserved. The Merrill Lynch Indicesmay not be copied, used, or distributed without Merrill Lynch’s prior written approval.
This Product is not sponsored, endorsed, sold or promoted by Merrill Lynch. Merrill Lynch makes no guarantees, representations or warranties of any kind, express or implied, to any person,including, without limitation, any member of the public regarding the use of the Indices in the Product, the advisability of investing in securities generally or of the ability of the Index to trackany market performance. Merrill Lynch’s only relationship to Mellon Analytical Solutions or any other person or entity in respect to this Product is limited to the licensing of the Merrill LynchIndices, which are determined, composed, and calculated by Merrill Lynch without regard to Mellon Analytical Solutions or this Product. Merrill Lynch retains exclusive ownership of theIndices and the programs and trademarks used in connection with the Indices. Merrill Lynch has no obligation to take the needs of Mellon Analytical Solutions or the purchasers, investors orparticipants in the Product into consideration in determining, composing or calculating the Indices, nor shall Merrill Lynch have any obligation to continue to calculate or provide the Indices inthe future. Merrill Lynch may, in its absolute discretion and without prior notice, revise or terminate the Indices at any time. IN NO EVENT SHALL MERRILL LYNCH OR ANY OF ITSPARTNERS, AFFILIATES, EMPLOYEES, OFFICERS, DIRECTORS OR AGENTS HAVE ANY LIABILITY TO ANY PERSON OR ENTITY FOR ANY INDIRECT, PUNITIVE, SPECIAL, ORCONSEQUENTIAL DAMAGES, INCLUDING LOST PROFITS.
MOODY’S INVESTORS SERVICE: Moody’s © Copyright 2014, Moody’s Investors Service, Inc. (“Moody’s). Moody’s ratings (“Ratings”) are proprietary to Moody’s or its affiliates and areprotected by copyright and other intellectual property laws. Ratings are licensed to Distributor by Moody’s. RATINGS MAY NOT BE COPIED OR OTHERWISE REPRODUCED,REPACKAGED, FURTHER TRANSMITTED, TRANSFERRED, DISSEMINATED, REDISTRIBUTED OR RESOLD, OR STORED FOR SUBSEQUENT USE FOR ANY SUCH PURPOSE, INWHOLE OR IN PART, IN ANY FORM OR MANNER OR BY ANY MEANS WHATSOEVER, BY ANY PERSON WITHOUT MOODY’S PRIOR WRITTEN CONSENT. Moody’s® is a registeredtrademark of Moody’s Investors Service, Inc.
MSCI®: Portions of this report are copyright MSCI 2014. Unpublished. All Rights Reserved. This information may only be used for your internal use, may not be reproduced orredisseminated in any form and may not be used to create any financial instruments or products or any indices. This information is provided on an “as is” basis and the user of this informationassumes the entire risk of any use it may make or permit to be made of this information. Neither MSCI, any of its affiliates or any other person involved in or related to compiling, computing orcreating this information makes any express or implied warranties or representations with respect to such information or the results to be obtained by the use thereof, and MSCI, its affiliatesand each such other person hereby expressly disclaim all warranties (including, without limitation, all warranties of originality, accuracy, completeness, timeliness, non-infringement,merchantability and fitness for a particular purpose) with respect to this information. Without limiting any of the foregoing, in no event shall MSCI, any of its affiliates or any other personinvolved in or related to compiling, computing or creating this information have any liability for any direct, indirect, special, incidental, punitive, consequential or any other damages (including,without limitation, lost profits) even if notified of, or if it might otherwise have anticipated, the possibility of such damages. MSCI is a registered trademark of MSCI, Inc.
NAREIT: NAREIT® is the exclusive registered mark of the National Association of Real Estate Investment Trusts.
NCREIF: All NCREIF Data - Copyright by the National Council of Real Estate Investment Fiduciaries. This information is proprietary and may not be reported in whole or in part without writtenpermission.
STANDARD & POOR’S: Standard & Poor’s information contained in this document is subject to change without notice. Standard & Poor’s cannot guarantee the accuracy, adequacy orcompleteness of the information and is not responsible for any errors or omissions or for results obtained from use of such information. Standard & Poor’s makes no warranties ormerchantability or fitness for a particular purpose. In no event shall Standard & Poor’s be liable for direct, indirect or incidental, special or consequential damages from the information hereregardless or whether such damages were foreseen or unforeseen.
WILSHIRE ASSOCIATES: Copyright © 2014 Wilshire Associates Incorporated.
Services provided by Mercer Investment Consulting, Inc.