north carolina department of revenue solid waste …
TRANSCRIPT

NORTH CAROLINA DEPARTMENT OF REVENUE
SOLID WASTE DISPOSAL TAX DISTRIBUTION REPORT
August 16, 2021
QUARTER: 4/1/2021 - 6/30/2021
SUMMARY OF PROCEEDS
PROCEEDS AVAILABLE FOR DISTRIBUTION BEFORE COST 5,717,718.56$
LESS: REIMBURSEMENT UNDER SESSION LAW 2007-543 -$
LESS: COST OF COLLECTING 12,253.69$
PROCEEDS AVAILABLE FOR DISTRIBUTION 5,705,464.87$
DISTRIBUTION OF PROCEEDS
*******************************
INACTIVE HAZARDOUS SITES CLEANUP FUND ( 50%) 2,852,732.43$
AMOUNT AVAILABLE TO DISTRIBUTE TO CITIES ( 18.75%) 1,069,774.67$
AMOUNT AVAILABLE TO DISTRIBUTE TO COUNTIES ( 18.75%) 1,069,774.67$
GENERAL FUND ( 12.5%) 713,183.10$
TOTALS 5,705,464.87$
COMMENTS:
1. Solid waste disposal taxes are levied pursuant to Article 5G of Chapter 105 which provide for a per capita distribution of the proceeds.
2. A city or county is excluded from the distribution under Article 5G if it does not provide solid waste management programs and is not
responsible by contract for payment for these programs and services, unless it is served by a regional solid waste management
authority established under Article 22 of Chapter 153A of the General Statutes.
Cities & Counties Populations
City Percentage
of Population
County
Percentage of
Population City Distribution
County
Distribution
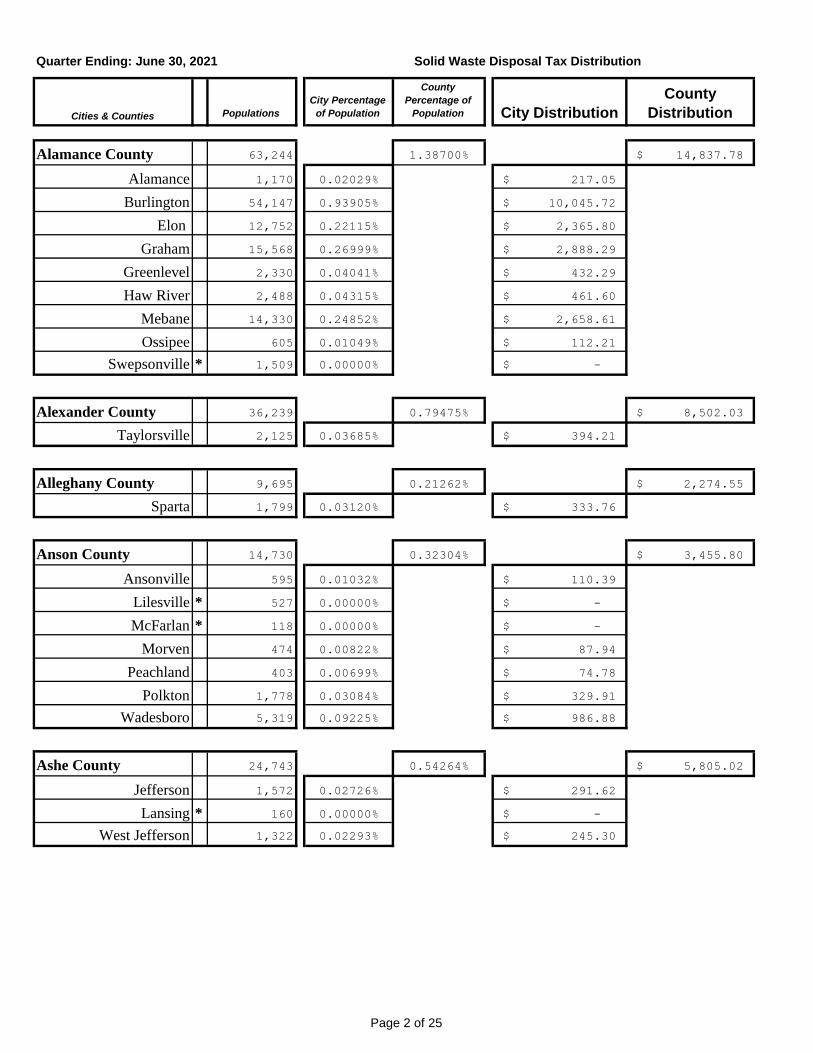
Alamance County 63,244 1.38700% 14,837.78$
Alamance 1,170 0.02029% 217.05$
Burlington 54,147 0.93905% 10,045.72$
Elon 12,752 0.22115% 2,365.80$
Graham 15,568 0.26999% 2,888.29$
Greenlevel 2,330 0.04041% 432.29$
Haw River 2,488 0.04315% 461.60$
Mebane 14,330 0.24852% 2,658.61$
Ossipee 605 0.01049% 112.21$
Swepsonville * 1,509 0.00000% -$
Alexander County 36,239 0.79475% 8,502.03$
Taylorsville 2,125 0.03685% 394.21$
Alleghany County 9,695 0.21262% 2,274.55$
Sparta 1,799 0.03120% 333.76$
Anson County 14,730 0.32304% 3,455.80$
Ansonville 595 0.01032% 110.39$
Lilesville * 527 0.00000% -$
McFarlan * 118 0.00000% -$
Morven 474 0.00822% 87.94$
Peachland 403 0.00699% 74.78$
Polkton 1,778 0.03084% 329.91$
Wadesboro 5,319 0.09225% 986.88$
Ashe County 24,743 0.54264% 5,805.02$
Jefferson 1,572 0.02726% 291.62$
Lansing * 160 0.00000% -$
West Jefferson 1,322 0.02293% 245.30$
Quarter Ending: June 30, 2021 Solid Waste Disposal Tax Distribution
Page 2 of 25

Cities & Counties Populations
City Percentage
of Population
County
Percentage of
Population City Distribution
County
Distribution
Quarter Ending: June 30, 2021 Solid Waste Disposal Tax Distribution
Avery County 15,362 0.33690% 3,604.07$
Banner Elk 1,119 0.01941% 207.65$
Crossnore 193 0.00335% 35.84$
Elk Park 458 0.00794% 84.95$
Grandfather Village * 25 0.00000% -$
Newland * 714 0.00000% -$
Sugar Mountain 199 0.00345% 36.90$
Beaufort County 34,381 0.75401% 8,066.21$
Aurora 490 0.00850% 90.92$
Bath 235 0.00408% 43.65$
Belhaven 1,588 0.02754% 294.62$
Chocowinity 821 0.01424% 152.34$
Pantego 175 0.00303% 32.42$
Washington 9,318 0.16160% 1,728.76$
Washington Park 428 0.00742% 79.38$
Bertie County 13,598 0.29822% 3,190.28$
Askewville 235 0.00408% 43.65$
Aulander 809 0.01403% 150.09$
Colerain 185 0.00321% 34.34$
Kelford 231 0.00401% 42.89$
Lewiston Woodville 509 0.00883% 94.46$
Powellsville 249 0.00432% 46.21$
Roxobel 214 0.00371% 39.68$
Windsor 3,600 0.06243% 667.86$
Bladen County 26,715 0.58588% 6,267.59$
Bladenboro 1,711 0.02967% 317.40$
Clarkton 820 0.01422% 152.13$
Dublin 351 0.00609% 65.15$
East Arcadia * 470 0.00000% -$
Elizabethtown 3,404 0.05903% 631.49$
Tar Heel * 125 0.00000% -$
White Lake 879 0.01524% 163.03$
Page 3 of 25

Cities & Counties Populations
City Percentage
of Population
County
Percentage of
Population City Distribution
County
Distribution
Quarter Ending: June 30, 2021 Solid Waste Disposal Tax Distribution
Brunswick County 71,882 1.57644% 16,864.35$
Bald Head Island 187 0.00324% 34.66$
Belville * 2,340 0.00000% -$
Boiling Spring Lakes * 7,200 0.00000% -$
Bolivia * 173 0.00000% -$
Calabash 2,085 0.03616% 386.83$
Carolina Shores 3,992 0.06923% 740.60$
Caswell Beach 475 0.00824% 88.15$
Holden Beach 675 0.01171% 125.27$
Leland 22,610 0.39212% 4,194.80$
Navassa * 2,131 0.00000% -$
Northwest * 879 0.00000% -$
Oak Island 8,089 0.14028% 1,500.69$
Ocean Isle Beach 687 0.01191% 127.42$
Sandy Creek 315 0.00546% 58.42$
Shallotte 4,979 0.08635% 923.75$
Southport 3,635 0.06304% 674.38$
St. James 5,677 0.09845% 1,053.19$
Sunset Beach 4,481 0.07771% 831.32$
Varnamtown * 677 0.00000% -$
Buncombe County 147,721 3.23965% 34,656.95$
Asheville 93,413 1.62002% 17,330.57$
Biltmore Forest 1,357 0.02353% 251.72$
Black Mountain 8,515 0.14767% 1,579.73$
Montreat 967 0.01677% 179.40$
Weaverville 4,013 0.06960% 744.57$
Woodfin 6,673 0.11573% 1,238.05$
Page 4 of 25

Cities & Counties Populations
City Percentage
of Population
County
Percentage of
Population City Distribution
County
Distribution
Quarter Ending: June 30, 2021 Solid Waste Disposal Tax Distribution
Burke County 60,074 1.31748% 14,094.07$
Connelly Springs 1,681 0.02915% 311.84$
Drexel 1,834 0.03181% 340.29$
Glen Alpine 1,575 0.02731% 292.15$
Hildebran 2,001 0.03470% 371.21$
Morganton 16,996 0.29475% 3,153.16$
Rutherford College 1,402 0.02431% 260.06$
Valdese 4,526 0.07849% 839.67$
Cabarrus County 54,110 1.18668% 12,694.80$
Concord 95,453 1.65540% 17,709.05$
Harrisburg 18,073 0.31343% 3,353.00$
Kannapolis 49,324 0.85541% 9,150.96$
Midland 4,102 0.07114% 761.04$
Mount Pleasant 1,961 0.03401% 363.83$
Caldwell County 44,498 0.97588% 10,439.72$
Cajah Mountain 2,742 0.04755% 508.68$
Cedar Rock 292 0.00506% 54.13$
Gamewell 4,072 0.07062% 755.47$
Granite Falls 4,734 0.08210% 878.28$
Hudson 4,011 0.06956% 744.14$
Lenoir 17,743 0.30771% 3,291.80$
Rhodhiss 1,108 0.01922% 205.61$
Sawmills 5,237 0.09082% 971.56$
Camden County 10,515 0.23060% 2,466.90$
Page 5 of 25

Cities & Counties Populations
City Percentage
of Population
County
Percentage of
Population City Distribution
County
Distribution
Quarter Ending: June 30, 2021 Solid Waste Disposal Tax Distribution
Carteret County 40,378 0.88552% 9,473.06$
Atlantic Beach 1,492 0.02588% 276.86$
Beaufort 4,281 0.07424% 794.19$
Bogue * 744 0.00000% -$
Cape Carteret 2,231 0.03869% 413.89$
Cedar Point 1,509 0.02617% 279.97$
Emerald Isle 3,822 0.06628% 709.04$
Indian Beach * 129 0.00000% -$
Morehead City 9,517 0.16505% 1,765.66$
Newport 4,795 0.08316% 889.63$
Peletier * 747 0.00000% -$
Pine Knoll Shores 1,341 0.02326% 248.83$
Caswell County 21,269 0.46645% 4,989.97$
Milton * 172 0.00000% -$
Yanceyville 2,002 0.03472% 371.42$
Catawba County 86,690 1.90119% 20,338.45$
Brookford 376 0.00652% 69.75$
Catawba 610 0.01058% 113.18$
Claremont 1,495 0.02593% 277.40$
Conover 8,541 0.14812% 1,584.55$
Hickory 41,409 0.71814% 7,682.49$
Long View 4,865 0.08437% 902.57$
Maiden 3,420 0.05931% 634.49$
Newton 13,059 0.22648% 2,422.83$
Chatham County 59,055 1.29513% 13,854.97$
Goldston 274 0.00475% 50.82$
Pittsboro 4,667 0.08094% 865.88$
Siler City 8,601 0.14916% 1,595.68$
Cherokee County 25,906 0.56814% 6,077.82$
Andrews 1,833 0.03179% 340.08$
Murphy 1,653 0.02867% 306.70$
Page 6 of 25

Cities & Counties Populations
City Percentage
of Population
County
Percentage of
Population City Distribution
County
Distribution
Quarter Ending: June 30, 2021 Solid Waste Disposal Tax Distribution
Chowan County 9,529 0.20898% 2,235.61$
Edenton 4,612 0.07998% 855.61$
Clay County 11,239 0.24648% 2,636.78$
Hayesville 411 0.00713% 76.27$
Cleveland County 58,819 1.28995% 13,799.55$
Belwood * 972 0.00000% -$
Boiling Springs 4,769 0.08271% 884.81$
Casar * 299 0.00000% -$
Earl 275 0.00477% 51.03$
Fallston * 626 0.00000% -$
Grover 729 0.01264% 135.21$
Kings Mountain 10,965 0.19016% 2,034.29$
Kingstown 680 0.01179% 126.13$
Lattimore * 478 0.00000% -$
Lawndale * 614 0.00000% -$
Mooresboro * 324 0.00000% -$
Patterson Springs 636 0.01103% 118.00$
Polkville * 565 0.00000% -$
Shelby 20,087 0.34836% 3,726.67$
Waco 327 0.00567% 60.66$
Columbus County 40,221 0.88208% 9,436.27$
Boardman * 151 0.00000% -$
Bolton 570 0.00989% 105.80$
Brunswick 1,098 0.01904% 203.69$
Cerro Gordo 193 0.00335% 35.84$
Chadbourn 1,751 0.03037% 324.89$
Fair Bluff 907 0.01573% 168.28$
Lake Waccamaw 1,451 0.02516% 269.15$
Sandyfield * 474 0.00000% -$
Tabor City 4,268 0.07402% 791.85$
Whiteville 5,163 0.08954% 957.88$
Page 7 of 25

Cities & Counties Populations
City Percentage
of Population
County
Percentage of
Population City Distribution
County
Distribution
Quarter Ending: June 30, 2021 Solid Waste Disposal Tax Distribution
Craven County 44,626 0.97869% 10,469.78$
Bridgeton 461 0.00799% 85.48$
Cove City * 378 0.00000% -$
Dover * 374 0.00000% -$
Havelock 19,323 0.33511% 3,584.92$
New Bern 30,014 0.52052% 5,568.39$
River Bend 2,965 0.05142% 550.07$
Trent Woods * 3,869 0.00000% -$
Vanceboro 979 0.01698% 181.65$
Cumberland County 88,663 1.94446% 20,801.34$
Eastover * 3,739 0.00000% -$
Falcon 376 0.00652% 69.75$
Fayetteville 208,878 3.62249% 38,752.48$
Godwin * 137 0.00000% -$
Hope Mills 17,416 0.30204% 3,231.14$
Linden 126 0.00219% 23.42$
Spring Lake 11,376 0.19729% 2,110.56$
Stedman 1,118 0.01939% 207.43$
Wade * 563 0.00000% -$
Currituck County 27,677 0.60698% 6,493.32$
Dare County 18,451 0.40465% 4,328.85$
Duck 405 0.00702% 75.10$
Kill Devil Hills 7,378 0.12795% 1,368.77$
Kitty Hawk 3,619 0.06276% 671.39$
Manteo 1,618 0.02806% 300.18$
Nags Head 3,069 0.05322% 569.34$
Southern Shores 3,059 0.05305% 567.52$
Page 8 of 25

Cities & Counties Populations
City Percentage
of Population
County
Percentage of
Population City Distribution
County
Distribution
Quarter Ending: June 30, 2021 Solid Waste Disposal Tax Distribution
Davidson County 107,956 2.36757% 25,327.66$
Denton 1,591 0.02759% 295.15$
Lexington 18,172 0.31515% 3,371.39$
Midway 4,926 0.08543% 913.91$
Thomasville 27,187 0.47149% 5,043.88$
Wallburg 3,170 0.05498% 588.17$
Davie County 33,959 0.74475% 7,967.15$
Bermuda Run 2,811 0.04875% 521.52$
Cooleemee 971 0.01684% 180.16$
Mocksville 5,486 0.09514% 1,017.78$
Duplin County 45,685 1.00191% 10,718.18$
Beulaville 1,341 0.02326% 248.83$
Calypso 554 0.00961% 102.81$
Faison 981 0.01701% 181.97$
Greenevers * 646 0.00000% -$
Kenansville 822 0.01426% 152.55$
Magnolia * 991 0.00000% -$
Rose Hill 1,660 0.02879% 307.99$
Teachey 373 0.00647% 69.21$
Wallace 3,963 0.06873% 735.26$
Warsaw 2,956 0.05126% 548.37$
Durham County 43,306 0.94974% 10,160.08$
Durham 269,339 4.67104% 49,969.60$
Page 9 of 25

Cities & Counties Populations
City Percentage
of Population
County
Percentage of
Population City Distribution
County
Distribution
Quarter Ending: June 30, 2021 Solid Waste Disposal Tax Distribution
Edgecombe County 21,555 0.47272% 5,057.03$
Conetoe 267 0.00463% 49.53$
Leggett * 56 0.00000% -$
Macclesfield 435 0.00754% 80.66$
Pinetops 1,245 0.02159% 230.97$
Princeville 2,230 0.03867% 413.68$
Speed 79 0.00137% 14.65$
Tarboro 10,446 0.18116% 1,938.00$
Whitakers * 691 0.00000% -$
Forysth County 62,026 1.36028% 14,551.93$
Bethania 323 0.00560% 59.92$
Clemmons 20,230 0.35084% 3,753.20$
Kernersville 26,312 0.45632% 4,881.60$
Lewisville 13,392 0.23225% 2,484.54$
Rural Hall 3,182 0.05518% 590.31$
Tobaccoville 2,560 0.04440% 474.99$
Walkertown 5,516 0.09566% 1,023.35$
Winston-Salem 244,739 4.24441% 45,405.62$
Franklin County 61,147 1.34101% 14,345.78$
Bunn 357 0.00619% 66.21$
Centerville 0 0.00000% -$
Franklinton 2,175 0.03772% 403.51$
Louisburg 3,530 0.06122% 654.91$
Youngsville 1,776 0.03080% 329.50$
Page 10 of 25
Cities & Counties Populations
City Percentage
of Population
County
Percentage of
Population City Distribution
County
Distribution
Quarter Ending: June 30, 2021 Solid Waste Disposal Tax Distribution
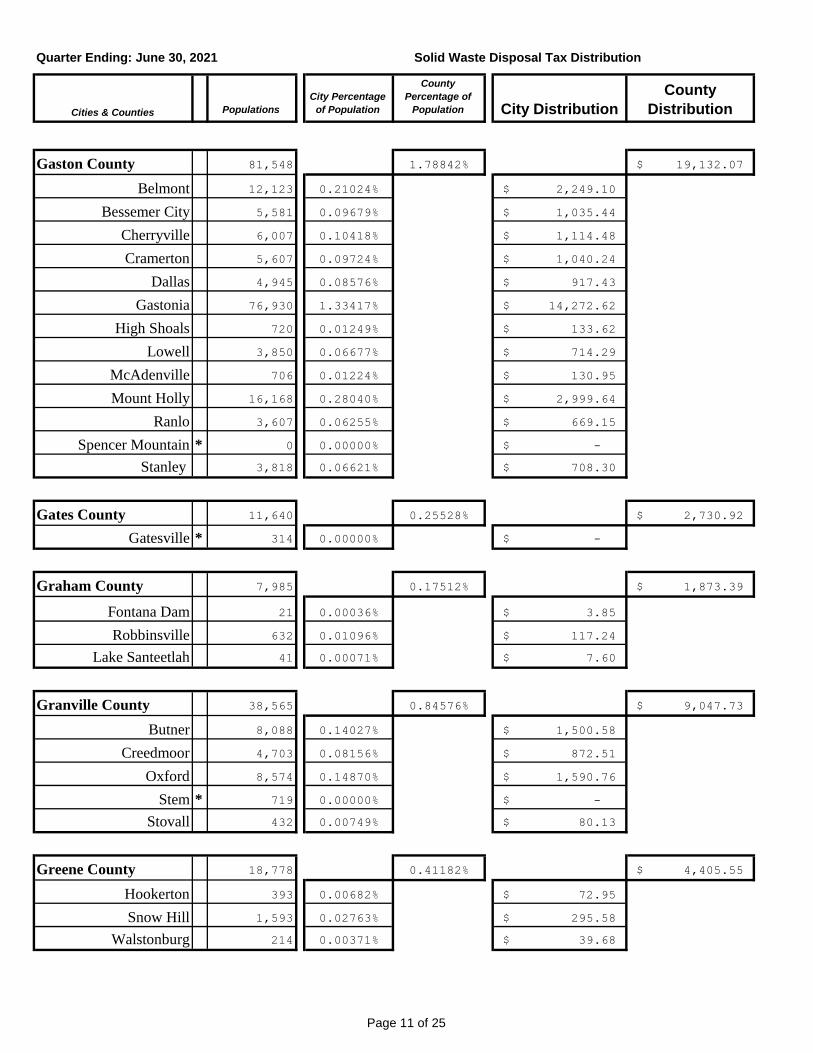
Gaston County 81,548 1.78842% 19,132.07$
Belmont 12,123 0.21024% 2,249.10$
Bessemer City 5,581 0.09679% 1,035.44$
Cherryville 6,007 0.10418% 1,114.48$
Cramerton 5,607 0.09724% 1,040.24$
Dallas 4,945 0.08576% 917.43$
Gastonia 76,930 1.33417% 14,272.62$
High Shoals 720 0.01249% 133.62$
Lowell 3,850 0.06677% 714.29$
McAdenville 706 0.01224% 130.95$
Mount Holly 16,168 0.28040% 2,999.64$
Ranlo 3,607 0.06255% 669.15$
Spencer Mountain * 0 0.00000% -$
Stanley 3,818 0.06621% 708.30$
Gates County 11,640 0.25528% 2,730.92$
Gatesville * 314 0.00000% -$
Graham County 7,985 0.17512% 1,873.39$
Fontana Dam 21 0.00036% 3.85$
Robbinsville 632 0.01096% 117.24$
Lake Santeetlah 41 0.00071% 7.60$
Granville County 38,565 0.84576% 9,047.73$
Butner 8,088 0.14027% 1,500.58$
Creedmoor 4,703 0.08156% 872.51$
Oxford 8,574 0.14870% 1,590.76$
Stem * 719 0.00000% -$
Stovall 432 0.00749% 80.13$
Greene County 18,778 0.41182% 4,405.55$
Hookerton 393 0.00682% 72.95$
Snow Hill 1,593 0.02763% 295.58$
Walstonburg 214 0.00371% 39.68$
Page 11 of 25

Cities & Counties Populations
City Percentage
of Population
County
Percentage of
Population City Distribution
County
Distribution
Quarter Ending: June 30, 2021 Solid Waste Disposal Tax Distribution
Guilford County 94,260 2.06720% 22,114.38$
Gibsonville 7,384 0.12806% 1,369.95$
Greensboro 293,730 5.09404% 54,494.74$
High Point 113,457 1.96764% 21,049.31$
Jamestown 4,362 0.07565% 809.28$
Oak Ridge 7,651 0.13269% 1,419.48$
Pleasant Garden * 4,658 0.00000% -$
Sedalia 644 0.01117% 119.49$
Stokesdale * 5,965 0.00000% -$
Summerfield 11,949 0.20723% 2,216.89$
Whitsett 605 0.01049% 112.21$
Halifax County 29,456 0.64600% 6,910.74$
Enfield * 2,574 0.00000% -$
Halifax 223 0.00387% 41.39$
Hobgood 324 0.00562% 60.13$
Littleton * 630 0.00000% -$
Roanoke Rapids 14,597 0.25315% 2,708.14$
Scotland Neck 1,931 0.03349% 358.26$
Weldon 1,500 0.02601% 278.26$
Harnett County 109,391 2.39904% 25,664.32$
Angier 5,462 0.09473% 1,013.41$
Coats 2,370 0.04110% 439.68$
Dunn 9,560 0.16580% 1,773.68$
Erwin 4,635 0.08038% 859.89$
Lillington 3,681 0.06384% 682.94$
Haywood County 45,844 1.00540% 10,755.52$
Canton 4,407 0.07643% 817.63$
Clyde 1,274 0.02209% 236.31$
Maggie Valley 1,436 0.02490% 266.37$
Waynesville 10,131 0.17570% 1,879.60$
Page 12 of 25

Cities & Counties Populations
City Percentage
of Population
County
Percentage of
Population City Distribution
County
Distribution
Quarter Ending: June 30, 2021 Solid Waste Disposal Tax Distribution
Henderson County 81,466 1.78662% 19,112.81$
Flat Rock * 3,365 0.00000% -$
Fletcher 8,491 0.14726% 1,575.35$
Hendersonville 14,277 0.24760% 2,648.77$
Laurel Park 2,257 0.03914% 418.71$
Mills River * 7,554 0.00000% -$
Hertford County 14,624 0.32072% 3,430.98$
Ahoskie 4,717 0.08181% 875.18$
Cofield 402 0.00697% 74.56$
Como * 90 0.00000% -$
Harrellsville 101 0.00175% 18.71$
Murfreesboro 3,212 0.05570% 595.87$
Winton 711 0.01233% 131.90$
Hoke County 49,347 1.08222% 11,577.32$
Raeford 4,940 0.08567% 916.47$
Hyde County 5,145 0.11283% 1,207.03$
Iredell County 108,520 2.37994% 25,460.00$
Harmony 557 0.00966% 103.34$
Love Valley 124 0.00215% 23.00$
Mooresville 42,594 0.73869% 7,902.33$
Statesville 26,028 0.45139% 4,828.85$
Troutman 2,884 0.05002% 535.10$
Jackson County 40,287 0.88353% 9,451.78$
Dillsboro * 231 0.00000% -$
Forest Hills * 378 0.00000% -$
Sylva 2,728 0.04731% 506.10$
Webster * 374 0.00000% -$
Page 13 of 25

Cities & Counties Populations
City Percentage
of Population
County
Percentage of
Population City Distribution
County
Distribution
Quarter Ending: June 30, 2021 Solid Waste Disposal Tax Distribution
Johnston County 145,152 3.18331% 34,054.24$
Archer Lodge * 5,256 0.00000% -$
Benson 3,556 0.06167% 659.73$
Clayton 23,775 0.41232% 4,410.89$
Four Oaks 2,204 0.03822% 408.86$
Kenly 1,433 0.02485% 265.84$
Micro 472 0.00819% 87.61$
Pine Level 1,911 0.03314% 354.52$
Princeton 1,296 0.02248% 240.49$
Selma 6,703 0.11625% 1,243.61$
Smithfield 11,619 0.20150% 2,155.60$
Wilson's Mills * 2,800 0.00000% -$
Jones County 8,419 0.18464% 1,975.23$
Maysville 1,023 0.01774% 189.78$
Pollocksville * 328 0.00000% -$
Trenton 306 0.00531% 56.81$
Lee County 29,819 0.65396% 6,995.90$
Broadway 1,334 0.02314% 247.55$
Sanford 30,037 0.52092% 5,572.67$
Lenoir County 33,353 0.73146% 7,824.98$
Kinston 20,154 0.34952% 3,739.08$
La Grange 2,737 0.04747% 507.82$
Pink Hill 549 0.00952% 101.84$
Lincoln County 75,954 1.66574% 17,819.67$
Lincolnton 10,952 0.18994% 2,031.94$
Macon County 31,438 0.68946% 7,375.67$
Franklin * 4,150 0.00000% -$
Highlands 960 0.01665% 178.12$
Page 14 of 25

Cities & Counties Populations
City Percentage
of Population
County
Percentage of
Population City Distribution
County
Distribution
Quarter Ending: June 30, 2021 Solid Waste Disposal Tax Distribution
Madison County 18,768 0.41160% 4,403.20$
Hot Springs 593 0.01028% 109.97$
Mars Hill 2,072 0.03593% 384.36$
Marshall 948 0.01644% 175.87$
Martin County 14,591 0.31999% 3,423.18$
Bear Grass * 71 0.00000% -$
Everetts * 153 0.00000% -$
Hamilton 386 0.00669% 71.57$
Hassell * 82 0.00000% -$
Jamesville 465 0.00806% 86.22$
Oak City * 297 0.00000% -$
Parmele 264 0.00458% 49.00$
Robersonville 1,386 0.02404% 257.17$
Williamston 5,336 0.09254% 989.96$
McDowell County 37,046 0.81245% 8,691.38$
Marion 8,473 0.14694% 1,571.93$
Old Fort 908 0.01575% 168.49$
i
Mecklenburg County 59,076 1.29555% 13,859.45$
Charlotte 863,985 14.98380% 160,292.97$
Cornelius 32,144 0.55746% 5,963.57$
Davidson 13,625 0.23629% 2,527.78$
Huntersville 62,528 1.08440% 11,600.63$
Matthews 31,071 0.53885% 5,764.48$
Mint Hill * 27,754 0.00000% -$
Pineville 9,533 0.16533% 1,768.66$
Mitchell County 12,506 0.27427% 2,934.07$
Bakersville 474 0.00822% 87.94$
Spruce Pine 2,166 0.03756% 401.81$
Page 15 of 25

Cities & Counties Populations
City Percentage
of Population
County
Percentage of
Population City Distribution
County
Distribution
Quarter Ending: June 30, 2021 Solid Waste Disposal Tax Distribution
Montgomery County 20,197 0.44294% 4,738.46$
Biscoe 1,674 0.02903% 310.55$
Candor 825 0.01431% 153.08$
Mount Gilead 1,142 0.01981% 211.92$
Star 877 0.01521% 162.71$
Troy 3,009 0.05218% 558.20$
Moore County 49,288 1.08093% 11,563.51$
Aberdeen 8,159 0.14150% 1,513.73$
Cameron 366 0.00635% 67.92$
Carthage 2,460 0.04266% 456.36$
Foxfire Village * 1,135 0.00000% -$
Pinebluff 1,554 0.02695% 288.30$
Pinehurst 17,484 0.30322% 3,243.77$
Robbins 1,175 0.02038% 218.02$
Southern Pines 14,400 0.24973% 2,671.55$
Taylortown 763 0.01323% 141.53$
Vass 832 0.01443% 154.37$
Whispering Pines 3,603 0.06249% 668.50$
Nash County 42,135 0.92406% 9,885.35$
Bailey 537 0.00931% 99.60$
Castalia 260 0.00451% 48.24$
Dortches * 1,016 0.00000% -$
Middlesex 831 0.01441% 154.16$
Momeyer * 220 0.00000% -$
Nashville 5,239 0.09086% 971.99$
Red Oak * 3,620 0.00000% -$
Rocky Mount 54,916 0.95239% 10,188.43$
Sharpsburg 1,953 0.03387% 362.33$
Spring Hope 1,320 0.02289% 244.87$
Page 16 of 25

Cities & Counties Populations
City Percentage
of Population
County
Percentage of
Population City Distribution
County
Distribution
Quarter Ending: June 30, 2021 Solid Waste Disposal Tax Distribution
New Hanover County 99,271 2.17710% 23,290.07$
Carolina Beach 6,152 0.10669% 1,141.34$
Kure Beach 2,261 0.03921% 419.46$
Wilmington 122,891 2.13125% 22,799.57$
Wrightsville Beach 2,487 0.04313% 461.39$
Northampton County 14,372 0.31519% 3,371.82$
Conway * 819 0.00000% -$
Garysburg * 975 0.00000% -$
Gaston * 1,093 0.00000% -$
Jackson * 468 0.00000% -$
Lasker * 118 0.00000% -$
Rich Square * 906 0.00000% -$
Seaboard * 578 0.00000% -$
Severn * 260 0.00000% -$
Woodland 729 0.01264% 135.21$
Onslow County 118,770 2.60473% 27,864.74$
Holly Ridge 1,980 0.03434% 367.36$
Jacksonville 80,328 1.39310% 14,903.03$
North Topsail Beach 796 0.01380% 147.63$
Richlands 1,930 0.03347% 358.05$
Swansboro 3,143 0.05451% 583.13$
Orange County 55,368 1.21427% 12,989.95$
Carrboro 20,769 0.36019% 3,853.22$
Chapel Hill 63,639 1.10367% 11,806.79$
Hillsborough 7,809 0.13543% 1,448.80$
Page 17 of 25

Cities & Counties Populations
City Percentage
of Population
County
Percentage of
Population City Distribution
County
Distribution
Quarter Ending: June 30, 2021 Solid Waste Disposal Tax Distribution
Pamlico County 7,854 0.17225% 1,842.69$
Alliance 779 0.01351% 144.52$
Arapahoe * 589 0.00000% -$
Bayboro 1,209 0.02097% 224.34$
Grantsboro * 694 0.00000% -$
Mesic 214 0.00371% 39.68$
Minnesott Beach 498 0.00864% 92.42$
Oriental 916 0.01589% 169.99$
Stonewall 282 0.00489% 52.31$
Vandemere 251 0.00435% 46.53$
Pasquotank County 22,232 0.48757% 5,215.90$
Elizabeth City 17,765 0.30809% 3,295.87$
Pender County 55,723 1.22205% 13,073.19$
Atkinson 357 0.00619% 66.21$
Burgaw 4,087 0.07088% 758.25$
St. Helena 434 0.00753% 80.56$
Surf City 2,207 0.03828% 409.51$
Topsail Beach 418 0.00725% 77.56$
Watha 232 0.00402% 43.00$
Perquimans County 11,025 0.24179% 2,586.61$
Hertford 2,105 0.03651% 390.57$
Winfall 610 0.01058% 113.18$
Person County 32,171 0.70554% 7,547.69$
Roxboro 8,144 0.14124% 1,510.95$
Page 18 of 25

Cities & Counties Populations
City Percentage
of Population
County
Percentage of
Population City Distribution
County
Distribution
Quarter Ending: June 30, 2021 Solid Waste Disposal Tax Distribution
Pitt County 64,128 1.40638% 15,045.10$
Ayden 5,040 0.08741% 935.09$
Bethel 1,547 0.02683% 287.02$
Falkland 97 0.00168% 17.97$
Farmville 4,634 0.08037% 859.78$
Fountain 428 0.00742% 79.38$
Greenville 92,313 1.60095% 17,126.56$
Grifton 2,709 0.04698% 502.57$
Grimesland 449 0.00779% 83.34$
Simpson 441 0.00765% 81.84$
Winterville 9,696 0.16815% 1,798.82$
Polk County 18,220 0.39958% 4,274.61$
Columbus 1,012 0.01755% 187.74$
Saluda 748 0.01297% 138.75$
Tryon 1,819 0.03155% 337.51$
Randolph County 89,348 1.95948% 20,962.02$
Archdale 12,278 0.21293% 2,277.87$
Asheboro 26,073 0.45217% 4,837.20$
Franklinville 1,202 0.02085% 223.05$
Liberty 2,622 0.04547% 486.42$
Ramseur * 1,658 0.00000% -$
Randleman 4,177 0.07244% 774.94$
Seagrove 226 0.00392% 41.94$
Staley 412 0.00715% 76.49$
Trinity 6,625 0.11489% 1,229.07$
Richmond County 27,201 0.59654% 6,381.64$
Dobbins Heights 822 0.01426% 152.55$
Ellerbe 1,025 0.01778% 190.20$
Hamlet 6,305 0.10935% 1,169.80$
Hoffman 574 0.00995% 106.45$
Norman * 143 0.00000% -$
Rockingham 9,048 0.15692% 1,678.69$
Page 19 of 25

Cities & Counties Populations
City Percentage
of Population
County
Percentage of
Population City Distribution
County
Distribution
Quarter Ending: June 30, 2021 Solid Waste Disposal Tax Distribution
Robeson County 94,664 2.07606% 22,209.16$
Fairmont 2,580 0.04474% 478.62$
Lumber Bridge * 89 0.00000% -$
Lumberton 20,875 0.36203% 3,872.90$
Marietta * 172 0.00000% -$
Maxton 2,289 0.03970% 424.71$
McDonald * 107 0.00000% -$
Orrum 90 0.00156% 16.68$
Parkton 422 0.00732% 78.31$
Pembroke 3,246 0.05629% 602.17$
Proctorville * 112 0.00000% -$
Raynham * 94 0.00000% -$
Red Springs 3,276 0.05681% 607.73$
Rennert * 391 0.00000% -$
Rowland 976 0.01693% 181.11$
St. Pauls 2,121 0.03678% 393.47$
Rockingham County 54,059 1.18556% 12,682.83$
Eden 14,989 0.25995% 2,780.88$
Madison 2,169 0.03762% 402.45$
Mayodan 2,395 0.04154% 444.39$
Reidsville 14,277 0.24760% 2,648.77$
Stoneville 1,260 0.02185% 233.74$
Wentworth * 2,719 0.00000% -$
Rowan County 78,381 1.71896% 18,389.00$
China Grove 4,324 0.07499% 802.22$
Cleveland 898 0.01557% 166.57$
East Spencer 1,512 0.02622% 280.50$
Faith 835 0.01448% 154.90$
Granite Quarry 3,148 0.05459% 583.99$
Landis 3,194 0.05539% 592.55$
Rockwell 2,179 0.03779% 404.26$
Salisbury 34,973 0.60652% 6,488.39$
Spencer 3,282 0.05692% 608.91$
Page 20 of 25

Cities & Counties Populations
City Percentage
of Population
County
Percentage of
Population City Distribution
County
Distribution
Quarter Ending: June 30, 2021 Solid Waste Disposal Tax Distribution
Rutherford County 49,816 1.09251% 11,687.40$
Bostic 393 0.00682% 72.95$
Chimney Rock 112 0.00194% 20.76$
Ellenboro 895 0.01552% 166.02$
Forest City 7,443 0.12908% 1,380.86$
Lake Lure 1,235 0.02142% 229.15$
Ruth 464 0.00805% 86.11$
Rutherfordton 4,151 0.07199% 770.12$
Spindale 4,336 0.07520% 804.47$
Sampson County 52,234 1.14554% 12,254.70$
Autryville 199 0.00345% 36.90$
Clinton 8,292 0.14380% 1,538.34$
Garland 628 0.01089% 116.50$
Harrells 202 0.00350% 37.44$
Newton Grove 564 0.00978% 104.63$
Roseboro 1,158 0.02008% 214.81$
Salemburg 428 0.00742% 79.38$
Turkey 310 0.00538% 57.56$
Scotland County 18,414 0.40384% 4,320.17$
East Laurinburg * 293 0.00000% -$
Gibson 515 0.00893% 95.53$
Laurinburg 15,527 0.26928% 2,880.69$
Wagram 829 0.01438% 153.84$
Page 21 of 25

Cities & Counties Populations
City Percentage
of Population
County
Percentage of
Population City Distribution
County
Distribution
Quarter Ending: June 30, 2021 Solid Waste Disposal Tax Distribution
Stanly County 33,313 0.73058% 7,815.56$
Albemarle 16,240 0.28164% 3,012.91$
Badin 1,997 0.03463% 370.47$
Locust 3,715 0.06443% 689.26$
Misenheimer 780 0.01353% 144.74$
New London 753 0.01306% 139.71$
Norwood 2,421 0.04199% 449.20$
Oakboro 2,101 0.03644% 389.83$
Red Cross 785 0.01361% 145.60$
Richfield * 668 0.00000% -$
Stanfield 1,653 0.02867% 306.70$
Stokes County 38,819 0.85133% 9,107.31$
Danbury 186 0.00323% 34.56$
King 6,955 0.12062% 1,290.37$
Walnut Cove 1,385 0.02402% 256.96$
Surry County 56,094 1.23019% 13,160.26$
Dobson 1,579 0.02738% 292.91$
Elkin 4,103 0.07116% 761.25$
Mount Airy 10,286 0.17839% 1,908.37$
Pilot Mountain 1,508 0.02615% 279.76$
Swain County 12,985 0.28477% 3,046.40$
Bryson City 1,489 0.02582% 276.22$
Transylvania County 26,463 0.58036% 6,208.54$
Brevard 8,198 0.14217% 1,520.90$
Rosman 625 0.01084% 115.96$
Tyrrell County 3,014 0.06610% 707.12$
Columbia * 759 0.00000% -$
Page 22 of 25

Cities & Counties Populations
City Percentage
of Population
County
Percentage of
Population City Distribution
County
Distribution
Quarter Ending: June 30, 2021 Solid Waste Disposal Tax Distribution
Union County 75,695 1.66006% 17,758.90$
Fairview * 3,823 0.00000% -$
Hemby Bridge * 1,617 0.00000% -$
Indian Trail 39,829 0.69074% 7,389.37$
Lake Park 3,755 0.06512% 696.64$
Marshville 2,454 0.04256% 455.30$
Marvin * 7,285 0.00000% -$
Mineral Springs * 3,092 0.00000% -$
Monroe 35,432 0.61448% 6,573.55$
Stallings 16,685 0.28936% 3,095.50$
Unionville 7,069 0.12259% 1,311.43$
Waxhaw 14,728 0.25542% 2,732.42$
Weddington * 11,160 0.00000% -$
Wesley Chapel * 9,321 0.00000% -$
Wingate 4,153 0.07202% 770.45$
Vance County 30,277 0.66400% 7,103.30$
Henderson 14,812 0.25688% 2,748.04$
Kittrell * 172 0.00000% -$
Middleburg * 131 0.00000% -$
Wake County 186,961 4.10022% 43,863.12$
Apex 61,319 1.06343% 11,376.30$
Cary 167,223 2.90008% 31,024.32$
Fuquay-Varina 28,109 0.48748% 5,214.95$
Garner 32,219 0.55876% 5,977.46$
Holly Springs 36,394 0.63117% 6,752.10$
Knightdale 17,264 0.29940% 3,202.90$
Morrisville 26,973 0.46778% 5,004.19$
Raleigh 475,580 8.24780% 88,232.88$
Rolesville 6,921 0.12003% 1,284.05$
Wake Forest 38,641 0.67014% 7,168.99$
Wendell 7,515 0.13033% 1,394.24$
Zebulon 5,165 0.08957% 958.20$
Page 23 of 25
Cities & Counties Populations
City Percentage
of Population
County
Percentage of
Population City Distribution
County
Distribution
Quarter Ending: June 30, 2021 Solid Waste Disposal Tax Distribution
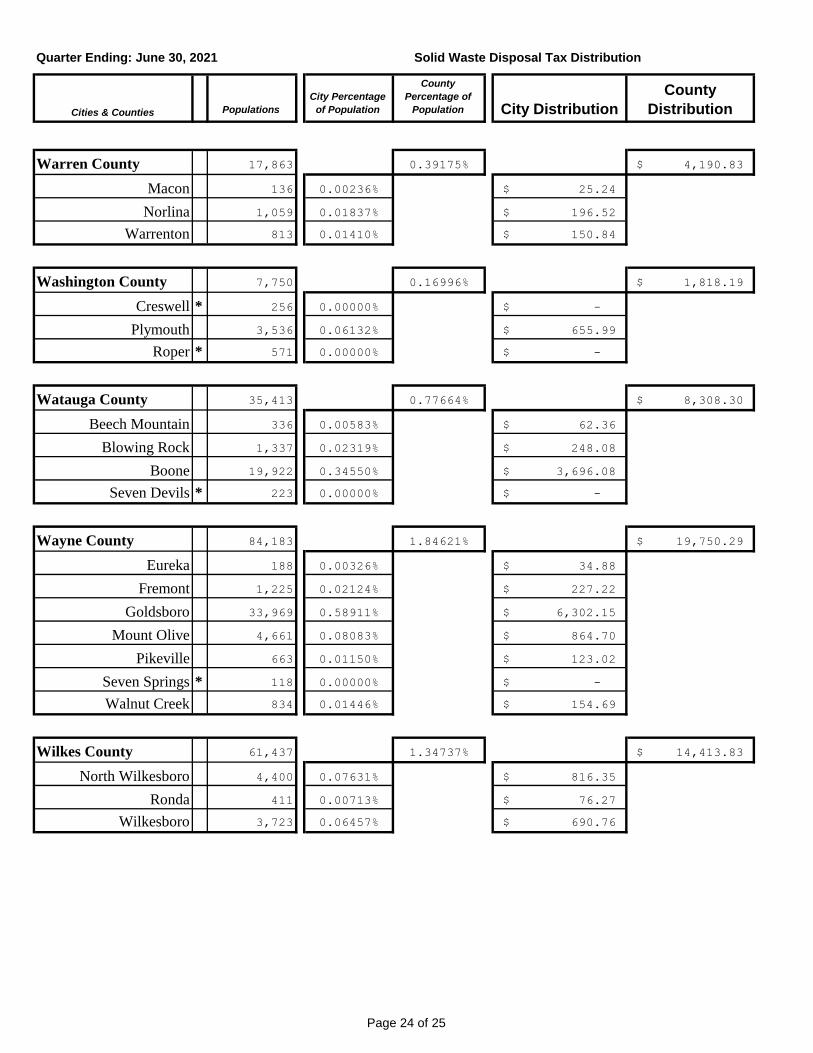
Warren County 17,863 0.39175% 4,190.83$
Macon 136 0.00236% 25.24$
Norlina 1,059 0.01837% 196.52$
Warrenton 813 0.01410% 150.84$
Washington County 7,750 0.16996% 1,818.19$
Creswell * 256 0.00000% -$
Plymouth 3,536 0.06132% 655.99$
Roper * 571 0.00000% -$
Watauga County 35,413 0.77664% 8,308.30$
Beech Mountain 336 0.00583% 62.36$
Blowing Rock 1,337 0.02319% 248.08$
Boone 19,922 0.34550% 3,696.08$
Seven Devils * 223 0.00000% -$
Wayne County 84,183 1.84621% 19,750.29$
Eureka 188 0.00326% 34.88$
Fremont 1,225 0.02124% 227.22$
Goldsboro 33,969 0.58911% 6,302.15$
Mount Olive 4,661 0.08083% 864.70$
Pikeville 663 0.01150% 123.02$
Seven Springs * 118 0.00000% -$
Walnut Creek 834 0.01446% 154.69$
Wilkes County 61,437 1.34737% 14,413.83$
North Wilkesboro 4,400 0.07631% 816.35$
Ronda 411 0.00713% 76.27$
Wilkesboro 3,723 0.06457% 690.76$
Page 24 of 25

Cities & Counties Populations
City Percentage
of Population
County
Percentage of
Population City Distribution
County
Distribution
Quarter Ending: June 30, 2021 Solid Waste Disposal Tax Distribution
Wilson County 27,954 0.61306% 6,558.37$
Black Creek 770 0.01335% 142.81$
Elm City 1,257 0.02180% 233.20$
Lucama * 1,165 0.00000% -$
Saratoga 412 0.00715% 76.49$
Sims 318 0.00551% 58.95$
Stantonsburg 792 0.01374% 146.99$
Wilson 49,384 0.85645% 9,162.09$
Yadkin County 31,086 0.68174% 7,293.07$
Boonville 1,222 0.02119% 226.69$
East Bend 591 0.01025% 109.66$
Jonesville 2,244 0.03892% 416.36$
Yadkinville 2,987 0.05180% 554.14$
Yancey County 16,962 0.37199% 3,979.46$
Burnsville 1,724 0.02990% 319.86$
100.00000% 100.00000% 1,069,774.67$ 1,069,774.67$
* Pursuant to provisions of Article 5G of Chapter 105 of the General Statutes, the Department ofEnvironmental Quality has advised the Department of Revenue that this city or county is excluded from the solid waste disposal tax distribution.
Page 25 of 25