north america oil & gas exploration & production · exploration & production sixth...
TRANSCRIPT
See Disclosure Appendix of this report for important Disclosures and Analyst Certifications
North America Oil & Gas Exploration & ProductionSixth Joint IEA-IEF-OPEC Workshop on the Interactions between Physical
and Financial Energy Markets
Developments in Oil Market Financing
Bob Brackett, Ph.D. • Senior Analyst • +1-212-756-4656 • [email protected]
Andrew Pizzi • Senior Research Associate • +1-212-407-5813 • [email protected]
Zhenhao Li • Research Associate • +1-212-756-4007• [email protected]
March 16th, 2018
NORTH AMERICAN OIL & GAS EXPLORATION/PRODUCTION | 2
North American Oil & Gas Exploration & Production team
Bob Brackett, Ph.D. (Senior Analyst)
Bob Brackett is the Senior Research Analyst covering North American Oil & Gas Exploration & Production. He is currently recognized as All-American
#1 by Institutional Investor (for the 5th year in a row) and #1 by Greenwich buy-side surveys. Previously, Bob was Director of E&P Planning and also
Director of Corporate Strategy for Hess Corporation. Before Hess, Bob was an Engagement Manager with McKinsey & Company's Petroleum
Practice, serving the majority of the world’s largest oil companies across five continents and 30 countries throughout the petroleum value chain. Bob
began his career with ExxonMobil, spending eight years in positions in Exploration, Business Development, Development and Research. As a NASA
Space Grant Fellow, Bob received his PhD in Earth & Planetary Sciences from Washington University – St. Louis. He received his MBA from Rice
University in Houston. He also holds a BS in Geophysics and a BA in Astronomy from the University of Texas.
Andrew Pizzi (Senior Associate)
Andrew Pizzi is the Senior Research Associate on the North American Oil and Gas Exploration & Production team. Previously, Andrew was the Senior
Market Analyst at Bloom Energy, a manufacturer of natural gas generators based on fuel cell technology. Prior to Bloom Energy, Andrew spent four
years with NERA Economic Consulting analyzing oil, gas, and power markets and regulation. Andrew received an MBA from Wharton and holds a
Bachelor’s degree in Economics from Williams College.
Zhenhao Li (Associate)
Zhenhao (Zen) Li is the Research Associate on the North American Oil and Gas Exploration & Production and Natural Gas & MLPs team. Previously,
Zhenhao has interned at UBS’ investment banking division in their industrials team and at KKR in their internal auditing team. He holds a Bachelor’s
degree in Economics with concentrations in Finance and Accounting from the Wharton School.
NORTH AMERICAN OIL & GAS EXPLORATION/PRODUCTION | 3
Key points
Developments in oil market financingQuick answer – E&Ps don’t need it.
How do E&Ps think about fundingCash in ~ cash out (except when greedy or scared)
Goldilocks example – E&Ps at top / bottom / mid cycle
How E&Ps won the shale war
What do E&Ps do with fundingE&P mentality towards balance sheet
Role of de-levering
Capex takes lion’s share
Why the “predator prey” model is so importantoil production is a function of price
today’s price means too much production
Lotka-Volterra equation
How to stop the shale “predators”Financing, fiscal terms, inflation, dis-efficiencies, lack of inventory, … or culling
“Culling” – a collapse in oil price – has a strong negative nonlinear reaction – reduces supply & CFO & future growth
NORTH AMERICAN OIL & GAS EXPLORATION/PRODUCTION | 4
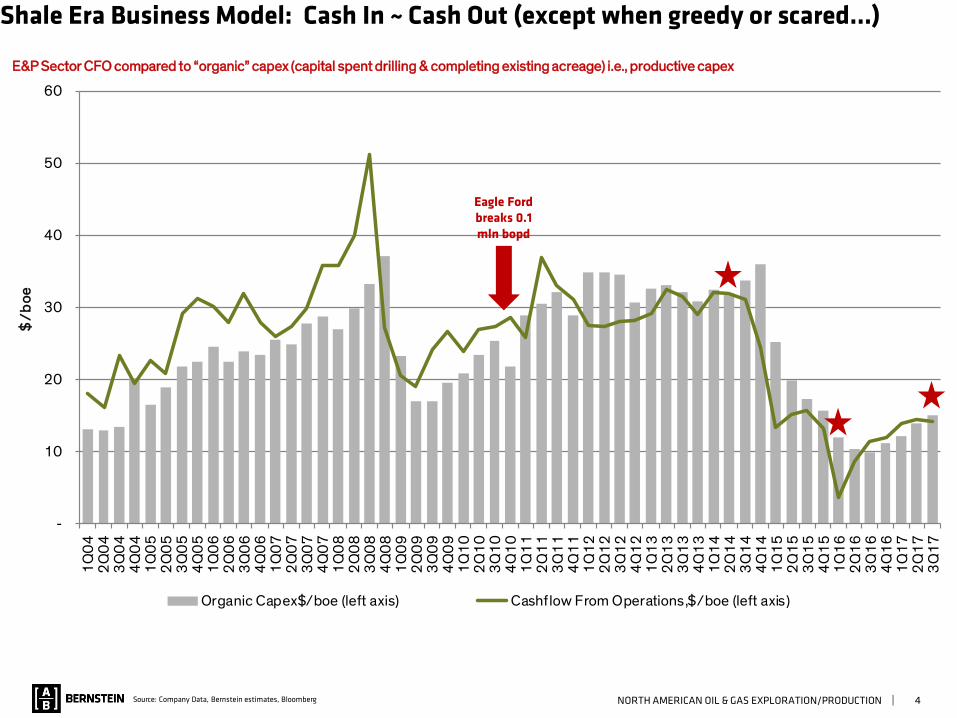
Shale Era Business Model: Cash In ~ Cash Out (except when greedy or scared…)
E&P Sector CFO compared to “organic” capex (capital spent drilling & completing existing acreage) i.e., productive capex
Source: Company Data, Bernstein estimates, Bloomberg
-
10
20
30
40
50
601
Q0
42
Q0
43
Q0
44
Q0
41
Q0
52
Q0
53
Q0
54
Q0
51
Q0
62
Q0
63
Q0
64
Q0
61
Q0
72
Q0
73
Q0
74
Q0
71
Q0
82
Q0
83
Q0
84
Q0
81
Q0
92
Q0
93
Q0
94
Q0
91
Q1
02
Q1
03
Q1
04
Q1
01
Q1
12
Q1
13
Q1
14
Q1
11
Q1
22
Q1
23
Q1
24
Q1
21
Q1
32
Q1
33
Q1
34
Q1
31
Q1
42
Q1
43
Q1
44
Q1
41
Q1
52
Q1
53
Q1
54
Q1
51
Q1
62
Q1
63
Q1
64
Q1
61
Q1
72
Q1
73
Q1
7
$/
bo
e
Organic Capex$/boe (left axis) Cashflow From Operations,$/boe (left axis)
Eagle Ford breaks 0.1 mln bopd

NORTH AMERICAN OIL & GAS EXPLORATION/PRODUCTION | 5
Top of cycle… $103 oil and $4.5 gas…too good a business
68
58
37
19
11
32
32
10
-
14
2 2 3
17
2 6
-
17 3
7
-
10
20
30
40
50
60
70
80E
xp. R
eve
nu
e
Re
aliz
atio
n S
pre
ads
Re
po
rted
Re
ven
ue
Pro
d. C
ost
s
Pro
d. T
axe
s
Exp
lora
tio
n E
xp.
SG
&A
EB
ITD
A
DD
&A
EB
IT
Inte
rest
Fin
an
cia
l Ta
x
Cle
an N
et
Inc
om
e
DD
&A
Oth
er
CF
Op
era
tio
ns
Org
an
ic a
nd
…
$ p
er
bo
e
E&P overview: 2Q14
Source: Company Data, Bernstein estimates, Bloomberg
NORTH AMERICAN OIL & GAS EXPLORATION/PRODUCTION | 6
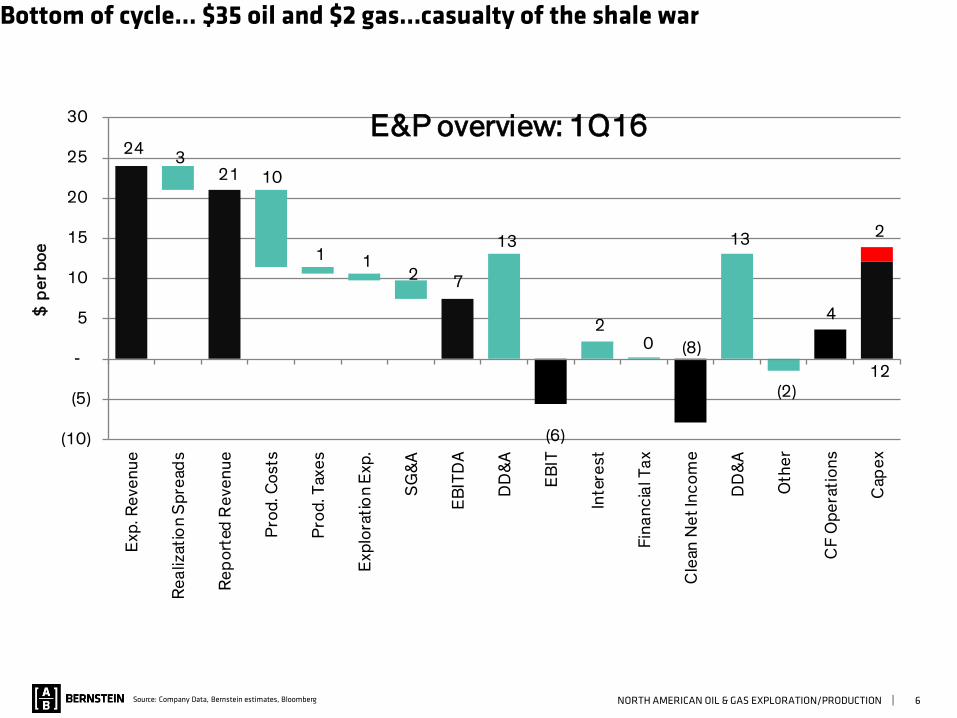
Bottom of cycle… $35 oil and $2 gas…casualty of the shale war
24
21
7
(6)
(8)
4
12
3 10
1 1 2
13
2 0
13
(2)
2
(10)
(5)
-
5
10
15
20
25
30E
xp. R
eve
nu
e
Re
aliz
atio
n S
pre
ads
Re
po
rted
Re
ven
ue
Pro
d. C
ost
s
Pro
d. T
axe
s
Exp
lora
tio
n E
xp.
SG
&A
EB
ITD
A
DD
&A
EB
IT
Inte
rest
Fin
an
cia
l Ta
x
Cle
an N
et
Inc
om
e
DD
&A
Oth
er
CF
Op
era
tio
ns
Cap
ex
$ p
er
bo
e
E&P overview: 1Q16
Source: Company Data, Bernstein estimates, Bloomberg

NORTH AMERICAN OIL & GAS EXPLORATION/PRODUCTION | 7
36
31
16
4
1
14
15
4
11
1 1
2 12
2 1
12 2
2
-
5
10
15
20
25
30
35
40E
xp. R
eve
nu
e
Re
aliz
atio
n S
pre
ads
Re
po
rted
Re
ven
ue
Pro
d. C
ost
s
Pro
d. T
axe
s
Exp
lora
tio
n E
xp.
SG
&A
EB
ITD
A
DD
&A
EB
IT
Inte
rest
Fin
an
cia
l Ta
x
Cle
an N
et
Inc
om
e
DD
&A
Oth
er
CF
Op
era
tio
ns
Org
an
ic a
nd
…
$ p
er
bo
e
E&P overview: 3Q17
3Q17 - $50 oil & $3 gas…from scheme to (poor) business
Source: Company Data, Bernstein estimates, Bloomberg
NORTH AMERICAN OIL & GAS EXPLORATION/PRODUCTION | 8
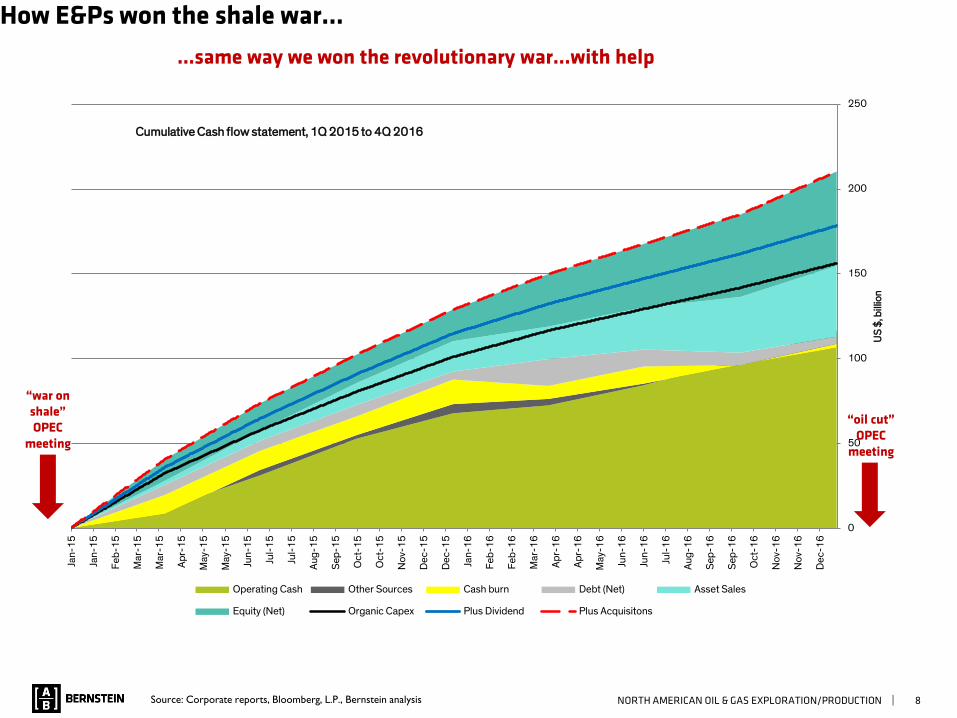
How E&Ps won the shale war…
...same way we won the revolutionary war…with help
Source: Corporate reports, Bloomberg, L.P., Bernstein analysis
0
50
100
150
200
250
Jan
-15
Jan
-15
Fe
b-1
5
Mar
-15
Mar
-15
Ap
r-1
5
May
-15
May
-15
Jun
-15
Jul-
15
Jul-
15
Au
g-1
5
Se
p-1
5
Oct
-15
Oct
-15
No
v-1
5
De
c-1
5
De
c-1
5
Jan
-16
Fe
b-1
6
Fe
b-1
6
Mar
-16
Ap
r-1
6
Ap
r-1
6
May
-16
Jun
-16
Jun
-16
Jul-
16
Au
g-1
6
Se
p-1
6
Se
p-1
6
Oct
-16
No
v-1
6
No
v-1
6
De
c-1
6
US
$, b
illio
n
Cumulative Cash flow statement, 1Q 2015 to 4Q 2016
Operating Cash Other Sources Cash burn Debt (Net) Asset Sales
Equity (Net) Organic Capex Plus Dividend Plus Acquisitons
“war onshale”OPEC
meeting
“oil cut”OPEC
meeting
NORTH AMERICAN OIL & GAS EXPLORATION/PRODUCTION | 9
-$5
$0
$5
$10
$15
$20
$25C
FO
Div
ide
nd
s
Cap
ex
Ac
qu
isit
ion
s
Sal
es
De
bt
Eq
uit
y
Oth
er
∆ C
ash
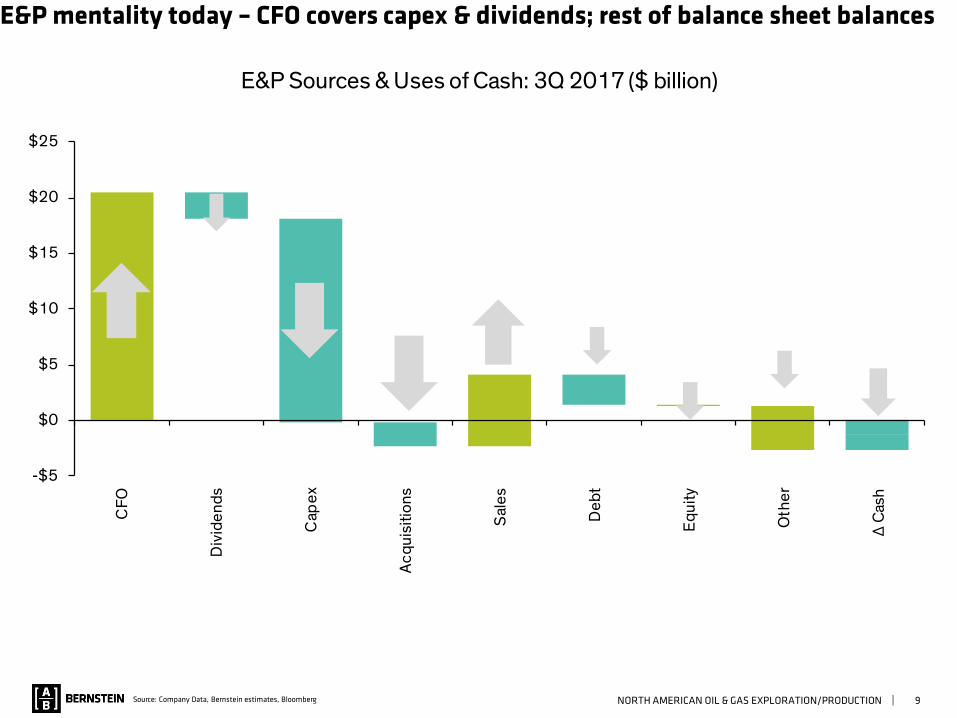
E&P Sources & Uses of Cash: 3Q 2017 ($ billion)
E&P mentality today – CFO covers capex & dividends; rest of balance sheet balances
Source: Company Data, Bernstein estimates, Bloomberg
NORTH AMERICAN OIL & GAS EXPLORATION/PRODUCTION | 10
20%
25%
30%
35%
40%
45%
1Q
04
2Q
04
3Q
04
4Q
04
1Q
05
2Q
05
3Q
05
4Q
05
1Q
06
2Q
06
3Q
06
4Q
06
1Q
07
2Q
07
3Q
07
4Q
07
1Q
08
2Q
08
3Q
08
4Q
08
1Q
09
2Q
09
3Q
09
4Q
09
1Q
10
2Q
10
3Q
10
4Q
10
1Q
11
2Q
11
3Q
11
4Q
11
1Q
12
2Q
12
3Q
12
4Q
12
1Q
13
2Q
13
3Q
13
4Q
13
1Q
14
2Q
14
3Q
14
4Q
14
1Q
15
2Q
15
3Q
15
4Q
15
1Q
16
2Q
16
3Q
16
4Q
16
1Q
17
2Q
17
3Q
17
Debt to Total Cap % (left axis)
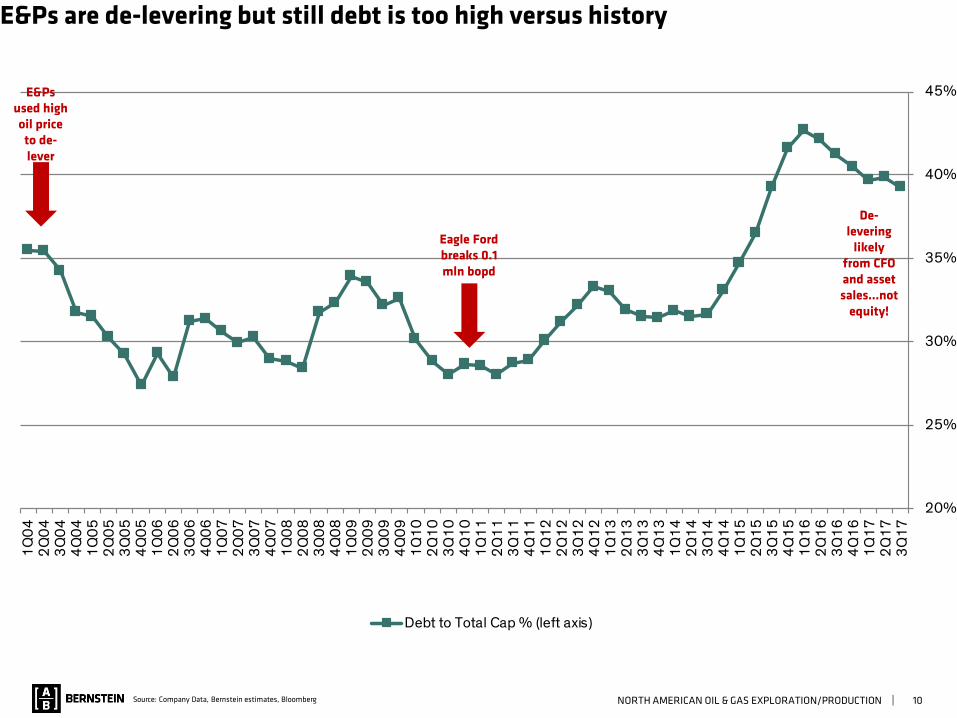
E&Ps are de-levering but still debt is too high versus history
Source: Company Data, Bernstein estimates, Bloomberg
Eagle Ford breaks 0.1 mln bopd
E&Ps used high oil price
to de-lever
De-levering
likely from CFO and asset sales…not
equity!

NORTH AMERICAN OIL & GAS EXPLORATION/PRODUCTION | 11Source: Company Data, Bernstein estimates, Bloomberg
-
500,000
1,000,000
1,500,000
2,000,000
2,500,000
3,000,000
3,500,000
4,000,000
4,500,000
5,000,000
Shale Contribution by Quarter (bopd)
Q1 2010 Q2 2010 Q3 2010 Q4 2010 Q1 2011 Q2 2011 Q3 2011 Q4 2011 Q1 2012 Q2 2012 Q3 2012
Q4 2012 Q1 2013 Q2 2013 Q3 2013 Q4 2013 Q1 2014 Q2 2014 Q3 2014 Q4 2014 Q1 2015 Q2 2015
Q3 2015 Q4 2015 Q1 2016 Q2 2016 Q3 2016 Q4 2016 Q1 2017 Q2 2017 Q3 2017
Lion’s share of CFO goes to capex…
NORTH AMERICAN OIL & GAS EXPLORATION/PRODUCTION | 12
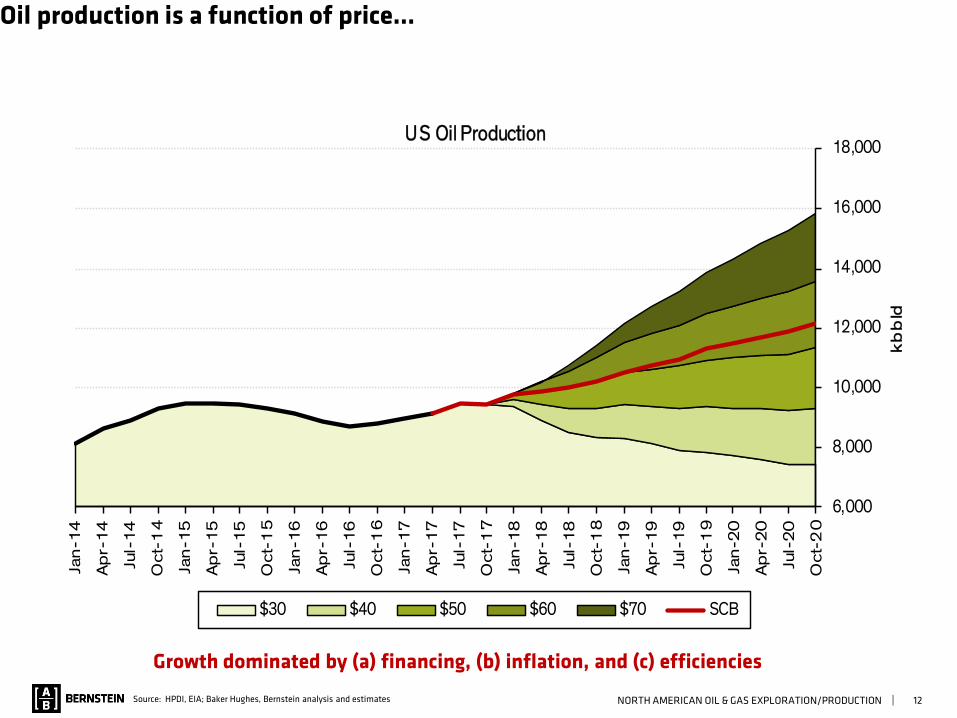
Oil production is a function of price…
Source: HPDI, EIA; Baker Hughes, Bernstein analysis and estimates
6,000
8,000
10,000
12,000
14,000
16,000
18,000
Jan
-14
Ap
r-1
4
Jul-
14
Oc
t-1
4
Jan
-15
Ap
r-1
5
Jul-
15
Oc
t-1
5
Jan
-16
Ap
r-1
6
Jul-
16
Oc
t-1
6
Jan
-17
Ap
r-1
7
Jul-
17
Oc
t-1
7
Jan
-18
Ap
r-1
8
Jul-
18
Oc
t-1
8
Jan
-19
Ap
r-1
9
Jul-
19
Oc
t-1
9
Jan
-20
Ap
r-2
0
Jul-
20
Oc
t-2
0
kb
bld
U S Oil Production
$30 $40 $50 $60 $70 SCB
Growth dominated by (a) financing, (b) inflation, and (c) efficiencies

NORTH AMERICAN OIL & GAS EXPLORATION/PRODUCTION | 13Source: Company Data, Bernstein estimates, Bloomberg
0
10
20
30
40
50
60
0
24
48
72
96
12
0
14
4
16
8
19
2
21
6
24
0
26
4
28
8
31
2
33
6
36
0
38
4
40
8
43
2
45
6
48
0
50
4
52
8
55
2
57
6
60
0
62
4
64
8
67
2
69
6
72
0
74
4
76
8
79
2
81
6
84
0
86
4
88
8
91
2
93
6
96
0
98
4
Predator-Prey Model (Lotka-Volterra)
Rabbits (in thousands) Foxes (in thousands)
Lotka-Volterra (1st order nonlinear differential equations describing biologic systems)

NORTH AMERICAN OIL & GAS EXPLORATION/PRODUCTION | 14
0
10
20
30
40
50
60
0
24
48
72
96
12
0
14
4
16
8
19
2
21
6
24
0
26
4
28
8
31
2
33
6
36
0
38
4
40
8
43
2
45
6
48
0
50
4
52
8
55
2
57
6
60
0
62
4
64
8
67
2
69
6
72
0
74
4
76
8
79
2
81
6
84
0
86
4
88
8
91
2
93
6
96
0
98
4
Predator-Prey Model (Lotka-Volterra)
Cash Flow Shale Production
Shale is not a thermostat – it induces waves (and needs culling!)
...”equilibrium price” is lower than where we are today

NORTH AMERICAN OIL & GAS EXPLORATION/PRODUCTION | 15
How to stop the shale “predators”
FinancingInvestor-imposed financial discipline appears to be coming
Fiscal termsU.S. tax reform a modest net positive
Inflationruns at about ½ the beta of the commodity price…dampens impacts a bit
Dis-efficienciesnot any time soon
Lack of inventorynot any time soon
Cullingcoming soon?

NORTH AMERICAN OIL & GAS EXPLORATION/PRODUCTION | 16Source: Company Data, Bernstein estimates, Bloomberg
$(2)
$(4)
$3
$(2)
$1 $(1)
$1 $(1)
$(2)
$2 $(2)
$3
$13
$3
$1 $2
$12
$7
$11
$7
$3 $2
$(3)
$(1)
$(2)
$(6)
$(4)
$(2)
$-
$2
$4
$6
$8
$10
$12
$14
1Q
12
2Q
12
3Q
12
4Q
12
1Q
13
2Q
13
3Q
13
4Q
13
1Q
14
2Q
14
3Q
14
4Q
14
1Q
15
2Q
15
3Q
15
4Q
15
1Q
16
2Q
16
3Q
16
4Q
16
1Q
17
2Q
17
3Q
17
4Q
17
1Q
18
Net Equity (+) Issuance / (-) Repurchases ($bln) Share Repurchase Announced ($bln)
How to stop shale "predators"? Financial discipline…but need a lot!
NORTH AMERICAN OIL & GAS EXPLORATION/PRODUCTION | 17
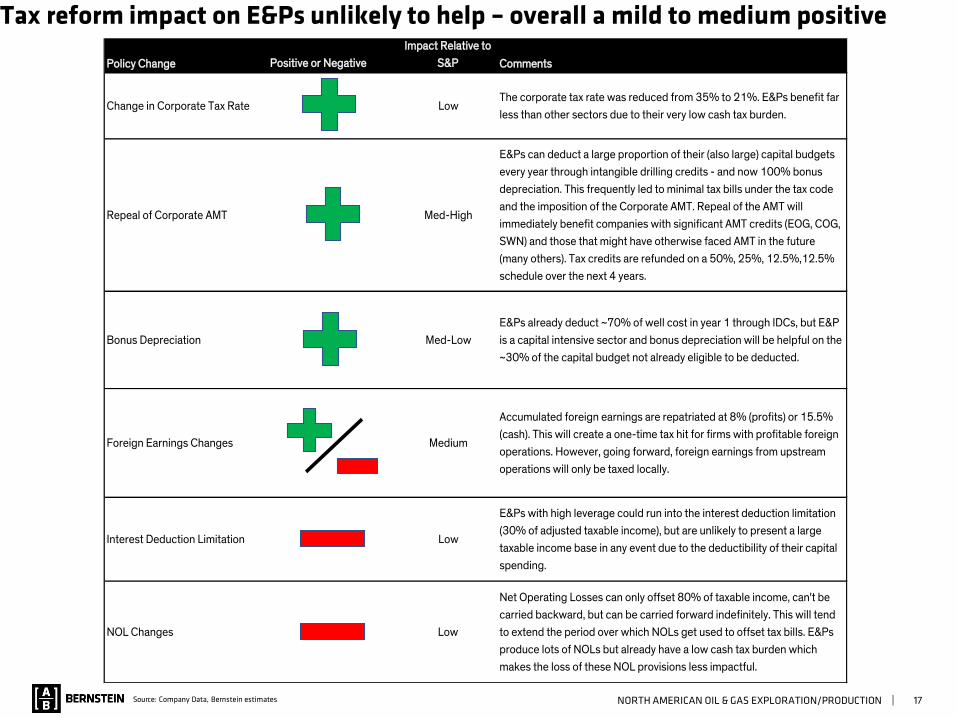
Tax reform impact on E&Ps unlikely to help – overall a mild to medium positive
Source: Company Data, Bernstein estimates
Policy Change Positive or Negative
Impact Relative to
S&P Comments
Change in Corporate Tax Rate LowThe corporate tax rate was reduced from 35% to 21%. E&Ps benefit far
less than other sectors due to their very low cash tax burden.
Repeal of Corporate AMT Med-High
E&Ps can deduct a large proportion of their (also large) capital budgets
every year through intangible drilling credits - and now 100% bonus
depreciation. This frequently led to minimal tax bills under the tax code
and the imposition of the Corporate AMT. Repeal of the AMT will
immediately benefit companies with significant AMT credits (EOG, COG,
SWN) and those that might have otherwise faced AMT in the future
(many others). Tax credits are refunded on a 50%, 25%, 12.5%,12.5%
schedule over the next 4 years.
Bonus Depreciation Med-Low
E&Ps already deduct ~70% of well cost in year 1 through IDCs, but E&P
is a capital intensive sector and bonus depreciation will be helpful on the
~30% of the capital budget not already eligible to be deducted.
Foreign Earnings Changes Medium
Accumulated foreign earnings are repatriated at 8% (profits) or 15.5%
(cash). This will create a one-time tax hit for firms with profitable foreign
operations. However, going forward, foreign earnings from upstream
operations will only be taxed locally.
Interest Deduction Limitation Low
E&Ps with high leverage could run into the interest deduction limitation
(30% of adjusted taxable income), but are unlikely to present a large
taxable income base in any event due to the deductibility of their capital
spending.
NOL Changes Low
Net Operating Losses can only offset 80% of taxable income, can't be
carried backward, but can be carried forward indefinitely. This will tend
to extend the period over which NOLs get used to offset tax bills. E&Ps
produce lots of NOLs but already have a low cash tax burden which
makes the loss of these NOL provisions less impactful.
NORTH AMERICAN OIL & GAS EXPLORATION/PRODUCTION | 18
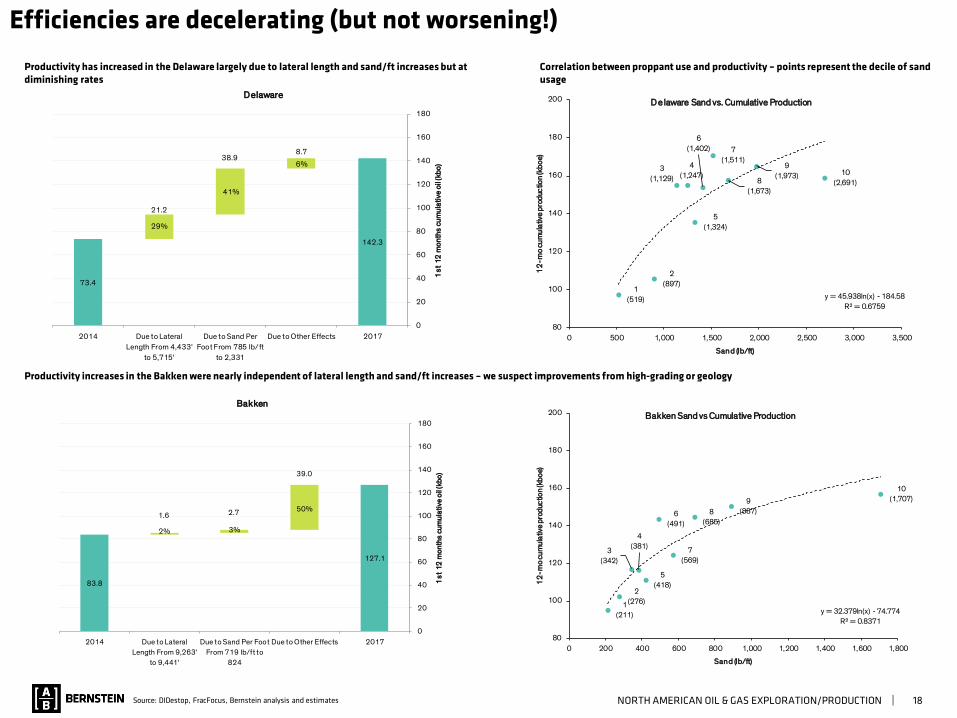
83.8
2%
1.6
3%
2.7 50%
39.0
127.1
0
20
40
60
80
100
120
140
160
180
2014 Due to Lateral
Length From 9,263'
to 9,441'
Due to Sand Per Foot
From 719 lb/ft to
824
Due to Other Effects 2017
1s
t 1
2 m
on
ths
cum
ula
tive
oil
(kb
o)
Bakken
Source: DIDestop, FracFocus, Bernstein analysis and estimates
73.4
29%
21.2
41%
38.96%
8.7
142.3
0
20
40
60
80
100
120
140
160
180
2014 Due to Lateral
Length From 4,433'
to 5,715'
Due to Sand Per
Foot From 785 lb/ft
to 2,331
Due to Other Effects 2017
1s
t 1
2 m
on
ths
cum
ula
tive
oil
(kb
o)
Delaware
1
(211)
2
(276)
3
(342)
4
(381)
5
(418)
6
(491)
7
(569)
8
(685)
9
(887)
10
(1,707)
y = 32.379ln(x) - 74.774
R² = 0.8371
80
100
120
140
160
180
200
0 200 400 600 800 1,000 1,200 1,400 1,600 1,800
12
-mo
cum
ula
tive
pro
duc
tion
(kb
oe)
San d (lb/ft)
Bakken Sand vs Cumulative Production
1
(519)
2
(897)
3
(1,129)
4
(1,247)
5
(1,324)
6
(1,402) 7
(1,511)
8
(1,673)
9
(1,973) 10
(2,691)
y = 45.938ln(x) - 184.58
R² = 0.6759
80
100
120
140
160
180
200
0 500 1,000 1,500 2,000 2,500 3,000 3,500
12
-mo
cum
ula
tive
pro
duc
tion
(kb
oe)
San d (lb/ft)
D elaware Sand vs. Cumulative Production
Productivity has increased in the Delaware largely due to lateral length and sand/ft increases but at diminishing rates
Productivity increases in the Bakken were nearly independent of lateral length and sand/ft increases – we suspect improvements from high-grading or geology
Efficiencies are decelerating (but not worsening!)
Correlation between proppant use and productivity – points represent the decile of sand usage

NORTH AMERICAN OIL & GAS EXPLORATION/PRODUCTION | 19
…and Permian supports sufficient inventory
Source: Di Desktop, IHS Energy, Bernstein analysis and estimates
4000
5000
6000
7000
8000
9000
10000
11000
12000
13000
0 5 10 15 20 25 30 35 40 45
Box # (from West to East across entire Permian) and Well Rate by Depth
EUR per 5,000' well (mln BO)
Wells 0.1 0.2 0.3 0.4 0.5 0.6 0.7 0.8 0.9 1 Spacing
1 0% 1% 1% 1% 2% 2% 2% 3% 3% 3% 5,280
2 1% 1% 2% 3% 3% 4% 5% 5% 6% 7% 2,640
3 1% 2% 3% 4% 5% 6% 7% 8% 9% 10% 1,760
4 1% 3% 4% 5% 7% 8% 9% 11% 12% 13% 1,320
5 2% 3% 5% 7% 8% 10% 12% 13% 15% 17% 1,056
6 2% 4% 6% 8% 10% 12% 14% 16% 18% 20% 880
7 2% 5% 7% 9% 12% 14% 16% 19% 21% 23% 754
8 3% 5% 8% 11% 13% 16% 19% 21% 24% 27% 660
Recovery Factor (with 5-10% RF highlighted)
West East
Brushy Canyon x x x x x x x x x x x x x x x x x x x
Leonard A x x x x x x x x x x x x x x x x x x x
Leonard B x x x x x x x x x x x x x x x x x x x
1st Bone Spring x x x x x x x x x x x x x x x x x x x
2nd Bone Spring x x x x x x x x x x x x x x x x x x x
3rd Bone Spring x x x x x x x x x x x x x x x x x x x
Upper Wolfcamp x x x x x x x x x x x x x x x x x x x
Middle Wolfcamp x x x x x x x x x x x x x x x x x x x
Lower Wolfcamp x x x x x x x x x x x x x x x x x x x
West East
Brushy Canyon x
Leonard A x x x
Leonard B x x
1st Bone Spring x x
2nd Bone Spring x x
3rd Bone Spring x x
Upper Wolfcamp x x x x
Middle Wolfcamp x x
Lower Wolfcamp x
On one extreme, every layer works at every point in the basin On another extreme, every layer works at one point in the basin
When we examine the depth of wells drilled over the play, we find 1000’-3000’ that work over most of the play
The vast majority of the play has <5 wells drilled per 1000 acre section
5-10% recovery factors seem reasonable

NORTH AMERICAN OIL & GAS EXPLORATION/PRODUCTION | 20
Key points
Developments in oil market financingQuick answer – E&Ps don’t need it.
How do E&Ps think about fundingCash in ~ cash out (except when greedy or scared)
Goldilocks example – E&Ps at top / bottom / mid cycle
How E&Ps won the shale war
What do E&Ps do with fundingE&P mentality towards balance sheet
Role of de-levering
Capex takes lion’s share
Why the “predator prey” model is so importantoil production is a function of price
today’s price means too much production
Lotka-Volterra equation
How to stop the shale “predators”Financing, fiscal terms, inflation, dis-efficiencies, lack of inventory, … or culling
“Culling” – a collapse in oil price – has a strong negative nonlinear reaction – reduces supply & CFO & future growth

NORTH AMERICAN OIL & GAS EXPLORATION/PRODUCTION | 21
Disclosure Appendix

NORTH AMERICAN OIL & GAS EXPLORATION/PRODUCTION | 22
SRO REQUIRED DISCLOSURES
• References to "Bernstein" relate to Sanford C. Bernstein & Co., LLC, Sanford C. Bernstein Limited, Sanford C. Bernstein (Hong Kong) Limited 盛博香港有限公司, Sanford C. Bernstein
(Canada) Limited, and Sanford C. Bernstein (business registration number 53193989L), a unit of AllianceBernstein (Singapore) Ltd. which is a licensed entity under the Securities and
Futures Act and registered with Company Registration No. 199703364C, collectively.
• Bernstein analysts are compensated based on aggregate contributions to the research franchise as measured by account penetration, productivity and proactivity of investment ideas. No
analysts are compensated based on performance in, or contributions to, generating investment banking revenues.
• Bernstein rates stocks based on forecasts of relative performance for the next 6-12 months versus the S&P 500 for stocks listed on the U.S. and Canadian exchanges, versus the MSCI
Pan Europe Index for stocks listed on the European exchanges (except for Russian companies), versus the MSCI Emerging Markets Index for Russian companies and stocks listed on
emerging markets exchanges outside of the Asia Pacific region, and versus the MSCI Asia Pacific ex-Japan Index for stocks listed on the Asian (ex-Japan) exchanges - unless otherwise
specified. We have three categories of ratings:
Outperform: Stock will outpace the market index by more than 15 pp in the year ahead.
Market-Perform: Stock will perform in line with the market index to within +/-15 pp in the year ahead.
Underperform: Stock will trail the performance of the market index by more than 15 pp in the year ahead.
Not Rated: The stock Rating, Target Price and/or estimates (if any) have been suspended temporarily.
• As of 03/06/2018, Bernstein's ratings were distributed as follows: Outperform - 48.9% (0.0% banking clients) ; Market-Perform - 39.3% (0.0% banking clients); Underperform - 11.9% (0.0%
banking clients); Not Rated - 0.0% (0.0% banking clients). The numbers in parentheses represent the percentage of companies in each category to whom Bernstein provided investment
banking services within the last twelve (12) months.
OTHER DISCLOSURES
A price movement of a security which may be temporary will not necessarily trigger a recommendation change. Bernstein will advise as and when coverage of securities commences and ceases.
Bernstein has no policy or standard as to the frequency of any updates or changes to its coverage policies. Although the definition and application of these methods are based on generally
accepted industry practices and models, please note that there is a range of reasonable variations within these models. The application of models typically depends on forecasts of a range of
economic variables, which may include, but are not limited to, interest rates, exchange rates, earnings, cash flows and risk factors that are subject to uncertainty and also may change over time.
Any valuation is dependent upon the subjective opinion of the analysts carrying out this valuation.
Bernstein produces a number of different types of research product including, among others, fundamental analysis and quantitative analysis. Recommendations contained within one type of
research product may differ from recommendations contained within other types of research product, whether as a result of differing time horizons, methodologies or otherwise.
This document may not be passed on to any person in the United Kingdom (i) who is a retail client (ii) unless that person or entity qualifies as an authorised person or exempt person within the
meaning of section 19 of the UK Financial Services and Markets Act 2000 (the "Act"), or qualifies as a person to whom the financial promotion restriction imposed by the Act does not apply by
virtue of the Financial Services and Markets Act 2000 (Financial Promotion) Order 2005, or is a person classified as an "professional client" for the purposes of the Conduct of Business Rules of
the Financial Conduct Authority.
This document may not be passed onto any person in Canada unless that person qualifies as "permitted client" as defined in Section 1.1 of NI 31-103.
To our readers in the United States: Sanford C. Bernstein & Co., LLC is distributing this publication in the United States and accepts responsibility for its contents. Any U.S. person receiving this
publication and wishing to effect securities transactions in any security discussed herein should do so only through Sanford C. Bernstein & Co., LLC.
To our readers in the United Kingdom: This publication has been issued or approved for issue in the United Kingdom by Sanford C. Bernstein Limited, authorised and regulated by the Financial
Conduct Authority and located at 50 Berkeley Street, London W1J 8SB, +44 (0)20-7170-5000.
To our readers in member states of the EEA: This publication is being distributed in the EEA by Sanford C. Bernstein Limited, which is authorised and regulated in the United Kingdom by the
Financial Conduct Authority and holds a passport under the Markets in Financial Instruments Directive.
To our readers in Hong Kong: This publication is being distributed in Hong Kong by Sanford C. Bernstein (Hong Kong) Limited 盛博香港有限公司, which is licensed and regulated by the Hong
NORTH AMERICAN OIL & GAS EXPLORATION/PRODUCTION | 23
Kong Securities and Futures Commission (Central Entity No. AXC846). This publication is solely for professional investors only, as defined in the Securities and Futures Ordinance (Cap. 571).
To our readers in Singapore: This publication is being distributed in Singapore by Sanford C. Bernstein, a unit of AllianceBernstein (Singapore) Ltd., only to accredited investors or institutional
investors, as defined in the Securities and Futures Act (Chapter 289). Recipients in Singapore should contact AllianceBernstein (Singapore) Ltd. in respect of matters arising from, or in connection
with, this publication. AllianceBernstein (Singapore) Ltd. is a licensed entity under the Securities and Futures Act and registered with Company Registration No. 199703364C. It is regulated by the
Monetary Authority of Singapore and located at One Raffles Quay, #27-11 South Tower, Singapore 048583, +65-62304600. The business name "Bernstein" is registered under business
registration number 53193989L.
To our readers in the People’s Republic of China: The securities referred to in this document are not being offered or sold and may not be offered or sold, directly or indirectly, in the People's
Republic of China (for such purposes, not including the Hong Kong and Macau Special Administrative Regions or Taiwan), except as permitted by the securities laws of the People’s Republic of
China.
To our readers in Japan: This document is not delivered to you for marketing purposes, and any information provided herein should not be construed as a recommendation, solicitation or offer to
buy or sell any securities or related financial products.
For the institutional client readers in Japan who have been granted access to the Bernstein website by Daiwa Securities Group Inc. (“Daiwa”), your access to this document should not be
construed as meaning that Sanford C. Bernstein is providing you with investment advice for any purposes. Whilst Sanford C. Bernstein has prepared this document, your relationship is, and will
remain with, Daiwa, and Sanford C. Bernstein has neither any contractual relationship with you nor any obligations towards you.
To our readers in Australia: Sanford C. Bernstein & Co., LLC, Sanford C. Bernstein Limited and Sanford C. Bernstein (Hong Kong) Limited 盛博香港有限公司 are exempt from the requirement to
hold an Australian financial services licence under the Corporations Act 2001 in respect of the provision of the following financial services to wholesale clients:
• providing financial product advice;
• dealing in a financial product;
• making a market for a financial product; and
• providing a custodial or depository service.
To our readers in Canada: If this publication is pertaining to a Canadian domiciled company, it is being distributed in Canada by Sanford C. Bernstein (Canada) Limited, which is licensed and
regulated by the Investment Industry Regulatory Organization of Canada ("IIROC"). If the publication is pertaining to a non-Canadian domiciled company, it is being distributed by Sanford C.
Bernstein & Co., LLC, which is licensed and regulated by both the U.S. Securities and Exchange Commission and the Financial Industry Regulatory Authority ("FINRA") into Canada under the
International Dealers Exemption. This publication may not be passed onto any person in Canada unless that person qualifies as a "Permitted Client" as defined in Section 1.1 of NI 31-103.
Sanford C. Bernstein & Co., LLC., Sanford C. Bernstein Limited, Sanford C. Bernstein (Hong Kong) Limited 盛博香港有限公司, Sanford C. Bernstein (Canada) Limited and AllianceBernstein
(Singapore) Ltd. are regulated by, respectively, the Securities and Exchange Commission under U.S. laws, by the Financial Conduct Authority under U.K. laws, by the Hong Kong Securities and
Futures Commission under Hong Kong laws, by the Investment Industry Regulatory Organization of Canada and by the Monetary Authority of Singapore under Singapore laws, all of which differ
from Australian laws.
One or more of the officers, directors, or employees of Sanford C. Bernstein & Co., LLC, Sanford C. Bernstein Limited, Sanford C. Bernstein (Hong Kong) Limited 盛博香港有限公司, Sanford C.
Bernstein (Canada) Limited, Sanford C. Bernstein (business registration number 53193989L), a unit of AllianceBernstein (Singapore) Ltd. which is a licensed entity under the Securities and
Futures Act and registered with Company Registration No. 199703364C, and/or their affiliates may at any time hold, increase or decrease positions in securities of any company mentioned herein.
Bernstein or its affiliates may provide investment management or other services to the pension or profit sharing plans, or employees of any company mentioned herein, and may give advice to
others as to investments in such companies. These entities may effect transactions that are similar to or different from those recommended herein.
Bernstein Research Publications are disseminated to our customers through posting on the firm's password protected website, www.bernsteinresearch.com. Additionally, Bernstein Research
Publications are available through email, postal mail and commercial research portals. If you wish to alter your current distribution method, please contact your salesperson for details.
Bernstein and/or its affiliates do and seek to do business with companies covered in its research publications. As a result, investors should be aware that Bernstein and/or its affiliates may have a
conflict of interest that could affect the objectivity of this publication. Investors should consider this publication as only a single factor in making their investment decisions.
This publication has been published and distributed in accordance with Bernstein's policy for management of conflicts of interest in investment research, a copy of which is available from Sanford
NORTH AMERICAN OIL & GAS EXPLORATION/PRODUCTION | 24
C. Bernstein & Co., LLC, Director of Compliance, 1345 Avenue of the Americas, New York, N.Y. 10105, Sanford C. Bernstein Limited, Director of Compliance, 50 Berkeley Street, London W1J
8SB, United Kingdom, or Sanford C. Bernstein (Hong Kong) Limited 盛博香港有限公司, Director of Compliance, 39th Floor, One Island East, Taikoo Place, 18 Westlands Road, Quarry Bay, Hong
Kong, or Sanford C. Bernstein (business registration number 53193989L) , a unit of AllianceBernstein (Singapore) Ltd. which is a licensed entity under the Securities and Futures Act and
registered with Company Registration No. 199703364C, Director of Compliance, One Raffles Quay, #27-11 South Tower, Singapore 048583. Additional disclosures and information regarding
Bernstein's business are available on our website www.bernsteinresearch.com.
CERTIFICATIONS
• I/(we), Bob Brackett, Ph.D., Senior Analyst(s)/Analyst(s), certify that all of the views expressed in this publication accurately reflect my/(our) personal views about any and all of the subject
securities or issuers and that no part of my/(our) compensation was, is, or will be, directly or indirectly, related to the specific recommendations or views in this publication.
Copyright 2018, Sanford C. Bernstein & Co., LLC, Sanford C. Bernstein Limited, Sanford C. Bernstein (Hong Kong) Limited 盛博香港有限公司, and AllianceBernstein (Singapore) Ltd., subsidiaries of AllianceBernstein L.P. ~1345 Avenue of the Americas ~ NY, NY 10105 ~212/756-4400. All rights reserved.
This publication is not directed to, or intended for distribution to or use by, any person or entity who is a citizen or resident of, or located in any locality, state, country or other jurisdiction where
such distribution, publication, availability or use would be contrary to law or regulation or which would subject Bernstein or any of their subsidiaries or affiliates to any registration or licensing
requirement within such jurisdiction. This publication is based upon public sources we believe to be reliable, but no representation is made by us that the publication is accurate or complete. We do
not undertake to advise you of any change in the reported information or in the opinions herein. This publication was prepared and issued by Bernstein for distribution to eligible counterparties or
professional clients. This publication is not an offer to buy or sell any security, and it does not constitute investment, legal or tax advice. The investments referred to herein may not be suitable for
you. Investors must make their own investment decisions in consultation with their professional advisors in light of their specific circumstances. The value of investments may fluctuate, and
investments that are denominated in foreign currencies may fluctuate in value as a result of exposure to exchange rate movements. Information about past performance of an investment is not
necessarily a guide to, indicator of, or assurance of, future performance.