norsk gjenvinning group 1st quarter 2018
TRANSCRIPT
Norsk Gjenvinning Group 1st Quarter 2018
Erik Osmundsen, CEO and Dean Zuzic, CFO

Disclaimer
VV Holding AS is providing the following interim financial statements for Q1 2018 to holders of its NOK 2,235,000,000 Senior Secured Floating Rate Notes due 2019.
This report is for information purposes only and does not constitute an offer to sell or the solicitation of an offer to buy the notes or any other security.
This report includes forward-looking statements that are based on our current expectations and projections about future events. All statements other than statements of historical facts included in this notice, including statements regarding our future financial position, risks and uncertainties related to our business, strategy, capital expenditures, projected costs and our plans and objectives for future operations, including our plans for future costs savings and synergies may be deemed to be forward-looking statements.
Words such as “believe,” “expect,” “anticipate,” “may,” “assume,” “plan,” “intend,” “will,” “should,” “estimate,” “risk” and similar expressions or the negatives of these expressions are intended to identify forward-looking statements. By their nature, forward-looking statements involve known and unknown risks and uncertainties because they relate to events and depend on circumstances that may or may not occur in the future. Forward-looking statements are not guarantees of future performance.
You should not place undue reliance on these forward-looking statements. In addition, any forward-looking statements are made only as of the date of this notice, and we do not intend and do not assume any obligation to update any statements set forth in this notice.
2
Q1 2018
3
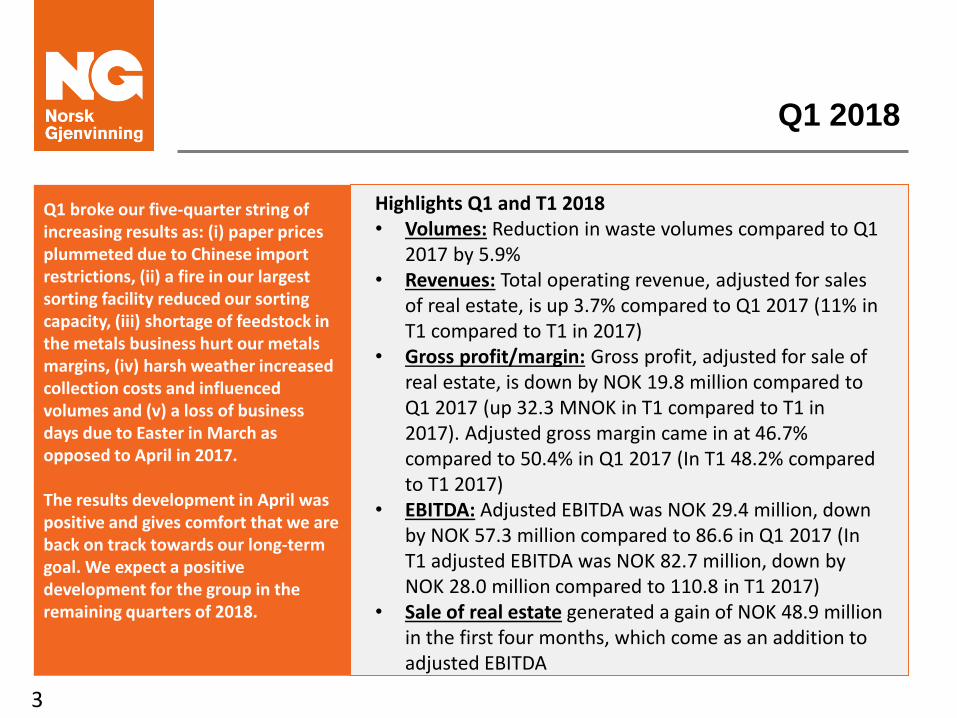
Highlights Q1 and T1 2018• Volumes: Reduction in waste volumes compared to Q1
2017 by 5.9%• Revenues: Total operating revenue, adjusted for sales
of real estate, is up 3.7% compared to Q1 2017 (11% in T1 compared to T1 in 2017)
• Gross profit/margin: Gross profit, adjusted for sale of real estate, is down by NOK 19.8 million compared to Q1 2017 (up 32.3 MNOK in T1 compared to T1 in 2017). Adjusted gross margin came in at 46.7% compared to 50.4% in Q1 2017 (In T1 48.2% compared to T1 2017)
• EBITDA: Adjusted EBITDA was NOK 29.4 million, down by NOK 57.3 million compared to 86.6 in Q1 2017 (In T1 adjusted EBITDA was NOK 82.7 million, down by NOK 28.0 million compared to 110.8 in T1 2017)
• Sale of real estate generated a gain of NOK 48.9 million in the first four months, which come as an addition to adjusted EBITDA
Q1 broke our five-quarter string of increasing results as: (i) paper prices plummeted due to Chinese import restrictions, (ii) a fire in our largest sorting facility reduced our sorting capacity, (iii) shortage of feedstock in the metals business hurt our metals margins, (iv) harsh weather increased collection costs and influenced volumes and (v) a loss of business days due to Easter in March as opposed to April in 2017.
The results development in April was positive and gives comfort that we are back on track towards our long-term goal. We expect a positive development for the group in the remaining quarters of 2018.

Operatingrevenue
ReportedEBITDA
Adjustments AdjustedEBITDA
Q1 2018MNOK
1 076
7929
49
EBITDA snapshot for Q1 and April 2018
990 87 0 87
Special items in Q1:
− Negative impact from Easter falling in Q1 in 2018 vs. Q2 in 2017 of NOK 12-14 million
− Fire at GMP plant influencing EBITDA negatively by NOK 6 million
4
Q1 2017MNOK
Operatingrevenue
ReportedEBITDA
Adjustments AdjustedEBITDA
April 2018MNOK
393
53 530
290 24 0 24April 2017MNOK
MNOK
1Q 2018
1Q 2017
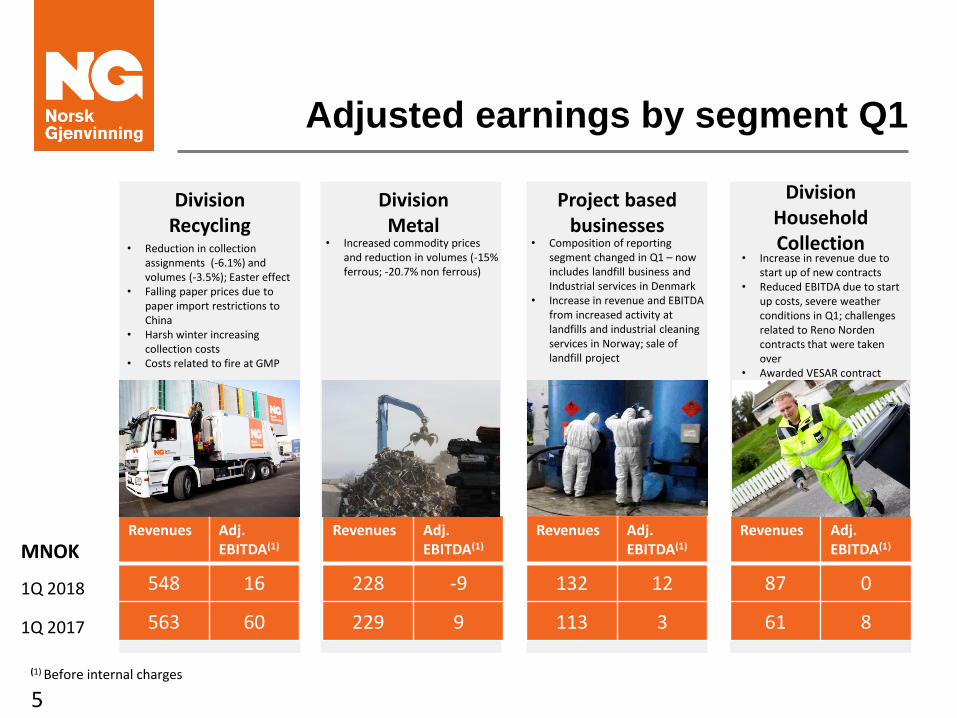
Adjusted earnings by segment Q1
Division Recycling
Division Metal
Project based businesses
Division Household Collection
Revenues Adj. EBITDA(1)
548 16
563 60
Revenues Adj. EBITDA(1)
228 -9
229 9
Revenues Adj. EBITDA(1)
132 12
113 3
Revenues Adj. EBITDA(1)
87 0
61 8
(1) Before internal charges
• Reduction in collection assignments (-6.1%) and volumes (-3.5%); Easter effect
• Falling paper prices due to paper import restrictions to China
• Harsh winter increasing collection costs
• Costs related to fire at GMP
• Composition of reporting segment changed in Q1 – now includes landfill business and Industrial services in Denmark
• Increase in revenue and EBITDA from increased activity at landfills and industrial cleaning services in Norway; sale of landfill project
• Increase in revenue due to start up of new contracts
• Reduced EBITDA due to start up costs, severe weather conditions in Q1; challenges related to Reno Nordencontracts that were taken over
• Awarded VESAR contract
5
• Increased commodity prices and reduction in volumes (-15% ferrous; -20.7% non ferrous)

NG response to market dev’l – fuels
Market development
Refuse Derived Fuel (RDF)• RDF markets remained stable with low inventory levels at incineration plants
throughout Q1. NG downstream costs increased slightly.
Woodchips• The woodchips markets have been stable in Q1• The cold winter has led to low inventory levels
6
NG response
Refuse Derived Fuel (RDF)• Focus on increased quality of finished products
and more efficient freight solutions to downstream customers
• Focus on Increasing sales of ancillary services• NG continued to increase upstream prices to
normalize gross margins
Woodchips• NG have benefited from low inventories compared
to last year• Focus on increased quality of finished products
and more efficient freight solutions to downstream customers
• Optimization of customer portfolio downstream to further strengthen gross margin
• Our inventories are at satisfactory levels and we have secured contracts for all inventory and next heat seasons’ production
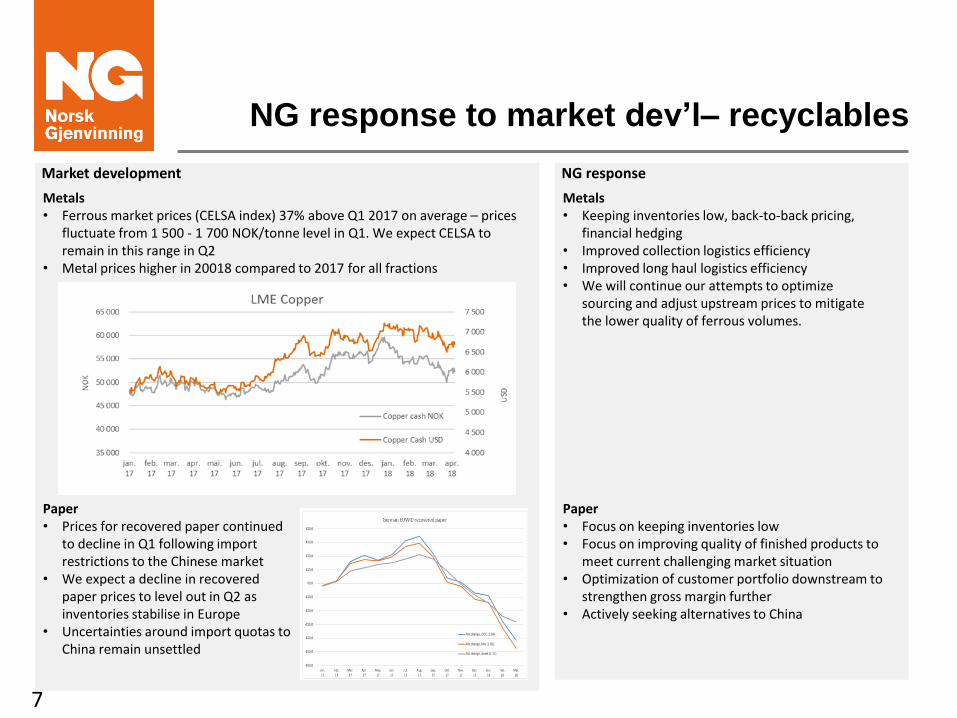
NG response to market dev’l– recyclables
Market development
Metals• Ferrous market prices (CELSA index) 37% above Q1 2017 on average – prices
fluctuate from 1 500 - 1 700 NOK/tonne level in Q1. We expect CELSA to remain in this range in Q2
• Metal prices higher in 20018 compared to 2017 for all fractions
Paper• Prices for recovered paper continued
to decline in Q1 following import restrictions to the Chinese market
• We expect a decline in recovered paper prices to level out in Q2 as inventories stabilise in Europe
• Uncertainties around import quotas to China remain unsettled
7
NG response
Metals• Keeping inventories low, back-to-back pricing,
financial hedging• Improved collection logistics efficiency • Improved long haul logistics efficiency • We will continue our attempts to optimize
sourcing and adjust upstream prices to mitigate the lower quality of ferrous volumes.
Paper• Focus on keeping inventories low • Focus on improving quality of finished products to
meet current challenging market situation• Optimization of customer portfolio downstream to
strengthen gross margin further• Actively seeking alternatives to China

Outlook for Q2 and 2018
Q2 2018 expected to be better than Q2 2017 due to:- Easter falling in Q2 in 2017- More stable to slightly increasing paper prices- Extra increase in volumes from waste that was not collected in Q1 due to harsh winter conditions
For the remainder of 2018 we expect an improvement in our bottom line as we will continue to see the effects of our lower fixed cost base and continuous improvement measures along the full value chain resulting from NG Flow
We are however reducing our previous EBITDA guidance as results in Q1 came in weaker than we had expected. For 2018 as a whole we expect:
− 7-9% increase in top line compared to 2017; most of the top line growth to come from Household Collection, Project businesses, other niche businesses and increased metal prices
− Expect gross margins to be 2-3% lower than in 2017− We expect normal RDF and woodchips inventories, and metals volumes− Costs in core operations (Recycling and Metals) expected to increase slightly due to cost creep;
Costs in other parts of the business expected to increase following increased activity− EBITDA in 2018 expected to be flat compared to 2017
• FY 2018 Maintenance Capex expectations of 120-130 MNOK
• Growth capex expectations of NOK 110 million due to investment needs in the Household Collection business
• Comfortable liquidity position
8

Financials P&L Q1 2018 (1)
(1) The interim financial information has not been subject to audit
INTERIM CONSOLIDATED STATEMENT OF PROFIT AND LOSS
9
(NOK’000) Q1 2018 Q1 2017
Revenue 1 014 859 984 490
Other income 60 763 5 270
Total operating income 1 075 622 989 760
Cost of goods sold 547 555 490 829
Employee benefits expense 250 473 234 779
Depreciation/amortization/impairment 57 567 55 458
Other operating expenses 201 533 175 479
Other (gains)/losses - net (2 786) 2 054
Operating profit 21 280 31 160
Finance income 8 513 811
Finance costs 45 342 61 439
Net income from associated companies 289 -
Profit / (loss) before income tax (15 259) (29 468)
Income tax expense (18 402) (5 887)
Profit / (loss) for the period from continuing
operations3 143 (23 581)
Profit / (loss) attributable to:
Owners of the parent 3 443 (25 113)
Non-controlling interests (300) 1 531

Balance sheet Q1 2018(1)
(1) The interim financial information has not been subject to audit
ASSETS
10
(NOK’000) March 31, 2018 December 31, 2017
Non-current assets
Property, plant & equipment 811 655 792 250
Intangible assets 90 910 96 775
Goodwill 1 235 986 1 235 986
Deferred tax assets 107 612 93 367
Investments in associated companies 21 964 21 360
Other receivables 42 619 44 242
Total non-current assets 2 310 746 2 283 980
Current assets
Inventories 92 705 112 716
Trade and other receivables 569 808 713 102
Other financial assets 1 620 -
Cash and cash equivalents 194 014 176 995
Assets held for sale 183 025 207 348
Total current assets 1 041 172 1 210 160
Total assets 3 351 918 3 494 140

Balance sheet Q1 2018(1)
(1) The interim financial information has not been subject to audit
EQUITY AND LIABILITIES
11
(NOK’000) March 31, 2018 December 31, 2017
Equity
Share capital and reserves attributable to owners of parent (1 225) 52 855
Non-controlling interest 12 298 21 527
Total equity 11 073 74 382
Non-current liabilities
Loans and borrowings 2 501 119 2 474 734
Other financial liabilities 2 294 9 318
Deferred income tax liabilities 23 865 24 926
Post-employment benefits 10 243 10 265
Provisions for other liabilities and charges 76 091 75 292
Total non-current liabilities 2 613 612 2 594 534
Current liabilities
Trade and other payables 624 334 695 180
Current income tax 6 884 15 651
Loans and borrowings 68 945 68 516
Other financial liabilities 3 205 16 015
Provisions for other liabilities and charges 23 865 29 862
Total current liabilities 727 232 825 224
Total liabilities 3 340 844 3 419 759
Total equity and liabilities 3 351 918 3 494 140

Consolidated cash flow statement Q1 2018(1)
(1) The interim financial information has not been subject to audit
INTERIM CONSOLIDATED STATEMENT OF CASH FLOW
12
(NOK’000) Q1 2018 Q1 2017
Profit / (Loss) before income tax (15 259) (29 468)
Adjustments for:
Income tax paid (7 750) (2 460)
Depreciation, amortization and impairment charges 57 567 55 458
Net (gain) loss on sale of non-current assets and business (57 320) (1 227)
Financial items without cash effect (13 069) 15 769
Items classified as investing- or financing activities 42 106 46 565
Changes in other short term items 64 909 (54 853)
Net cash flow from operating activities 71 184 29 784
Purchase of shares in subsidiaries and associates (300) (3 000)
Proceeds from sale of business 24 955 1 600
Payments for purchases of non-current assets (36 249) (23 795)
Proceeds from sale of non-current assets 74 444 1 509
Net other investments - (14 144)
Net cash flow from investing activities 62 850 (37 830)
Repayment of borrowings (330) (877)
Debt related expenses - (3 217)
Repayment of financial leasing liability (10 345) (6 920)
Dividends paid to non-controlling interest (4 635) (5 355)
Transactions with non-controlling interest (58 402) -
Interest paid (42 106) (45 065)
Net cash flow from financing activities (115 818) (61 434)
Net increase in cash and cash equivalents 18 216 (69 480)
Effect of exchange rate changes (1 197) 229
Cash and cash equivalents at beginning of period 176 995 167 724
Cash and cash equivalents at end of period 194 014 98 474
Events after reporting period
Real estate: Exercised put options – repayment of bonds totaling NOK 109
million in face value Agreement achieved with insurance company regarding fire at GMP
13

Other events
Real estate: Closing of sales leaseback transaction on 4 properties planned for
31. May - net proceeds of approx. NOK 635 million
Repayment of bond Net proceeds of approx. NOK 706 million from sale of real estate in
2018 to be used to repay bonds at par in June 2018
Refinancing Exploring available refinancing options for refinancing in H2 2018
14

Thank you!
Q&A