nordexgroup differentmarkets–similar...
TRANSCRIPT

Different Markets – Similar Trends?Different Markets – Similar Trends?
April 2018April 2018
Nordex GroupNordex Group

WHAT WE DO Core business & Products
VALUE CHAIN. More than a manufacturer
Project Development, Marketing, Financing
Wind Farm System Planning
Production and Technical Implementation
Wind Farm Operations
Services and Maintenance
Selection of location
Ownership
Optimal siting
Wind measurements
Soil survey
Sound / shade emission
Economic viability
Grid connection
Special purpose registration
Environmental permitting
Building permitting
Leading company in France
Active also in India
Review customer micro-site planning
Support customers(co-development) to receive approvals and to optimise park layouts
Assemble WTG
Produce selected components (blades, control systems)
Install onsite
Carry out initial operation
Offer additional services: increased demand due to new wind farm investors interested in stable cash flows
Provide high quality service to minimize downtime and maximize yield
CIVIL WORKS
ELECTRICAL INFRASTRUCTURE
INSTALLATION & COMMISSIONING
SERVICETURBINE DELIVERY
PROJECT DEVELOPMENT

1985 1995 1999 2000 2001 2003
2010 2013 2016
2000 2003 2005
2007 2008 2013 2014
Founding of Nordex in Denmark First company
worlwide to produce a MW-class turbine
Installation of the 100th Nordex turbine
First AW 60/1300prototype
Completion of the world´s first seriesmulti-MV turbine
Commencement of industrial rotor blade production
Installation of the 2000th Nordex turbine
Opening of the wind turbine assembly in Barásoain, Spain
Start of the seriesproduction of the AW 1500
Launch of Delta generation
Launch of Gamma generation
Opening of the first turbine facility in the Americas
Introduction of the AW 3000
Industrial implementation in Brazil with the opening of hub production plant
More than 2000 MW sold of the AW 3000 platform
Nordex and Acciona Windpowerbecome one company
WHO WE ARE We have come a long way
2016
Opening first assembly plant in India
2017
Launch of 4 MW platform Delta4000

WHERE WE ARE Track Record
CANADA 203 MW
USA 2,408 MW
MEXICO 989 MW
COSTA RICA 50 MW
COLOMBIA 20 MW
BRAZIL 783 MW
URUGUAY 309 MW
CHILE 105 MW
NORWAY 150 MW
SWEDEN 434 MW
FINLAND 399 MW
DENMARK 152 MW
BELGIUM 48 MW
NETHERLANDS 265 MW
ESTONIA 18 MW
LITHUANIA 70 MW
IRELAND 549 MW
GERMANY 3,594 MW
POLAND 454 MW
CZECH REPUBLIC 12 MW
ROMANIA 100 MW
BULGARIA 8 MW
SPAIN 1,898 MW
FRANCE 1,526 MW
PORTUGAL 408 MW
ITALY 710 MW
CROATIA 30 MW
GREECE 127 MW
UK 1,202MW
TURKEY 1,360MW
PAKISTAN 150 MW
INDIA 78 MW
CHINA 1,053 MW
JAPAN 73 MW
SOUTH KOREA 65 MW
AUSTRALIA 239 MW
EGYPT 63 MW
SOUTH AFRICA 452 MW
OTHERS 330 MW
NORDEX GROUP installed capacity:
more than 23,283 MW
MORE THAN 23 GW INSTALLED WORLDWIDE
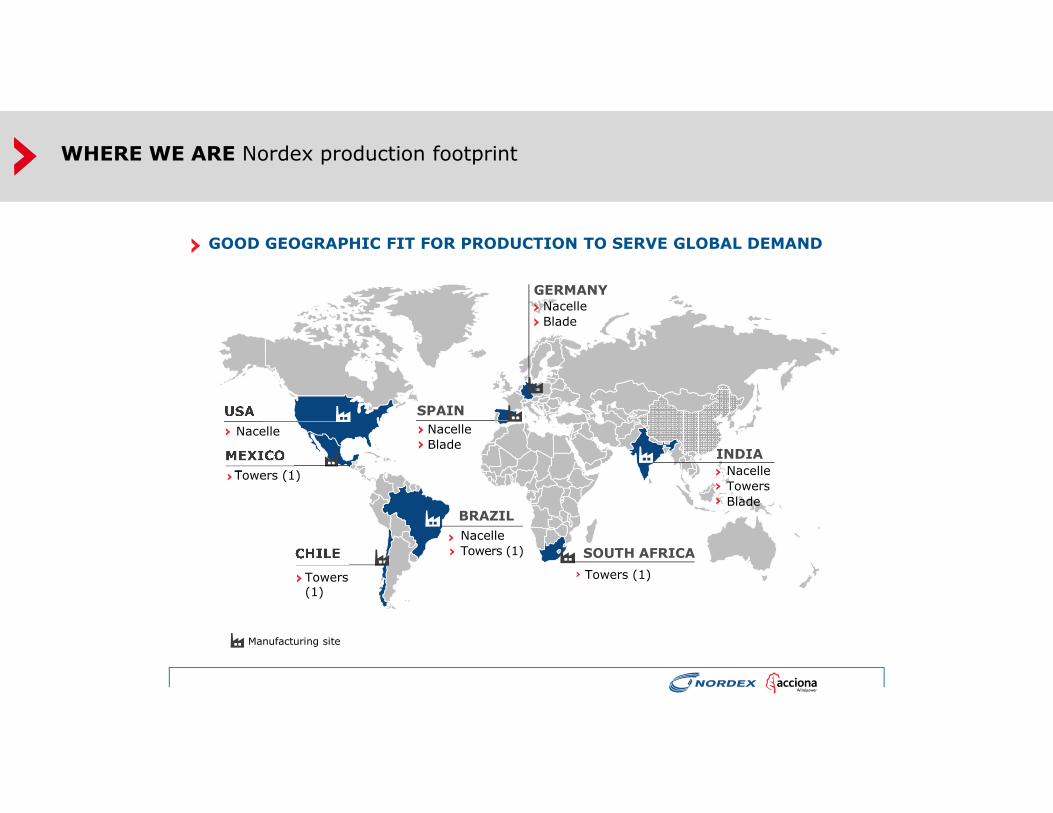
WHERE WE ARE Nordex production footprint
GOOD GEOGRAPHIC FIT FOR PRODUCTION TO SERVE GLOBAL DEMAND
Nacelle
INDIA
NacelleTowersBlade
BRAZIL
NacelleTowers (1)
SPAIN
NacelleBlade
GERMANYNacelleBlade
Manufacturing site
Towers (1)Towers (1)
Towers (1)
SOUTH AFRICA

JOINT PRODUCT STRATEGY. Utilize synergies while serving different market segments
COMPONENTS (E.G. TOWERS)
TOOLS CONTROLSSTANDARDS
SUPPLIERSTECHNOLOGY & DESIGN
Platform for land constrained markets
Platform for grid constrained markets
PRODUCT PORTFOLIO SYNERGIES
Create ONE GENERIC PRODUCT BASEin terms of toolbox for validation, similar controller base, combine corporate standards, etc.
Increase efficiency by JOINT FUTURE DEVELOPMENTSblades, controls, transport & installation equipment, etc.
WHAT WE DO Core business & products

Source: Bloomberg New Energy Finance. Note: Our global weighted benchmark represents a capacity-weighted average of all country level LCOE benchmarks; for onshore we weight last annual installations, for offshore we weight cumulative build.
0
50
100
150
200
250
3Q 4Q 1Q 2Q 3Q 4Q 1Q 2Q 3Q 4Q 1Q 2Q 3Q 4Q 1Q 2Q 1H 2H 1H 2H 1H 2H 1H 1H
2009 2010 2011 2012 2013 2014 2015 2016 '17 '18
$250/MWh
Offshore
Onshore
Global wind benchmark LCOE

Source: Bloomberg New Energy Finance. Note: Country data in charts show the levelized average winning bid in the auction. Data reflective of commissioning.
RenovAr Round 1 & 1.5
RenovAr Round 2
1st auction
2nd auction
3rd auction
8th capacity auction 20th energy
auction
25th energy auction 26th energy
auction
70MW wind energy tender
REP 1
0
20
40
60
80
100
2016 2017 2018 2019 2020 2021 2022 2023 2024 2025
$ real 2017/MWh
LCOE Range Argentina Mexico
Brazil El Salvador Canada
Levelized wind auction bids vs BNEF LCOE
Energy auction bids are often misinterpreted as being comparable to our current LCOEs. In order to be able to compare these winning bid
prices to our LCOEs we need to estimate what the average inflation-linked tariff would be over the full life of the project, and not just the
tariff duration. For more on the methodology behind this chart, see: 1H 2018 LCOE Update – Wind (web | terminal)
1h 2018 LCOE Americas / BNEF Auction Analysis

9
We mastered steep learning curves
2017
N149/4.5 T164
164m / 240m
17437 m2
19.760 MWh
3830 (44%)
Sample WTG
Hub / Tip height
Swept area
AEP*
Full load hours (NCF)
x8.5
N60/1300 T60
60m / 90m
2827 m2
2.350 MWh
1550 (18%)
1997
* vave =7 m/s @100m, k=2, a=0.25, ρ=1.225 kg/m3

Thanks foryour attention