nonlinear time series analysis of normal and pathological ... · nonlinear time series analysis of...
TRANSCRIPT
CHAOS VOLUME 10, NUMBER 4 DECEMBER 2000
Nonlinear time series analysis of normal and pathological human walkingJonathan B. Dingwella)
Sensory Motor Performance Program, Rehabilitation Institute of Chicago, 345 E. Superior Street,Chicago, Illinois 60611
Joseph P. CusumanoDepartment of Engineering Science and Mechanics, Penn State University, 131 Hammond Building,University Park, Pennsylvania 16802
~Received 2 December 1999; accepted for publication 19 September 2000!
Characterizing locomotor dynamics is essential for understanding the neuromuscular control oflocomotion. In particular, quantifying dynamic stability during walking is important for assessingpeople who have a greater risk of falling. However, traditional biomechanical methods of definingstability have not quantified the resistance of the neuromuscular system to perturbations, suggestingthat more precise definitions are required. For the present study, average maximumfinite-timeLyapunov exponents were estimated to quantify the local dynamic stability of human walkingkinematics. Local scaling exponents, defined as the local slopes of the correlation sum curves, werealso calculated to quantify the local scaling structure of each embedded time series. Comparisonswere made between overground and motorized treadmill walking in young healthy subjects andbetween diabetic neuropathic~NP! patients and healthy controls~CO! during overground walking.A modification of the method of surrogate data was developed to examine the stochastic nature ofthe fluctuations overlying the nominally periodic patterns in these data sets. Results demonstratedthat having subjects walk on a motorized treadmill artificially stabilized their natural locomotorkinematics by small but statistically significant amounts. Furthermore, a paradox previously presentin the biomechanical literature that resulted from mistakenly equating variability with dynamicstability was resolved. By slowing their self-selected walking speeds, NP patients adopted morelocally stable gait patterns, even though they simultaneously exhibited greater kinematic variabilitythan CO subjects. Additionally, the loss of peripheral sensation in NP patients was associated withstatistically significant differences in the local scaling structure of their walking kinematics at thoselength scales where it was anticipated that sensory feedback would play the greatest role. Lastly,stride-to-stride fluctuations in the walking patterns of all three subject groups were clearlydistinguishable from linearly autocorrelated Gaussian noise. As a collateral benefit of themethodological approach taken in this study, some of the first steps at characterizing the underlyingstructure of human locomotor dynamics have been taken. Implications for understanding theneuromuscular control of locomotion are discussed. ©2000 American Institute of Physics.@S1054-1500~00!00804-1#
fe
ema
Falls and their resulting injuries have a significant im-pact on the rates of morbidity and mortality among olderadults as well as on health care costs. As many as 23% ofalls among community dwelling elderly persons result inserious injury1 and more than half of these falls resultfrom trips that occur during locomotion. 2 Therefore,quantifying dynamic stability during walking is very im-portant for assessing people who may be at greater riskof falling. A number of biomechanical indices have beenproposed to define locomotor ‘‘stability,’’ all of whichrely on quantifying some measure of variability in loco-motor patterns.3–6 However, these methods do not relatethe notion of stability to the resistance of the neuromus-cular system to perturbations, suggesting that more pre-cise definitions of dynamic locomotor stability are re-quired. Analytical models of locomotor patterns based onsystems of coupled nonlinear oscillators7–12 and simula-
a!Author to whom correspondence should be addressed; [email protected]
8481054-1500/2000/10(4)/848/16/$17.00
Downloaded 04 Dec 2000 to 165.124.30.127. Redistribution subject to
tions of passive dynamic walking machines exhibitingchaotic behavior13,14suggest that nonlinear analysis tech-niques may provide insights into the neuromuscular pro-cesses that govern locomotion. However, few efforts havbeen made to apply experimental techniques from non-linear dynamics to locomotion. While some authors haveused Floquet multipliers to quantify locomotorstability,15,16this method assumes purely periodic motion.Methods for estimating maximum finite-time Lyapunovexponents from experimental data17,18 provide a promis-ing means of directly quantifying local dynamic stabilityduring locomotion. The present research computed maxi-mum finite-time Lyapunov exponents from human walk-ing kinematics to examine how the locomotor control sys-tem adapts to walking on a motorized treadmill and todegradation of peripheral sensory feedback. The presentanalyses demonstrate that the concepts of variability andstability must be carefully distinguished in studies of hu-man locomotion and, more generally, that dynamical sys-tems approaches can be used to precisely characterizlocal dynamic stability in such studies.il:
© 2000 American Institute of Physics
AIP copyright, see http://ojps.aip.org/chaos/chocpyrts.html.
in
a
ml’’eclen
eny-rnwn
uefolal
enave
-tdide
path
llyverly
eoaegth
gceaint
srogll
biex
isin-o-hehyab-
r.re-bil-sedseag-
ere-re-cali-curseofat-
eic
iner-,
Thendmicex-
tlyentno
tureticutter-c-thatimb
n-gctsesgi-
/rre-
ticctive
a-ightasticy.ter-ner-
849Chaos, Vol. 10, No. 4, 2000 Normal and pathological human walking
I. INTRODUCTION
Traditional methods of describing human locomotionvolve collecting gait data for a number~typically 5 to 10! ofindependent and isolated strides, time-normalizing the dfrom each stride to a standard length~100%!, and then aver-aging the data across strides. This approach seeks to exathe nature of gait patterns exhibited during a ‘‘typicastride, and how such patterns differ between healthy subjand patients with various locomotor pathologies. Variabexamined in this manner may include kinematics, groureaction forces, muscle activation patterns, and/or momand powers at individual joints computed from inverse dnamics~e.g., Ref. 3!. While this approach has allowed researchers to address many important clinical questionslated to locomotor disorders, it ignores the inheredynamical nature of locomotion. Any information about hothe neuromuscular system controls locomotion from ostride to the next is lost in this approach. The techniqused to analyze nonlinear dynamical systems may thereprovide unique insight into these ongoing neuromuscucontrol processes, particularly as they relate to the controdynamic stability during continuous walking.
Time-series analysis methods typically require large sof data collected continuously over many cycles of motioThe most convenient means of collecting such data is to hsubjects walk on a motorized treadmill. However, while seeral studies have reported biomechanical differences betwoverground and treadmill walking,19–21 other studies havereported minimal or no differences.22–24 In particular, walk-ing on a motorized treadmill appears to reduce the stridestride variability of locomotion compared to overgrounwalking.19,25,26Most of these previous studies, however, dnot examine the continuous nature of walking, but focusmerely on differences between single averaged strideterns. The first objective of the present study was to testhypothesis that walking on a motorized treadmill artificiastabilizes natural walking patterns compared to walking olevel ground by driving the locomotor system at a neaconstant externally enforced speed.
Peripheral neuropathy is a secondary consequencdiabetes mellitus that results in a gradual dying backnerves from the fingers and toes to more proximregions.27,28 Neuropathic patients are as much as 15 timmore likely to report an injury during standing or walkinand have a greater risk of repetitive falls than healsubjects,29,30 independent of other co-morbidities.31 How-ever, standard biomechanical comparisons of averasingle-stride gait characteristics have shown few differenbetween the locomotion patterns of neuropathic patientsmatched controls beyond a reduction in self-selected walkspeed.32–34 These slower walking speeds have led somesuggest that these patients may be adopting a ‘‘more convative’’ locomotor control strategy.33 However, these slowespeeds are also associated with increased locomvariability.25,34 This suggests that slowing one’s walkinspeed should increase one’s risk of falling if, as traditionaassumed, greater variability were indicative of loss of staity. However, the fact that young healthy subjects also
Downloaded 04 Dec 2000 to 165.124.30.127. Redistribution subject to
-
ta
ine
tssdts-
e-t
esrer
of
ts.ve-en
o-
dt-e
r
offls
y
eds
ndgoer-
tor
yl--
hibit increased variability during slow walking,35,36 in a con-text where stability is clearly not an issue, calls thassumption into question. If increased variability weredicative of loss of stability, then slowing down, as a locomtor control strategy, would be completely antithetical to tgoal of maintaining stability. Thus, it remains unclear wneuropathic patients choose to walk more slowly in thesence of any obvious physiological impairments~e.g., loss ofstrength, etc.! that would prevent them from walking faste
The principal reason for such apparently paradoxicalsults arises from the fact that statistical measures of variaity do not address the nature or the source of the increainstability that leads to the increased risk of falling in thepatients. Standard deviations only quantify the average mnitude of the variations that occur between strides, and thfore cannot quantify how the locomotor control systemsponds to perturbations. In the present context, ‘‘lostability’’ refers to the sensitivity of a system to infinitesmally small perturbations. The natural variations that ocfrom stride to stride during locomotion reflect precisely thetypes of perturbations and it is presumably the effectssuch perturbations that measures of gait variability aretempting~unsuccessfully! to quantify. The second objectivof this study was therefore to compare the local dynamstability of continuous overground walking kinematicsdiabetic patients with severe neuropathy to those of gendage-, height-, and weight-matched nondiabetic controls.relative contributions of the loss of peripheral sensation achanges in self-selected walking speeds to the local dynastability of walking patterns in these subjects were alsoamined.
Traditional methods of describing human gait inherenassume that stride-to-stride variations in these movempatterns arise solely from noise in the system. However,efforts have been made to fully characterize the exact naof this noise or to locate it along the deterministic/stochascontinuum. Thus, potentially important information abothe precise nature of the stochasticity or any possible deministic influences that might be contributing to these flutuations is essentially ignored. It has been hypothesizedsensory feedback plays a role in adjusting step-to-step ltrajectories to maintain balance during locomotion,37 and/orin smoothing unintended irregularities that occur during uperturbed movements.38 Therefore, the fluctuations overlyinthe nominal cyclic movements in human walking may reflevaluable information about the neuromuscular procescontributing to the generation of both normal and patholocal locomotor patterns.
Stride interval data from human walking exhibit 1fnoise.39–41 It has been suggested that these long range colations in walking are the result of complex determinisprocesses in the central nervous system that play an arole in regulating locomotor dynamics.39,40 However, ana-lytical models of a similar rhythmic sensory motor coordintion task demonstrate that such correlation structures malso arise as a natural byproduct of the presence of stochnoise and sensory feedback delays in neural circuitr42
Since 1/f noise can be modeled by a number of either deministic or stochastic processes and since there is no ge
AIP copyright, see http://ojps.aip.org/chaos/chocpyrts.html.
shiiz
nsteco
ge
rag
euan
er
nonre
asatknhesut-d
edofmw
re
cd-b
he
aledanveteonti-
yeu
of-
edp-
lf-ereed
eeedndcts,
ataingated its
v-
aumes
-
suc-en
se
xial
t leg
850 Chaos, Vol. 10, No. 4, 2000 J. B. Dingwell and J. P. Cusumano
ally accepted interpretation of such findings,42,43 the under-lying source of the 1/f noise observed in locomotor patternremains speculative. Therefore, the third objective of tstudy was to use appropriately generated phase-randomsurrogate data44 to test the hypothesis that the fluctuatioexhibited in continuous walking kinematics can be generaby a specific class of stochastic processes: linearly autorelated Gaussian noise.
II. DATA COLLECTION
For the overground/treadmill~OG/TM! comparisons, 10young healthy subjects~5 males and 5 females; mean a527.1063.25 yrs, height51.7160.09 m, and weight564.85612.47 kg! participated. For the neuropathic/control~NP/CO! study, 14 diabetic patients with significant peripheneuropathy~NP Group; 12 males and 2 females, mean a561.066.6, height51.7760.07 m, weight595.2614.1 kg!,and 12 healthy controls with no history of diabetes or nropathic illness~CO Group; 10 males and 2 females, meage557.667.7, height51.7660.08 m, weight591.169.8kg! participated. Subjects in the NP and CO groups wmatched on marginal distributions~i.e., approximately thesame mean and variance within each group! according togender, age, height, and weight.34
Each subject was required to pass an extensive screeexam to ensure that no subject had a history of medicatiillnesses~other than peripheral neuropathy, where appropate!, surgeries, or other injuries that may have affected thwalking patterns. Physical exam included quantifying psive ranges of motion~ROM! at the knee, ankle, and gretoe and an assessment of lower extremity strength at theand ankle. NP and CO subjects were also tested for tlevel of peripheral sensation using a standard touch/pressensation~TPS! testing protocol at four locations on the botoms of both feet: the hallux, first and fifth metatarsal hea~MTH-1 and MTH-5!, and the heel. The TPS test determinthe minimum detectable response to first-order bendingseries of wirelike nylon monofilaments of increasing diaeter. Each monofilament was calibrated to produce a knoapplied force~range: 0.04 to 300 N! on the bottom of thefoot under first-order bending. Detailed descriptions andsults of these tests are reported elsewhere.26,34
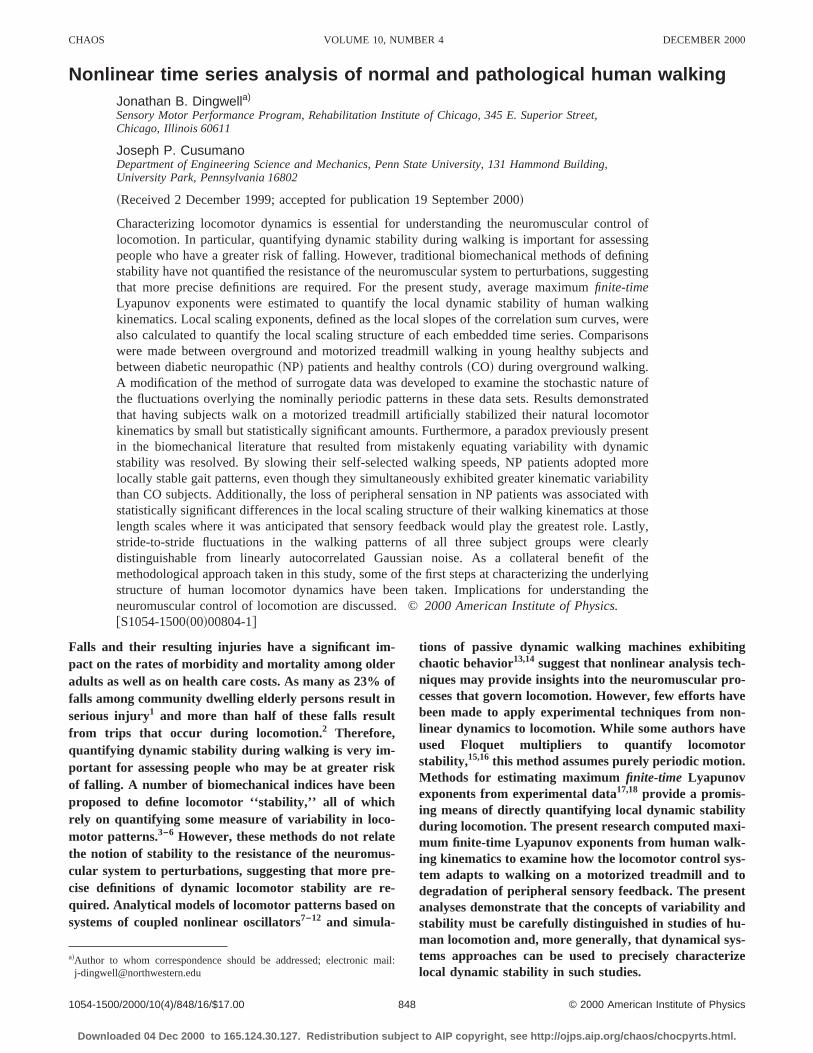
A portable ‘‘data-logger’’ was built to collect kinematidata during continuous walking. The data-logger consistea programmable microprocessor and an 8-channel 12A/D converter interfaced to a 15-Mb Flash RAM card. Tdata-logger was attached to a lightweight harness (,2.5 kgtotal weight! that did not interfere with the subject’s normwalking ~Fig. 1!. Three electrogoniometers were placacross the approximate joint centers of the hip, knee,ankle joints of the right leg to measure sagittal plane moments of these joints. A triaxial accelerometer was mounat the base of the sternum to measure upper body motiThe ‘‘Y’’-accelerometer was oriented approximately vercally, with the ‘‘X’’ and ‘‘Z’’ accelerometers approximatelyhorizontal~anterior-posterior and mediolateral, respectivel!.The baseline electrical noise generated by each of thtransducers was between 0.76 and 1.11 mV root mean sq
Downloaded 04 Dec 2000 to 165.124.30.127. Redistribution subject to
sed
dr-
le
-
e
ings,i-ir-
eeirre
s
a-n
-
ofit
d-ds.
seare
~rms!, which was on the order of the minimum resolutionthe A/D converter (61 mV!. The data-logger was programmed to collect data for 10 min at 66.7 Hz~40 000samples!.
During overground walking trials, each subject walkaround a roughly rectangular level indoor walking track aproximately 7 m wide and 200 m long at his/her own seselected comfortable speed. Average walking speeds wcalculated by directly measuring the total distance walkand dividing by 10 min. For treadmill walking trials, thspeed of the treadmill was set to the average walking spcalculated from the overground trial for each subject adata collection was repeated. For the NP and CO subjedata were collected only during overground walking.
III. NONLINEAR ANALYSES
A. State space reconstruction
State space reconstructions of the raw kinematic dwere performed based on standard embeddtechniques.45–47 For each time series, an appropriate stspace was reconstructed from the original time series antime delayed copies,
X~ t !5@x~ t !,x~ t1T!, . . . ,x~ t1~dE21!T!#, ~1!
where X(t) is the dE-dimensional state vector,x(t) is theoriginal one-dimensional data,T is the time delay, anddE isthe embedding dimension. Time delays (T) for the recon-structions were calculated from the first minimum of the aerage mutual information~AMI ! function,48 which evaluatesthe amount of information~in bits! shared between two datsets over a range of time delays. Choosing the first minimof the AMI function provides adjacent delay coordinatwith a minimum of redundancy.
Embedding dimensions (dE) were computed from a global false nearest neighbors~GFNN! analysis,49 which com-pares the distances between neighboring trajectories atcessively higher dimensions. ‘‘False neighbors’’ occur whtrajectories that overlap in dimensiondi are distinguished indimensiondi 11 . As i increases, the total percentage of fal
FIG. 1. Setup of data-logger data collection instrumentation. The triaaccelerometer quantified three-dimensional~3D! movements of the upperbody. Electrogoniometers measured movements of the joints of the righin the sagittal plane~i.e., in the plane of forward progression!.
AIP copyright, see http://ojps.aip.org/chaos/chocpyrts.html.
elu
ee
t
od
tsrre
tge
si
de
n
h
d-iogerolgostfto
in
e
cs
o-
stan-
five
ints
851Chaos, Vol. 10, No. 4, 2000 Normal and pathological human walking
neighbors declines anddE is chosen where this percentagapproaches zero. GFNN analysis was performed using vaof Rtol517 andAtol52 as recommended in Ref. 49.
B. Stationarity
The stationarity of all walking patterns was establishby evaluating recurrence plots50–52 of each embedded timseries. Recurrence plots were generated by calculatingEuclidean distances (d i , j ) between all pairs of pointsX( i )andX( j ) in the embedded state space and then plotting thpoints in the (i , j ) plane whered i , j was less than a specifieradius,r,
d i , j5iX~ i !2X~ j !i,r . ~2!
Since i and j are points in time, the recurrence ploconvey natural and subtle information about temporal colations in the original time series.51,52Nonstationarities in thetime series are manifested as gross inhomogeneities inrecurrence plot. All recurrence plots were generated usinradius value ofr 55% of the total data set size for each timseries.
C. Local scaling structure
The correlation sum,C(r ,N), quantifies the way inwhich the density of points in state space scales with theof the volume containing those points.18,53–55Thus,C(r ,N)provides insight into the geometric structure of an embedtime series. In the present study,C(r ,N) was computedfrom17,18,55
C~r ,N!51
~N2n!~N2n21!
3(i 51
N
(j 511n
N
H~r 2iX~ i !2X~ j !i !, ~3!
where r was the radius of the volume of points being cosidered,H was the Heaviside step function,N was the totalnumber of samples in the time series, andn was chosen to bethe average stride time for each subject~typically 70-80samples!. Using this formulation, neighboring points whicwhere correlated in time~i.e., u i 2 j u,n) were omitted fromthe calculation to ensure thatC(r ,N) captured onlygeomet-ric correlations in each of the embedded time series.18,54,55
The computation ofC(r ,N) is susceptible to noise annonstationarities,18,54,56both of which are common in physiological data.55 To address these concerns, instrumentatnoise was minimized by careful design of the data-logand the stationarity of each time series was established fthe recurrence plot analysis. Furthermore, the GFNN arithm ensured that each time series was embedded in aspace with a sufficiently largedE to guarantee saturation oC(r ,N). Finally, each 10-min time series was divided infive intervals of 2 min each (N58000 samples'100strides!. This allowed for the evaluation of the varianceeach estimatedC(r ,N) curve, while retaining a sufficientlylargeN to ensure accurate computation.55
The scale-invariant ‘‘self-similarity’’ that is one of thhallmarks of low-dimensional deterministic ‘‘chaos’’18,53–55
Downloaded 04 Dec 2000 to 165.124.30.127. Redistribution subject to
es
d
he
se
-
hea
ze
d
-
nrm-
ate
results in a linear variation of log@C(r,N)# with respect tolog@r# as r→0. In cases where such self-similar dynamiexists, the correlationdimension, D2 , is defined as
D25 limN→`
limr→0
log@C~r ,N!#
log@r #. ~4!
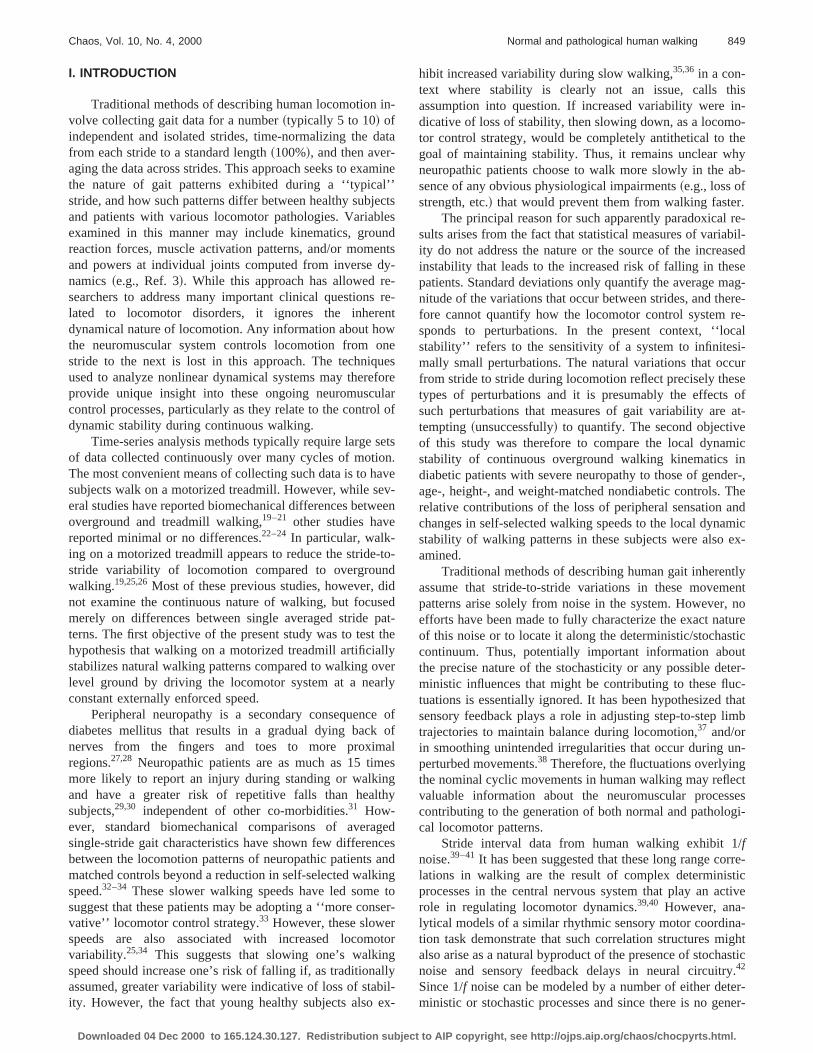
The linearity of the relationship between log@C(r,N)# andlog@r# can be determined by computing local slopes, or ‘‘lcal scaling exponents’’~LSE!18,55 directly from plots oflog@C(r,N)# vs log@r# ~Fig. 2!. In the present study, LSEwere computed for each embedded time series using a sdard three-point difference formula,
LSE( i )5log@C~r ,N!# ( i 21)2 log@C~r ,N!# ( i 11)
2•D log@r #. ~5!
FIG. 2. Correlation sums and local scaling exponents~LSE! for the Ay~vertical! acceleration~A! and knee joint angle~B! time series taken from atypical subject. Five curves are shown in each plot: one for each of the2-min intervals of data analyzed. An embedding dimension ofdE55 wasused for all calculations. Vertical gridlines on the LSE plots denote poalong log@r# where statistical comparisons were made.
AIP copyright, see http://ojps.aip.org/chaos/chocpyrts.html.
ibim
tisalei
o.
nec
pp
ue
aith
-
ticu-ave
aeds
GA
enu
lly-ater
re
e
tic
th
ra-
po-isnted
ll
tateged
to
y,seing
tiple-
NP
ach
Psorys in
ur-tor,gthe, a-/orifelf-
onup
852 Chaos, Vol. 10, No. 4, 2000 J. B. Dingwell and J. P. Cusumano
Correlation sums from biological data sets rarely exhthe strictly linear behavior that is required to make an unabiguous determination ofD2 .18,55,57The data sets from thepresent study were no exception~Fig. 2!. Nevertheless, evenin these cases, the LSEs themselves still provide a quantive description of the geometric scaling behavior of theembedded time series across a wide range of length scFigure 2 shows that these data sets in fact exhibit differscaling behaviors across different scaling rangeslog@r#.18,55,57 For very larger values,~approximately log@r#>20.6 in Fig. 2!, the calculation ofC(r ,N) is dominated bythe finite length of the data set55 and the LSEs approach zerFor the knee data of Fig. 2~b!, there is a second region~ap-proximately 22.4< log@r#<20.6) where the LSEs remairelatively constant with a value of approximately 1, corrsponding to the nominal one-dimensional limit cycle struture. This phenomenon was much less prevalent in the ubody acceleration data [email protected]., Fig. 2~a!#, although somestructure in these curves was still visible. For smaller valof r ~approximately log@r#<21.8), data points begin tomove off of the limit cycle and spread apart across the avable state space.18 This process ends at the smallest lengscales~approximately log@r#<23.6), where the LSEs approach the value of the embedding dimension (dE55), in-dicating where the noise regime lies.18,55
Similar LSE curves were generated for all six kinemavariables to determine if treadmill walking or diabetic neropathy produced significant changes in local scaling behior. To test for statistical differences in local scaling behaior, individual LSE values were extracted from these curvat several locations along log@r#. Five LSE estimates wereobtained at each value of log@r# for each subject for each datset: one LSE for each of the five 2-min intervals examinThese LSE values were then used as repeated measureseries of multifactor analyses of variance~ANOVA ! for ran-domized block design58 to test for differences between Oand TM walking and between NP and CO subjects. ANOVresults were adjusted using a Bonferroni correction58 to ac-count for the ‘‘compounded uncertainty’’ that arises whmaking multiple comparisons within the same data set. Tha value ofa50.05/k was chosen to delineate statisticasignificant differences, wherek was the number of comparisons made across each set of LSE curves. For accelervariables, ANOVA’s were performed at evenly spaced intvals ofD log@r#50.6 from log@r#523.6 to log@r#520.6 ~i.e.,k56; a50.008). LSEs for lower extremity time series wetested at evenly spaced intervals ofD log@r#50.6 fromlog@r#524.8 to log@r#520.6 ~i.e., k58; a50.006). Thesepoints of comparison are indicated by the vertical grid linshown in Fig. 2.
D. Finite-time Lyapunov exponents
Lyapunov exponents quantify the average exponenrate of divergence of neighboring trajectories in state spaand thus provide a direct measure of the sensitivity ofsystem to infinitesimal~i.e., ‘‘local’’ ! perturbations.17,18 Themaximum Lyapunov exponent (l1) for a dynamical systemcan be determined from
Downloaded 04 Dec 2000 to 165.124.30.127. Redistribution subject to
t-
ta-ees.ntn
--er
s
l-
v--s
.in a
s,
ion-
s
ale,e
d~ t !5doel1t, ~6!
whered(t) is the mean divergence between neighboring tjectories in state space at timet anddo is the initial separa-tion between neighboring points.17 Finite-time exponents(l* ) are distinguished from true Lyapunov exponents (l1),which are strictly defined only in the dual limit ast→` anddo→0 in Eq. ~6!.
A previously published algorithm17 was used to provideestimates of average maximum finite-time Lyapunov exnents (l* ) for each time series examined. This algorithmrobust to changes inT, dE , data set size, and measuremenoise. Therefore, each 10-min time series was first dividinto five intervals of 2 min each (N58000 samples'100strides! to allow for the calculation of within-subject as weas between-subject variances in thel* estimates. Taking thelog of both sides of Eq.~6!, l* was defined by
ln@dj~ i !#'l* ~ iDt !1 ln@do j#, ~7!
wheredj ( i ) was the Euclidean distance between thejth pairof nearest neighbors afteri discrete time steps~i.e., iDt s!.17
Euclidean distances between neighboring trajectories in sspace were calculated as a function of time and averaover all original pairs of nearest neighbors. Thel* expo-nents were then estimated from the slopes of linear fitscurves defined by17
y~ i !51
Dt^ ln@dj~ i !#&, ~8!
where^•& denotes the average over all values ofj. Since theintrinsic time scales were different for each subject~i.e., eachsubject had a different average stride time!, these curveswere rescaled in time to the average stride number~i.e., num-ber of attractor orbits! for each subject. For the present studthe l* were estimated from best-fit linear slopes of thelocal divergence curves over scaling regions correspondto the time between four and ten strides~see Figs. 7 and 13!.
The five estimates of eachl* calculated for each subjecwere taken as repeated measures in a series of multfactor ANOVAs for a randomized block design58 to test fordifferences between OG and TM walking and betweenand CO subjects. A significance level ofa50.05 was chosento delineate statistically significant differences between epair of test groups.
While differences in local dynamic stability between Nand CO subjects may have been due to differences in senstatus, they might also have been due to group differencewalking speed, ROM, and/or lower extremity strength. Fthermore, walking speed is not an independent predicsince intrinsic differences in sensation, ROM, and/or strenmay also affect self-selected walking speeds. Thereformultivariate regression analysis58–60was performed to determine if intrinsic differences in sensory status, ROM, andstrength directly influenced local dynamic stability, orthese effects were in fact mediated by changes in sselected walking speeds. This procedure was performedall l* variables where statistically significant between-grodifferences were indicated by the ANOVA.
AIP copyright, see http://ojps.aip.org/chaos/chocpyrts.html.
tiauerg
ane,
thlk
onuls
atatcth-p
alerus,tuedfin
innguo
atesnull
ednalomdsur-ith
edinal
esenotitsere
dis-nullhtise.n-the
a-
asary
glegi-
un
ized
853Chaos, Vol. 10, No. 4, 2000 Normal and pathological human walking
E. Surrogate data
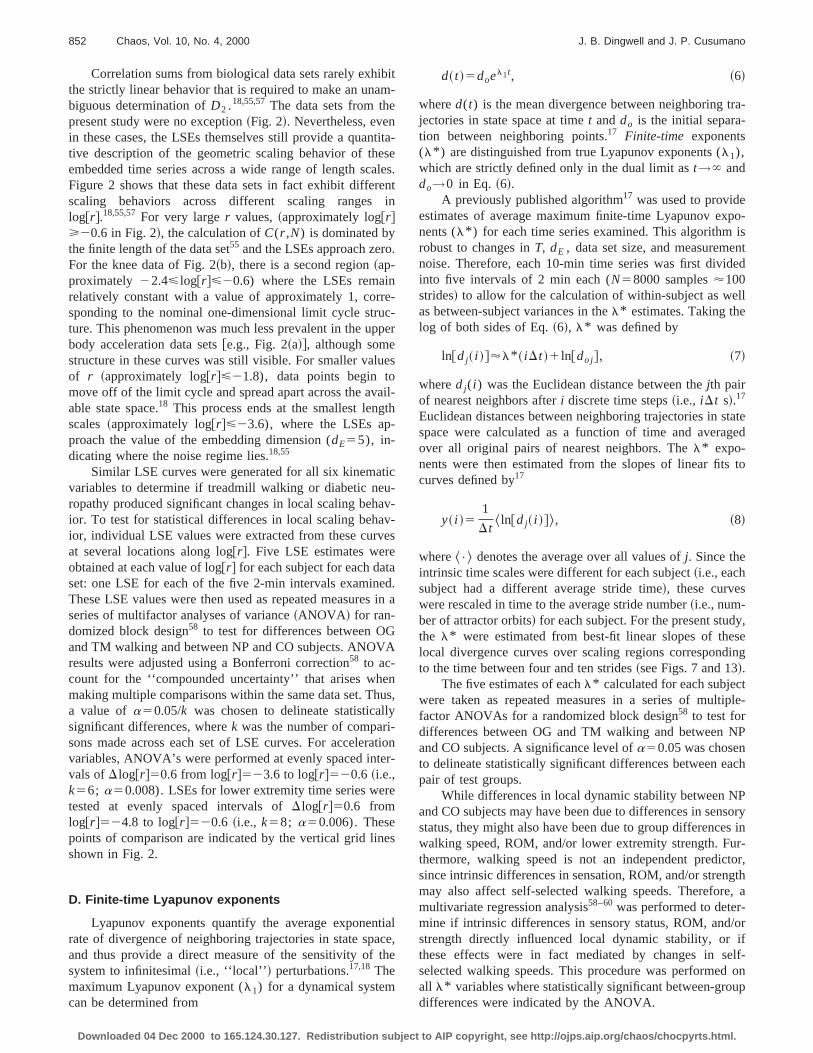
Human locomotion is strongly~but not exactly! periodic.Locomotor kinematics exhibits both temporal and spavariations within and across strides. These naturally occring variations generate movements that are nominally podic, while adding a noiselike complexity to the underlyinperiodic structures in the embedded state spaces~Fig. 3!. Theexact nature of these fluctuations is presently unknownwas the focus of interest in the present study. Thereformodification of the method of surrogate data44 was devel-oped to examine the nature of the fluctuations overlyingnominally periodic movement patterns in these human waing data. The null hypothesis was tested that the variatiabout the mean walking patterns in the original data cohave been generated by a linearly autocorrelated Gausprocess.44
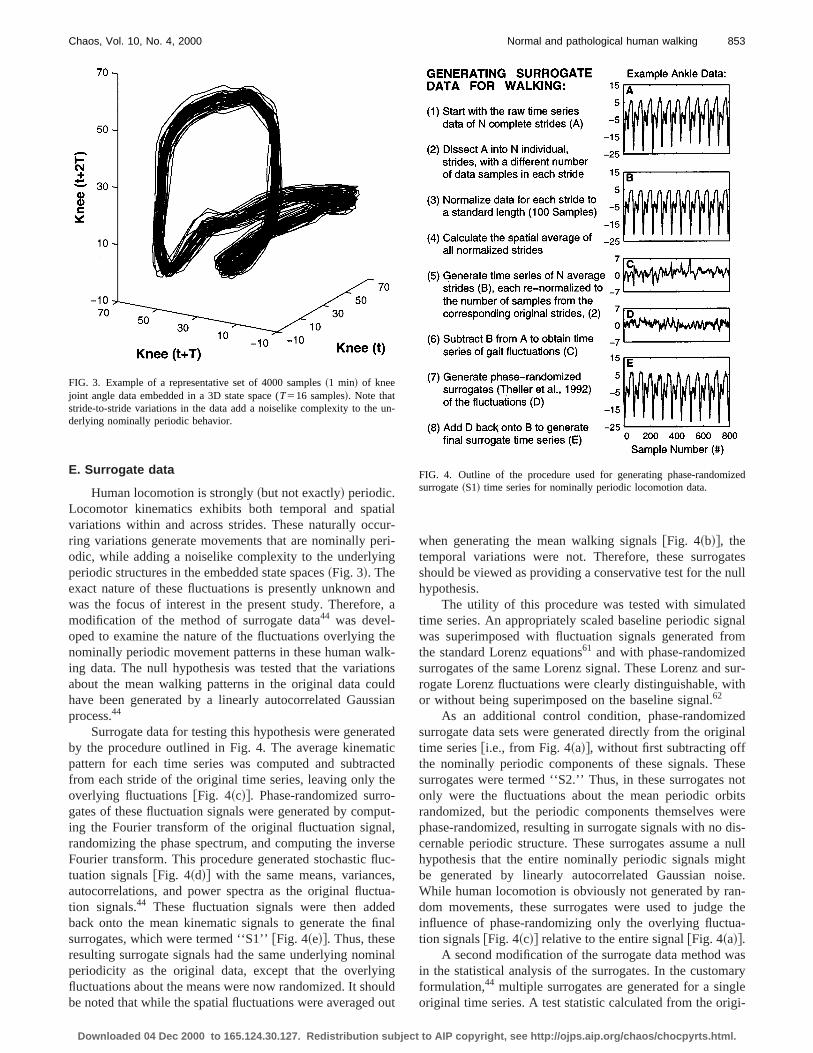
Surrogate data for testing this hypothesis were generby the procedure outlined in Fig. 4. The average kinempattern for each time series was computed and subtrafrom each stride of the original time series, leaving only toverlying fluctuations@Fig. 4~c!#. Phase-randomized surrogates of these fluctuation signals were generated by coming the Fourier transform of the original fluctuation signrandomizing the phase spectrum, and computing the invFourier transform. This procedure generated stochastic fltuation signals@Fig. 4~d!# with the same means, varianceautocorrelations, and power spectra as the original fluction signals.44 These fluctuation signals were then addback onto the mean kinematic signals to generate thesurrogates, which were termed ‘‘S1’’@Fig. 4~e!#. Thus, theseresulting surrogate signals had the same underlying nomperiodicity as the original data, except that the overlyifluctuations about the means were now randomized. It shobe noted that while the spatial fluctuations were averaged
FIG. 3. Example of a representative set of 4000 samples~1 min! of kneejoint angle data embedded in a 3D state space (T516 samples!. Note thatstride-to-stride variations in the data add a noiselike complexity to thederlying nominally periodic behavior.
Downloaded 04 Dec 2000 to 165.124.30.127. Redistribution subject to
lr-i-
da
e-s
dian
edicede
ut-,sec-
a-
al
al
ldut
when generating the mean walking signals@Fig. 4~b!#, thetemporal variations were not. Therefore, these surrogshould be viewed as providing a conservative test for thehypothesis.
The utility of this procedure was tested with simulattime series. An appropriately scaled baseline periodic sigwas superimposed with fluctuation signals generated frthe standard Lorenz equations61 and with phase-randomizesurrogates of the same Lorenz signal. These Lorenz androgate Lorenz fluctuations were clearly distinguishable, wor without being superimposed on the baseline signal.62
As an additional control condition, phase-randomizsurrogate data sets were generated directly from the origtime [email protected]., from Fig. 4~a!#, without first subtracting offthe nominally periodic components of these signals. Thsurrogates were termed ‘‘S2.’’ Thus, in these surrogatesonly were the fluctuations about the mean periodic orbrandomized, but the periodic components themselves wphase-randomized, resulting in surrogate signals with nocernable periodic structure. These surrogates assume ahypothesis that the entire nominally periodic signals migbe generated by linearly autocorrelated Gaussian noWhile human locomotion is obviously not generated by radom movements, these surrogates were used to judgeinfluence of phase-randomizing only the overlying fluctution signals@Fig. 4~c!# relative to the entire signal@Fig. 4~a!#.
A second modification of the surrogate data method win the statistical analysis of the surrogates. In the customformulation,44 multiple surrogates are generated for a sinoriginal time series. A test statistic calculated from the ori
-
FIG. 4. Outline of the procedure used for generating phase-randomsurrogate~S1! time series for nominally periodic locomotion data.
AIP copyright, see http://ojps.aip.org/chaos/chocpyrts.html.
tifestaierubouti
b-
ranweur
pr-lida
na
foau
eeet
ses.n
aeoso
ly
edb
beseh
bifiin,
on
nda-iesbe-
ndeom-is-fe
-ent
g.re-
otebed-
854 Chaos, Vol. 10, No. 4, 2000 J. B. Dingwell and J. P. Cusumano
nal time series is then compared to a variance of statiscalculated from the surrogates to establish statistical difences. A multiplicity of surrogates is required when no emate of the variance in the value of the test statistic is avable for the original time series. In the present study, thwere five original time series for each variable for each sject, and between 10 and 14 subjects in each test grproviding ample estimates of the variance in the test statiscomputed from each set of original time series data.
Surrogates~S1! were generated for all trials where sujects walked over level ground. Estimates ofl* were com-puted for each surrogate time series in the same mannethose calculated for the original data sets. The originalsurrogate exponents from each set of time series datastatistically compared using a two-factor repeated measANOVA58 to test for differences between original~OR! andsurrogate~S1! data types for each of the three subject grou~OG, NP, and CO!. Although only one surrogate was geneated for each original time series, the ANOVA yielded vastatistical discriminations between the original and surrogdata sets by making comparisons between multiple origisurrogate pairs ofl* values across multiple subjects.
IV. RESULTS
A. OGÕTM comparisons
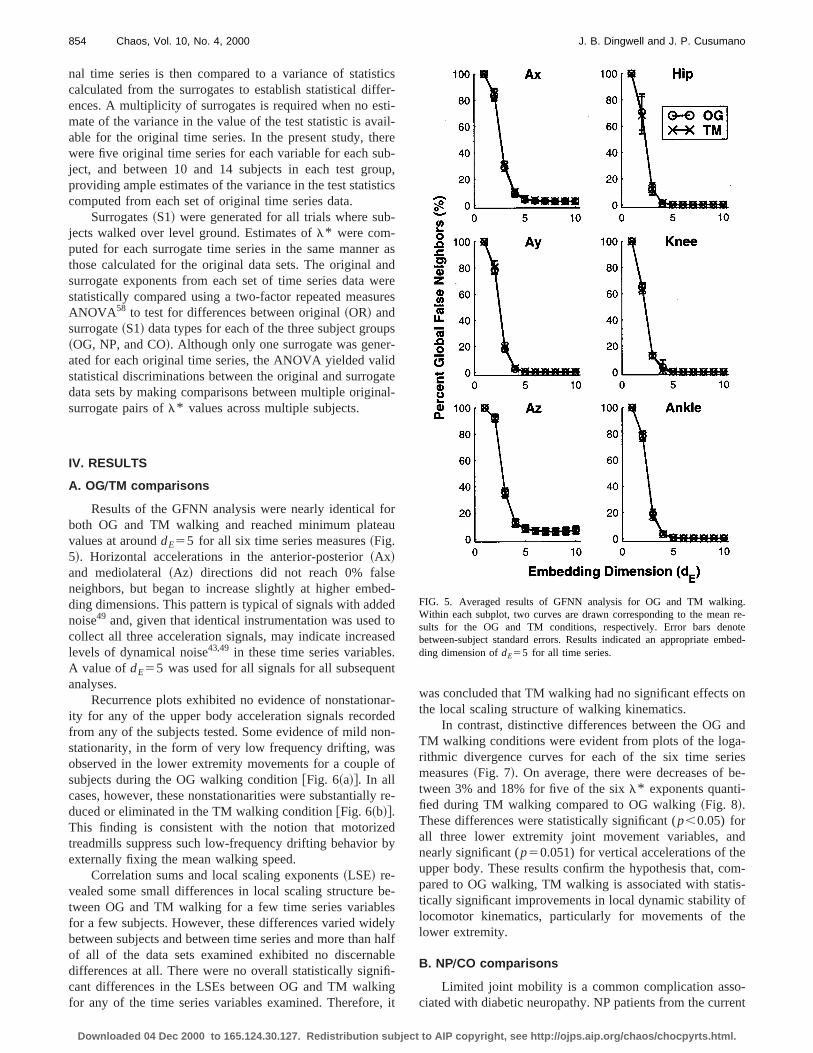
Results of the GFNN analysis were nearly identicalboth OG and TM walking and reached minimum platevalues at arounddE55 for all six time series measures~Fig.5!. Horizontal accelerations in the anterior-posterior~Ax!and mediolateral~Az! directions did not reach 0% falsneighbors, but began to increase slightly at higher embding dimensions. This pattern is typical of signals with addnoise49 and, given that identical instrumentation was usedcollect all three acceleration signals, may indicate increalevels of dynamical noise43,49 in these time series variableA value ofdE55 was used for all signals for all subsequeanalyses.
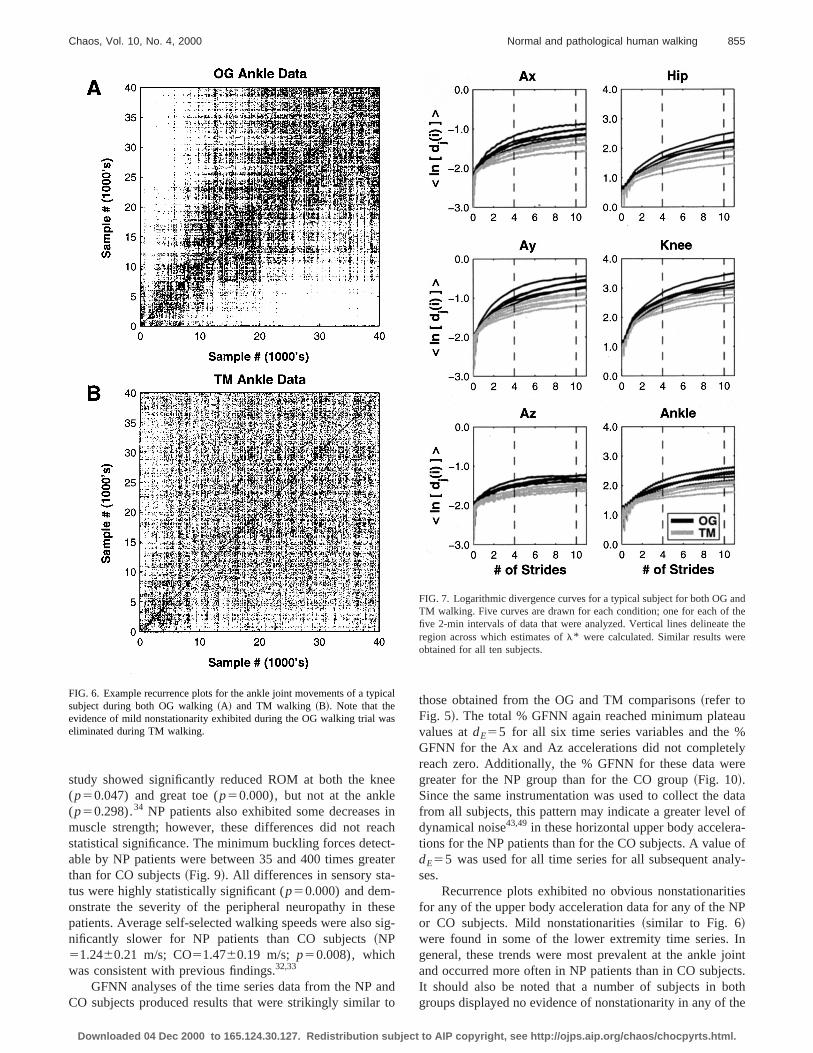
Recurrence plots exhibited no evidence of nonstationity for any of the upper body acceleration signals recordfrom any of the subjects tested. Some evidence of mild nstationarity, in the form of very low frequency drifting, waobserved in the lower extremity movements for a couplesubjects during the OG walking condition@Fig. 6~a!#. In allcases, however, these nonstationarities were substantialduced or eliminated in the TM walking condition@Fig. 6~b!#.This finding is consistent with the notion that motoriztreadmills suppress such low-frequency drifting behaviorexternally fixing the mean walking speed.
Correlation sums and local scaling exponents~LSE! re-vealed some small differences in local scaling structuretween OG and TM walking for a few time series variablfor a few subjects. However, these differences varied widbetween subjects and between time series and more thanof all of the data sets examined exhibited no discernadifferences at all. There were no overall statistically signcant differences in the LSEs between OG and TM walkfor any of the time series variables examined. Therefore
Downloaded 04 Dec 2000 to 165.124.30.127. Redistribution subject to
csr-i-l-e-p,
cs
asdre
es
s
tel-
r
d-dod
t
r-dn-
f
re-
y
e-
lyalf
le-git
was concluded that TM walking had no significant effectsthe local scaling structure of walking kinematics.
In contrast, distinctive differences between the OG aTM walking conditions were evident from plots of the logrithmic divergence curves for each of the six time sermeasures~Fig. 7!. On average, there were decreases oftween 3% and 18% for five of the sixl* exponents quanti-fied during TM walking compared to OG walking~Fig. 8!.These differences were statistically significant (p,0.05) forall three lower extremity joint movement variables, anearly significant (p50.051) for vertical accelerations of thupper body. These results confirm the hypothesis that, cpared to OG walking, TM walking is associated with stattically significant improvements in local dynamic stability olocomotor kinematics, particularly for movements of thlower extremity.
B. NPÕCO comparisons
Limited joint mobility is a common complication associated with diabetic neuropathy. NP patients from the curr
FIG. 5. Averaged results of GFNN analysis for OG and TM walkinWithin each subplot, two curves are drawn corresponding to the meansults for the OG and TM conditions, respectively. Error bars denbetween-subject standard errors. Results indicated an appropriate emding dimension ofdE55 for all time series.
AIP copyright, see http://ojps.aip.org/chaos/chocpyrts.html.
e
aca-
ess
ant
au%lyre
datal ofa-ofly-
tiesNP
Injointcts.oththe
ic
as
ndthethe
e
855Chaos, Vol. 10, No. 4, 2000 Normal and pathological human walking
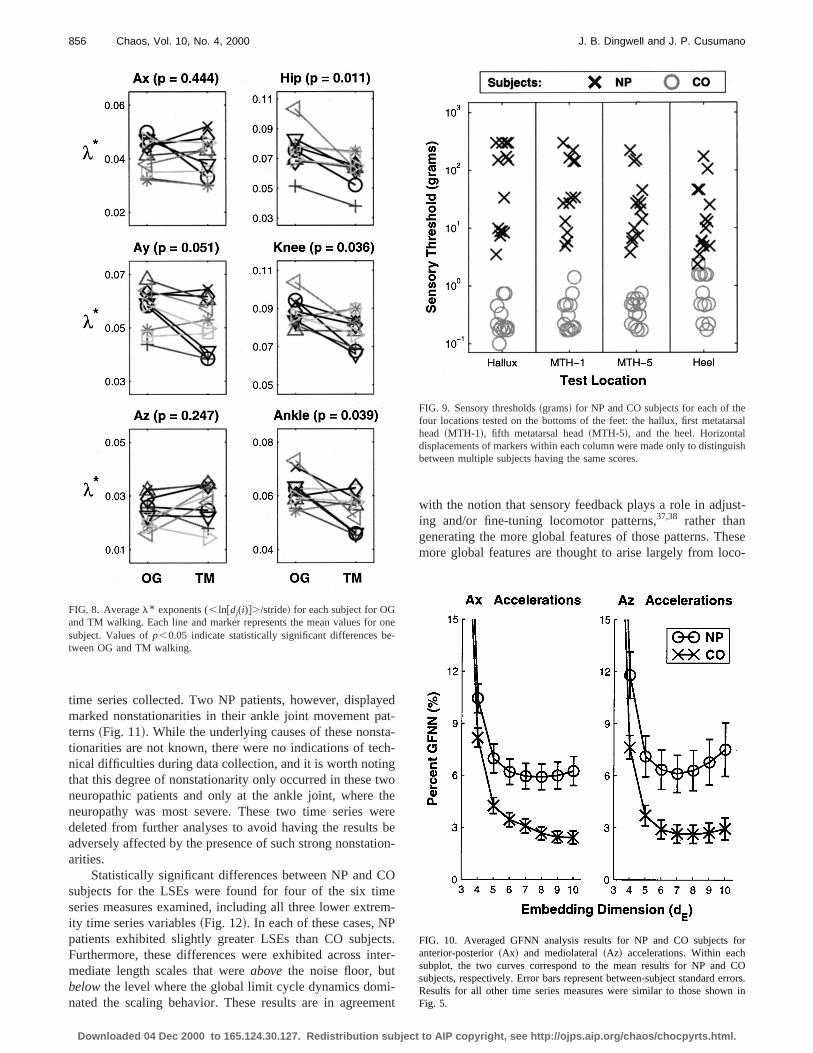
study showed significantly reduced ROM at both the kn(p50.047) and great toe (p50.000), but not at the ankle(p50.298).34 NP patients also exhibited some decreasesmuscle strength; however, these differences did not restatistical significance. The minimum buckling forces deteable by NP patients were between 35 and 400 times grethan for CO subjects~Fig. 9!. All differences in sensory status were highly statistically significant (p50.000) and dem-onstrate the severity of the peripheral neuropathy in thpatients. Average self-selected walking speeds were alsonificantly slower for NP patients than CO subjects~NP51.2460.21 m/s; CO51.4760.19 m/s; p50.008), whichwas consistent with previous findings.32,33
GFNN analyses of the time series data from the NPCO subjects produced results that were strikingly similar
FIG. 6. Example recurrence plots for the ankle joint movements of a typsubject during both OG walking~A! and TM walking ~B!. Note that theevidence of mild nonstationarity exhibited during the OG walking trial weliminated during TM walking.
Downloaded 04 Dec 2000 to 165.124.30.127. Redistribution subject to
e
incht-ter
eig-
do
those obtained from the OG and TM comparisons~refer toFig. 5!. The total % GFNN again reached minimum platevalues atdE55 for all six time series variables and theGFNN for the Ax and Az accelerations did not completereach zero. Additionally, the % GFNN for these data wegreater for the NP group than for the CO group~Fig. 10!.Since the same instrumentation was used to collect thefrom all subjects, this pattern may indicate a greater levedynamical noise43,49 in these horizontal upper body accelertions for the NP patients than for the CO subjects. A valuedE55 was used for all time series for all subsequent anases.
Recurrence plots exhibited no obvious nonstationarifor any of the upper body acceleration data for any of theor CO subjects. Mild nonstationarities~similar to Fig. 6!were found in some of the lower extremity time series.general, these trends were most prevalent at the ankleand occurred more often in NP patients than in CO subjeIt should also be noted that a number of subjects in bgroups displayed no evidence of nonstationarity in any of
al
FIG. 7. Logarithmic divergence curves for a typical subject for both OG aTM walking. Five curves are drawn for each condition; one for each offive 2-min intervals of data that were analyzed. Vertical lines delineateregion across which estimates ofl* were calculated. Similar results werobtained for all ten subjects.
AIP copyright, see http://ojps.aip.org/chaos/chocpyrts.html.
yeatachg
twtheb
tio
Oe
emPctte
i-
st-
eseco-
oe-
ersal
uish
for
COrrors.n in
856 Chaos, Vol. 10, No. 4, 2000 J. B. Dingwell and J. P. Cusumano
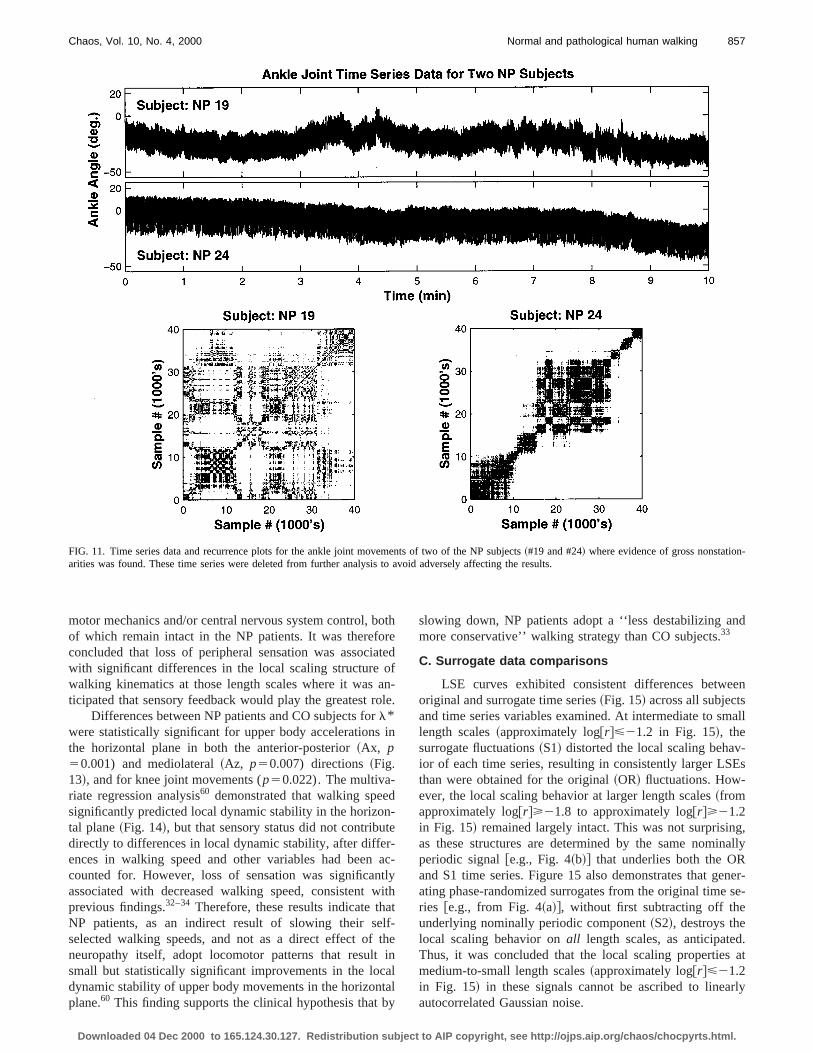
time series collected. Two NP patients, however, displamarked nonstationarities in their ankle joint movement pterns~Fig. 11!. While the underlying causes of these nonstionarities are not known, there were no indications of tenical difficulties during data collection, and it is worth notinthat this degree of nonstationarity only occurred in theseneuropathic patients and only at the ankle joint, whereneuropathy was most severe. These two time series wdeleted from further analyses to avoid having the resultsadversely affected by the presence of such strong nonstaarities.
Statistically significant differences between NP and Csubjects for the LSEs were found for four of the six timseries measures examined, including all three lower extrity time series variables~Fig. 12!. In each of these cases, Npatients exhibited slightly greater LSEs than CO subjeFurthermore, these differences were exhibited across inmediate length scales that wereabove the noise floor, butbelowthe level where the global limit cycle dynamics domnated the scaling behavior. These results are in agreem
FIG. 8. Averagel* exponents (, ln@dj(i)#./stride! for each subject for OGand TM walking. Each line and marker represents the mean values forsubject. Values ofp,0.05 indicate statistically significant differences btween OG and TM walking.
Downloaded 04 Dec 2000 to 165.124.30.127. Redistribution subject to
dt---
oereen-
-
s.r-
ent
with the notion that sensory feedback plays a role in adjuing and/or fine-tuning locomotor patterns,37,38 rather thangenerating the more global features of those patterns. Thmore global features are thought to arise largely from lo
ne
FIG. 9. Sensory thresholds~grams! for NP and CO subjects for each of thfour locations tested on the bottoms of the feet: the hallux, first metatahead ~MTH-1!, fifth metatarsal head~MTH-5!, and the heel. Horizontaldisplacements of markers within each column were made only to distingbetween multiple subjects having the same scores.
FIG. 10. Averaged GFNN analysis results for NP and CO subjectsanterior-posterior~Ax! and mediolateral~Az! accelerations. Within eachsubplot, the two curves correspond to the mean results for NP andsubjects, respectively. Error bars represent between-subject standard eResults for all other time series measures were similar to those showFig. 5.
AIP copyright, see http://ojps.aip.org/chaos/chocpyrts.html.
-
857Chaos, Vol. 10, No. 4, 2000 Normal and pathological human walking
FIG. 11. Time series data and recurrence plots for the ankle joint movements of two of the NP subjects~#19 and #24! where evidence of gross nonstationarities was found. These time series were deleted from further analysis to avoid adversely affecting the results.
ore
iatoao
i
dn-ter-atlwalfthi
ataby
nd
en
all
-Es
g,nally
ner-se-
d.at
rly
motor mechanics and/or central nervous system control, bof which remain intact in the NP patients. It was therefoconcluded that loss of peripheral sensation was assocwith significant differences in the local scaling structurewalking kinematics at those length scales where it wasticipated that sensory feedback would play the greatest r
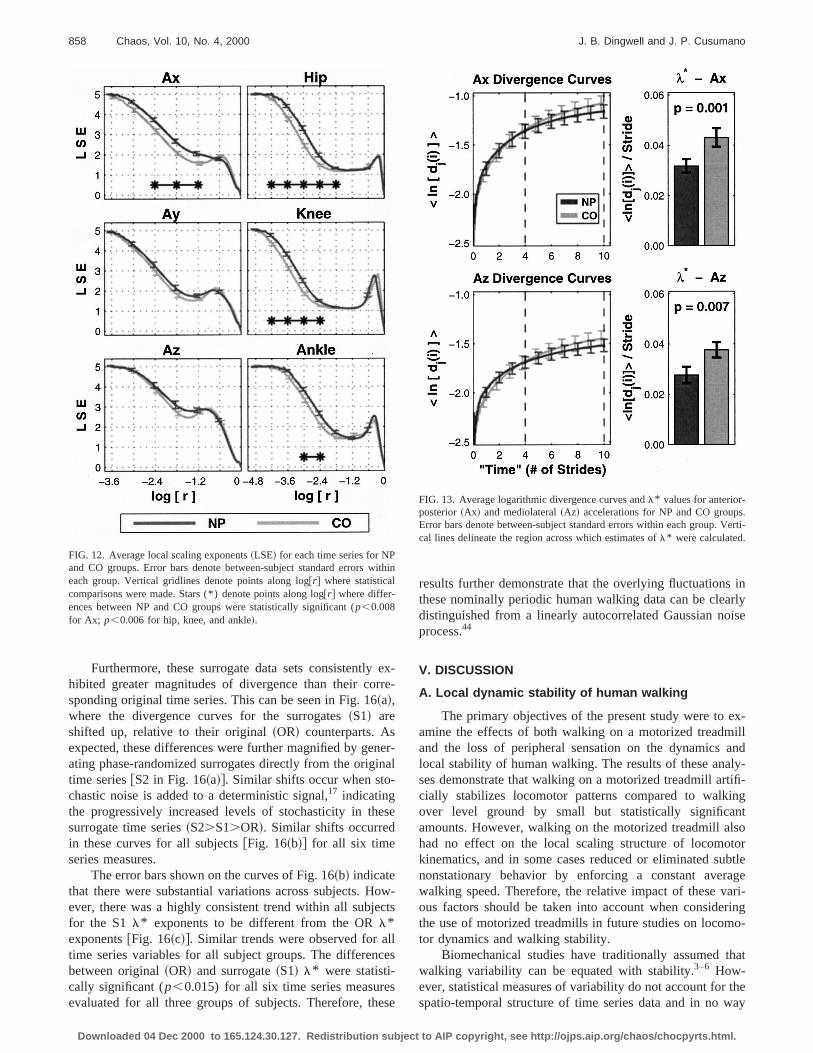
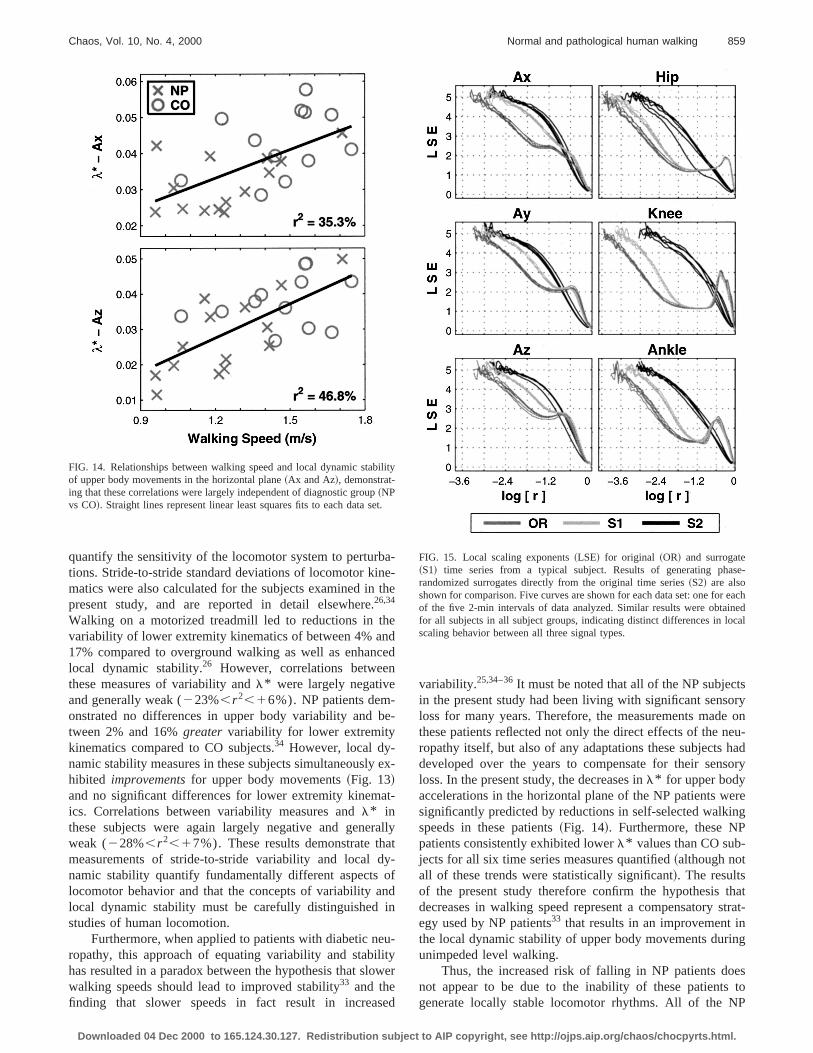
Differences between NP patients and CO subjects forl*were statistically significant for upper body accelerationsthe horizontal plane in both the anterior-posterior~Ax, p50.001) and mediolateral~Az, p50.007) directions~Fig.13!, and for knee joint movements (p50.022). The multiva-riate regression analysis60 demonstrated that walking speesignificantly predicted local dynamic stability in the horizotal plane~Fig. 14!, but that sensory status did not contribudirectly to differences in local dynamic stability, after diffeences in walking speed and other variables had beencounted for. However, loss of sensation was significanassociated with decreased walking speed, consistentprevious findings.32–34 Therefore, these results indicate thNP patients, as an indirect result of slowing their seselected walking speeds, and not as a direct effect ofneuropathy itself, adopt locomotor patterns that resultsmall but statistically significant improvements in the locdynamic stability of upper body movements in the horizonplane.60 This finding supports the clinical hypothesis that
Downloaded 04 Dec 2000 to 165.124.30.127. Redistribution subject to
th
edfn-le.
n
c-yitht-e
nll
slowing down, NP patients adopt a ‘‘less destabilizing amore conservative’’ walking strategy than CO subjects.33
C. Surrogate data comparisons
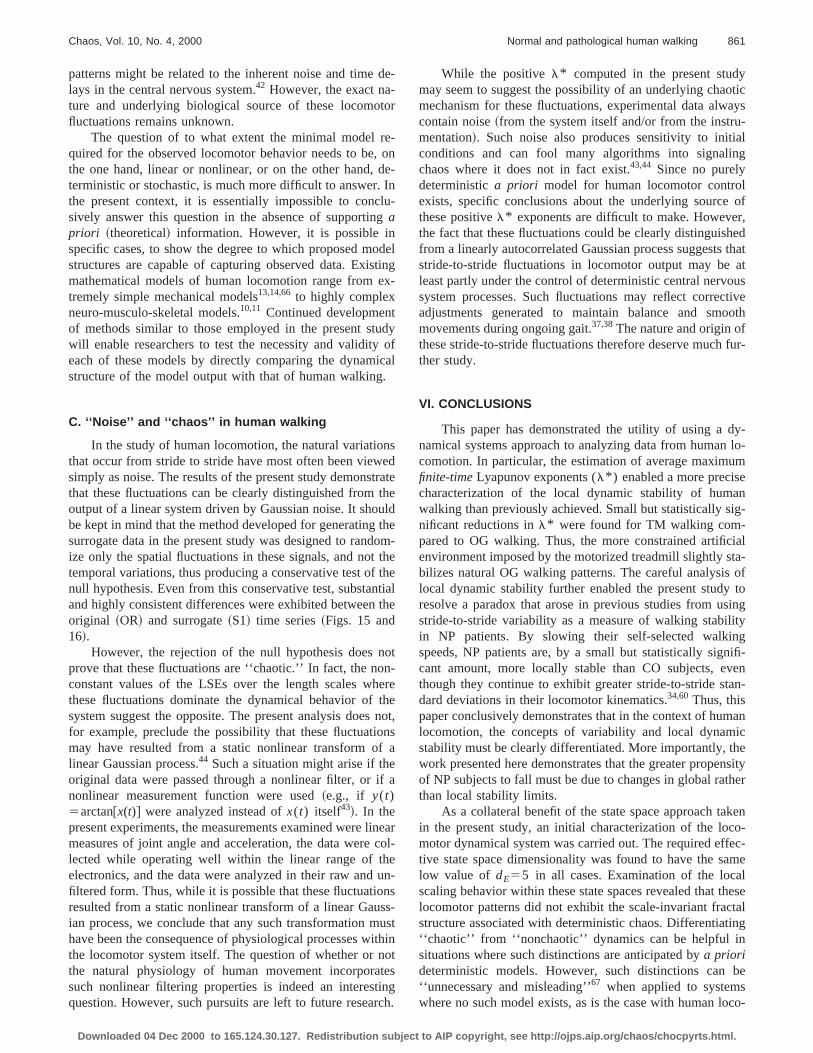
LSE curves exhibited consistent differences betweoriginal and surrogate time series~Fig. 15! across all subjectsand time series variables examined. At intermediate to smlength scales~approximately log@r#<21.2 in Fig. 15!, thesurrogate fluctuations~S1! distorted the local scaling behavior of each time series, resulting in consistently larger LSthan were obtained for the original~OR! fluctuations. How-ever, the local scaling behavior at larger length scales~fromapproximately log@r#>21.8 to approximately log@r#>21.2in Fig. 15! remained largely intact. This was not surprisinas these structures are determined by the same nomiperiodic [email protected]., Fig. 4~b!# that underlies both the ORand S1 time series. Figure 15 also demonstrates that geating phase-randomized surrogates from the original timeries @e.g., from Fig. 4~a!#, without first subtracting off theunderlying nominally periodic component~S2!, destroys thelocal scaling behavior onall length scales, as anticipateThus, it was concluded that the local scaling propertiesmedium-to-small length scales~approximately log@r#<21.2in Fig. 15! in these signals cannot be ascribed to lineaautocorrelated Gaussian noise.
AIP copyright, see http://ojps.aip.org/chaos/chocpyrts.html.
erre
nein-
es
oc
llce
se
inrlyise
ex-illandly-tifi-ngntlsotorbtle
ageari-ringo-
hat
theay
it
s.erti-
858 Chaos, Vol. 10, No. 4, 2000 J. B. Dingwell and J. P. Cusumano
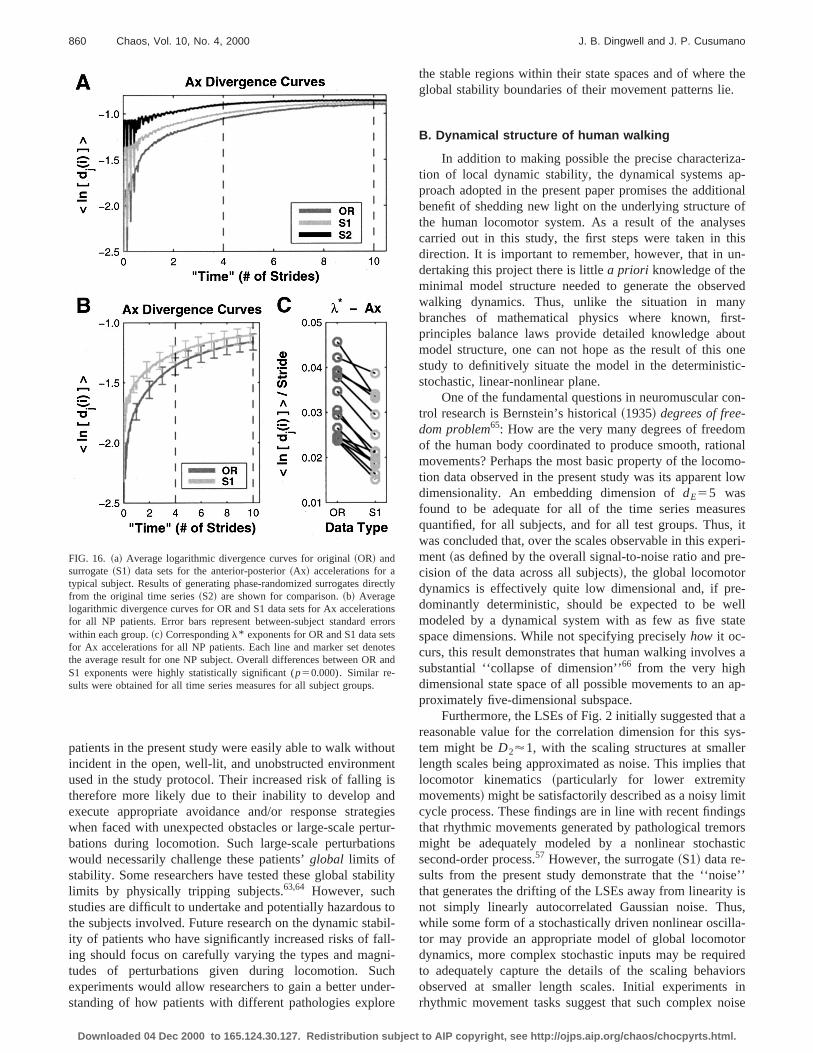
Furthermore, these surrogate data sets consistentlyhibited greater magnitudes of divergence than their cosponding original time series. This can be seen in Fig. 16~a!,where the divergence curves for the surrogates~S1! areshifted up, relative to their original~OR! counterparts. Asexpected, these differences were further magnified by geating phase-randomized surrogates directly from the origtime series@S2 in Fig. 16~a!#. Similar shifts occur when stochastic noise is added to a deterministic signal,17 indicatingthe progressively increased levels of stochasticity in thsurrogate time series~S2.S1.OR!. Similar shifts occurredin these curves for all subjects@Fig. 16~b!# for all six timeseries measures.
The error bars shown on the curves of Fig. 16~b! indicatethat there were substantial variations across subjects. Hever, there was a highly consistent trend within all subjefor the S1l* exponents to be different from the ORl*exponents@Fig. 16~c!#. Similar trends were observed for atime series variables for all subject groups. The differenbetween original~OR! and surrogate~S1! l* were statisti-cally significant (p,0.015) for all six time series measureevaluated for all three groups of subjects. Therefore, th
FIG. 12. Average local scaling exponents~LSE! for each time series for NPand CO groups. Error bars denote between-subject standard errors weach group. Vertical gridlines denote points along log@r# where statisticalcomparisons were made. Stars (*) denote points along log@r# where differ-ences between NP and CO groups were statistically significant (p,0.008for Ax; p,0.006 for hip, knee, and ankle!.
Downloaded 04 Dec 2000 to 165.124.30.127. Redistribution subject to
x--
r-al
e
w-ts
s
se
results further demonstrate that the overlying fluctuationsthese nominally periodic human walking data can be cleadistinguished from a linearly autocorrelated Gaussian noprocess.44
V. DISCUSSION
A. Local dynamic stability of human walking
The primary objectives of the present study were toamine the effects of both walking on a motorized treadmand the loss of peripheral sensation on the dynamicslocal stability of human walking. The results of these anases demonstrate that walking on a motorized treadmill arcially stabilizes locomotor patterns compared to walkiover level ground by small but statistically significaamounts. However, walking on the motorized treadmill ahad no effect on the local scaling structure of locomokinematics, and in some cases reduced or eliminated sunonstationary behavior by enforcing a constant averwalking speed. Therefore, the relative impact of these vous factors should be taken into account when considethe use of motorized treadmills in future studies on locomtor dynamics and walking stability.
Biomechanical studies have traditionally assumed twalking variability can be equated with stability.3–6 How-ever, statistical measures of variability do not account forspatio-temporal structure of time series data and in no w
hin
FIG. 13. Average logarithmic divergence curves andl* values for anterior-posterior~Ax! and mediolateral~Az! accelerations for NP and CO groupError bars denote between-subject standard errors within each group. Vcal lines delineate the region across which estimates ofl* were calculated.
AIP copyright, see http://ojps.aip.org/chaos/chocpyrts.html.
aneth
hedcen
be
e
at
raatyonin
euityow
e
tsorye oneu-hadsory
ereng
-
thatstrat-nng
estoP
ili
et.
se-
eachnedcal
859Chaos, Vol. 10, No. 4, 2000 Normal and pathological human walking
quantify the sensitivity of the locomotor system to perturbtions. Stride-to-stride standard deviations of locomotor kimatics were also calculated for the subjects examined inpresent study, and are reported in detail elsewhere.26,34
Walking on a motorized treadmill led to reductions in tvariability of lower extremity kinematics of between 4% an17% compared to overground walking as well as enhanlocal dynamic stability.26 However, correlations betweethese measures of variability andl* were largely negativeand generally weak (223%,r 2,16%). NPpatients dem-onstrated no differences in upper body variability andtween 2% and 16%greater variability for lower extremitykinematics compared to CO subjects.34 However, local dy-namic stability measures in these subjects simultaneouslyhibited improvementsfor upper body movements~Fig. 13!and no significant differences for lower extremity kinemics. Correlations between variability measures andl* inthese subjects were again largely negative and geneweak (228%,r 2,17%). These results demonstrate thmeasurements of stride-to-stride variability and local dnamic stability quantify fundamentally different aspectslocomotor behavior and that the concepts of variability alocal dynamic stability must be carefully distinguishedstudies of human locomotion.
Furthermore, when applied to patients with diabetic nropathy, this approach of equating variability and stabilhas resulted in a paradox between the hypothesis that slwalking speeds should lead to improved stability33 and thefinding that slower speeds in fact result in increas
FIG. 14. Relationships between walking speed and local dynamic stabof upper body movements in the horizontal plane~Ax and Az!, demonstrat-ing that these correlations were largely independent of diagnostic group~NPvs CO!. Straight lines represent linear least squares fits to each data s
Downloaded 04 Dec 2000 to 165.124.30.127. Redistribution subject to
--e
d
-
x-
-
lly
-fd
-
er
d
variability.25,34–36It must be noted that all of the NP subjecin the present study had been living with significant sensloss for many years. Therefore, the measurements madthese patients reflected not only the direct effects of the nropathy itself, but also of any adaptations these subjectsdeveloped over the years to compensate for their senloss. In the present study, the decreases inl* for upper bodyaccelerations in the horizontal plane of the NP patients wsignificantly predicted by reductions in self-selected walkispeeds in these patients~Fig. 14!. Furthermore, these NPpatients consistently exhibited lowerl* values than CO subjects for all six time series measures quantified~although notall of these trends were statistically significant!. The resultsof the present study therefore confirm the hypothesisdecreases in walking speed represent a compensatoryegy used by NP patients33 that results in an improvement ithe local dynamic stability of upper body movements duriunimpeded level walking.
Thus, the increased risk of falling in NP patients donot appear to be due to the inability of these patientsgenerate locally stable locomotor rhythms. All of the N
ty
FIG. 15. Local scaling exponents~LSE! for original ~OR! and surrogate~S1! time series from a typical subject. Results of generating pharandomized surrogates directly from the original time series~S2! are alsoshown for comparison. Five curves are shown for each data set: one forof the five 2-min intervals of data analyzed. Similar results were obtaifor all subjects in all subject groups, indicating distinct differences in loscaling behavior between all three signal types.
AIP copyright, see http://ojps.aip.org/chaos/chocpyrts.html.
ouenisd
egrton
bi
sbll-nchdere
the.
za-p-onalofseshisn-
rvedyst-outoneic-
on-
mnalmo-low
res, iteri-
re-
e-ellate
s a
ap-
t ays-r
that
itgsorsstic
e’’is
us,la-torirediors
inoise
rec
tiorrtsota
860 Chaos, Vol. 10, No. 4, 2000 J. B. Dingwell and J. P. Cusumano
patients in the present study were easily able to walk withincident in the open, well-lit, and unobstructed environmused in the study protocol. Their increased risk of fallingtherefore more likely due to their inability to develop anexecute appropriate avoidance and/or response stratwhen faced with unexpected obstacles or large-scale pebations during locomotion. Such large-scale perturbatiwould necessarily challenge these patients’global limits ofstability. Some researchers have tested these global stalimits by physically tripping subjects.63,64 However, suchstudies are difficult to undertake and potentially hazardouthe subjects involved. Future research on the dynamic staity of patients who have significantly increased risks of faing should focus on carefully varying the types and magtudes of perturbations given during locomotion. Suexperiments would allow researchers to gain a better unstanding of how patients with different pathologies explo
FIG. 16. ~a! Average logarithmic divergence curves for original~OR! andsurrogate~S1! data sets for the anterior-posterior~Ax! accelerations for atypical subject. Results of generating phase-randomized surrogates difrom the original time series~S2! are shown for comparison.~b! Averagelogarithmic divergence curves for OR and S1 data sets for Ax accelerafor all NP patients. Error bars represent between-subject standard ewithin each group.~c! Correspondingl* exponents for OR and S1 data sefor Ax accelerations for all NP patients. Each line and marker set denthe average result for one NP subject. Overall differences between ORS1 exponents were highly statistically significant (p50.000). Similar re-sults were obtained for all time series measures for all subject groups.
Downloaded 04 Dec 2000 to 165.124.30.127. Redistribution subject to
tt
iesur-s
lity
toil-
i-
r-
the stable regions within their state spaces and of whereglobal stability boundaries of their movement patterns lie
B. Dynamical structure of human walking
In addition to making possible the precise characterition of local dynamic stability, the dynamical systems aproach adopted in the present paper promises the additibenefit of shedding new light on the underlying structurethe human locomotor system. As a result of the analycarried out in this study, the first steps were taken in tdirection. It is important to remember, however, that in udertaking this project there is littlea priori knowledge of theminimal model structure needed to generate the obsewalking dynamics. Thus, unlike the situation in manbranches of mathematical physics where known, firprinciples balance laws provide detailed knowledge abmodel structure, one can not hope as the result of thisstudy to definitively situate the model in the deterministstochastic, linear-nonlinear plane.
One of the fundamental questions in neuromuscular ctrol research is Bernstein’s historical~1935! degrees of free-dom problem65: How are the very many degrees of freedoof the human body coordinated to produce smooth, ratiomovements? Perhaps the most basic property of the locotion data observed in the present study was its apparentdimensionality. An embedding dimension ofdE55 wasfound to be adequate for all of the time series measuquantified, for all subjects, and for all test groups. Thuswas concluded that, over the scales observable in this expment~as defined by the overall signal-to-noise ratio and pcision of the data across all subjects!, the global locomotordynamics is effectively quite low dimensional and, if prdominantly deterministic, should be expected to be wmodeled by a dynamical system with as few as five stspace dimensions. While not specifying preciselyhow it oc-curs, this result demonstrates that human walking involvesubstantial ‘‘collapse of dimension’’66 from the very highdimensional state space of all possible movements to anproximately five-dimensional subspace.
Furthermore, the LSEs of Fig. 2 initially suggested thareasonable value for the correlation dimension for this stem might beD2'1, with the scaling structures at smallelength scales being approximated as noise. This implieslocomotor kinematics ~particularly for lower extremitymovements! might be satisfactorily described as a noisy limcycle process. These findings are in line with recent findinthat rhythmic movements generated by pathological tremmight be adequately modeled by a nonlinear stochasecond-order process.57 However, the surrogate~S1! data re-sults from the present study demonstrate that the ‘‘noisthat generates the drifting of the LSEs away from linearitynot simply linearly autocorrelated Gaussian noise. Thwhile some form of a stochastically driven nonlinear osciltor may provide an appropriate model of global locomodynamics, more complex stochastic inputs may be requto adequately capture the details of the scaling behavobserved at smaller length scales. Initial experimentsrhythmic movement tasks suggest that such complex n
tly
nsors
esnd
AIP copyright, see http://ojps.aip.org/chaos/chocpyrts.html.
d-to
e, odInlug
odtiex
tud
ic.
ne
trathuthoththtith
onethnn
feif
inceunsu
itnoteinrc
yoticays-alng
lof
r,hed
thatatustive
ooth
fur-
y-lo-
umeanig-
ialta-ofto
singitygifi-
venan-
anicensityher
keno-ec-amel
hesetaling
besco-
861Chaos, Vol. 10, No. 4, 2000 Normal and pathological human walking
patterns might be related to the inherent noise and timelays in the central nervous system.42 However, the exact nature and underlying biological source of these locomofluctuations remains unknown.
The question of to what extent the minimal model rquired for the observed locomotor behavior needs to bethe one hand, linear or nonlinear, or on the other hand,terministic or stochastic, is much more difficult to answer.the present context, it is essentially impossible to concsively answer this question in the absence of supportinapriori ~theoretical! information. However, it is possible inspecific cases, to show the degree to which proposed mstructures are capable of capturing observed data. Exismathematical models of human locomotion range fromtremely simple mechanical models13,14,66to highly complexneuro-musculo-skeletal models.10,11 Continued developmenof methods similar to those employed in the present stwill enable researchers to test the necessity and validityeach of these models by directly comparing the dynamstructure of the model output with that of human walking
C. ‘‘Noise’’ and ‘‘chaos’’ in human walking
In the study of human locomotion, the natural variatiothat occur from stride to stride have most often been viewsimply as noise. The results of the present study demonsthat these fluctuations can be clearly distinguished fromoutput of a linear system driven by Gaussian noise. It shobe kept in mind that the method developed for generatingsurrogate data in the present study was designed to randize only the spatial fluctuations in these signals, and nottemporal variations, thus producing a conservative test ofnull hypothesis. Even from this conservative test, substanand highly consistent differences were exhibited betweenoriginal ~OR! and surrogate~S1! time series~Figs. 15 and16!.
However, the rejection of the null hypothesis does nprove that these fluctuations are ‘‘chaotic.’’ In fact, the noconstant values of the LSEs over the length scales whthese fluctuations dominate the dynamical behavior ofsystem suggest the opposite. The present analysis doesfor example, preclude the possibility that these fluctuatiomay have resulted from a static nonlinear transform olinear Gaussian process.44 Such a situation might arise if thoriginal data were passed through a nonlinear filter, ornonlinear measurement function were used~e.g., if y(t)5arctan@x(t)# were analyzed instead ofx(t) itself43!. In thepresent experiments, the measurements examined were lmeasures of joint angle and acceleration, the data werelected while operating well within the linear range of thelectronics, and the data were analyzed in their raw andfiltered form. Thus, while it is possible that these fluctuatioresulted from a static nonlinear transform of a linear Gauian process, we conclude that any such transformation mhave been the consequence of physiological processes wthe locomotor system itself. The question of whether orthe natural physiology of human movement incorporasuch nonlinear filtering properties is indeed an interestquestion. However, such pursuits are left to future resea
Downloaded 04 Dec 2000 to 165.124.30.127. Redistribution subject to
e-
r
-n
e-
-
elng-
yofal
sdteeldem-ee
ale
t-reeot,sa
a
earol-
n-ss-st
hintsgh.
While the positivel* computed in the present studmay seem to suggest the possibility of an underlying chamechanism for these fluctuations, experimental data alwcontain noise~from the system itself and/or from the instrumentation!. Such noise also produces sensitivity to initiconditions and can fool many algorithms into signalichaos where it does not in fact exist.43,44 Since no purelydeterministica priori model for human locomotor controexists, specific conclusions about the underlying sourcethese positivel* exponents are difficult to make. Howevethe fact that these fluctuations could be clearly distinguisfrom a linearly autocorrelated Gaussian process suggestsstride-to-stride fluctuations in locomotor output may beleast partly under the control of deterministic central nervosystem processes. Such fluctuations may reflect correcadjustments generated to maintain balance and smmovements during ongoing gait.37,38The nature and origin ofthese stride-to-stride fluctuations therefore deserve muchther study.
VI. CONCLUSIONS
This paper has demonstrated the utility of using a dnamical systems approach to analyzing data from humancomotion. In particular, the estimation of average maximfinite-timeLyapunov exponents (l* ) enabled a more precischaracterization of the local dynamic stability of humwalking than previously achieved. Small but statistically snificant reductions inl* were found for TM walking com-pared to OG walking. Thus, the more constrained artificenvironment imposed by the motorized treadmill slightly sbilizes natural OG walking patterns. The careful analysislocal dynamic stability further enabled the present studyresolve a paradox that arose in previous studies from ustride-to-stride variability as a measure of walking stabilin NP patients. By slowing their self-selected walkinspeeds, NP patients are, by a small but statistically signcant amount, more locally stable than CO subjects, ethough they continue to exhibit greater stride-to-stride stdard deviations in their locomotor kinematics.34,60 Thus, thispaper conclusively demonstrates that in the context of humlocomotion, the concepts of variability and local dynamstability must be clearly differentiated. More importantly, thwork presented here demonstrates that the greater propeof NP subjects to fall must be due to changes in global ratthan local stability limits.
As a collateral benefit of the state space approach tain the present study, an initial characterization of the locmotor dynamical system was carried out. The required efftive state space dimensionality was found to have the slow value of dE55 in all cases. Examination of the locascaling behavior within these state spaces revealed that tlocomotor patterns did not exhibit the scale-invariant fracstructure associated with deterministic chaos. Differentiat‘‘chaotic’’ from ‘‘nonchaotic’’ dynamics can be helpful insituations where such distinctions are anticipated bya priorideterministic models. However, such distinctions can‘‘unnecessary and misleading’’67 when applied to systemwhere no such model exists, as is the case with human lo
AIP copyright, see http://ojps.aip.org/chaos/chocpyrts.html.
icsnmfe
idna
trth-rldeys
thoa
shes
orm.
H.me
a-
a
ndo
rs
ith
the
o
lo
loy-
f a
sg.
f ae
bi
y-
h.
fora D
s of
ee
alk-
M.g
ogo-
n
P.ari-it
ocalnd
ic
,
ard,in-
en’’ J.
sk
be,pe-her.
C.d.
usto
.
eev.
lk-
kin-in
r,ide
z,e-’’ J.
d
/
862 Chaos, Vol. 10, No. 4, 2000 J. B. Dingwell and J. P. Cusumano
motion. In fact, it was anticipated that locomotor dynamwould be affected by a number of both deterministic astochastic influences. The present analyses have confirthis expectation and have revealed a number of uniquetures of these different influences. Furthermore, usingmodified surrogate data method, it was shown that the strto-stride variations in the time series from these experimecould be statistically distinguished from the output ofsimple linear system driven by Gaussian noise. This condicts the traditional assumption of most gait analysesstride-to-stride variations are merely ‘‘noise.’’ While preliminary, the results of these initial experiments have cleademonstrated that nonlinear time series methods basestate space reconstruction can provide significant and usinsight into the neuromuscular control of locomotion in wathat traditional linear statistical approaches cannot.
ACKNOWLEDGMENTS
This research was partially supported by a grant fromGraduate Student Grant-In-Aid program of the American Sciety of Biomechanics. The authors thank Dr. Peter Cvanagh and the staff at the Center for Locomotion StudiePenn State University for assisting in the collection of tdata examined in this study and for many fruitful discusions.
1M. E. Tinetti, J. Doucette, E. Claus, and R. Marottoli, ‘‘Risk factors fserious injury during falls by older persons in the community,’’ J. AGeriatr. Soc.43~11!, 1214–1221~1995!.
2A. J. Blake, K. Morgan, M. J. Bendall, H. Dallosso, S. B. Ebrahim, T.Arie, P. H. Fentem, and E. J. Bassey, ‘‘Falls by elderly people at hoPrevalence and associated factors,’’ Age Ageing17~6!, 365–372~1988!.
3D. A. Winter, ‘‘Biomechanics of normal and pathological gait: Implictions for understanding human locomotion control,’’ J. Motor Behav.21,337–355~1989!.
4J. Yack and R. C. Berger, ‘‘Dynamic stability in the elderly: Identifyingpossible measure,’’ J. Gerontol.: Med. Sci.48~5!, M225–M230~1993!.
5K. G. Holt, S. F. Jeng, R. Ratcliffe, and J. Hamill, ‘‘Energetic cost astability during human walking at the preferred stride frequency,’’ J. Mtor. Behav.27~2!, 164–178~1995!.
6B. E. Maki, ‘‘Gait changes in older adults: Predictors of falls or indicatoof fear?’’ J. Am. Geriatr. Soc.45~3!, 313–320~1997!.
7J. S. Bay and H. Hemami, ‘‘Modeling of a neutral pattern generator wcoupled nonlinear oscillators,’’ IEEE Trans. Biomed. Eng.BME-34~4!,297–306~1987!.
8J. J. Collins and I. N. Stewart, ‘‘Coupled nonlinear oscillators andsymmetries of animal gaits,’’ J. Nonlinear Sci.3, 349–392~1993!.
9J. J. Collins and I. N. Stewart, ‘‘A group-theoretic approach to ringscoupled biological oscillators,’’ Biol. Cybern.71, 95–103~1994!.
10G. Taga, ‘‘A model of the neuro-musculo-skeletal system for humancomotion I: Emergence of basic gait,’’ Biol. Cybern.73~2!, 97–111~1995!.
11G. Taga, ‘‘A model of the neuro-musculo-skeletal system for humancomotion II: Real-time adaptability under various constraints,’’ Biol. Cbern.73~2!, 97–111~1995!.
12T. Zielinska, ‘‘Coupled oscillators utilized as gait rhythm generators otwo-legged walking machine,’’ Biol. Cybern.74~3!, 263–273~1996!.
13M. Garcia, A. Chatterjee, A. Ruina, and M. Coleman, ‘‘The simplewalking model: Stability, complexity, and scaling,’’ J. Biomech. En120~2!, 281–288~1998!.
14A. Goswami, B. Thuilot, and B. Espiau, ‘‘A study of the passive gait ocompass-like biped robot: Symmetry and chaos,’’ Int. J. Robot. R17~12!, 1282–1301~1998!.
15Y. Hurmuzlu and C. Basdogan, ‘‘On the measurement of dynamic staity of human locomotion,’’ J. Biomech. Eng.116~1!, 30–36~1994!.
16Y. Hurmuzlu, C. Basdogan, and D. Stoianovici, ‘‘Kinematics and d
Downloaded 04 Dec 2000 to 165.124.30.127. Redistribution subject to
deda-ae-ts
a-at
yonful
e--at
-
:
-
f
-
-
t
s.
l-
namic stability of the locomotion of post-polio patients,’’ J. BiomecEng.118~3!, 405–411~1996!.
17M. T. Rosenstein, J. J. Collins, and C. J. DeLuca, ‘‘A practical methodcalculating largest Lyapunov exponents from small data sets,’’ Physic65, 117–134~1993!.
18H. Kantz and S. Schreiber,Nonlinear Time Series Analysis~CambridgeUniversity Press, Cambridge, 1997!.
19R. C. Nelson, C. J. Dillman, P. Lagasse, and P. Bickett, ‘‘Biomechanicoverground versus treadmill running,’’ Med. Sci. Sports4~4!, 233–240~1972!.
20G. M. Strathy, E. Y. S. Chao, and R. K. Laughman, ‘‘Changes in knfunction associated with treadmill ambulation,’’ J. Biomech.16~7!, 517–522 ~1983!.
21J. Pailhous and M. Bonnard, ‘‘Stead-state fluctuations of human wing,’’ Behav. Brain Res.4, 181–190~1992!.
22M. E. Pearce, D. A. Cunningham, A. P. Donner, P. A. Rechnitzer, G.Fullerton, and J. H. Howard, ‘‘Energy cost of treadmill and floor walkinat self-selected paces,’’ Euro. J. Physiol.52~1!, 115–119~1983!.
23J. Isacson, L. Gransberg, and E. Knutsson, ‘‘Three-dimensional electrniometrical gait recording,’’ J. Biomech.19~8!, 627–635~1986!.
24A. B. Arsenault, ‘‘Treadmill versus walkway locomotion in human: AEMG study,’’ Ergonomics29~5!, 665–676~1986!.
25J. B. Dingwell, J. S. Ulbrecht, J. Boch, M. B. Becker, J. O’Gorman, andR. Cavanagh, ‘‘Neuropathic gait shows only trends toward increased vability in sagittal plane kinematics during treadmill locomotion,’’ GaPost.10~1!, 21–29~1999!.
26J. B. Dingwell, J. P. Cusumano, D. Sternad, and P. R. Cavanagh, ‘‘Ldynamic stability versus kinematic variability of continuous overgrouand treadmill walking,’’ J. Biomech. Eng.~in revision!.
27D. A. Greene, A. A. F. Sime, J. W. Albers, and M. A. Pfeifer, ‘‘DiabetNeuropathy,’’ inDiabetes Mellitus: Theory and Practice,4th ed.~ElsevierScience, New York, 1990!, pp. 710–755.
28A. I. Vinik, M. T. Holland, J. M. LeBeau, F. J. Liuzzi, K. B. Stansberryand L. B. Colen, ‘‘Diabetic neuropathies,’’ Diabetes Care15~12!, 1926–1975 ~1992!.
29P. R. Cavanagh, J. A. Derr, J. S. Ulbrecht, R. E. Maser, and T. J. Orch‘‘Problems with gait and posture in neuropathic patients with insuldependent diabetes mellitus,’’ Diabet Med.9, 469–474~1992!.
30J. K. Richardson, C. Ching, and E. A. Hurvitz, ‘‘The relationship betweelectromyographically documented peripheral neuropathy and falls,Am. Geriatr. Soc.40, 1008–1012~1992!.
31J. K. Richardson and E. A. Hurvitz, ‘‘Peripheral neuropathy: A true rifactor for fall,’’ J. Gerontol. A Biol. Sci. Med. Sci.50~4!, M211–M215~1995!.
32M. J. Mueller, S. D. Minor, S. A. Sahrmann, J. A. Schaf, and M. J. Stru‘‘Differences in the gait characteristics of patients with diabetes andripheral neuropathy compared with age-matched controls,’’ Phys. T74~4!, 299–313~1994!.
33R. Courtemanche, N. Teasdale, P. Boucher, M. Fleury, Y. Lajoie, andBard, ‘‘Gait problems in diabetic neuropathic patients,’’ Arch. Phys. MeRehabil.77~9!, 849–855~1996!.
34J. B. Dingwell and P. R. Cavanagh, ‘‘Increased variability of continuooverground walking in neuropathic patients is only indirectly relatedsensory loss,’’ Gait Post.~in revision!.
35D. A. Winter, ‘‘Biomechanical motor patterns in normal walking,’’ JMotor Behav.15~4!, 302–330~1983!.
36T. Oberg, A. Karsznia, and K. O¨ berg, ‘‘Basic gait parameters: Referencdata for normal subjects, 10–79 years of age,’’ J. Rehabil. Res. D30~2!, 210–223~1993!.
37L. M. Nashner, ‘‘Balance adjustments of humans perturbed while waing,’’ J. Neurophysiol.44~4!, 650–664~1980!.
38S. C. Gandevia and D. Burke, ‘‘Does the nervous system depend onesthetic information to control natural limb movements?’’ Behav. BraSci. 15, 614–632~1992!.
39J. M. Hausdorff, C. K. Peng, Z. Ladin, J. Y. Wei, and A. L. Goldberge‘‘Is walking a random walk? Evidence for long-range correlations in strinterval of human gait,’’ J. Appl. Physiol.78~1!, 349–358~1995!.
40J. M. Hausdorff, S. L. Mitchell, R. Firtion, C. K. Peng, M. E. CudkowicJ. Y. Wei, and A. L. Goldberger, ‘‘Altered fractal dynamics of gait: Rduced stride interval correlations with aging and Huntington’s disease,Appl. Physiol.82~1!, 262–269~1997!.
41B. J. West and L. Griffin, ‘‘Allometric control, inverse powers laws anhuman gait,’’ Chaos, Solitons, Fractals10~9!, 1519–1527~1999!.
42Y. Chen, M. Ding, and J. A. S. Kelso, ‘‘Long memory processes (1f a
AIP copyright, see http://ojps.aip.org/chaos/chocpyrts.html.
stic
in80
ys
g
.
s o
g
ran
ica
ehys.
wery of
singus
n,
xer-
iter
ani-
nd
863Chaos, Vol. 10, No. 4, 2000 Normal and pathological human walking
type! in human coordination,’’ Phys. Rev. Lett.79~22!, 4501–4504~1997!.
43D. T. Kaplan and L. Glass,Understanding Nonlinear Dynamics~Springer-Verlag, New York, 1995!.
44J. Theiler, S. Eubank, A. Longtin, B. Galdrikian, and J. D. Farmer, ‘‘Teing for nonlinearity in time series: The method of surrogate data,’’ PhysD 58, 77–94~1992!.
45F. Takens, ‘‘Detecting strange attractors in turbulence,’’ inDynamicalSystems and Turbulence, Warwick 1980~Springer-Verlag, Berlin, 1981!,pp. 366–381.
46R. Mane, ‘‘On the dimension of the compact invariant sets of certanon-linear maps,’’ inDynamical Systems and Turbulence, Warwick 19~Springer-Verlag, Berlin, 1981!, pp. 230–242.
47T. Sauer, J. A. Yorke, and M. Casdagli, ‘‘Embedology,’’ J. Stat. Ph65~3/4!, 579–616~1991!.
48A. M. Fraser and H. L. Swinney, ‘‘Independent coordinates for stranattractors from mutual information,’’ Phys. Rev. A33, 1134–1140~1986!.
49M. B. Kennel, R. Brown, and H. D. I. Abarbanel, ‘‘Determining minimumembedding dimension using a geometrical construction,’’ Phys. Rev45, 3403–3411~1992!.
50J.-P. Eckmann, S. O. Kamphorst, and D. Ruelle, ‘‘Recurrence plotdynamical systems,’’ Europhys. Lett.4~9!, 973–977~1987!.
51A. Babloyantz, ‘‘Some remarks on nonlinear data analysis of physiolocal time series,’’ inMeasures of Complexity and Chaos~Plenum, NewYork, 1989!.
52M. C. Casdagli, ‘‘Recurrence plots revisited,’’ Physica D108~1!, 12–44~1997!.
53P. Grassberger and I. Procaccia, ‘‘Measuring the strangeness of stattractors,’’ Physica D9, 189–208~1983!.
54J. Theiler, ‘‘Estimating fractal dimensions,’’ J. Opt. Soc. Am. A7~6!,1055–1073~1990!.
55H. Kantz and T. Schreiber, ‘‘Dimension estimates and physiologdata,’’ Chaos5~1!, 143–154~1995!.
Downloaded 04 Dec 2000 to 165.124.30.127. Redistribution subject to
-a
.
e
A
f
i-
ge
l
56H. D. I. Abarbanel, R. Brown, J. J. Sidorowich, and L. S. Tsimring, ‘‘Thanalysis of observed chaotic data in physical systems,’’ Rev. Mod. P65, 1331–1392~1993!.
57J. Timmer, S. Ha¨ussler, M. Lauk, and C.-H. Lu¨cking, ‘‘Pathological trem-ors: Deterministic chaos or nonlinear stochastic oscillators?’’ Chaos10~1!,278–288~2000!.
58F. L. Ramsey and D. W. Schafer,The Statistical Sleuth: A Course inMethods of Data Analysis~Duxbury, Wadsworth, Belmont, CA, 1997!.
59J. F. Hair, R. E. Anderson, R. L. Tatham, and W. C. Black,MultivariateData Analysis, 5th ed.~Prentice Hall, Englewood Cliffs, NJ, 1998!.
60J. B. Dingwell, J. P. Cusumano, D. Sternad, and P. R. Cavanagh, ‘‘Slospeeds in neuropathic patients lead to improved local dynamic stabilitcontinuous overground walking,’’ J. Biomech.33~10!, 1269–1277~2000!.
61E. N. Lorenz, ‘‘Deterministic non-periodic flows,’’ J. Atmos. Sci.7, 130–141 ~1963!.
62J. B. Dingwell, J. P. Cusumano, D. Sternad, and P. R. Cavanagh, ‘‘ULyapunov exponents to quantify dynamic stability during continuooverground locomotion,’’ inProceedings of the Third North AmericaCongress on Biomechanics~University of Waterloo, Waterloo, OntarioCanada, 1998!, pp. 125–126.
63M. J. Pavol, T. M. Owings, K. T. Foley, and M. D. Grabiner, ‘‘The seand age of older adults influence the outcome of induced trips,’’ J. Gontol. A Biol. Sci. Med. Sci.54~2!, M103–M108~1999!.
64M. J. Pavol, T. M. Owings, K. T. Foley, and M. D. Grabiner, ‘‘Gacharacteristics as risk factors for falling from trips induced in oldadults,’’ J. Gerontol. A Biol. Sci. Med. Sci.54~11!, M583–M590~1999!.
65N. Bernstein,The Coordination and Regulation of Movements~Pergamon,New York, 1935!.
66R. J. Full and D. E. Koditschek, ‘‘Templates and anchors: Neuromechcal hypothesis of legged locomotion,’’ J. Exp. Biol.202~23!, 3325–3332~1999!.
67S. Ellner and P. Turchin, ‘‘Chaos in a noisy world: New methods aevidence from time-series analysis,’’ Am. Nat.145~3!, 343–375~1995!.
AIP copyright, see http://ojps.aip.org/chaos/chocpyrts.html.