nonlinear finite element analysis of non- … · ajstd vol. 24 issue 4 pp. 369-386 (2007) nonlinear...
TRANSCRIPT

AJSTD Vol. 24 Issue 4 pp. 369-386 (2007)
NONLINEAR FINITE ELEMENT ANALYSIS OF NON-
SEISMICALLY DETAILED INTERIOR RC BEAM-COLUMN
CONNECTION UNDER REVERSED CYCLIC LOAD
Teeraphot Supaviriyakit, Amorn Pimanmas
Sirindhorn International Institute of Technology,
Thammasat University, Pathumthani 12121, Thailand
Pennung Warnitchai
School of Civil Engineering,
Asian Institute of Technology, Pathumthani 12120, Thailand
Received 05 June 2006
ABSTRACT
This paper presents a nonlinear finite element analysis of non-seismically detailed RC beam-
column connections under reversed cyclic load. The test of half-scale nonductile reinforced
concrete beam-column joints was conducted. The tested specimens represented those of the
actual mid-rise reinforced concrete frame buildings designed according to the non-seismic
provisions of the ACI building code. The test results show that specimens representing small
and medium column tributary area failed in brittle joint shear while specimen representing large
column tributary area failed by ductile flexure though no ductile reinforcement details were
provided. The nonlinear finite element analysis was applied to simulate the behavior of the
specimens. The finite element analysis employs the smeared crack approach for modeling beam,
column and joint, and employs the discrete crack approach for modeling the interface between
beam and joint face. The nonlinear constitutive models of reinforced concrete elements consist
of coupled tension-compression model to model normal force orthogonal and parallel to the
crack and shear transfer model to capture the shear sliding mechanism. The FEM shows good
comparison with test results in terms of load-displacement relations, hysteretic loops, cracking
process and the failure mode of the tested specimens. The finite element analysis clarifies that
the joint shear failure was caused by the collapse of principal diagonal concrete strut.
Keywords: Beam-column connection, nonlinear analysis, reversed cyclic load, joint shear
failure, diagonal compressive strut, reinforced concrete plate element
1. INTRODUCTION
Although many cities in South East Asia are considered as being located in low to moderate
seismic zone due to a relatively long distance from active earth faults, they are not absolutely
exempt from seismic hazard. Bangkok, for example, is founded on a soft basin of marine clay of
several ten-meter depths. This soil characteristic has a potential to amplify the seismic wave up
to 3 - 4 times [1]. The soft ground condition is quite similar to that of Mexico City, which was
Corresponding author e-mail: [email protected]
Teeraphot Supaviriyakit, et al Nonlinear finite element analysis of non-seismically...
370
devastated by 1985 Mexico earthquake with almost 10,000 death toll. Recently, the 2004
Sumatra earthquake in Andaman Sea recorded at a magnitude of 9.3 on Richter Scale, caused
violent shaking of many high rises in Bangkok though the epicenter was more than 800
kilometer far away. The quake has prompted a serious public concern on seismic safety of
buildings. Many tall buildings, though not designed for seismic loads, usually have shear walls
to resist wind forces, and consequently may not be vulnerable to the overall collapse under the
earthquake [2, 3]. On the contrary, many low-rise and mid-rise buildings of up to 10 stories are
rigid frame without shear walls. The frame structures mainly resist lateral forces through
bending of beams and columns. Most of these frame structures were designed for gravity load
only according to the American Concrete building code (ACI) in Thailand and British code (BS)
in Singapore and Malaysia [4].
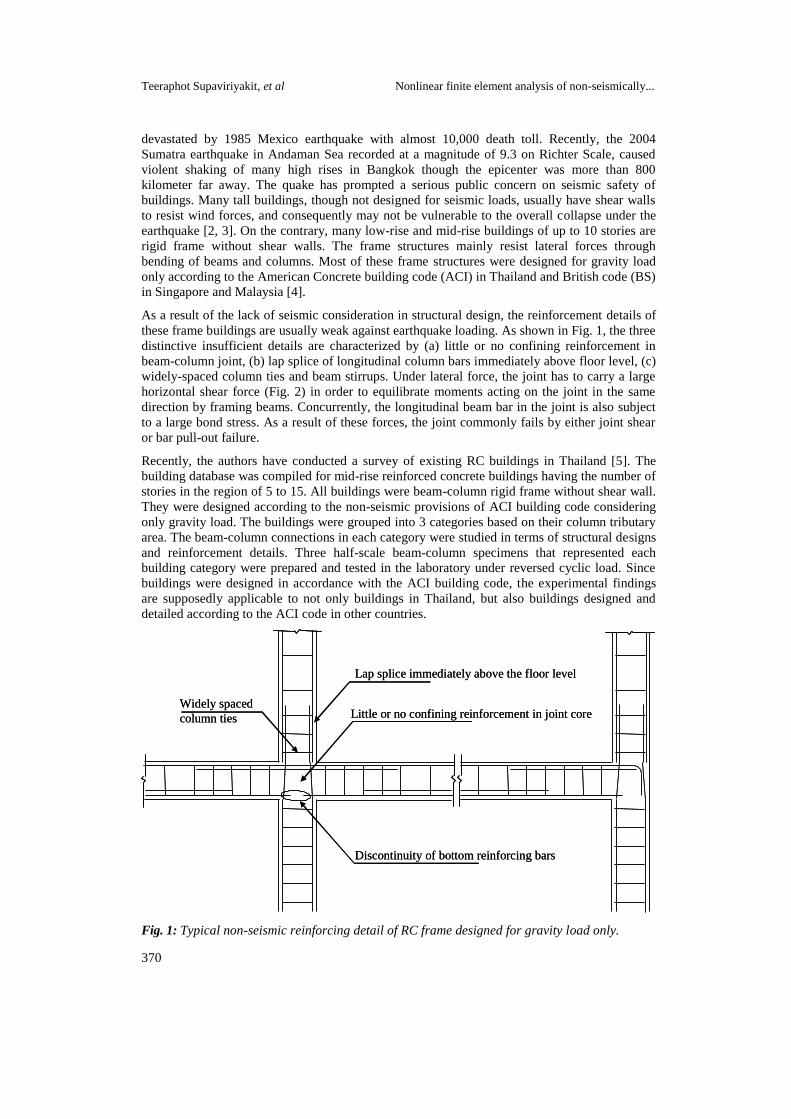
As a result of the lack of seismic consideration in structural design, the reinforcement details of
these frame buildings are usually weak against earthquake loading. As shown in Fig. 1, the three
distinctive insufficient details are characterized by (a) little or no confining reinforcement in
beam-column joint, (b) lap splice of longitudinal column bars immediately above floor level, (c)
widely-spaced column ties and beam stirrups. Under lateral force, the joint has to carry a large
horizontal shear force (Fig. 2) in order to equilibrate moments acting on the joint in the same
direction by framing beams. Concurrently, the longitudinal beam bar in the joint is also subject
to a large bond stress. As a result of these forces, the joint commonly fails by either joint shear
or bar pull-out failure.
Recently, the authors have conducted a survey of existing RC buildings in Thailand [5]. The
building database was compiled for mid-rise reinforced concrete buildings having the number of
stories in the region of 5 to 15. All buildings were beam-column rigid frame without shear wall.
They were designed according to the non-seismic provisions of ACI building code considering
only gravity load. The buildings were grouped into 3 categories based on their column tributary
area. The beam-column connections in each category were studied in terms of structural designs
and reinforcement details. Three half-scale beam-column specimens that represented each
building category were prepared and tested in the laboratory under reversed cyclic load. Since
buildings were designed in accordance with the ACI building code, the experimental findings
are supposedly applicable to not only buildings in Thailand, but also buildings designed and
detailed according to the ACI code in other countries.
Little or no confining reinforcement in joint core
Lap splice immediately above the floor level
Discontinuity of bottom reinforcing bars
Widely spaced
column ties Little or no confining reinforcement in joint core
Lap splice immediately above the floor level
Discontinuity of bottom reinforcing bars
Widely spaced
column ties
Fig. 1: Typical non-seismic reinforcing detail of RC frame designed for gravity load only.

AJSTD Vol. 24 Issue 4
371
BeamC'c
Vc
T
Cs
Column
C's
CcT'
Vj
BeamC'c
Vc
T
Cs
Column
C's
CcT'
Vj
Fig. 2: Horizontal shear force in joint core.
The experiment showed a sudden shear failure in the joint region of specimen representing
connection of buildings with small and medium column tributary area (9 - 30 m2) and ductile
flexural failure of beam sections near the joint in the specimen representing connection of
building with large column tributary area (40 - 48 m2). In this paper, the authors presented the
nonlinear finite element method as a tool to simulate reversed cyclic behaviors of these
specimens. The beam-column joint specimens are modeled with two-dimensional plane stress
elements in line with the smeared crack approach. The interface between beam and column is
modeled with one-dimensional discrete joint element to simulate reinforcement pull-out. The
finite element method is used to investigate the cracking process, the failure mode, the global
load-displacement behavior and the principal load resistant mechanism.
2. NONLINEAR FINITE ELEMENT ANALYSIS OF REINFORCED CONCRETE
(RC) INTERIOR BEAM-COLUMN CONNECTION
2.1 Finite element model
Figure 3 illustrates a finite element model of a typical reinforced concrete (RC) interior beam-
column connection of a rigid frame. The cruciform-shaped specimen is normally preferred for
laboratory testing. It consists of the beam-column joint core with beams and columns extending
horizontally and vertically to their mid-length where moments are assumed to be zero, i.e., point
of inflection. The beam, column and beam-column regions are modeled with two-dimensional
8-node plane stress RC elements as shown in Fig. 4(a). The interfaces between beam and
column are modeled with one-dimensional 6-node joint element as shown in Fig. 4(b).
The two-dimensional reinforced concrete element is constructed by combining the constitutive
laws of concrete and reinforcing bar. Here, cracks and reinforcing bars are assumed to be
distributed or smeared over the entire element. The bond between concrete and reinforcement is
considered to be perfect, that is, concrete and reinforcement are subject to identical strains
throughout the entire loading. The total stress carried by the reinforced concrete element is the
sum of concrete and reinforcement stresses. In the smeared crack approach, the constitutive
models of reinforcement and concrete are formulated in terms of relations between average
stress and average strain as follows,

Teeraphot Supaviriyakit, et al Nonlinear finite element analysis of non-seismically...
372
rc,rrc,crc,T (1)
),,(g),,(f,, xyyxrcxyyxrcxyyxrc,T (2)
Where rc,crc,T , and rc,r are total stresses, concrete stresses and reinforcement stresses
of RC plate element, respectively, xyyx ,, and xyyx ,, are global stress and strain,
respectively, rcf and rcg represent constitutive laws of concrete and reinforcement, respectively.
One-dimensional discrete
joint element
Two-dimensional RC
plate element
One-dimensional discrete
joint element
Two-dimensional RC
plate element
Fig. 3: Typical finite element model of RC interior beam-column connection.
y,y
x,x
xy,xy
y,y
x,x
xy,xy
,
n,
,
n,
(a) Two-dimensional RC plate element (b) One-dimensional discrete joint element
Fig. 4: Two-dimensional plate element and one dimensional joint element.
The joint element is one-dimensional with zero thickness. It represents the interface between
two elements with different sectional stiffness where local discontinuities, such as reinforcement

AJSTD Vol. 24 Issue 4
373
pull-out may occur. Similar to two-dimensional RC plate element, the total stresses of the joint
element are the sum of concrete and reinforcement stresses. However, the constitutive laws of
the joint element are formulated in terms of average stresses and relative displacements, i.e.,
crack opening and sliding.
jo,rjo,cjo,T (3)
),(g),(f, jojonjo,T (4)
Where jo,cjo,T , and jo,r are total stresses, concrete and reinforcement stresses of RC
joint element, respectively. ,n is the vector of joint normal and shear stress, , is the
vector of joint opening and sliding and, jof and jog represent constitutive laws of concrete and
reinforcement of joint element, respectively.
Essentially, the constitutive laws for plate and joint element describe the same physical
behaviors of concrete and reinforcement. However, the kinematic variables used in the
constitutive formulations are different as previously explained.
The constitutive laws of concrete consist of the compressive stress model under crack closure,
the tensile stress model upon crack opening and the shear stress model upon crack sliding (Fig.
5). The constitutive law of reinforcement includes the elastic-hardening model under tensile
yielding and elasto-plastic model under compressive yielding. These laws represent major non-
linearity of reinforced concrete. The combined nonlinearity of all elements subject to different
stress states constitutes the entire nonlinear behavior of the specimen. In the next section, only
the average stress-average strain constitutive laws of the RC plate element are presented.
2.2 Constitutive models of concrete and reinforcing bars
2.2.1 Cracked concrete
The local strains of cracked concrete are defined with respect to the crack axis. They consist of
strain normal to a crack, strain parallel to a crack and the shear strain along a crack face as
shown in Fig. 5. Input variables for constitutive laws are local strains defined above as well as
relevant path-dependent parameters. The constitutive laws are formulated for both envelope and
hysteretic loops. Under cyclic load, two sets of diagonal cracks are generated and alternate
opening and closing in accordance with the load direction. At any load step, however, only a set
of crack is active and principally contributes the nonlinearity of the element. The active crack is
defined as the one that has the largest normal tensile strain. The constitutive laws are expressed
with respect to the active crack. In the following, the three previously mentioned constitutive
laws are described.
TensionCompression
t t
c c
cr cr
TensionCompression
t t
c c
cr cr
Fig. 5: Local stresses and strains of cracked concrete.

Teeraphot Supaviriyakit, et al Nonlinear finite element analysis of non-seismically...
374
(a) Combined compression-tension model for normal stress orthogonal and parallel to a crack
The constitutive law for computing normal stress orthogonal and parallel to a crack is shown in
Fig. 6. On the tensile side, the model covers both tension softening and tension stiffening
behavior. After crack occurs, the tensile stress sharply drops in the un-reinforced element while
it gradually decreases in the reinforced element as a result of bond between concrete and steel
bar. To represent both behaviors under the same formulation, the following equation is adopted
for concrete tensile stress.
c
t
tu
tt f
(5)
where t, t is the tensile stress and strain orthogonal to a crack, ft is the concrete tensile
strength, tu is the cracking strain, c is a softening/stiffening parameter. By varying the
parameter c, the above model can cover both softening and stiffening behavior. In this paper, the
parameter c is set to 2.0 and 0.4 for un-reinforced and reinforced elements to represent softening
and stiffening behavior respectively (Fig. 7).
Elasto-plastic fracture model
for compression side
Tension stiffening / softening model
for tensile side
(c,fc' )
c
f 'c
(p ,0)
ft
ctut = ft
c = K0 Ec0(-p )
p = p()
K0 = K0()
f 'c
Ec0
K0 Ec0
Elasto-plastic fracture model
for compression side
Tension stiffening / softening model
for tensile side
(c,fc' )
c
f 'c
(p ,0)
ft
ctut = ft
c = K0 Ec0(-p )
p = p()
K0 = K0()
f 'c
Ec0
K0 Ec0
Fig. 6: Combined compression-tension model for normal stress parallel and orthogonal to a
crack.
To compute the compressive stress parallel to a crack, the following elasto-plastic fracture
model [6] is used
)(EK pc0c0c (6)
where c, c is the compressive stress and strain parallel to a crack, is transverse tensile
strain factor, K0 is the fracture parameter, Ec0 is the initial stiffness and p is the compressive
plastic strain. The fracture parameter (K0) and compressive strain (p) are the key parameters of
the model. They are empirically formulated as [6].

AJSTD Vol. 24 Issue 4
375
cc
0 25.1exp173.0expK (7)
cc
p 35.0exp17
202 (8)
where is the concrete strain at peak compressive strength.
The model combines the nonlinearity caused by plasticity through plastic strain and fracturing
damage through fracture parameter. These parameters account for the permanent deformation
and irrecoverable loss of elastic strain energy, respectively. In addition, the concrete
compressive strength is reduced owing to the presence of transverse tensile strain [6 - 8]. This is
taken into account by an additional damage factor () in equation 6. The relation between and
transverse tensile strain is shown in Fig. 8.
Tensile strain t(%)
Norm
ali
zed
ten
sile
str
ess
c = 0.4
tt f/
c = 2.0
1.2
1.0
0.8
0.6
0.4
0.2
0
0 0.1 0 .2 0.3 0.4
Tensile strain t(%)
Norm
ali
zed
ten
sile
str
ess
c = 0.4
tt f/ tt f/
c = 2.0
1.2
1.0
0.8
0.6
0.4
0.2
0
0 0.1 0 .2 0.3 0.4
Fig. 7: Tension softening and stiffening model. Fig. 8: Relation between and transverse
tensile strain t).
(b) Shear stress transfer model
For computing shear stress transmitted along a crack face, the contact density model [6] is
adopted as shown in Fig. 9. The equation of the shear envelope may be expressed as,
2
2
stcr1
f
(9)
where fst is interface shear strength along the crack and may be expressed as,
3/1
cst f8.3f , Mpa (10)
is the normalized shear strain defined as,
t
cr
(11)
2.2.2 Model of reinforcing bar
Local strains of reinforcing bar are defined with respect to the bar axis. For reinforcing steel,
local yielding at the vicinity of cracks has to be taken into account in the constitutive

Teeraphot Supaviriyakit, et al Nonlinear finite element analysis of non-seismically...
376
formulation. Since reinforcement sections close to cracks are subject to yielding first whereas
others are still elastic, that is, all reinforcement sections are not simultaneously yielding
throughout the entire length. This causes the apparent reduction in the average yield strength of
reinforcing bars. The average yield strength of reinforcing bars embedded in concrete may be
expressed as [9],
2
fff t
yy (12)
Where yf = average yield strength of reinforcing bar embedded in concrete, fy is the yield
strength of bare bar, ft is the tensile strength of concrete and is the reinforcement ratio.
t
cr =
1+fst
0.85
cr=
cr
2
2
t
cr =
1+fst
0.85
cr=
cr
2
2
Fig. 9: Shear stress transfer model.
Es
fy = Yield strength of bare bar
fy
fy
(12y,,1.1 fy )
y y
fy = Yield strength of bar embedded in concrete
-fy
Es
fy = Yield strength of bare bar
fy
fy
(12y,,1.1 fy )
y y
fy = Yield strength of bar embedded in concrete
-fy
Fig. 10: Modeling of reinforcing bar.

AJSTD Vol. 24 Issue 4
377
The model of reinforcing bar for both envelope and hysteretic loops [6] is shown in Fig. 10. The
figure also shows that of bare bar for comparison.
3. NUMERICAL SIMULATION OF RC BEAM-COLUMN CONNECTION
3.1 Test of non-seismically detailed interior beam-column connection
The authors conducted the reversed cyclic test of three half scale interior beam-column joint
specimens. These specimens represented those of actual buildings designed and detailed
according to the non-seismic provisions of ACI building code. The database of ten reinforced
concrete mid-rise buildings in Bangkok was compiled. These buildings have 5 - 15 stories and
were constructed as reinforced concrete frame without shear wall. The types of buildings cover
university, school, apartment and hospital. The buildings were grouped into three categories
based on column tributary area (Fig. 11), as buildings with large, medium and small column
tributary area. Based on the collected data, the area range is set to 40 - 48 m2, 20 - 30 m
2 and 9 -
18 m2 for large, medium and small category, respectively. In order to characterize the structural
behavior of beam-column connection, the structural indices were defined for beam, column and
beam-column joint. The structural indices of beam included tension and compression
reinforcement ratio, shear span-to-depth ratio, flexural capacity-to-shear capacity ratio,
transverse reinforcement ratio. The structural indices of column included axial force ratio, shear
span-to-depth ratio, flexural capacity-to-shear capacity ratio, longitudinal reinforcement ratio,
transverse reinforcement ratio. The structural indices of beam-column joint included column
depth-to-bar diameter ratio, column width-to-beam width ratio, column depth-to-beam depth
ratio, confinement reinforcement index, column flexural capacity-to-beam flexural capacity
ratio, joint shear-to-joint shear strength ratio.
Large tributary area40-48
Medium tributary area20-30
Small tributary area9-18
CategoryArea (m2)
Large tributary area40-48
Medium tributary area20-30
Small tributary area9-18
CategoryArea (m2)
Fig. 11: Definition of column tributary area.
These structural indices were calculated for each building in each category. Three half-scale
beam-column specimens, namely, JL, JM and JS were constructed to represent those of each
building category. The structural indices of these specimens were designed to be as close as
possible to the mean values calculated from the actual building in each category. The
reinforcement details and the construction methods were also as similar as possible to the actual
construction. The specimen dimensions and reinforcement details are illustrated in Figs. 12 - 13.
The 12 mm diameter reinforcing bar was used as longitudinal reinforcements in beam and

Teeraphot Supaviriyakit, et al Nonlinear finite element analysis of non-seismically...
378
column. The average tested yield and tensile strengths of the bar were 499 and 615 MPa,
respectively. The 3 mm diameter plain mild steel was used as transverse reinforcements in beam
and column. The tested yield and tensile strengths of the bar were 291 and 339 MPa,
respectively. The average tested cylindrical compressive strength of concrete was 26.7 MPa.
53
0
15001500
C
C
900
B
BAA
3-RB5@50
450
4-BOLTS M20
6-RB5 @ 50
2 PC strands of 15.2 mm-diameter
740 No Transverse reinforcements
in joint core
53
053
0
15001500
C
C
900
B
BAA AAA
3-RB5@50
450
4-BOLTS M20
6-RB5 @ 50
2 PC strands of 15.2 mm-diameter
740
740 No Transverse reinforcements
in joint core
6-RB6@50
3-RB6@50
53
0
15001500
C
C
900
B
BAA
3-RB5@50
450
4-BOLTS M20
6-RB5 @ 50
2 PC strands of 15.2 mm-diameter
740 No Transverse reinforcements
in joint core
53
053
0
15001500
C
C
900
B
BAA AAA
3-RB5@50
450
4-BOLTS M20
6-RB5 @ 50
2 PC strands of 15.2 mm-diameter
740
740 No Transverse reinforcements
in joint core
6-RB6@506-RB6@50
3-RB6@50
Fig. 12: Geometry, dimension and reinforcement of all specimens (unit: mm).
400
300
26-DB12
STIRRUP
4-3 @ 0
SECTION A-A
400
300
26-DB12
STIRRUP
4-3 @ 0
SECTION A-A
350
200
18-DB12
STIRRUP
3-3 @ 0
SECTION A-A
350
200
18-DB12
STIRRUP
3-3 @ 0
SECTION A-A
300
200
24-DB12
STIRRUP
3- @ 0
SECTION A-A
300
200
24-DB12
STIRRUP
3- @ 0
SECTION A-A
300
200
SECTION B-B
6-DB12
STIRRUP
3-3@100
4-DB12
300
200
SECTION B-B
6-DB12
STIRRUP
3-3@100
4-DB12
30
0
175
6-DB12
STIRRUP
3-3@100
4-DB12
SECTION B-B
30
0
175
6-DB12
STIRRUP
3-3@100
4-DB12
SECTION B-B
30
0
175
SECTION B-B
8-DB12
STIRRUP
3-3@100
6-DB12
30
0
175
SECTION B-B
8-DB12
STIRRUP
3-3@100
6-DB12
300
200
SECTION C-C
6-DB12
STIRRUP
3-3@100
6-DB12
300
200
SECTION C-C
6-DB12
STIRRUP
3-3@100
6-DB12
300
175
SECTION C-C
6-DB12
STIRRUP
3-3@100
6-DB12
300
175
SECTION C-C
6-DB12
STIRRUP
3-3@100
6-DB12
300
175
SECTION C-C
8-DB12
STIRRUP
3-3@100
8-DB12
300
175
SECTION C-C
8-DB12
STIRRUP
3-3@100
8-DB12
Member Specimen JL Specimen JM Specimen JS
Column
section
Beam
section
Beam
section
Beam
section
Fig. 13: Cross section of beams and columns (unit: mm) .

AJSTD Vol. 24 Issue 4
379
The test set-up and boundary conditions are shown in Fig. 14. The lateral forced displacement
was applied at the top of the column through a 500 kN hydraulic actuator. The ends of beam
were supported by rollers that allowed free horizontal movement to simulate lateral drift. The
bottom end of the column was supported by a hinge which allowed no movement in all
directions. The axial load of 12.5% of column axial capacity was applied to the column by
means of vertical prestressing. The column was pushed forward and pulled backward in a
reversed cyclic pattern with the target lateral drifts of 0.25, 0.50, and 0.75%… as shown in Fig.
15. The target loop was repeated twice for each drift level. The load was continued until and
beyond the peak load to trace the post-peak behavior. The experimental results shall be
presented and discussed in conjunction with the numerical analysis in the next section.
Fig. 14: Laboratory test set-up.
Dri
ft %
-4
-3
-2
-1
5
4
3
2
0
1
-5
Cyclic Number
1 2 3 4 5 6 7 81 2 3 4 5 6 7 8
Cyclic number
Lat
eral
dri
ft %
2 4 6 8 10 12 14 16
Dri
ft %
-4
-3
-2
-1
5
4
3
2
0
1
-5
Cyclic Number
1 2 3 4 5 6 7 81 2 3 4 5 6 7 8
Cyclic number
Lat
eral
dri
ft %
2 4 6 8 10 12 14 16
Dri
ft %
-2
Cyclic Number
81-5
32
-3
-4
64 5 7 109 11 12
0
-1
1
2
5
4
3
1 2 3 4 5 6 7 8 9 10 11 12
Cyclic number
Late
ral
dri
ft %
2 4 6 8 10 12 14 16 18 20 22 24
Dri
ft %
-2
Cyclic Number
81-5
32
-3
-4
64 5 7 109 11 12
0
-1
1
2
5
4
3
1 2 3 4 5 6 7 8 9 10 11 12
Cyclic number
Late
ral
dri
ft %
2 4 6 8 10 12 14 16 18 20 22 24
(a) Specimen JL (b) Specimen JM and JS
Fig. 15: Displacement history of each specimen.

Teeraphot Supaviriyakit, et al Nonlinear finite element analysis of non-seismically...
380
3.2 Finite element analysis
The typical finite element mesh of the specimen is shown in Fig. 3. For each specimen, the
mesh is composed of 733 nodes, 216 two-dimensional RC plate elements and 12 one-
dimensional joint elements. Loads acting on specimens include self-weight, column axial load
and horizontal forced displacement. The comparison between experiment and analysis is given
Table 1. The failure is defined as the point where the applied load drops more than 80%.
The analytical deformed shape and cracking pattern of specimen JL are compared with the
experimental results in Fig. 16. The FEM demonstrates extensive deformation at the ends of
beam framing into the joints, indicating flexural failure. The evident opening of the discrete
joint element indicates pull-out of beam reinforcing bars. The FEM also shows concentration of
vertical cracks near the ends of beams. This crack pattern indicates that bending moments act on
the beam ends in the same direction. On the contrary, the FEM predicts little distortion and
cracking in the elements of the joint region. Hence failure does not originate from the joint.
Moreover, no major cracks are computed in the column adjacent to the joint core. The failure is
therefore categorized as ductile strong column-weak beam. In a building with large column
tributary area, the size of column is usually large whereas the span of beam is long. This
configuration leads to large column flexural capacity, high joint shear strength and low beam
flexural strength.
(a) Analytical deformation (b) Analytical cracking pattern
(c) Experiment
Fig. 16: Specimen JL at the end of test.
The comparison between analytical and experiment load versus applied displacement is shown
in Fig. 17. A reasonable match is obtained for both envelope and hysteretic loops. The
hysteretic loops are wide, indicating large energy dissipation. In the experiment, concrete
crushing and subsequent spalling occurred in the beam and consequently exposed longitudinal
and transverse reinforcements. This was followed by buckling of compression reinforcement.

AJSTD Vol. 24 Issue 4
381
The spalling and reinforcement buckling are not included in the present constitutive models,
hence the numerical loops are relatively wider than the experimental ones. The FEM predicts
ductile yielding with long yield plateau up to 4.6% drift which is the same as the experimental
value. It shall be noticed that the sub-standard beam-column joint in buildings with large
column tributary area is quite ductile though it was designed and detailed without considering
seismic loads in accordance with the ACI building code. The ductility can be enhanced by
providing closed stirrups near the beam’s end to prevent concrete spalling and reinforcement
buckling.
Story drift(%)
App
lied
load
forc
e (k
N)
Experimental
FEM
100
80
60
40
20
0
-20
-40
-60
-80
-100-6 -4 -2 0 2 4 6
Story drift(%)
App
lied
load
forc
e (k
N)
Experimental
FEM
Experimental
FEM
100
80
60
40
20
0
-20
-40
-60
-80
-100-6 -4 -2 0 2 4 6
App
lied
lat
eral
forc
e (k
N)
Story drift(%)
App
lied
load
forc
e (k
N)
Experimental
FEM
100
80
60
40
20
0
-20
-40
-60
-80
-100-6 -4 -2 0 2 4 6
Story drift(%)
App
lied
load
forc
e (k
N)
Experimental
FEM
Experimental
FEM
100
80
60
40
20
0
-20
-40
-60
-80
-100-6 -4 -2 0 2 4 6
App
lied
lat
eral
forc
e (k
N)
Fig. 17: Relationship between applied load and displacement of Specimen JL.
The analytical deformed shape and cracking pattern of specimen JM and JS are compared with
experimental results in Figs. 18 and 20, respectively. In contrast to specimen JL, the mesh of JM
and JS is extremely distorted, showing large shear deformation in the joint region. The
analytical cracks are mostly inclined and concentrated in the joint zone. Two sets of intersecting
diagonal cracks alternate opening and closing in accordance with the change in the load
direction. These cracks form the dominant X-shape pattern. The analytical joint damage and
development of diagonal cracks closely follow experimental results. Some small flexural cracks
are computed in the beams and columns but do not cause the failure. The failure originates from
the joint zone as a result of excessive joint shear force.
The comparison between experimental and numerical load versus applied displacement relation
is shown in Figs. 19 and 21 for specimen JM and JS, respectively. The maximum experimental
drifts at peak load are 1.75 and 1.5% for specimens JM and JS, respectively. The corresponding
computed drifts are 2.0 and 1.5%, respectively. The hysteretic loops are narrow and pinched
towards the origin, indicating small energy dissipation. This may be associated with sliding of
diagonal cracks in the joint. However, the analytical loops are wider than experimental ones.
This is supposedly caused by the concrete spalling in the joint area which is not included in the
present analytical model. It is also observed that the attained lateral drift tends to be smaller for
substandard beam-column joint in RC frame with smaller tributary column. This is probably
because the frame is likely to have smaller column dimensions, just sufficient to carry gravity
load.
The joint shear failure is undesirable because it is brittle and catastrophic. The tendency of
brittleness is more evident for beam-column connection with smaller column tributary area. To
analytically identify the failure mechanism of the joint region, the principal compressive stresses

Teeraphot Supaviriyakit, et al Nonlinear finite element analysis of non-seismically...
382
of concrete are computed from the FEM stress outputs. The development of compressive struts
is compared among the three analyzed specimens in Fig. 22.
(a) Analytical deformation (b) Analytical cracking pattern
(c) Experiment
Fig. 18: Specimen JM at the end of test.
Story drift(%)
-6 -4 -2 0 2 4 6
80
60
40
20
0
-20
-40
-60
-80
Experimental
FEM
Ap
pli
ed
lo
adfo
rce (k
N)
Story drift(%)
-6 -4 -2 0 2 4 6
80
60
40
20
0
-20
-40
-60
-80
Experimental
FEM
Experimental
FEM
Ap
pli
ed
lo
adfo
rce (k
N)
Ap
pli
ed l
ater
al
forc
e (k
N)
Story drift(%)
-6 -4 -2 0 2 4 6
80
60
40
20
0
-20
-40
-60
-80
Experimental
FEM
Ap
pli
ed
lo
adfo
rce (k
N)
Story drift(%)
-6 -4 -2 0 2 4 6
80
60
40
20
0
-20
-40
-60
-80
Experimental
FEM
Experimental
FEM
Ap
pli
ed
lo
adfo
rce (k
N)
Ap
pli
ed l
ater
al
forc
e (k
N)
Fig. 19: Relationship between applied load and displacement of Specimen JM.
Before peak, the formation of compressive strut is dominant in all specimens. As the lateral drift
increases, the compressive stress rapidly intensifies in specimen JS. The collapse of
compressive struts generally coincides with the failure point of the specimens. As for specimen

AJSTD Vol. 24 Issue 4
383
JL, the compressive strut is maintained throughout the entire loading. At 4.6% drift when failure
took place, the strut remains stable, indicating that the joint is sound and does not cause failure.
This observation agrees with the experimental result. This analytical results show that the
diagonal strut formation is the principal load resistant mechanism for the joint of specimens JM
and JS and the beam flexural yielding is the main load resistant mechanism for specimen JL.
(a) Analytical deformation (b) Analytical cracking pattern
(c) Experiment
Fig. 20: Specimen JS at the end of test.
Story drift(%)
80
60
40
20
0
-20
-40
-60
-80-6 -4 -2 0 2 4 6
Experimental
FEM
Appli
ed l
oad
forc
e (k
N)
Story drift(%)
80
60
40
20
0
-20
-40
-60
-80-6 -4 -2 0 2 4 6
Experimental
FEM
Experimental
FEM
Appli
ed l
oad
forc
e (k
N)
App
lied
lat
eral
forc
e (k
N)
Story drift(%)
80
60
40
20
0
-20
-40
-60
-80-6 -4 -2 0 2 4 6
Experimental
FEM
Appli
ed l
oad
forc
e (k
N)
Story drift(%)
80
60
40
20
0
-20
-40
-60
-80-6 -4 -2 0 2 4 6
Experimental
FEM
Experimental
FEM
Appli
ed l
oad
forc
e (k
N)
App
lied
lat
eral
forc
e (k
N)
Fig. 21: Relationship between applied load and displacement of Specimen JS.

Teeraphot Supaviriyakit, et al Nonlinear finite element analysis of non-seismically...
384
Specimen JL Specimen JM Specimen JS
(a) 0.25% drift
(a) 0.25% drift
(a) 0.25% drift
(b) 0.75% drift
(b) 0.75% drift
(b) 0.75% drift
(c) 1.25% drift
(c) 1.25% drift
(c) 1.25% drift
(d) 5.00% drift
(d) 5.00% drift
(d) 5.00% drift
Fig. 22: Principal compressive stresses (unit: MPa) of each specimen.
4. CONCLUSION
The paper presents the non-linear finite element analysis as a tool to evaluate the reversed cyclic
behavior of sub-standard RC beam-column connections in mid-rise frame building designed and
detailed according to the non-seismic provisions of ACI building code in low to moderate
seismic region. The finite element analysis includes the nonlinearity of cracked concrete in
tension, compression and shear and yielded reinforcement in line with the smeared crack
approach. It is shown that the FEM can satisfactorily reproduce the load-displacement envelope
as well as hysteretic loops of the tested specimens. As for the failure mode, the finite element

AJSTD Vol. 24 Issue 4
385
analysis predicts a ductile beam flexural failure for specimen JL representing actual frame with
large column tributary area, and brittle joint shear failure for specimens JM and JS representing
actual frame with small and medium column tributary area. The collapse of compressive
diagonal strut is verified to be the principal failure mechanism. The analytical failure modes,
damage zones and cracking process compare well with the experimental results. However, the
analytical hysteretic loops are comparatively wider than experimental ones since the
nonlinearity due to concrete spalling and reinforcement buckling has not been taken into
account in the present analysis.
Table 1: Comparison between analytical(FEM) and experimental force and displacement (drift)
relations.
Specimen Force / Drift FEM analysis Experiment
JL Maximum force (kN) 90 92
Drift (%) 4.6 4.6
JM Maximum force (kN) 73 72
Drift (%) 2.0 1.75
JS Maximum force (kN) 70 68
Drift (%) 1.5 1.5
ACKNOWLEDGEMENT
The authors are very grateful to Thailand Research Fund (TRF) for providing the research fund
RMU4880022 to carry out the research.
REFERENCES
1. Warnitchai, P. (2004), Development of seismic design requirements for buildings in
Bangkok against the effects of distant large earthquakes. Proceedings of the 13th World
Conference on Earthquake Engineering, Vancouver.
2. Aoyama, H. (1981), Amethod for the evaluation of the seismic capacity of existing RC
buildings in Japan. Bulletin of the NZ National Society for Earthquake Engineering, pp.
105-130.
3. Fintel, M. (1991), Shear walls-an answer for seismic resistance?. Construction International,
pp. 48-53.
4. Bing, L. and Tso-Chien, P. (2004), Seismic performance of reinforced concrete frames
under low intensity earthquake effects. Proceedings of the 13th World Conference on
Earthquake Engineering, Vancouver.
5. Warnitchai, P., Pimanmas, A., and Thinth, D.T. (2004), Seismic performance of RC sub-
assemblages with non-seismic reinforcement details. Proceedings of the First Asian
Conference for Earthquake Engineering, Phillipines.
6. Maekawa, K., Pimanmas, A., and Okamura, H. (2003), Nonlinear mechanics of reinforced
concrete. Son Press.
7. Vecchio, F.J. and Collins, M.P. (1986), The modified compression field theory for
reinforced concrete elements subjected to shear. ACI Structural Journal, vol. 83(2), pp. 219-
231.

Teeraphot Supaviriyakit, et al Nonlinear finite element analysis of non-seismically...
386
8. Vecchio, F.J. and Collins, M.P. (1988), Predicting the response of reinforced concrete
beams subjected to shear using the modified compression field theory. ACI Structural
Journal, vol. 85(4), pp. 258-268.
9. Salem, H. and Maekawa, K. (2002), Spatially averaged tensile mechanics for cracked
concrete and reinforcement under highly inelastic range, J Materials Conc Struct
Pavements, JSCE, vol. 613(42), pp. 227-293.