non-vodcast problem eric liu june 10, 2007 chemistry ap
TRANSCRIPT

Non-Vodcast Problem
Eric Liu
June 10, 2007
Chemistry AP

The Question: 1988 D
Part A Part B Part C Part D
This is an “essay”-type problem. Be sure to keep your words clear
and concise.
A 30.00 milliliter sample of a weak monoprotic acid was titrated with a standardized solution of NaOH. A pH meter was used to measure the pH after each increment of NaOH was added, and the curve above was constructed.

The Question: Part AExplain how this curve could be used to determine the molarity of the acid.
Things to keep in mind: Keep your explanation precise and to the point! Answer the Question

The How-to: Part A
Step 1 Sketch the curve described in the question
This curve portrays a weak monoprotic acid, HA, being titrated with a strong base, NaOH. Therefore the equivalence point will be at a pH greater than 7.
Volume of “x” molar NaOH added
pH
7
0
Equivalence point
14
"half-way point"

The How-to: Part A
Step 2 At the equivalence point, the there should be equal
amounts (number of moles) of NaOH and monoprotic acid in solution. In other words, all the monoprotic acid will have reacted with the base.
Volume of “x” molar NaOH added
pH
7
0
Equivalence point
"half-way point"
14

The How-to: Part A Step 3
Since you know the molarity and volume of NaOH used at the equivalence point based on the curve, you can calculate the number of moles of base. This will correspond to the number of moles of monoprotic
acid in your sample (we’ll call it “y”).
Volume of “x” molar NaOH added
pH
7
0
Equivalence point
"half-way point"
14

The How-to: Part A
Step 4 Once you know the number of moles acid:
You can do the following calculation to find the original molarity of the acid, as you know your sample of acid was 30.00mL.
HAM
L
mLx
mLxmolesHAy __
1000
00.30
1''
Volume of “x” molar NaOH added
pH
7
0
Equivalence point
"half-way point"
14

The Question, cont.: Part B
Things to keep in mind: Info and work from Part A Answer the question
Explain how this curve could be used to determine the dissociation constant Ka of the weak monoprotic acid.
Volume of “x” molar NaOH added
pH
7
0
Equivalence point
"half-way point"
14

The How-to: Part B
Step 1 At the “half-way point” on the curve you drew from Part A,
half of the weak monoprotic acid has been titrated Therefore, [HA] = [A-]
Volume of “x” molar NaOH added
pH
7
0
Equivalence point
"half-way point"
14
OHAOHHA 2

The How-to: Part B
Step 2 The equilibrium expression for the dissociation of HA is:
As previously determined, at the “half-way” point: , so [H3O+] = Ka
Volume of “x” molar NaOH added
pH
7
0
Equivalence point
"half-way point"
14
OHAOHHA 32
][
]][[ 3
HA
OHAK a
1][
][
HA
A

The How-to: Part B
Step 3 Since you are given the pH at the “half-way point”, you can
calculate [H3O+]
Volume of “x” molar NaOH added
pH
7
0
Equivalence point
"half-way point"
14
][10
])log([#
])log([#
])log([
3#
3
3
3
OH
OH
OH
OHpH

The Question, cont.: Part C
Things to keep in mind: Explain your answer!
If you were to repeat the titration using an indicator in the acid to signal the endpoint, which of the following indicators should you select? Give the reason for your choice.
a. Methyl Red Ka = 1 x 10⁻⁵
b. Cresol Red Ka = 1 x 10⁻⁸
c. Alizarin Yellow Ka = 1 x 10-11
Volume of “x” molar NaOH added
pH
7
0
Equivalence point
"half-way point"
14
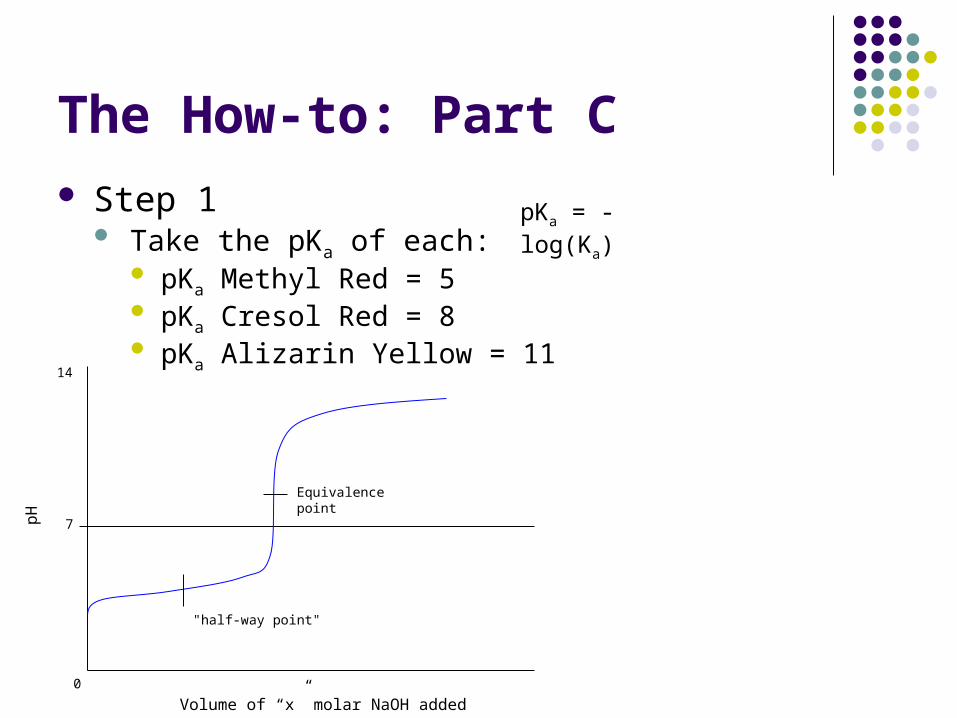
The How-to: Part C Step 1
Take the pKa of each: pKa Methyl Red = 5 pKa Cresol Red = 8 pKa Alizarin Yellow = 11
Volume of “x” molar NaOH added
pH
7
0
Equivalence point
"half-way point"
14
pKa = -log(Ka)

The How-to: Part C
Step 2 The equivalence point is closest to 8. Therefore,
one would choose Cresol Red as the appropriate indicator.
Volume of “x” molar NaOH added
pH
7
0
Equivalence point
"half-way point"
14

The How-to: Part C Step 3
The equilibrium expression for any indicator can be: where A- is the indicator ion. An indicator changes color when the equilibrium shifts from
one side to the other. When more of [A-] than [HA] becomes present, it changes color, and vice versa.
Volume of “x” molar NaOH added
pH
7
0
Equivalence point
"half-way point"
14
][
]][[ 3
HA
OHAK a
The How-to: Part C
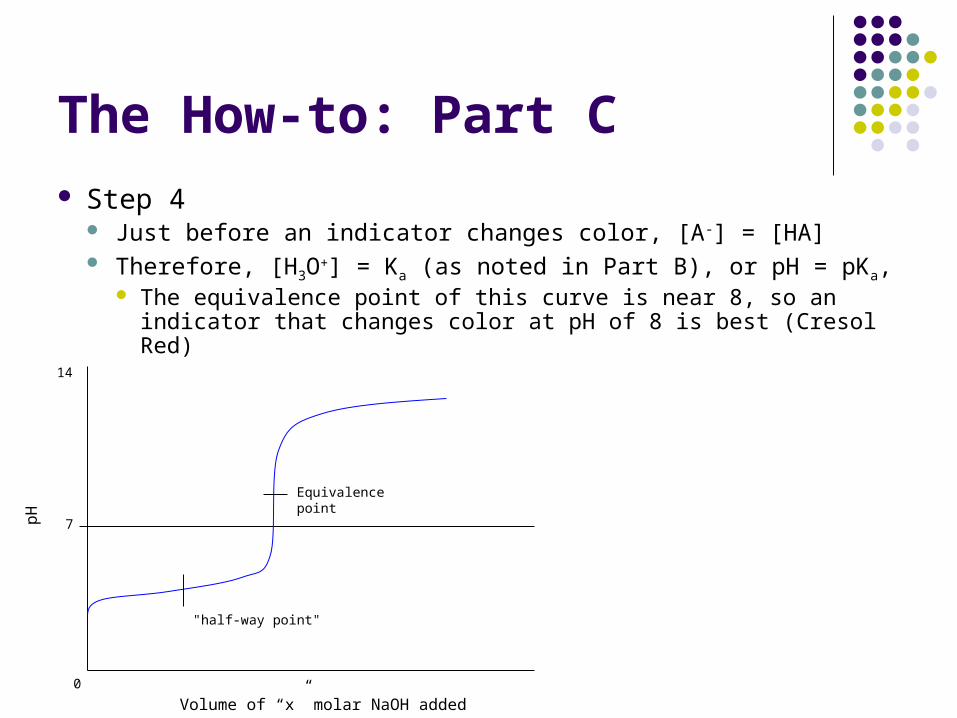
Step 4 Just before an indicator changes color, [A-] = [HA] Therefore, [H3O+] = Ka (as noted in Part B), or pH = pKa,
The equivalence point of this curve is near 8, so an indicator that changes color at pH of 8 is best (Cresol Red)
Volume of “x” molar NaOH added
pH
7
0
Equivalence point
"half-way point"
14

The Question, cont.: Part D
Things to keep in mind: Strong Acid vs. Strong Base Weak Acid vs. Strong Base
Sketch the titration curve that would result if the weak monoprotic acid were replaced by a strong monoprotic acid, such as HCl of the same molarity. Identify the differences between this titration curve and the curve shown above.
Volume of “x” molar NaOH added
pH
7
0
Equivalence point
"half-way point"
14

The How-to: Part D Step 1
Sketch the two graphs Differences:
The blue graph starts at a higher pH The blue graph has a shorter “steep slope” near the equivalence point
Volume of “x” molar NaOH added
pH
7
0
Equivalence point at >7
"half-way point"
14
Volume of “x” molar NaOH added
pH
7
0
14Weak Acid vs. Strong Base Strong Acid vs. Strong Base
Equivalence point at 7
‘y’ mL ‘y’ mL
Exaggerated slope increase

The Conclusion
You’ve just finished 1988 D of an actual Chemistry AP Test! Congrats.
