non-point source (nps) simulation in a tropical complex ... · department of soil science, ......
TRANSCRIPT

International Journal of Applied Environmental Sciences
ISSN 0973-6077 Volume 13, Number 2 (2018), pp. 145-160
© Research India Publications
http://www.ripublication.com
Non-Point Source (NPS) Simulation in a Tropical
Complex Catchment
J.H. Abdulkareem1, N.R. Jamil1* and W.N.A Sulaiman1
1 Department of Environmental Science, Faculty of Environmental Studies, Universiti Putra Malaysia (UPM), 43400 Serdang, Selangor, Malaysia.
2 Department of Soil Science, Institute for Agricultural Research/Faculty of Agriculture, Ahmadu Bello University, P.M.B 1044, Zaria, Nigeria.
*Corresponding author
Abstract
Non-point sources (NPSs) of pollution from different land uses is one the major
causes of environmental problem that leads to the degradation of water quality,
aquatic habitats and several other benefits associated with water resources.
Evaluating the potential contributions of different land uses in diffuse nutrient
export has been a major issue of concern in NPS pollution control and
management. Kelantan river basin is a tropical watershed that receives heavy
monsoon rainfall characterized with different land uses that are responsible for
threatening the water quality in the basin. A study was conducted to simulate
NPS pollutant loads by integrating geographic information system (GIS),
databases, as well as pollution loads in the area. To achieve this, four basins
namely; Galas, Nenggiri, Lebir and Pergau basins were extracted from ASTER
DEM. Runoff was calculated using rational equation. Total suspended solids
(TSS), total phosphorus (TP), total nitrogen (TN) and ammonia nitrogen (AN)
were selected along with their corresponding event mean concentration values
(EMC) for each land use was used in calculating NPS pollutant load. Land use
map (2013 land use) was classified into forest, paddy, agriculture, grassland,
urbanization, cleared land, mangrove swamp, secondary forest, rivers, ponds
and lakes and mining. The results indicated that highest runoff was recorded in
Nenggiri (4,492,251.11 kg/yr) while the lowest contribution was obtained from
Pergau (2,756,499.42 kg/yr). Higher pollutants loads are found in agricultural
land uses than in other land uses e.g. TSS under agricultural land use in in
Pergau (25516143.36 kg/yr) and in Lebir (42105618.85 kg/yr). Galas catchment
recorded the highest total TP load (263,628.61 kg/yr), followed by Lebir
(214,844.08 kg/yr), Nenggiri (212907.90 kg/yr) and Pergau (152521.59 kg/yr)
in that order. In all the four catchments, agricultural land use made the highest

146 J.H. Abdulkareem, N.R. Jamil and W.N.A Sulaiman
contribution of both TN and AN. This is largely due to high agricultural
activities observed across the watershed. Highest TN load was observed in
Galas (1899703.97 kg/yr) while the highest AN was observed in Nenggiri
(46352.11 kg/yr). The findings of this research call for the use of structural and
non-structural BMPs in controlling NPS pollutant load in the watershed.
Keywords: Non-point source pollution, land use, GIS, Kelantan, Malaysia
INTRODUCTION
In recent times, international attention has been given to non-point source (NPS)
pollution as a potential problem in environmental water management. Agriculture and
urbanization have been notoriously recognized as the major contributing sources of
NPS pollution (Basnyat et al., 2000; Ongley et al., 2010; Tang et al., 2005). NPS is
often caused by runoff from rainfall, atmospheric, deposition, seepage, drainage
problems or hydrologic changes in a watershed. The sources of NPS pollution is diverse
unlike that from industrial and sewage treatment plants which comes from the same
sources. Runoff from rainfall and melting snow carry along with them contaminants
from different sources known as NPS pollutants. These pollutants range from natural
to man-made pollutants which are usually deposited into water bodies by the runoff
water (EPA, 2017). In order to effectively manage a NPS pollutant, such as nutrient
loads from agricultural system, careful knowledge of the pollutant transport and
delivery pathways in the watershed system is required (Lai et al., 2011; Nikolaidis et
al., 2006).
Control measures of NPS pollution has been fully implemented in most watersheds in
the past. However, the issue of water quality deterioration is still posing a challenge
mainly due to deposition of NPS pollutants into water bodies. NPS pollution being not
from the same source are usually spatially deposited into water bodies by surface and
subsurface runoff from rainfall events and by irrigation return flows. NPS pollution is
a complex and difficult problem to detect, isolate and manage when compared with
point source pollution (Dzikiewicz, 2000; Lai et al., 2011; Ouyang et al., 2014). The
major NPS pollutants identified that causes significant pollutant loading to water bodies
and deteriorate their quality are suspended solids, nitrogen, phosphorus, fertilizers,
pesticides, herbicides as well as other organic and inorganic materials. Watershed
characteristics such as soil, topography and rainfall intensity have been proven to affect
the quantity and quality of NPS pollution (Lai et al. 2011).
In this study, complex NPS pollution problem was identified from surface runoff that
leads to accumulation of pollutant loads due to frequent flood events in Kelantan river
basin. The objective of this research however, is to simulate NPS pollutant loads by
integrating geographic information system (GIS), databases, as well as pollution loads
in the area.

Non-Point Source (NPS) Simulation in a Tropical Complex Catchment 147
MATERIALS AND METHODS
Study Area
Kelantan River basin is located on Peninsular Malaysia between latitudes 4° 40' and 6°
12' north, and longitudes 101° 20' and 102° 20' east. It has a maximum length of 150
km and a maximum breadth of 140 km. Kelantan river is about 248 km long with an
area of about 13,100 km2, occupying more than 85% of the Kelantan state. Annual
rainfall in the e basin is about 2383±120 mm, majority of which occurs during the
North-east monsoon between mid-October and mid-January. The map of the study area
is presented in Fig. 1 while Fig. 2 shows the flowchart adopted in this study.
Data Sources and preparation
ASTER Digital Elevation Model (DEM) was used in this study for extracting the major
catchments in the basin. Galas, Nenggiri, Lebir and Pergau are the four major
catchments extracted from the DEM. The 2013 LULC map and the DEM for the four
basins are shown in Fig. 3 and 4 respectively. Land use classes in this study were
categorised as forest, paddy, agriculture, grassland, urbanization, cleared land,
mangrove swamp, secondary forest, rivers, ponds and lakes and mining.
Pollution Load Estimation
Four pollutants loads were selected in this study, namely; total suspended solids (TSS),
total phosphorus (TP), total nitrogen (TN) and available nitrogen (AN). EMC values
were assigned according to each land use class. Pollutant load was estimated by
multiplying runoff volume and the appropriate EMC value.
Runoff coefficient
Runoff coefficient is a product of ground cover and rainfall intensity in a watershed.
Actual runoff coefficient is observed to increase during storm events as the soil
becomes saturated with water. Runoff coefficient increases with increase in rainfall
intensity. For proper assessment of pollutant transport in a watershed, good knowledge
of the pathways in which pollutant loads migrate is a prerequisite (Eisakhani et al.,
2009). It is imperative to calculate the average runoff volume generated in a watershed
once the basin area is being determined (Chow et al., 1988). Furthermore, a relative
measure of NPS pollutant load in urbanized land use of a catchment can be obtained
using runoff coefficient, by assigning high values to impervious surfaces (urbanized
areas) and low values to pervious (cleared land or grassland areas). In this study, runoff
coefficients assigned to individual land use by Department of Irrigation and Drainage,
Malaysia (DID, 2012) were used in estimating pollutant load (Table 1).

148 J.H. Abdulkareem, N.R. Jamil and W.N.A Sulaiman
Event Mean Concentration (EMC)
EMC can be defined as average concentration of a NPS pollutant that is measured
during a storm event. In another definition, it is the total mass of total constituents
discharged expressed over the total runoff volume (Huber, 1993; Adams & Papa, 2001).
EMC can be expressed using equation 1 below;
𝐸𝑀𝐶 = 𝐶 =𝑀
𝑉=
∫𝑄(𝑡)𝐶(𝑡)𝑑𝑡
∫𝑄(𝑡)𝑑𝑡 (1)
where M is total mass of pollutant during the entire runoff (kg), V is total volume of
runoff (m3), C(t) is time varying pollutant concentration (mg/L), Q(t) is time variable
flow (L/s), and t is total duration of runoff (s). Table 2 shows the EMC values used in
this study.
The rational method was used calculate runoff as shown in equation 2 below;
𝑄 = 𝑐𝑖𝐴 (2)
Where Q is the runoff (m3/yr), c runoff coefficient, i is the total rainfall and A is the
watershed drainage area.
The load for each pollutant was obtained by multiplying runoff information and EMC
values of each land use (equation 3)
𝐿𝑜𝑎𝑑 = 𝑄 × 𝐸𝑀𝐶 (3)
RESULTS AND DISCUSSION
Land use Analysis
The 2013 land use map was used in this study. Land use classes were categorized into
forest, paddy, agriculture, grassland, urbanization, cleared land, mangrove swamp,
secondary forest, rivers, ponds and lakes and mining. Detailed description of the
analysis for each sub-catchment is given below;
Galas In Galas, the total drainage area occupied by all land use classes is 2361.31 km2. Forest
occupies the major area with 715 km2 representing about 44% of the total area. The
second major land use class observed was agriculture which occupies about 43.19%
(701.4 km2) of the total drainage area. Urbanization which is the major source of
imperviousness contributes about 27.18 km2 of the drainage area while pervious
surfaces that include rivers, ponds and lakes covers an area of (7.52 km2). Other land
use classes that contribute to the total drainage area are secondary forest (146.55 km2),
mining (16.43 km2) and cleared land. A graphical presentation of the area covered by

Non-Point Source (NPS) Simulation in a Tropical Complex Catchment 149
each land use class in both km2 and percentage is presented in Fig. 5a.
Pergau Pergau is one of the major sub-catchments in Kelantan river basin. The drainage area
occupied by all the land use classes using 2013 land use is 2285.28 km2. The largest
area is occupied by forest (1368.13 km2) which represent about 60% of the total
drainage area while the lowest area is taken by mangrove forest (0.12 km2) representing
about 0.005% of the total drainage area. Other land use classes such as agriculture and
secondary forest all cover significant portion of the watershed with an area of 26.64%
and 11.19% respectively. Fig. 5b shows the graphical presentation of the area (km2 and
%) of all land use classes in the area.
Lebir The graphical illustration of the areas (km2 and %) covered by each land use class is
presented in Fig. 5c. Just like in Galas and Pergau, forest and agriculture are the
dominant land use classes that occupies more than 90% of the drainage in the
catchment. Forest contribute to about 2000.79 km2 twice the size contributed by
Agriculture (1004.45 km2). Other land uses such as grassland, urbanization, mining as
well as rivers, ponds and lakes each contributed < 1% of the total (3296.11 km2)
catchment drainage area.
Nenggiri In Nenggiri catchment, forest occupies about 87% of the total (3921.13 km2) catchment
drainage area. Except for agriculture (5.99%) and secondary forest (3.96%), all other
land use classes contributed < 1% of the total drainage area. Urbanization which is the
major contributor of imperviousness account for 8.66 km2 of the total drainage area.
Fig. 5d shows a detailed graphical presentation of the area both in km2 and in
percentage.
Surface Runoff Estimation
Runoff in the study area was calculated using the rational equation (eq. 2). The results
are shown in Tables 3-5. Average rainfall in 2013 was determined from rainfall data
obtained from DID on some 18 rain gauge stations spread across the basin (Fig. 1). The
land use classes indicated that the watershed is composed of both rural and urban NPSs
of pollution that may lead to downstream impairment. In Galas, grassland (1041535.41
m3/yr) and agriculture (979704.77 m3/yr) were reported to generate the highest amount
of runoff. While in Pergau, Lebir and Nenggiri, forest and agriculture generated the
highest quantity of runoff mainly due to their large surface are to volume ratio relative
to other land uses. Agricultural lands cultivated with crops contains reasonable amount
of phosphorus they utilize for their sustainable growth and development. Certain
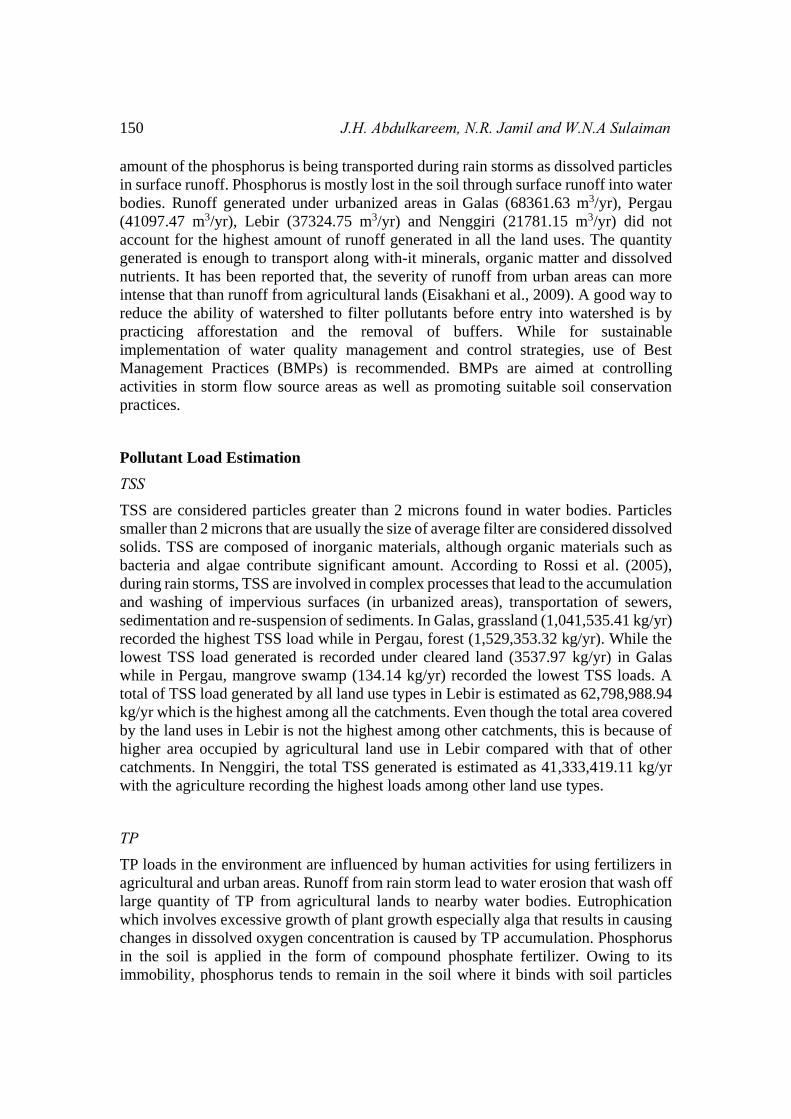
150 J.H. Abdulkareem, N.R. Jamil and W.N.A Sulaiman
amount of the phosphorus is being transported during rain storms as dissolved particles
in surface runoff. Phosphorus is mostly lost in the soil through surface runoff into water
bodies. Runoff generated under urbanized areas in Galas (68361.63 m3/yr), Pergau
(41097.47 m3/yr), Lebir (37324.75 m3/yr) and Nenggiri (21781.15 m3/yr) did not
account for the highest amount of runoff generated in all the land uses. The quantity
generated is enough to transport along with-it minerals, organic matter and dissolved
nutrients. It has been reported that, the severity of runoff from urban areas can more
intense that than runoff from agricultural lands (Eisakhani et al., 2009). A good way to
reduce the ability of watershed to filter pollutants before entry into watershed is by
practicing afforestation and the removal of buffers. While for sustainable
implementation of water quality management and control strategies, use of Best
Management Practices (BMPs) is recommended. BMPs are aimed at controlling
activities in storm flow source areas as well as promoting suitable soil conservation
practices.
Pollutant Load Estimation
TSS TSS are considered particles greater than 2 microns found in water bodies. Particles
smaller than 2 microns that are usually the size of average filter are considered dissolved
solids. TSS are composed of inorganic materials, although organic materials such as
bacteria and algae contribute significant amount. According to Rossi et al. (2005),
during rain storms, TSS are involved in complex processes that lead to the accumulation
and washing of impervious surfaces (in urbanized areas), transportation of sewers,
sedimentation and re-suspension of sediments. In Galas, grassland (1,041,535.41 kg/yr)
recorded the highest TSS load while in Pergau, forest (1,529,353.32 kg/yr). While the
lowest TSS load generated is recorded under cleared land (3537.97 kg/yr) in Galas
while in Pergau, mangrove swamp (134.14 kg/yr) recorded the lowest TSS loads. A
total of TSS load generated by all land use types in Lebir is estimated as 62,798,988.94
kg/yr which is the highest among all the catchments. Even though the total area covered
by the land uses in Lebir is not the highest among other catchments, this is because of
higher area occupied by agricultural land use in Lebir compared with that of other
catchments. In Nenggiri, the total TSS generated is estimated as 41,333,419.11 kg/yr
with the agriculture recording the highest loads among other land use types.
TP TP loads in the environment are influenced by human activities for using fertilizers in
agricultural and urban areas. Runoff from rain storm lead to water erosion that wash off
large quantity of TP from agricultural lands to nearby water bodies. Eutrophication
which involves excessive growth of plant growth especially alga that results in causing
changes in dissolved oxygen concentration is caused by TP accumulation. Phosphorus
in the soil is applied in the form of compound phosphate fertilizer. Owing to its
immobility, phosphorus tends to remain in the soil where it binds with soil particles
Non-Point Source (NPS) Simulation in a Tropical Complex Catchment 151
rather than dissolving in water. Significant of phosphate is transported to water bodies
by soil erosion which pollute the environment. Higher TP loads are recorded in
agricultural land uses compared to other land uses in all the catchments which is due of
high agricultural activities in the watershed. Galas catchment recorded the highest total
TP load (263,628.61 kg/yr), followed by Lebir (214,844.08 kg/yr), Nenggiri
(212907.90 kg/yr) and Pergau (152521.59 kg/yr).
TN and AN AN, nitrate nitrogen, nitrite-nitrogen and organic nitrogen are parts of TN. Just like
phosphorus, fertilizers and sewage form the major pathway in which nitrogen is added
into the soil. Nitrogen in the soil is applied in the form of ammonia or nitrate fertilizers.
Due to high mobility of nitrate in the soil, the amount not taken by plants is transported
to water or loss through seepage to ground water. This makes it very difficult and
expensive to control. As such heavy rain storms that produce surface runoff are likely
to always transport these pollutant loads except in farms where there is a functional
working system which is rather too expensive this can be controlled (Eisakhani et al.,
2009). Eutrophication is caused by high total loads in water bodies which lead to rapid
plant growth that decrease oxygen level, loss of aquatic lives, odor problem etc.
(Robertson et al., 2006). In all the four catchments, agricultural land use made the
highest contribution of both TN and AN. This is largely due to high agricultural
activities observed across the watersheds. Highest TN load was observed in Galas
(1899703.97 kg/yr) while the highest AN was observed in Nenggiri (46352.11 kg/yr).
CONCLUSIONS
The study was conducted with the aim of simulating NPS pollutant loads in Kelantan
river basin by integrating geographic information system (GIS), databases, as well as
pollution loads in the area. Pollutant loads that include TSS, TP, TN and AN were
identified on different land uses. Agricultural activities appear to be the dominant land
use that recorded the highest amount of pollutant loads in most of the four catchments.
Large amount of TP found in the watershed is attributed to high soil erosion in the area
that releases phosphorus bonded to the soil into water bodies since phosphorus is not
highly mobile in the soil. While the availability of TN and AN is attributed to large
amount of areas utilized for agricultural activities making the pollutant readily available
in water bodies. The use of structural and non-structural BMPs is recommended as a
way of combating NPS pollutant load in the area.

152 J.H. Abdulkareem, N.R. Jamil and W.N.A Sulaiman
Table 1 Runoff coefficient of individual land use in Malaysia
(Modified after DID, 2012)
Land use Runoff coefficient
Forest 0.40
Paddy 0.50
Agriculture 0.50
Grassland 0.50
Urbanization 0.90
Cleared land 0.60
Mangrove swamp 0.40
Secondary Forest 0.40
Minning 0.95
Rivers, ponds and
lakes
0.00
Table 2. Values of EMC used in this study (mg/L)
Land use TSS TP TN AN
Forest 6.00 0.03 0.20 0.01
Paddy 30.00 0.09 0.80 0.01
Agriculture 30.00 0.09 0.80 0.01
Grassland 30.00 0.09 0.80 0.01
Urbanization 85.00 0.13 1.20 0.10
Cleared land 30.00 0.09 0.80 0.01
Mangrove swamp 6.00 0.03 0.20 0.01
Secondary Forest 6.00 0.03 0.20 0.01
Minning 60.00 1.00 0.12 0.00
Table 3. NPS pollutant load (kg yr-1) in Galas according to land use types
Land use type Area (km2) Q (m3/yr) TSS (kg/yr) TP (kg/yr) TN (kg/yr) AN (kg/yr)
Forest 714.99 799245.93 4795475.56 23977.38 159849.19 7992.46
Agriculture 701.14 979704.77 29391143.01 88173.43 783763.81 9797.05
Grassland 745.39 1041535.41 31246062.26 93738.19 833228.33 10415.35
Urbanization 27.18 68361.63 5810738.89 8887.01 82033.96 6836.16
Cleared land 2.11 3537.97 106139.11 318.42 2830.38 35.38
Secondary Forest 146.55 163819.76 982918.56 4914.59 32763.95 1638.20
Rivers, Ponds and Lakes 7.52 0.00 0.00 0.00 0.00 0.00
Mining 16.43 43619.60 2617175.78 43619.60 5234.35 0.00
Total 2361.31 3099825.06 74949653.16 263628.61 1899703.97 36714.60

Non-Point Source (NPS) Simulation in a Tropical Complex Catchment 153
Table 4. NPS pollutant load (kg yr-1) in Pergau according to land use type
Land use type Area (km2) Q (m3/yr) TSS (kg/yr) TP (kg/yr) TN (kg/yr) AN (kg/yr)
Forest 1368.13 1529353.32 9176119.92 45880.60 305870.66 15293.53
Paddy 0.75 1047.98 31439.31 94.32 838.38 10.48
Agriculture 608.70 850538.11 25516143.36 76548.43 680430.49 8505.38
Grassland 12.18 17019.15 510574.38 1531.72 13615.32 170.19
Urbanization 16.34 41097.47 3493284.53 5342.67 49316.96 4109.75
Cleared land 11.04 18511.47 555343.96 1666.03 14809.17 185.11
Mangrove swamp 0.12 134.14 804.85 4.02 26.83 1.34
Secondary Forest 255.78 285921.65 1715529.92 8577.65 57184.33 2859.22
Rivers, Ponds and Lakes 7.39 0.00 0.00 0.00 0.00 0.00
Mining 4.85 12876.14 772568.63 12876.14 1545.14 0.00
Total 2285.28 2756499.42 41771808.84 152521.59 1123637.28 31135.00
Table 5. NPS pollutant load (kg yr-1) in Lebir according to land use type
Land Use type Area (km2) Q (m3/yr) TSS (kg/yr) TP (kg/yr) TN (kg/yr) AN (kg/yr)
Forest 2000.79 2236567.31 13419403.83 67097.02 447313.46 22365.67
Agriculture 1004.45 1403520.63 42105618.85 126316.86 1122816.50 14035.21
Grassland 10.42 14559.89 436796.80 1310.39 11647.91 145.60
Urbanization 14.84 37324.75 3172603.57 4852.22 44789.70 3732.47
Cleared land 42.56 71363.04 2140891.20 6422.67 57090.43 713.63
Secondary Forest 211.5 236423.61 1418541.63 7092.71 47284.72 2364.24
Rivers, Ponds and Lakes 10.89 0.00 0.00 0.00 0.00 0.00
Mining 0.66 1752.22 105133.05 1752.22 210.27 0.00
Total 3296.11 4001511.44 62798988.94 214844.08 1731153.00 43356.82
Table 6. NPS pollutant load (kg yr-1) in Nenggiri according to land use type
Land Use type Area (km2) Q (m3/yr) TSS (kg/yr) TP (kg/yr) TN (kg/yr) AN (kg/yr)
Forest 3431.51 3835886.36 23015318.18 115076.59 767177.27 38358.86
Agriculture 234.69 327932.95 9837988.64 29513.97 262346.36 3279.33
Grassland 33.51 46823.61 1404708.34 4214.13 37458.89 468.24
Urbanization 8.66 21781.15 1851398.04 2831.55 26137.38 2178.12
Cleared land 19.86 33300.52 999015.49 2997.05 26640.41 333.01
Secondary Forest 155.17 173455.56 1040733.36 5203.67 34691.11 1734.56
Rivers, Ponds and Lakes 17.74 0.00 0.00 0.00 0.00 0.00
Mining 19.99 53070.95 3184257.08 53070.95 6368.51 0.00
Total 3921.13 4492251.11 41333419.11 212907.90 1160819.95 46352.11

154 J.H. Abdulkareem, N.R. Jamil and W.N.A Sulaiman
Fig. 1 Map of Kelantan river basin showing Galas, Pergau, Lebir and Nenggiri
catchments with rain gauge stations
Fig. 2 Research methodological flowchart
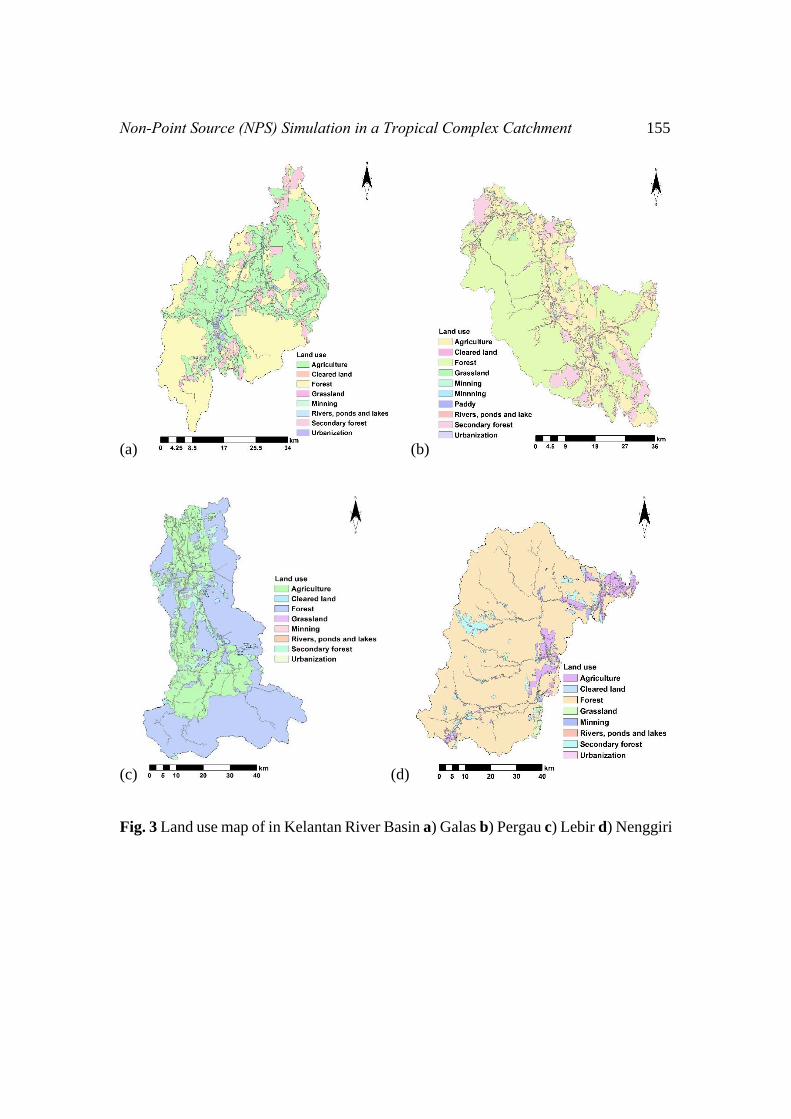
Non-Point Source (NPS) Simulation in a Tropical Complex Catchment 155
(a) (b)
(c) (d)
Fig. 3 Land use map of in Kelantan River Basin a) Galas b) Pergau c) Lebir d) Nenggiri

156 J.H. Abdulkareem, N.R. Jamil and W.N.A Sulaiman
(a) (b)
(c) (d)
Fig. 4. DEM of the four catchments in Kelantan River Basin a) Galas b) Pergau c) Lebir
d) Nenggiri

Non-Point Source (NPS) Simulation in a Tropical Complex Catchment 157
(a)
(b)
-10.00
0.00
10.00
20.00
30.00
40.00
50.00
0
100
200
300
400
500
600
700
800
Are
a (%
)
Are
a (k
m2)
Land use type
Area (km2) Area (%)
-10.00
0.00
10.00
20.00
30.00
40.00
50.00
60.00
70.00
0.00
200.00
400.00
600.00
800.00
1000.00
1200.00
1400.00
1600.00
Are
a (%
)
Are
a (k
m2)
Land use type
Area (km2) Area (%)

158 J.H. Abdulkareem, N.R. Jamil and W.N.A Sulaiman
(c)
(d)
Fig. 5. Graphical presentation of areas (km2 and %) in Kelantan River Basin a) Galas
b) Pergau c) Lebir d) Nengg
-10.00
0.00
10.00
20.00
30.00
40.00
50.00
60.00
70.00
0
500
1000
1500
2000
2500
Are
a (%
)
Are
a (k
m2)
Land use type
Area (km2) Area (%)
-20.00
0.00
20.00
40.00
60.00
80.00
100.00
0
500
1000
1500
2000
2500
3000
3500
4000
Are
a (%
)
Are
a (k
m2)
Land use
Area (km2) Area (%)
Non-Point Source (NPS) Simulation in a Tropical Complex Catchment 159
REFERENCE
[1] Adams, B. J., & Papa, F. (2001). Urban stormwater management planning with
analytical probabilistic models. Canadian Journal of Civil Engineering, 28(3),
545.
[2] Basnyat, P., Teeter, L. D., Lockaby, B. G., & Flynn, K. M. (2000). The use of
remote sensing and GIS in watershed level analyses of non-point source
pollution problems. Forest Ecology and Management, 128(1–2), 65–73.
http://doi.org/10.1016/S0378-1127(99)00273-X
[3] Chow, V. T., Maidment, D. R., & Mays, L. W. (1988). Applied hydrology. [4] DID. (2012). Urban Sormwater Management Manual for Malaysia.
[5] Dzikiewicz, M. (2000). Activities in nonpoint pollution control in rural areas of
Poland. Ecological Engineering, 14(4), 429–434.
[6] Eisakhani, M., Pauzi, A., Karim, O., Malakahmad, A., Kutty, S. R. M., & Isa,
M. H. (2009). GIS-based Non-point Sources of Pollution Simulation in
Cameron Highlands , Malaysia. International Journal of Civil and Environmental Engineering, 3(3), 3–7.
[7] EPA. (2017). Polluted Runoff: Nonpoint Source Pollution. Retrieved from
https://www.epa.gov/nps/what-nonpoint-source
[8] Huber, W. C. (1993). Contaminant transport in surface water. Handbook of Hydrology, 11–14.
[9] Lai, Y. C., Yang, C. P., Hsieh, C. Y., Wu, C. Y., & Kao, C. M. (2011).
Evaluation of non-point source pollution and river water quality using a
multimedia two-model system. Journal of Hydrology, 409(3–4), 583–595.
http://doi.org/10.1016/j.jhydrol.2011.08.040
[10] Nikolaidis, N. P., Karageorgis, A. P., Kapsimalis, V., Marconis, G.,
Drakopoulou, P., Kontoyiannis, H., … Pagou, K. (2006). Circulation and
nutrient modeling of Thermaikos Gulf, Greece. Journal of Marine Systems,
60(1), 51–62.
[11] Ongley, E. D., Xiaolan, Z., & Tao, Y. (2010). Current status of agricultural and
rural non-point source pollution assessment in China. Environmental Pollution,
158(5), 1159–1168.
[12] Ouyang, W., Song, K., Wang, X., & Hao, F. (2014). Non-point source pollution
dynamics under long-term agricultural development and relationship with
landscape dynamics. Ecological Indicators, 45, 579–589.
http://doi.org/10.1016/j.ecolind.2014.05.025
[13] Robertson, D. M., Graczyk, D. J., Garrison, P. J., LIZHU, W., LaLiberte, G., &
Bannerman, R. (2006). Nutrient concentrations and their relations to the biotic
integrity of wadeable streams in Wisconsin. US Geological Survey Professional Paper, (1722), 1–139.

160 J.H. Abdulkareem, N.R. Jamil and W.N.A Sulaiman
[14] Tang, Z., Engel, B. a., Pijanowski, B. C., & Lim, K. J. (2005). Forecasting land
use change and its environmental impact at a watershed scale. Journal of Environmental Management, 76(1), 35–45. http://doi.org/10.1016
/j.jenvman.2005.01.006