non-native salmoinds in lake superior don schreiner, mndnr steve schram, widnr shawn sitar, midnr...
TRANSCRIPT
NON-NATIVE SALMOINDS IN LAKE SUPERIOR
Don Schreiner, MNDNR
Steve Schram, WIDNR
Shawn Sitar, MIDNR
Mike Petzold, OMNR
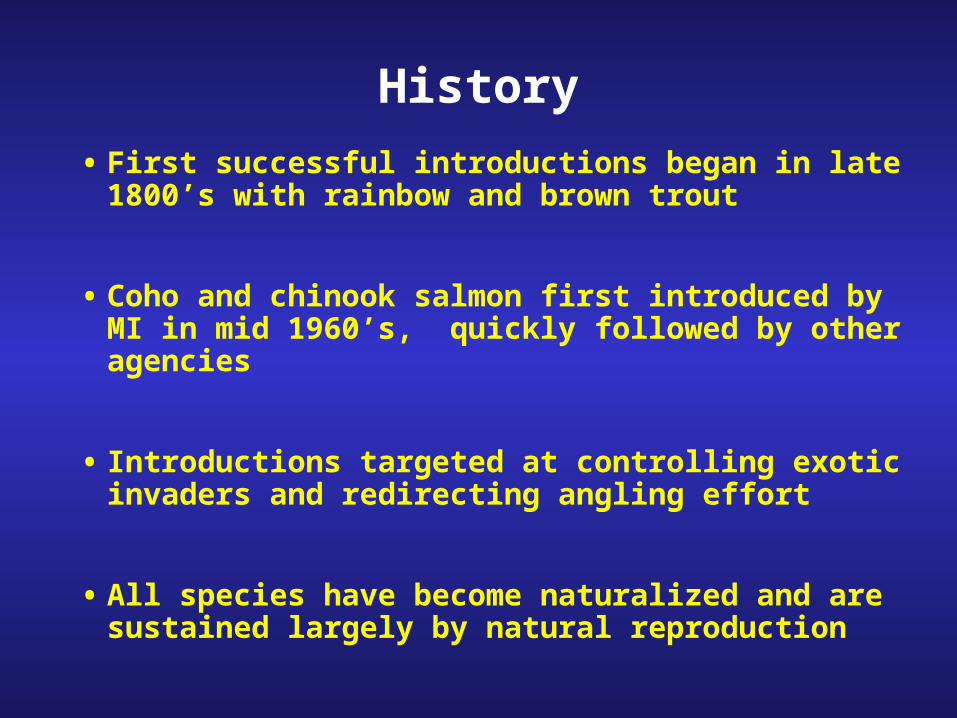
History
• First successful introductions began in late 1800’s with rainbow and brown trout
• Coho and chinook salmon first introduced by MI in mid 1960’s, quickly followed by other agencies
• Introductions targeted at controlling exotic invaders and redirecting angling effort
• All species have become naturalized and are sustained largely by natural reproduction
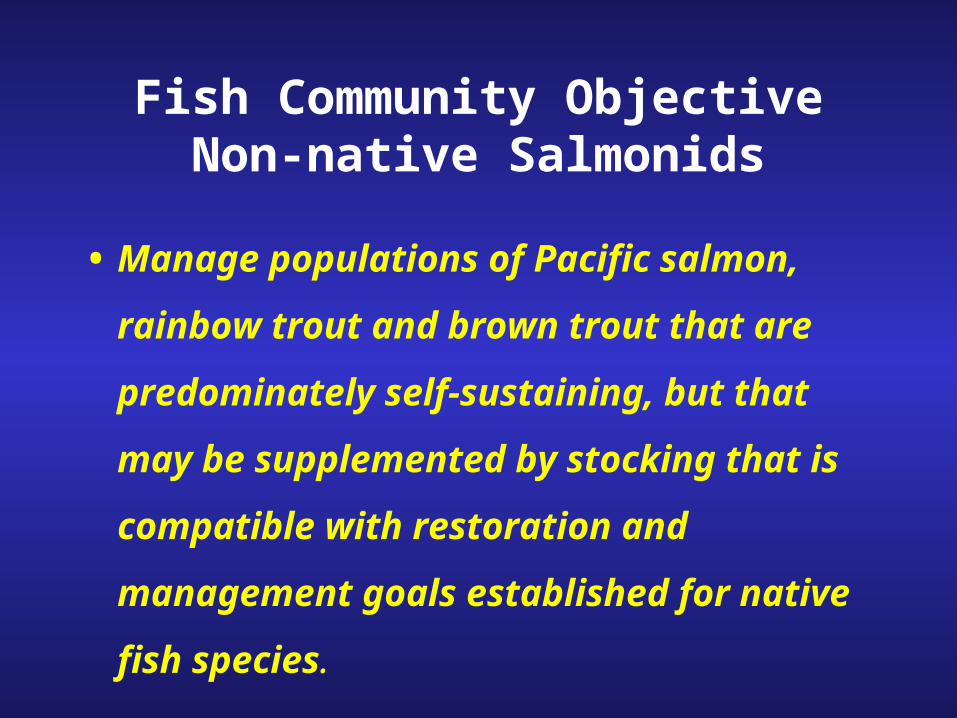
Fish Community ObjectiveNon-native Salmonids
• Manage populations of Pacific salmon, rainbow
trout and brown trout that are predominately
self-sustaining, but that may be supplemented by
stocking that is compatible with restoration and
management goals established for native fish
species.
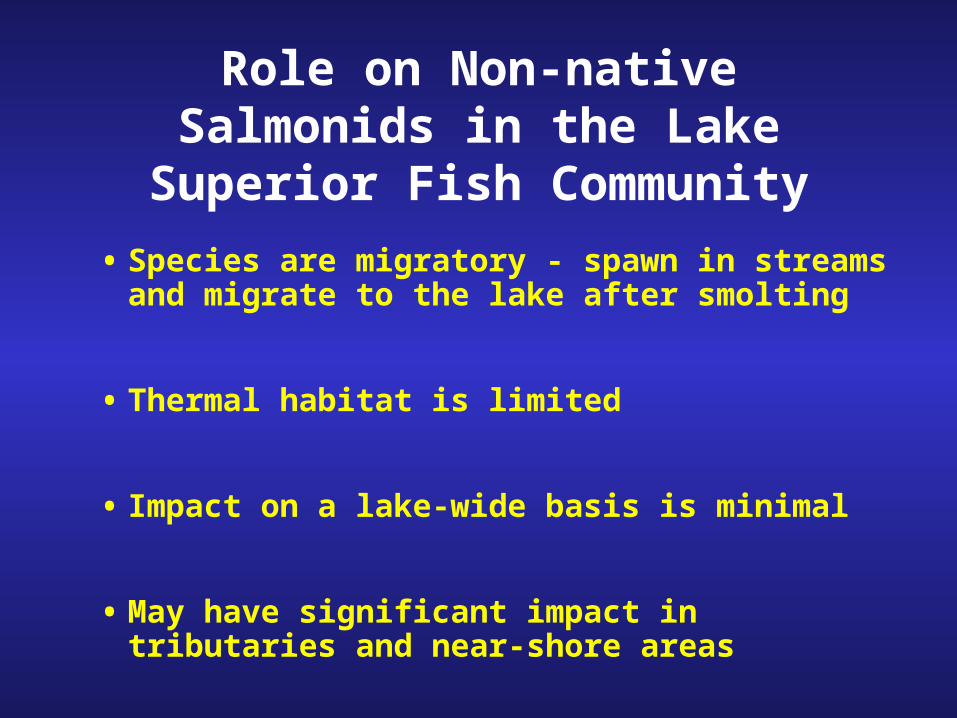
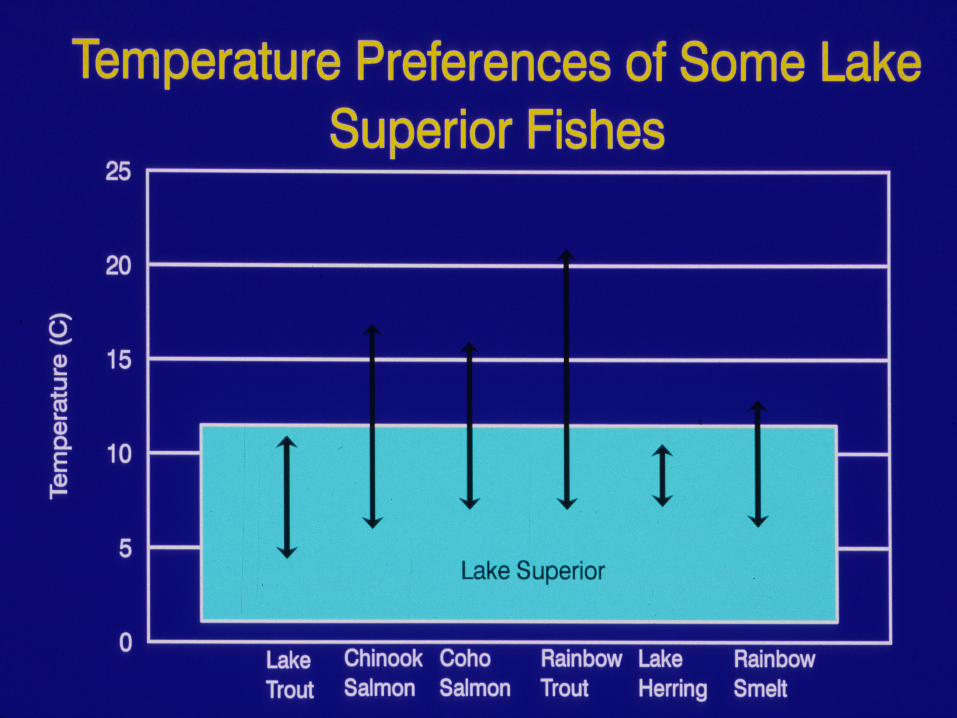
Role on Non-native Salmonids in the Lake Superior Fish Community
• Species are migratory - spawn in streams and migrate to the lake after smolting
• Thermal habitat is limited
• Impact on a lake-wide basis is minimal
• May have significant impact in tributaries and near-shore areas
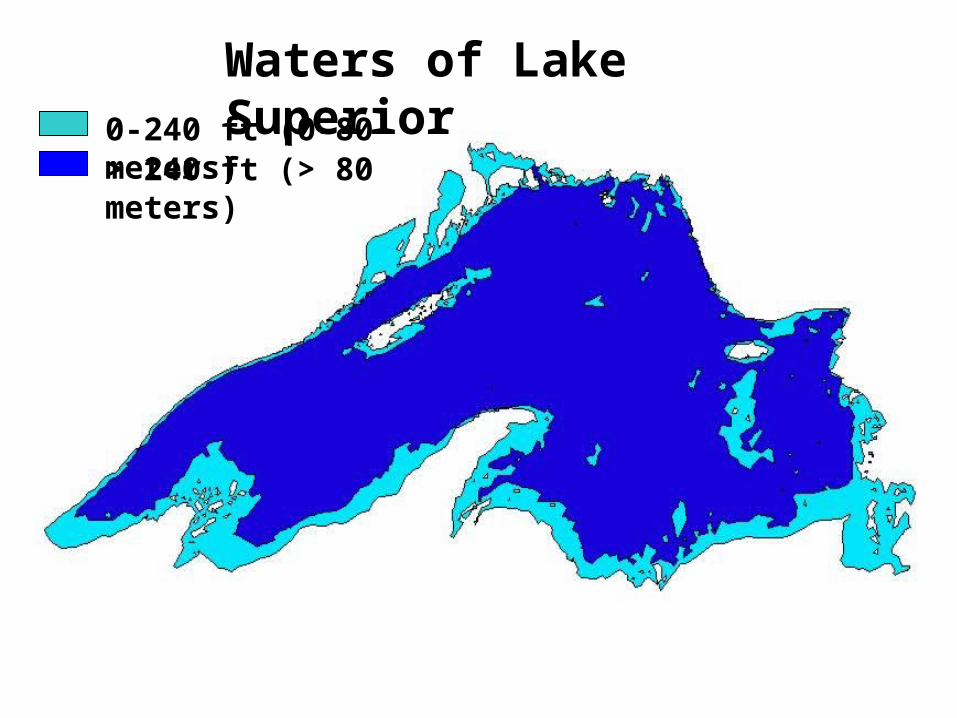
Waters of Lake Superior0-240 ft (0-80 meters)> 240 ft (> 80 meters)
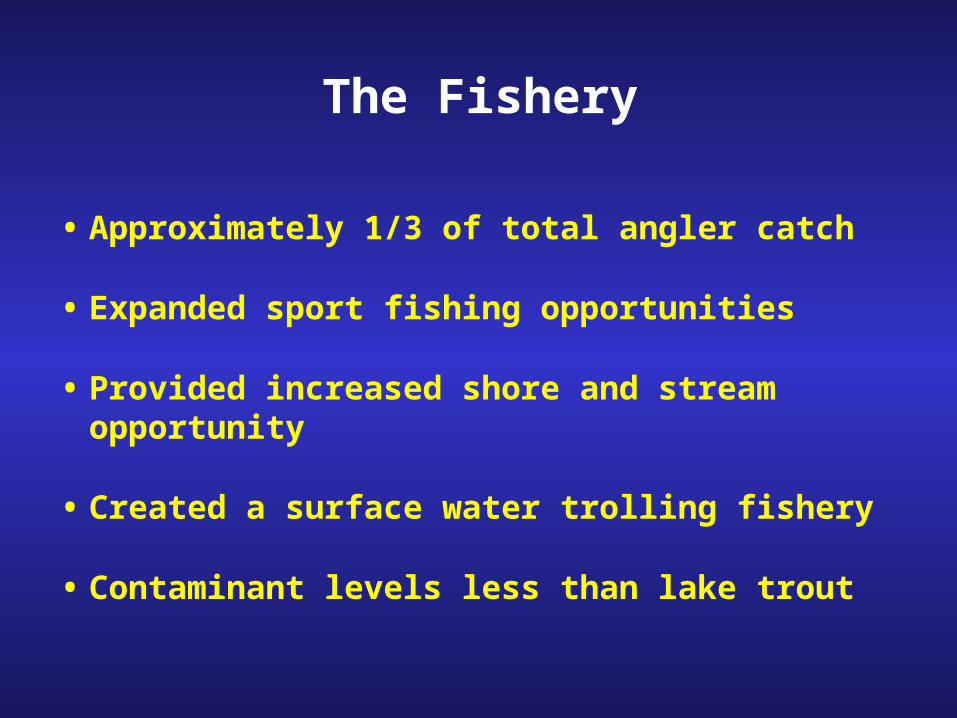
The Fishery
• Approximately 1/3 of total angler catch
• Expanded sport fishing opportunities
• Provided increased shore and stream opportunity
• Created a surface water trolling fishery
• Contaminant levels less than lake trout
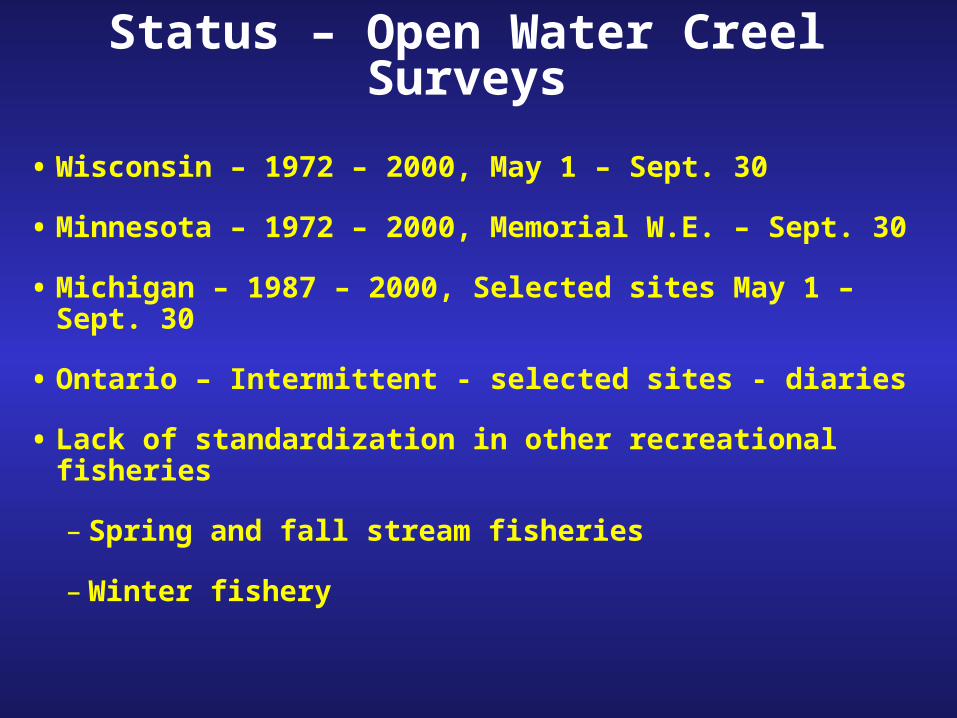
Status – Open Water Creel Surveys
• Wisconsin – 1972 – 2000, May 1 – Sept. 30
• Minnesota – 1972 – 2000, Memorial W.E. – Sept. 30
• Michigan – 1987 – 2000, Selected sites May 1 – Sept. 30
• Ontario – Intermittent - selected sites - diaries
• Lack of standardization in other recreational fisheries
– Spring and fall stream fisheries
– Winter fishery
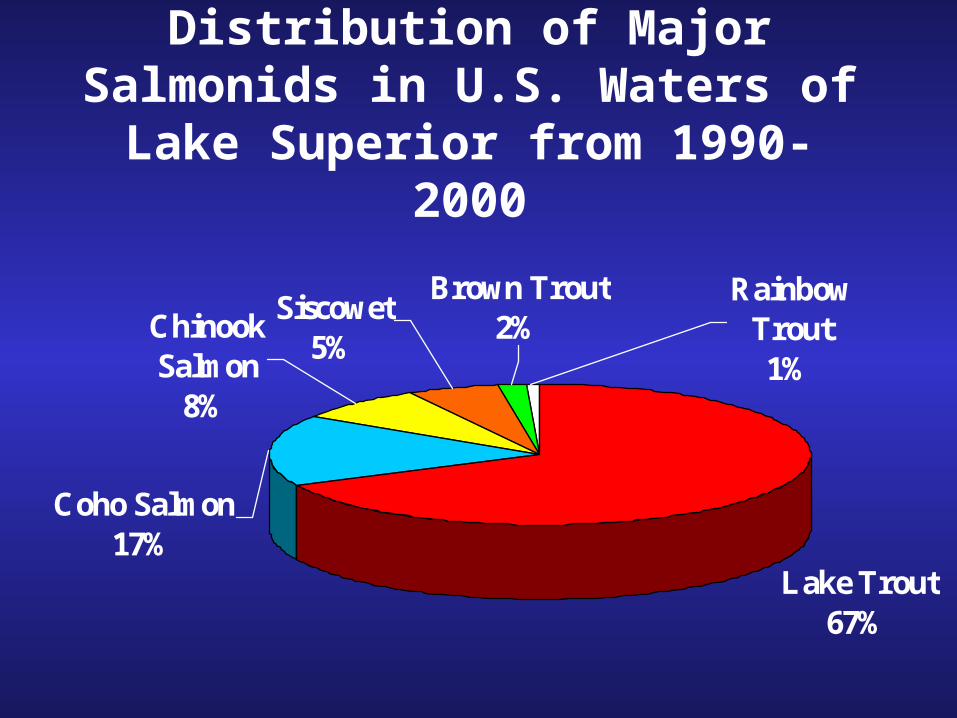
Distribution of Major Salmonids in U.S. Waters of Lake Superior from
1990-2000
Lake Trout67%
Coho Salmon17%
Chinook Salmon
8%
Brown Trout2%
Rainbow Trout1%
Siscowet5%
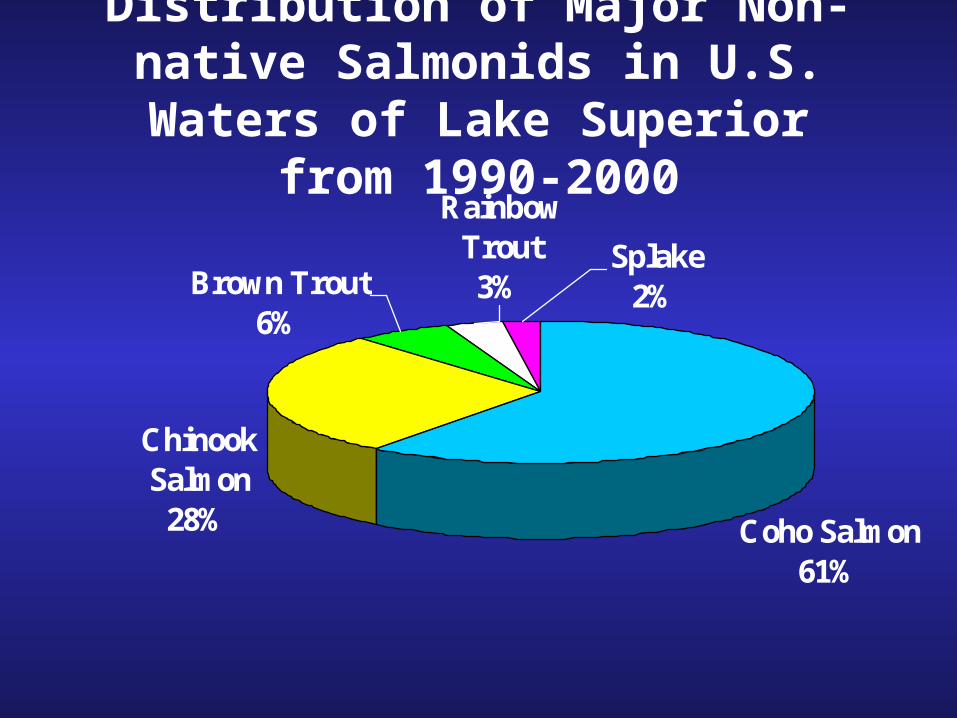
Distribution of Major Non-native Salmonids in U.S. Waters of Lake
Superior from 1990-2000
Chinook Salmon
28% Coho Salmon61%
Rainbow Trout3%
Splake2%Brown Trout
6%
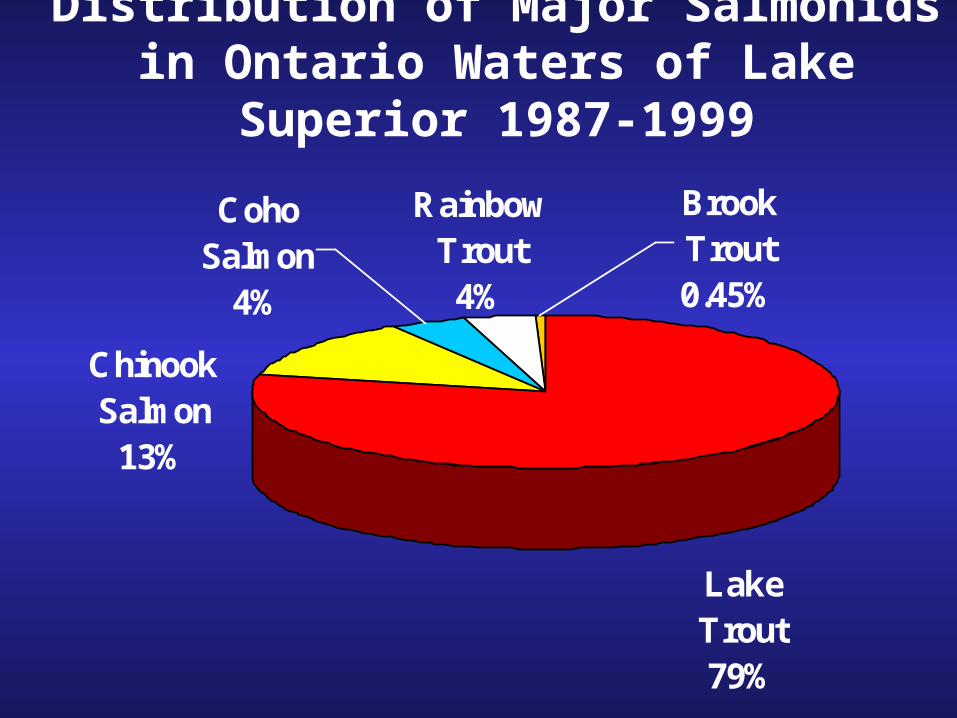
Distribution of Major Salmonids in Ontario Waters of Lake Superior 1987-1999
Chinook Salmon
13%
Brook Trout0.45%
Rainbow Trout
4%
Coho Salmon
4%
Lake Trout79%
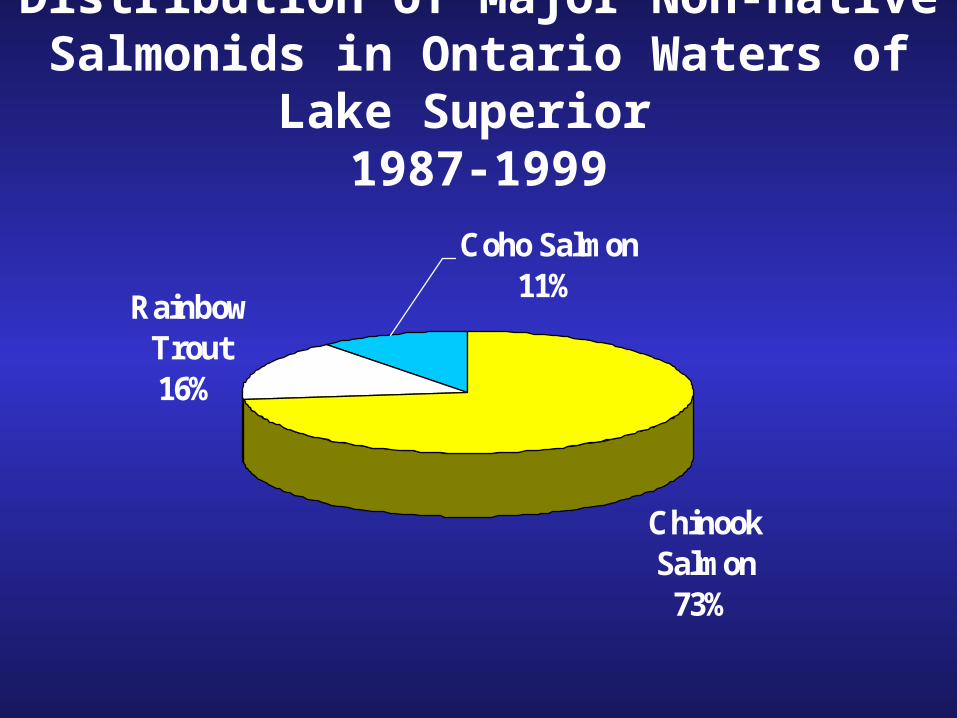
Distribution of Major Non-native Salmonids in Ontario Waters of Lake Superior
1987-1999
Chinook Salmon
73%
Rainbow Trout16%
Coho Salmon11%
Status
• Stocking history
• Catch history
• CPUE in open water recreational fishery
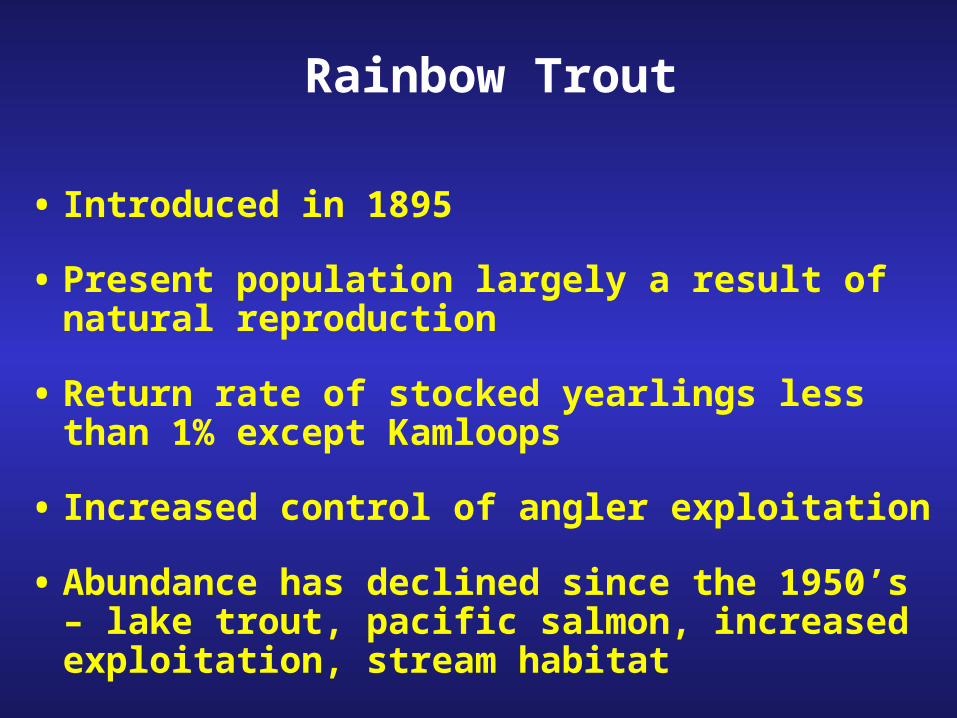
Rainbow Trout
• Introduced in 1895
• Present population largely a result of natural reproduction
• Return rate of stocked yearlings less than 1% except Kamloops
• Increased control of angler exploitation
• Abundance has declined since the 1950’s – lake trout, pacific salmon, increased exploitation, stream habitat
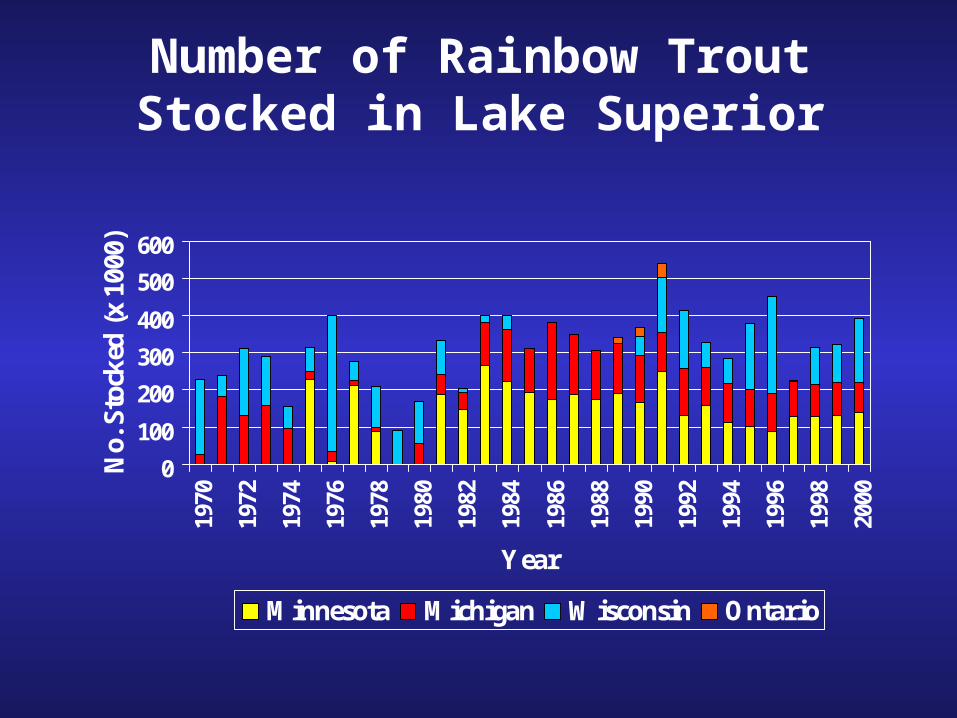
Number of Rainbow Trout Stocked in Lake Superior
0
100
200
300
400
500
600
1970
1972
1974
1976
1978
1980
1982
1984
1986
1988
1990
1992
1994
1996
1998
2000
Year
No.
Sto
cked
(x
1000
)
Minnesota Michigan Wisconsin Ontario
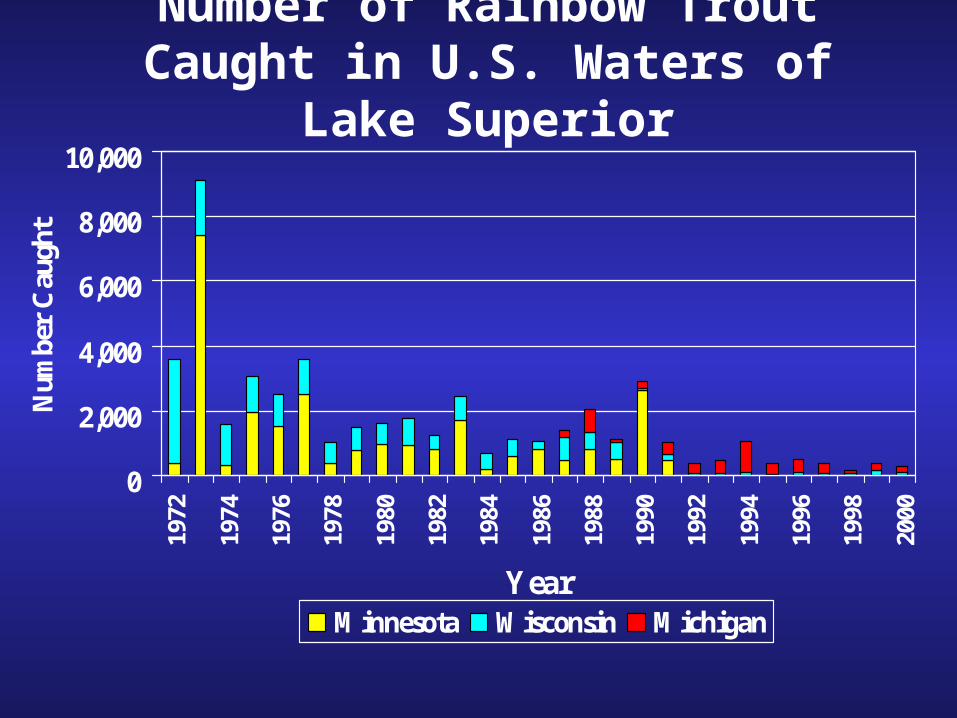
Number of Rainbow Trout Caught in U.S. Waters of Lake Superior
0
2,000
4,000
6,000
8,000
10,00019
72
1974
1976
1978
1980
1982
1984
1986
1988
1990
1992
1994
1996
1998
2000
Year
Num
ber
Cau
ght
Minnesota Wisconsin Michigan
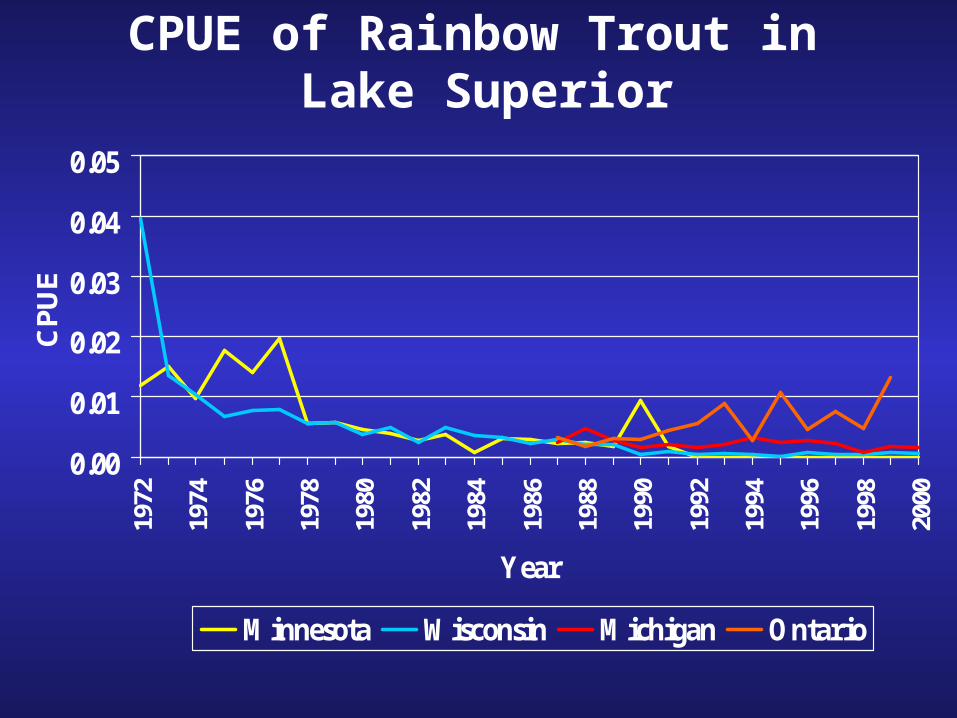
CPUE of Rainbow Trout in Lake Superior
0.00
0.01
0.02
0.03
0.04
0.0519
72
1974
1976
1978
1980
1982
1984
1986
1988
1990
1992
1994
1996
1998
2000
Year
CP
UE
Minnesota Wisconsin Michigan Ontario
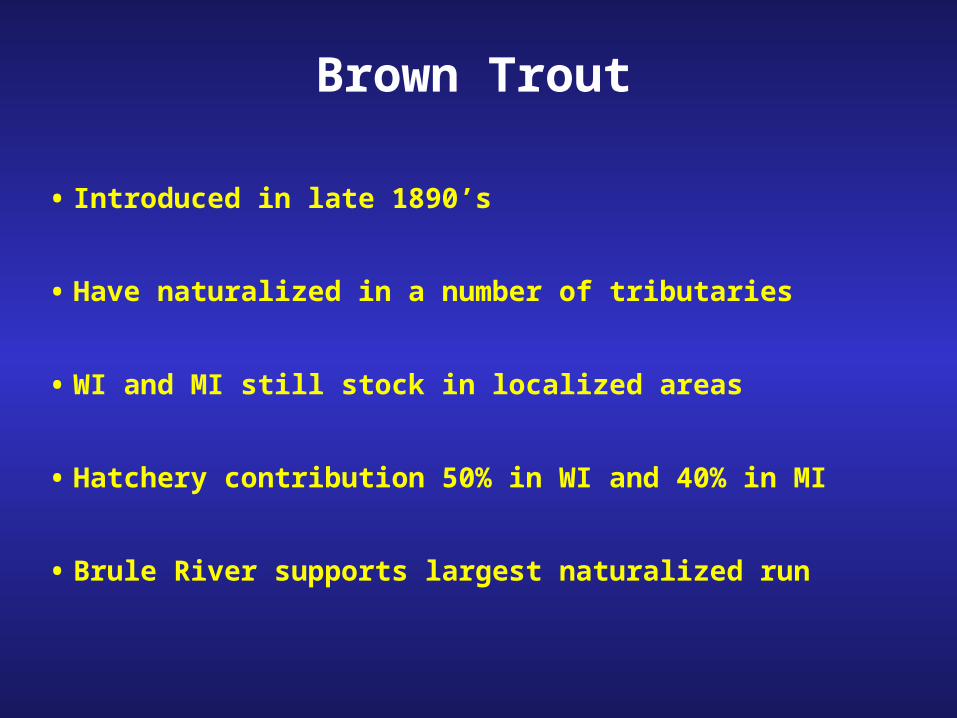
Brown Trout
• Introduced in late 1890’s
• Have naturalized in a number of tributaries
• WI and MI still stock in localized areas
• Hatchery contribution 50% in WI and 40% in MI
• Brule River supports largest naturalized run
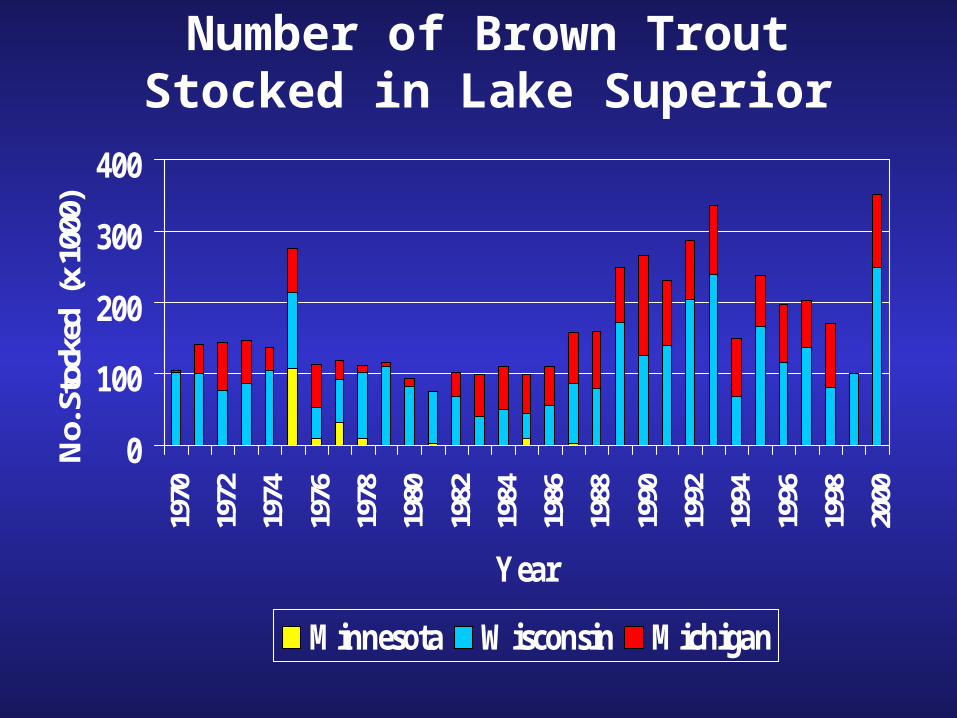
Number of Brown Trout Stocked in Lake Superior
0
100
200
300
40019
70
1972
1974
1976
1978
1980
1982
1984
1986
1988
1990
1992
1994
1996
1998
2000
Year
No.
Sto
cked
(x
1000
)
Minnesota Wisconsin Michigan
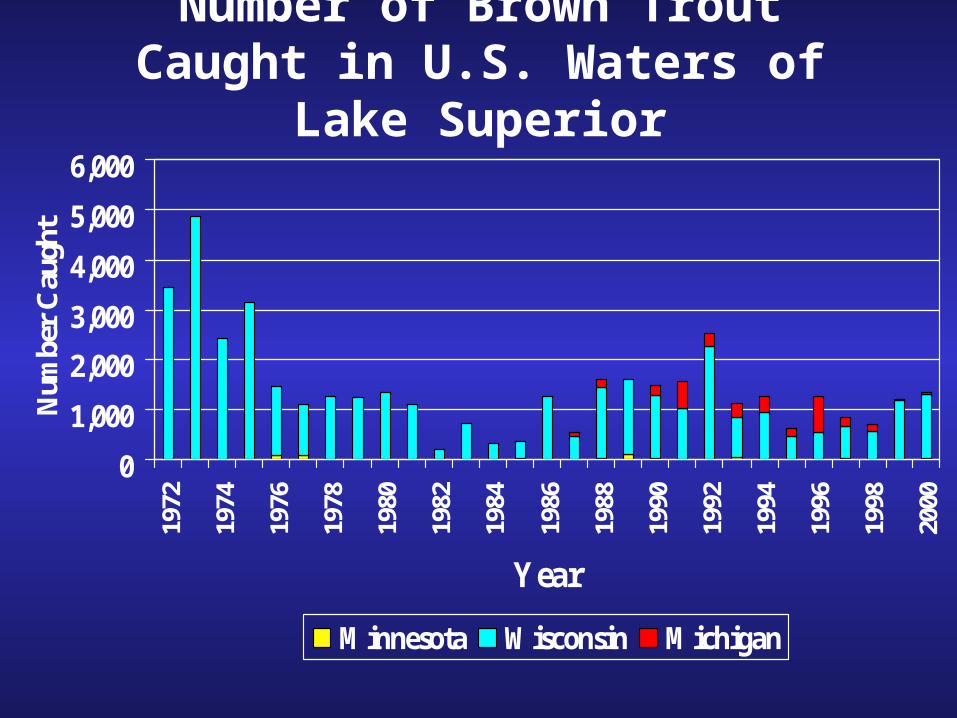
Number of Brown Trout Caught in U.S. Waters of Lake Superior
0
1,000
2,000
3,000
4,000
5,000
6,00019
72
1974
1976
1978
1980
1982
1984
1986
1988
1990
1992
1994
1996
1998
2000
Year
Num
ber
Cau
ght
Minnesota Wisconsin Michigan
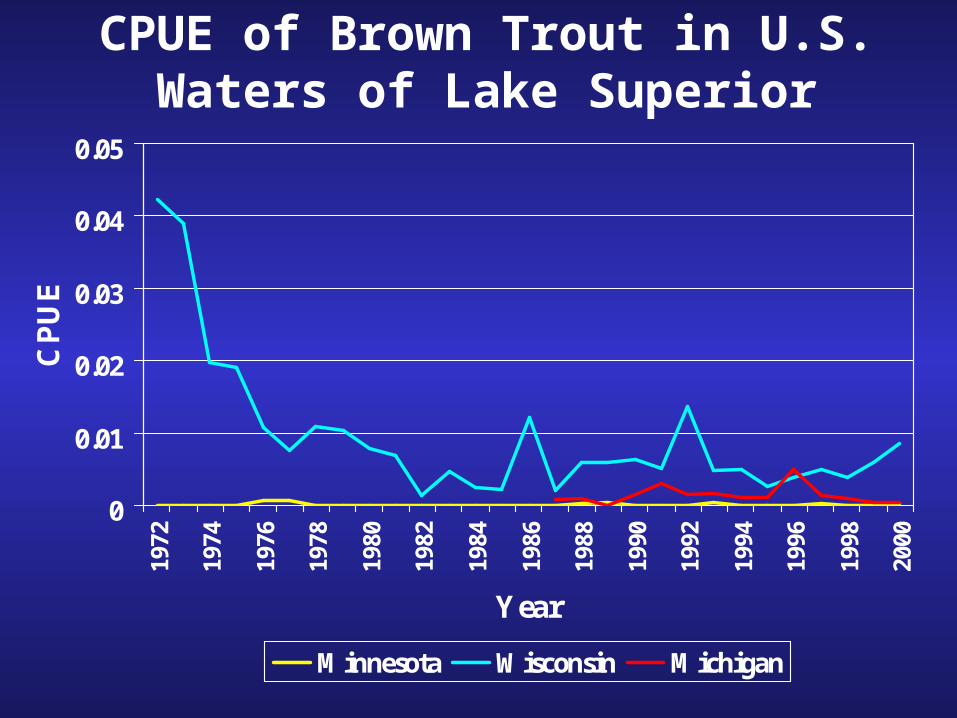
CPUE of Brown Trout in U.S. Waters of Lake Superior
0
0.01
0.02
0.03
0.04
0.0519
72
1974
1976
1978
1980
1982
1984
1986
1988
1990
1992
1994
1996
1998
2000
Year
CP
UE
Minnesota Wisconsin Michigan
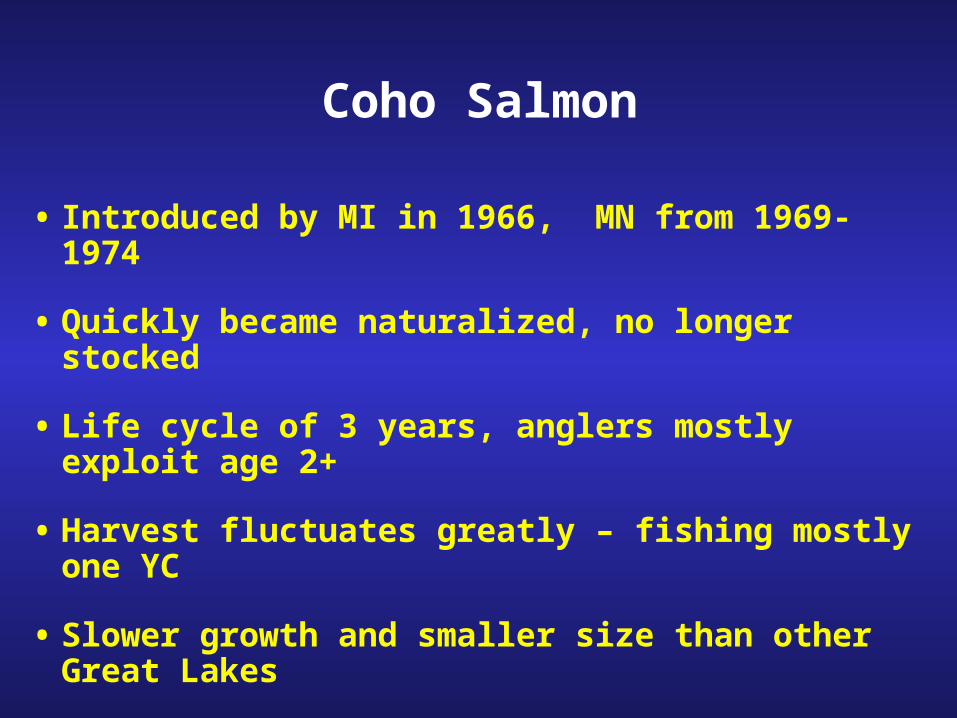
Coho Salmon
• Introduced by MI in 1966, MN from 1969-1974
• Quickly became naturalized, no longer stocked
• Life cycle of 3 years, anglers mostly exploit age 2+
• Harvest fluctuates greatly – fishing mostly one YC
• Slower growth and smaller size than other Great Lakes
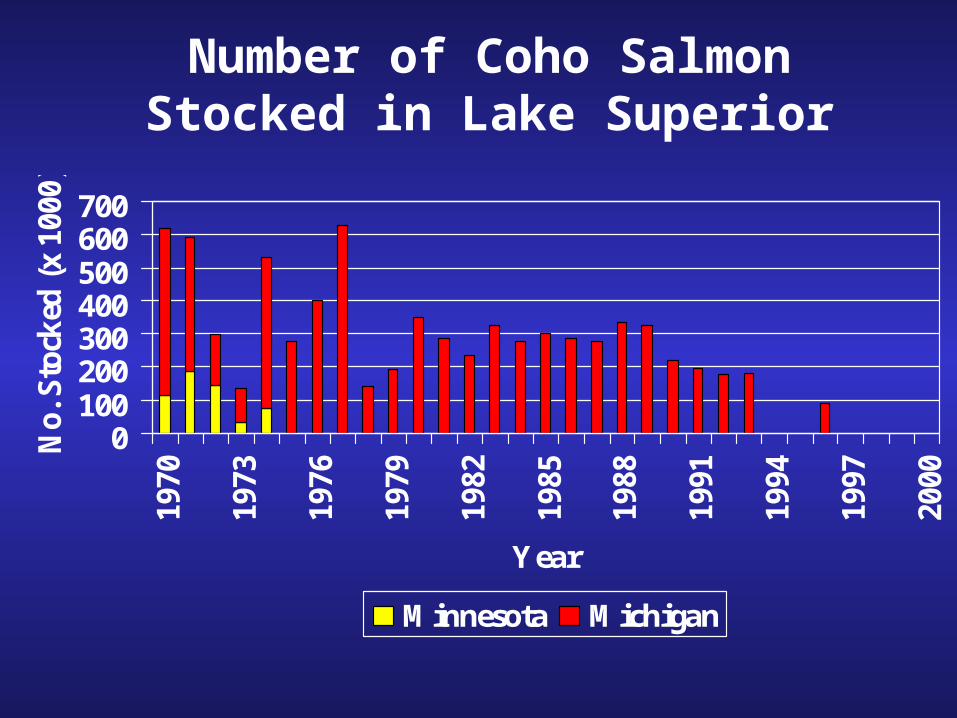
Number of Coho Salmon Stocked in Lake Superior
0100200300400500600700
1970
1973
1976
1979
1982
1985
1988
1991
1994
1997
2000
Year
No.
Sto
cked
(x
1000
)
Minnesota Michigan
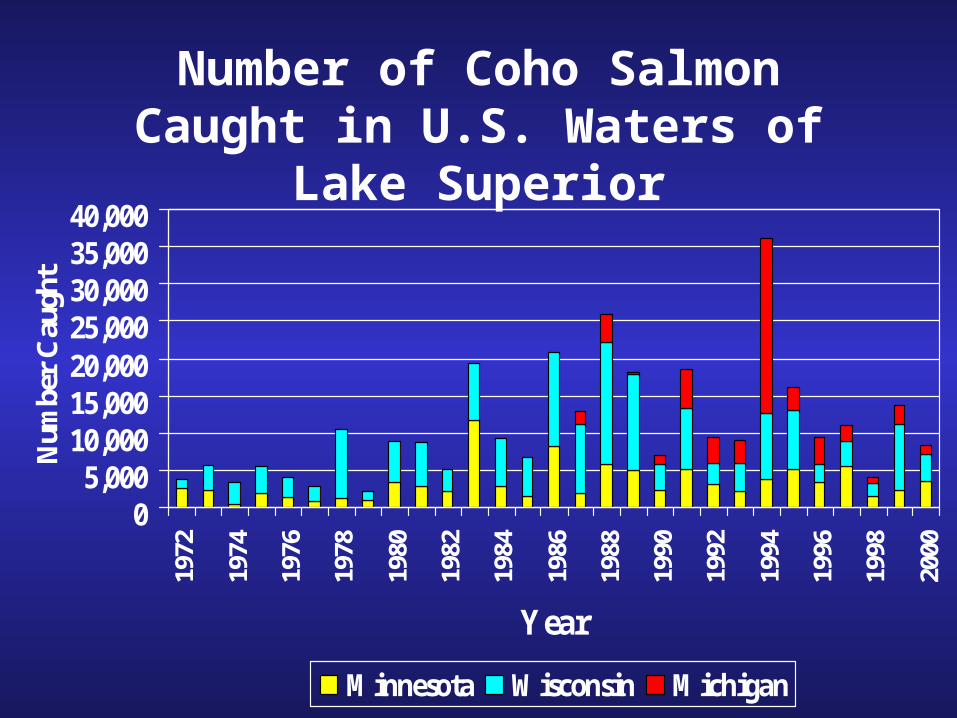
Number of Coho Salmon Caught in U.S. Waters of Lake Superior
05,000
10,00015,00020,00025,00030,00035,00040,000
1972
1974
1976
1978
1980
1982
1984
1986
1988
1990
1992
1994
1996
1998
2000
Year
Num
ber
Cau
ght
Minnesota Wisconsin Michigan
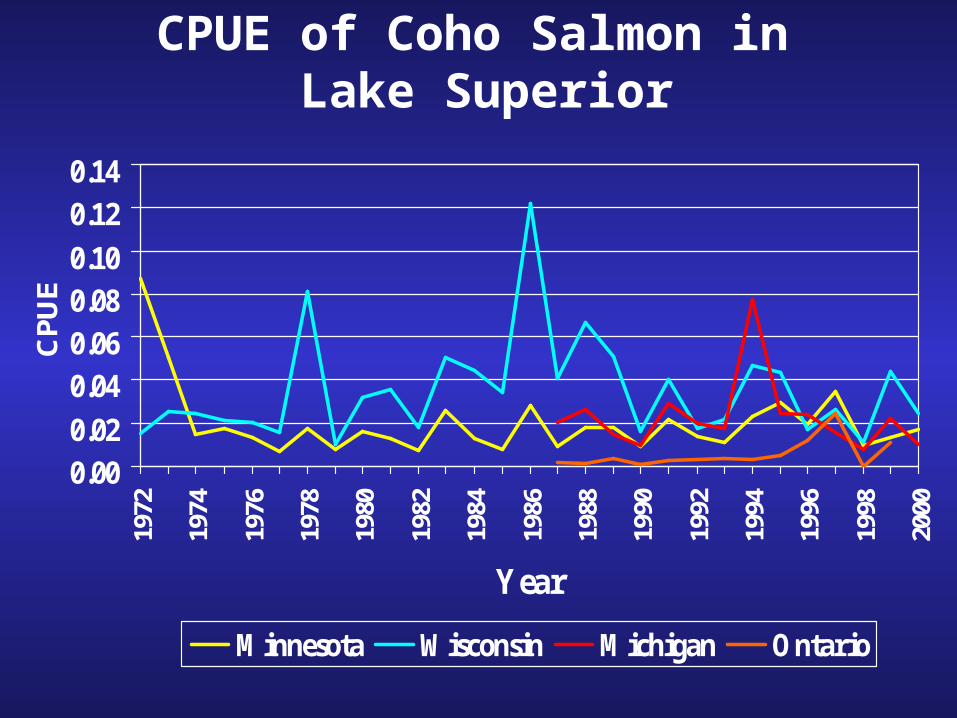
CPUE of Coho Salmon in Lake Superior
0.000.02
0.040.060.080.10
0.120.14
1972
1974
1976
1978
1980
1982
1984
1986
1988
1990
1992
1994
1996
1998
2000
Year
CP
UE
Minnesota Wisconsin Michigan Ontario
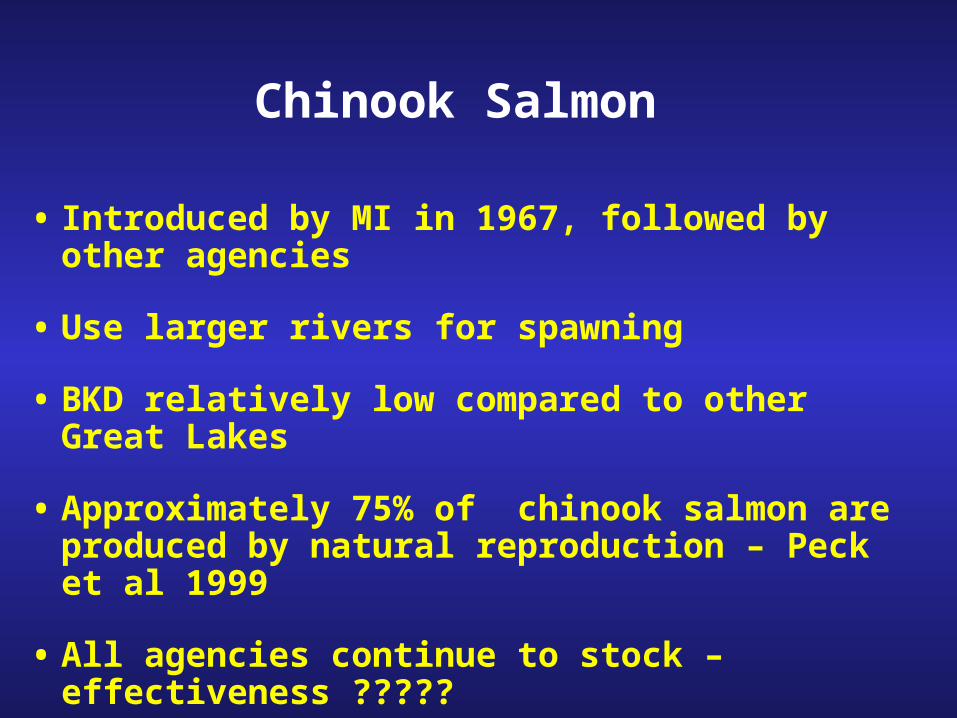
Chinook Salmon
• Introduced by MI in 1967, followed by other agencies
• Use larger rivers for spawning
• BKD relatively low compared to other Great Lakes
• Approximately 75% of chinook salmon are produced by natural reproduction – Peck et al 1999
• All agencies continue to stock – effectiveness ?????
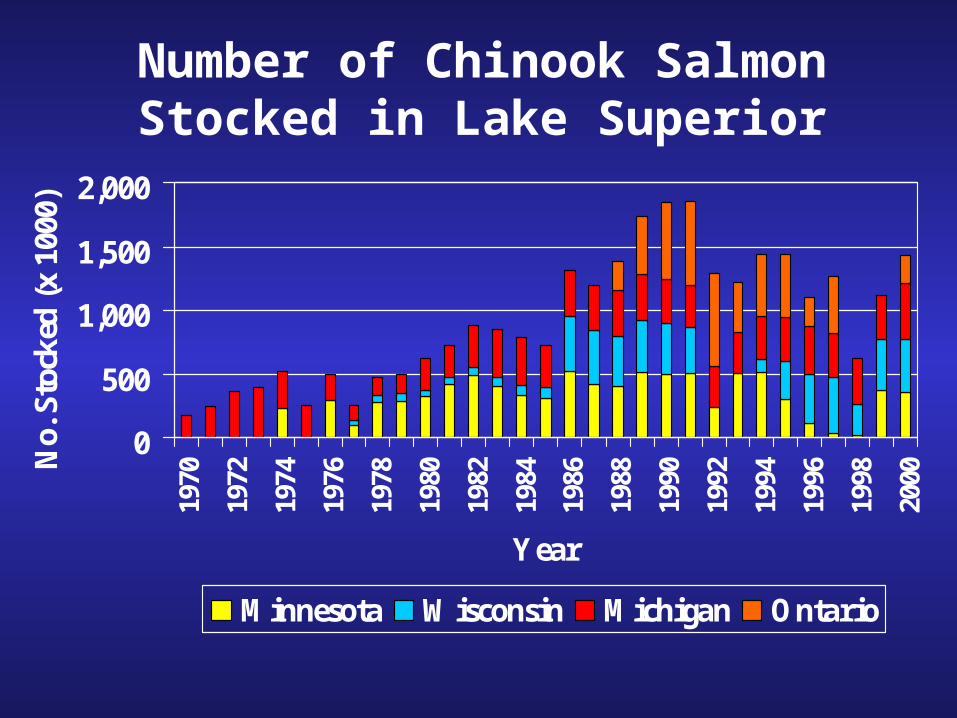
Number of Chinook Salmon Stocked in Lake Superior
0
500
1,000
1,500
2,00019
70
1972
1974
1976
1978
1980
1982
1984
1986
1988
1990
1992
1994
1996
1998
2000
Year
No.
Sto
cked
(x
1000
)
Minnesota Wisconsin Michigan Ontario
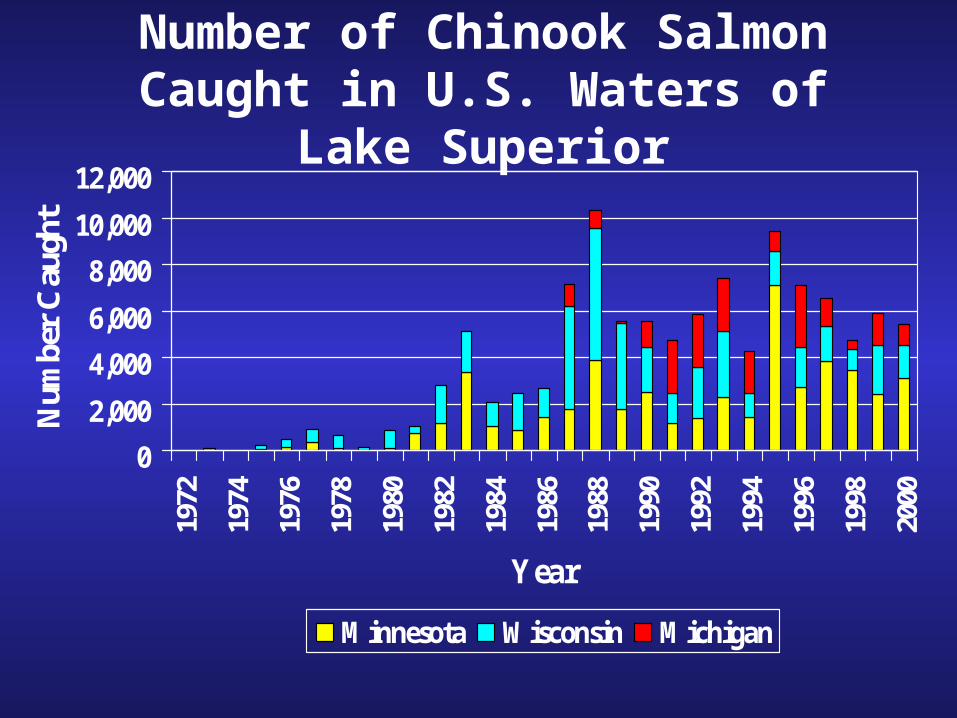
Number of Chinook Salmon Caught in U.S. Waters of Lake Superior
0
2,000
4,000
6,000
8,000
10,000
12,00019
72
1974
1976
1978
1980
1982
1984
1986
1988
1990
1992
1994
1996
1998
2000
Year
Num
ber
Cau
ght
Minnesota Wisconsin Michigan
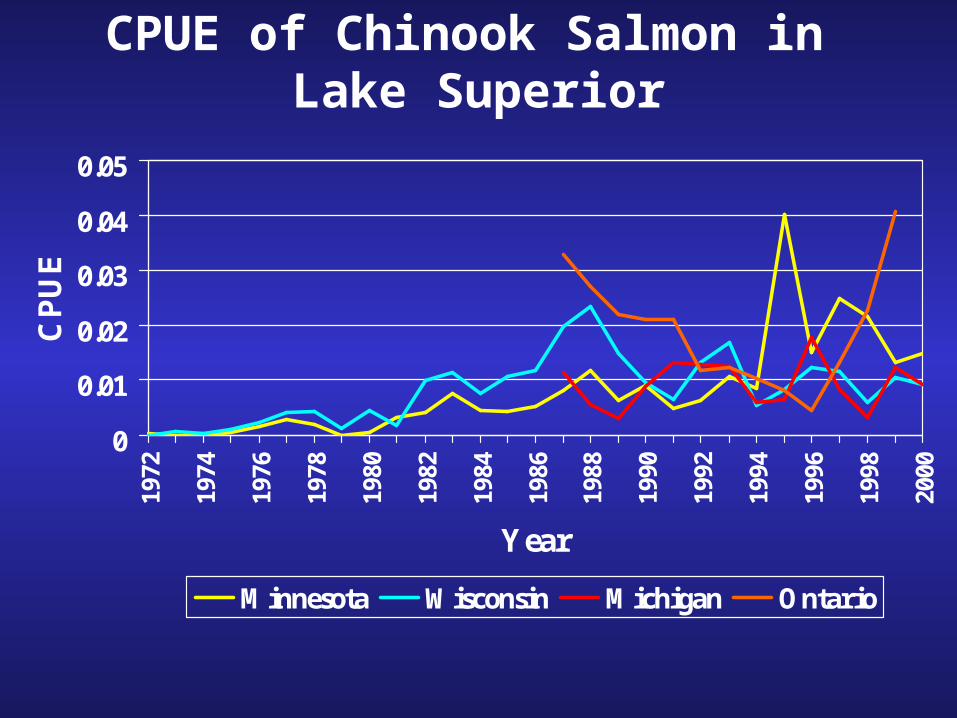
CPUE of Chinook Salmon in Lake Superior
0
0.01
0.02
0.03
0.04
0.0519
72
1974
1976
1978
1980
1982
1984
1986
1988
1990
1992
1994
1996
1998
2000
Year
CP
UE
Minnesota Wisconsin Michigan Ontario
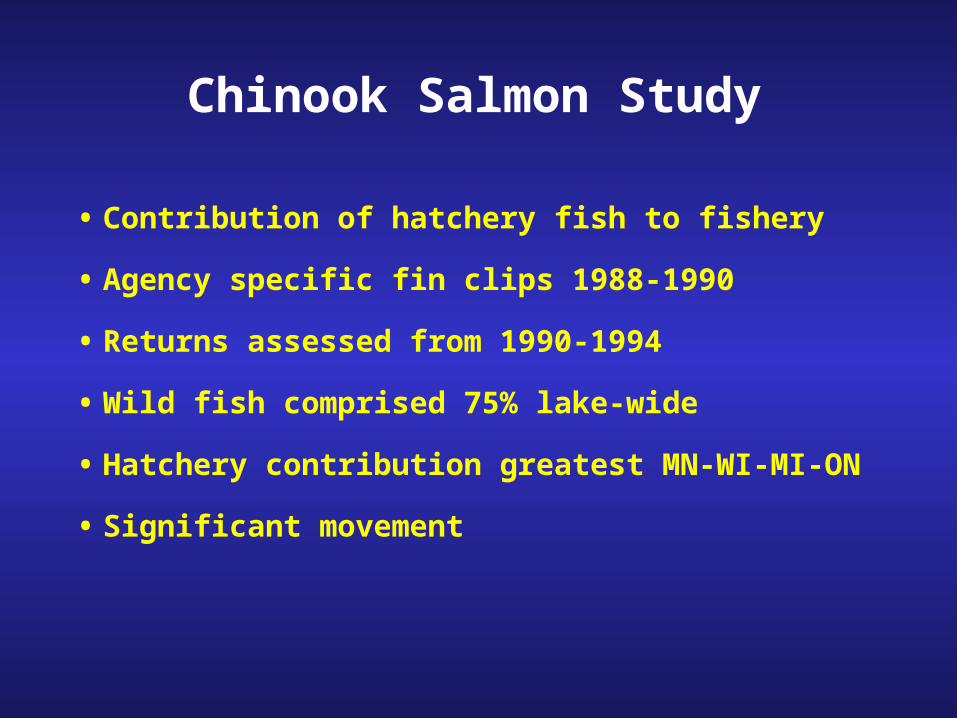
Chinook Salmon Study
• Contribution of hatchery fish to fishery
• Agency specific fin clips 1988-1990
• Returns assessed from 1990-1994
• Wild fish comprised 75% lake-wide
• Hatchery contribution greatest MN-WI-MI-ON
• Significant movement
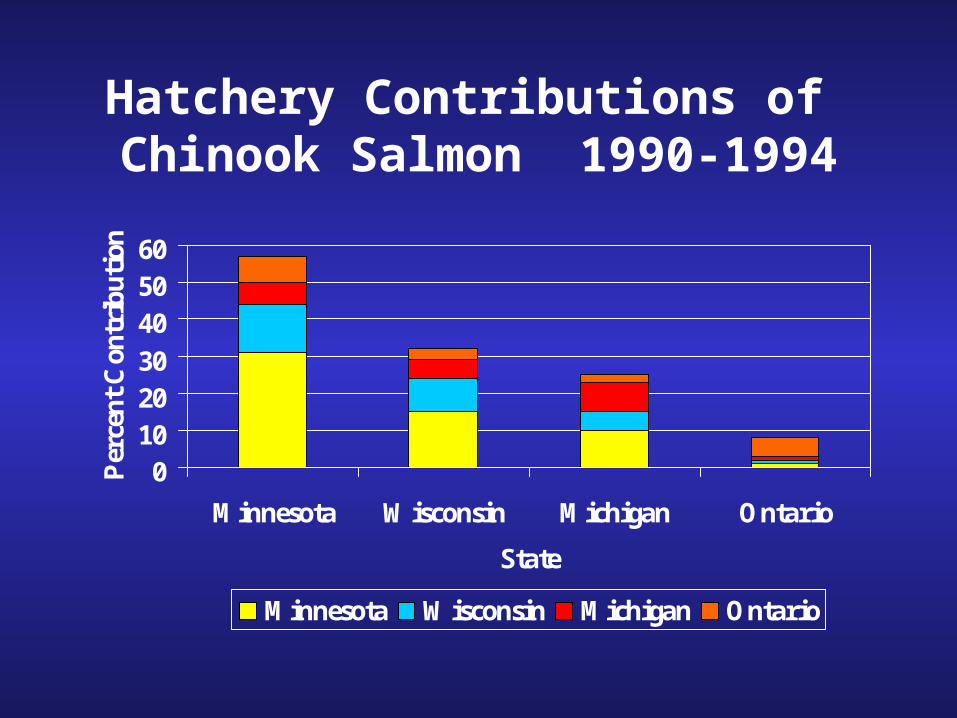
Hatchery Contributions of Chinook Salmon 1990-1994
0102030
405060
Minnesota Wisconsin Michigan Ontario
State
Per
cen
t C
ontr
ibu
tion
Minnesota Wisconsin Michigan Ontario
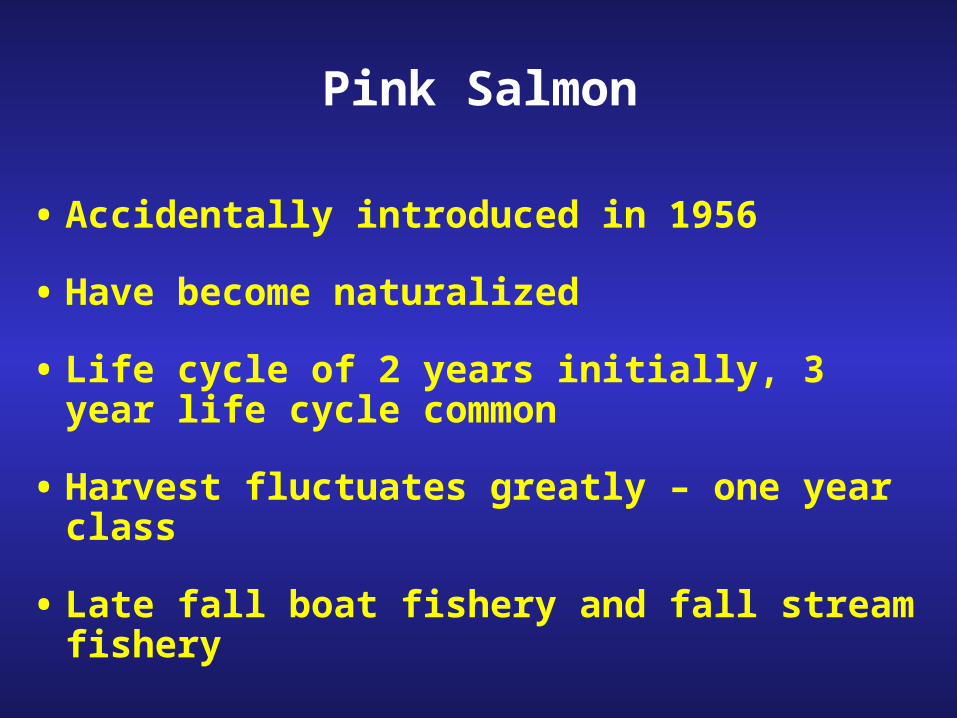
Pink Salmon
• Accidentally introduced in 1956
• Have become naturalized
• Life cycle of 2 years initially, 3 year life cycle common
• Harvest fluctuates greatly – one year class
• Late fall boat fishery and fall stream fishery
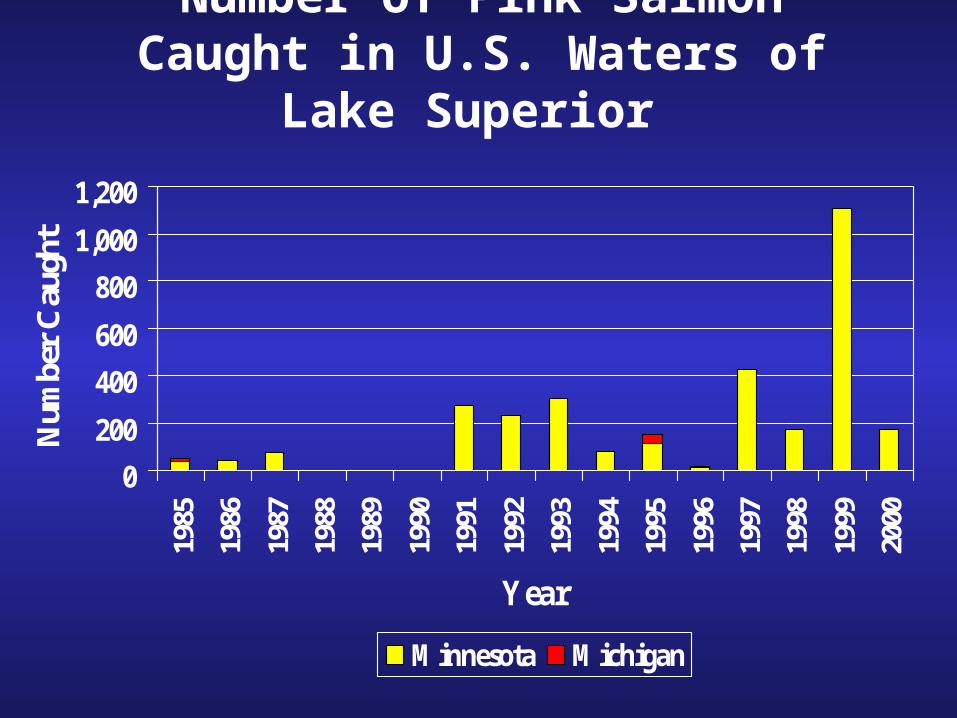
Number of Pink Salmon Caught in U.S. Waters of Lake Superior
0
200
400
600
800
1,000
1,20019
85
1986
1987
1988
1989
1990
1991
1992
1993
1994
1995
1996
1997
1998
1999
2000
Year
Num
ber
Cau
ght
Minnesota Michigan
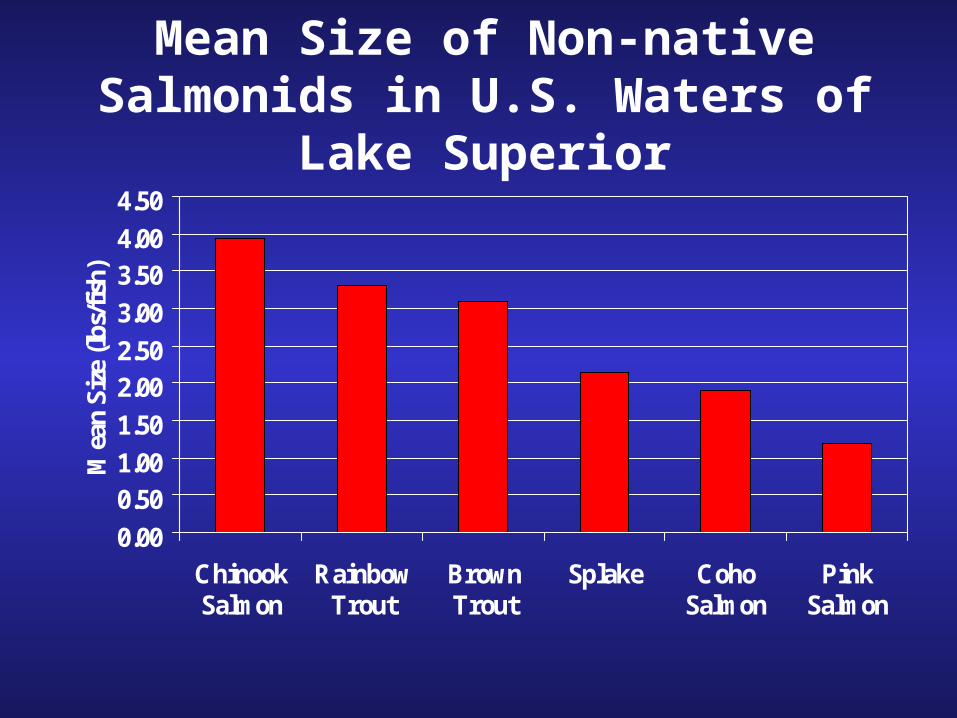
Mean Size of Non-native Salmonids in U.S. Waters of Lake Superior
0.00
0.501.00
1.50
2.002.50
3.00
3.504.00
4.50
ChinookSalmon
RainbowTrout
BrownTrout
Splake CohoSalmon
PinkSalmon
Mea
n Si
ze (
lbs/
fish
)
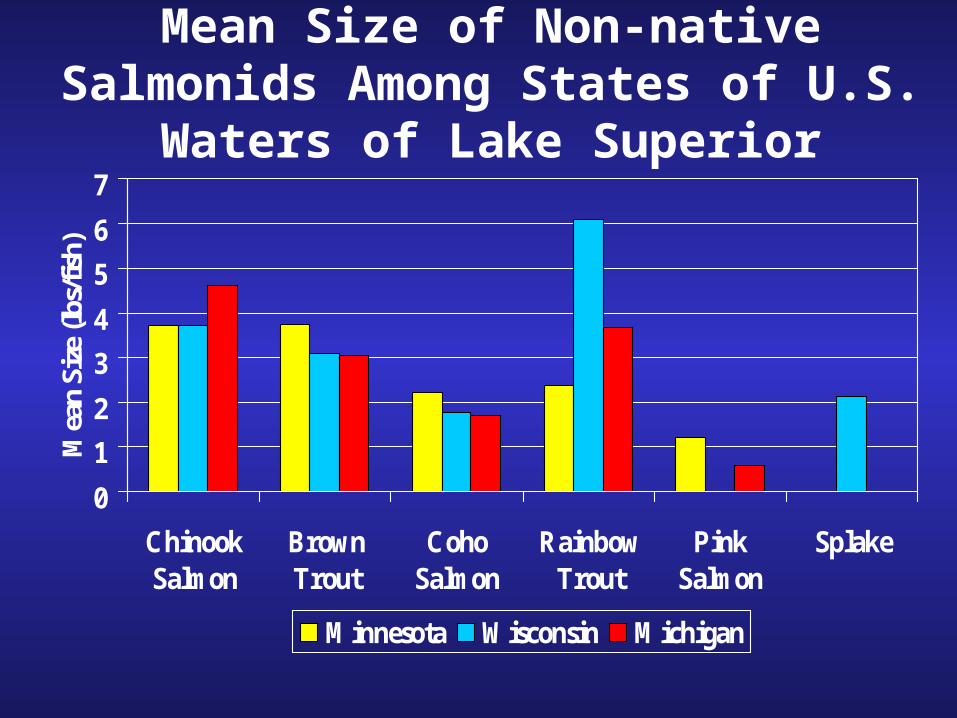
Mean Size of Non-native Salmonids Among States of U.S. Waters of Lake Superior
0
1
2
3
4
5
6
7
ChinookSalmon
BrownTrout
CohoSalmon
RainbowTrout
PinkSalmon
Splake
Mea
n Si
ze (l
bs/fi
sh)
Minnesota Wisconsin Michigan
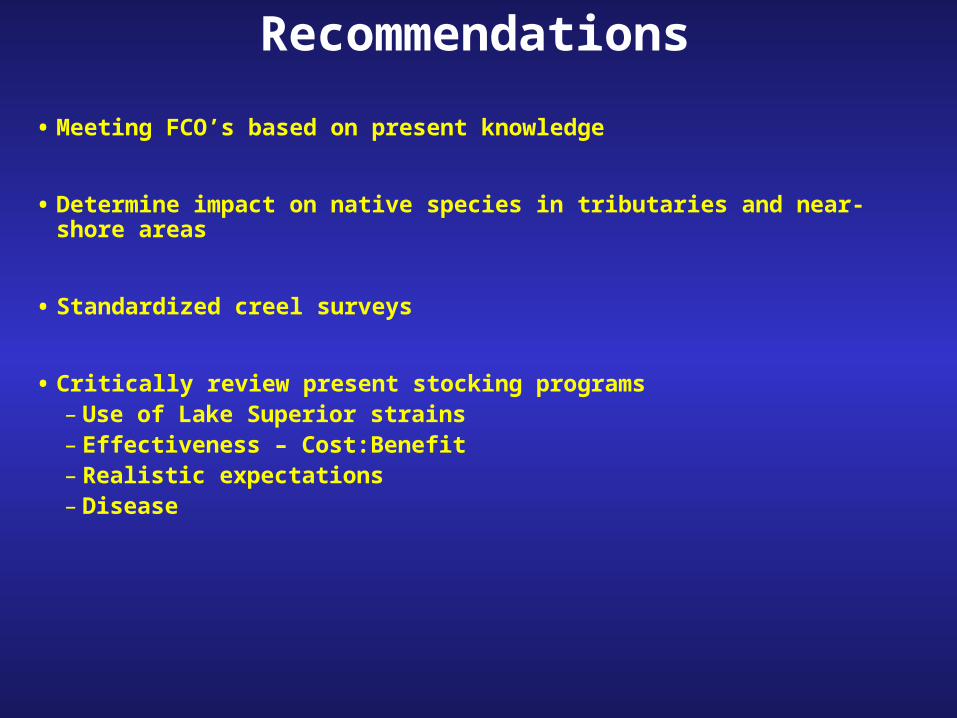
Recommendations
• Meeting FCO’s based on present knowledge
• Determine impact on native species in tributaries and near-shore areas
• Standardized creel surveys
• Critically review present stocking programs – Use of Lake Superior strains – Effectiveness – Cost:Benefit– Realistic expectations– Disease