non-invasive measurement of deep tissue temperature changes caused by apoptosis during breast
TRANSCRIPT
NON-INVASIVE MEASUREMENT OF DEEPTISSUE TEMPERATURE CHANGES
CAUSED BY APOPTOSIS DURING BREASTCANCER NEOADJUVANT CHEMOTHERAPY:
A CASE STUDY
SO HYUN CHUNGDepartment of Physics and Astronomy, University of Pennsylvania
209 S. 33rd St, Philadelphia, PA 19104, [email protected]
RITA MEHTADepartment of Medicine, UC Irvine Healthcare
101 The City Drive South, Orange, CA 92868, [email protected]
BRUCE J. TROMBERGBeckman Laser Institute, Department of Biomedical Engineering
University of California, Irvine, 1002 Health Sciences RdIrvine, CA 92612, USA
A. G. YODHDepartment of Physics and Astronomy, University of Pennsylvania
209 S. 33rd St, Philadelphia, PA 19104, [email protected]
Accepted 7 July 2011
Treatment-induced apoptosis of cancer cells is one goal of cancer therapy. Interestingly, moreheat is generated by mitochondria during apoptosis, especially the uncoupled apoptotic state,1,2
compared to the resting state. In this case study, we explore these thermal e®ects by long-itudinally measuring temperature variations in a breast lesion of a pathological completeresponder during neoadjuvant chemotherapy (NAC). Di®use Optical Spectroscopic Imaging(DOSI) was employed to derive absolute deep tissue temperature using subtle spectral features ofthe water peak at 975 nm.3 A signi¯cant temperature increase was observed in time windowsduring the anthracycline and cyclophosphamide (AC) regimen but not in the paclitaxel andbevacizumab regimen. Hemoglobin concentration changes generally did not follow temperature,suggesting the measured temperature increases were likely due to mitochondrial uncouplingrather than a direct vascular e®ect. A simultaneous increase of tissue oxygen saturation withtemperature was observed, suggesting that oxidative stress also contributes to apoptosis.Although preliminary, this study indicates longitudinal DOSI tissue temperature monitoring
Journal of Innovative Optical Health SciencesVol. 4, No. 4 (2011) 361�372#.c World Scienti¯c Publishing CompanyDOI: 10.1142/S1793545811001708
361
provides information that can improve our understanding of the mechanisms of tissue responseduring NAC.
Keywords: Deep tissue temperature; Di®use Optical Spectroscopic Imaging; apoptosis; neoad-juvant chemotherapy; breast cancer; Bound Water Index; NIR water absorption spectrum.
1. Introduction
The metabolism of mitochondria can be monitoredby measuring its thermogenic activity. Mitochon-drial heating rate, for example, has been correlatedwith the rate of oxygen utilization during NADHoxidation.4 Moreover, in an experiment using iso-lated rat liver mitochondria,1 heat generation hasbeen observed to increase four-fold in the uncoupledapoptotic state compared to resting state of mito-chondria, due to increased enthalpy during hy-drolysis of ATP. In the uncoupled apoptotic state,the formation of mitochondrial permeability porespermits e®lux of cations and larger molecules and,in the highest conductance state, this phenomenacan cause loss of mitochondrial membrane poten-tial, swelling of membrane, and uncoupling of oxi-dative phosphorylation. The swelling disrupts themembrane and causes the release of protons andsoluble membrane protein.5 Additionally, duringapoptosis, more numerous and smaller mitochon-dria are produced,6 an e®ect which at least in partcan explain the increased heat generation. A suc-cessful anticancer drug based on these e®ects wouldcause uncoupling of mitochondria, which in turncould lead to apoptosis by opening ion channelpores or increasing mitochondrial membrane per-meability.7 In this contribution, we explore thesethermal e®ects by measuring temperature vari-ations in a breast lesion of a pathological completeresponder longitudinally during neoadjuvant che-motherapy (NAC).
We employ Di®use Optical Spectroscopic Ima-ging (DOSI) to measure deep tissue temperature,using spectral features of the water absorption peakaround 975 nm.3 Scattering-corrected absorptionspectra exhibit subtle spectral shifts and broadeningof the water peak due to both bound water andtemperature variation. Recently, Chung et al. havedemonstrated a method that employs bound water-corrected absorption spectra to measure absolutetissue temperature.3 Using this method, DOSI hasexhibited temperature sensitivity similar to that ofa thermistor and has been validated for in vivo deeptissue measurement in humans.8�12 Here we employDOSI to monitor absolute temperature of a breastwith an in¯ltrating ductal carcinoma (IDC), and weconcurrently measure oxy- and deoxy-hemoglobinconcentrations in these same tissues. The exper-iments suggest that the measured changes arecaused by apoptosis during NAC.
2. Subject and Methods
2.1. Subject
A 63-year-old subject with an IDC in both breastswas measured. The patient had a tumor of about40mm in size (i.e., the longest axis as measured byultrasound and mammography) at 7 o'clock, 9 cmfrom the nipple in her left breast; the left breastis measured in this study. The patient receivedNAC with two di®erent regimens: Adriamycin
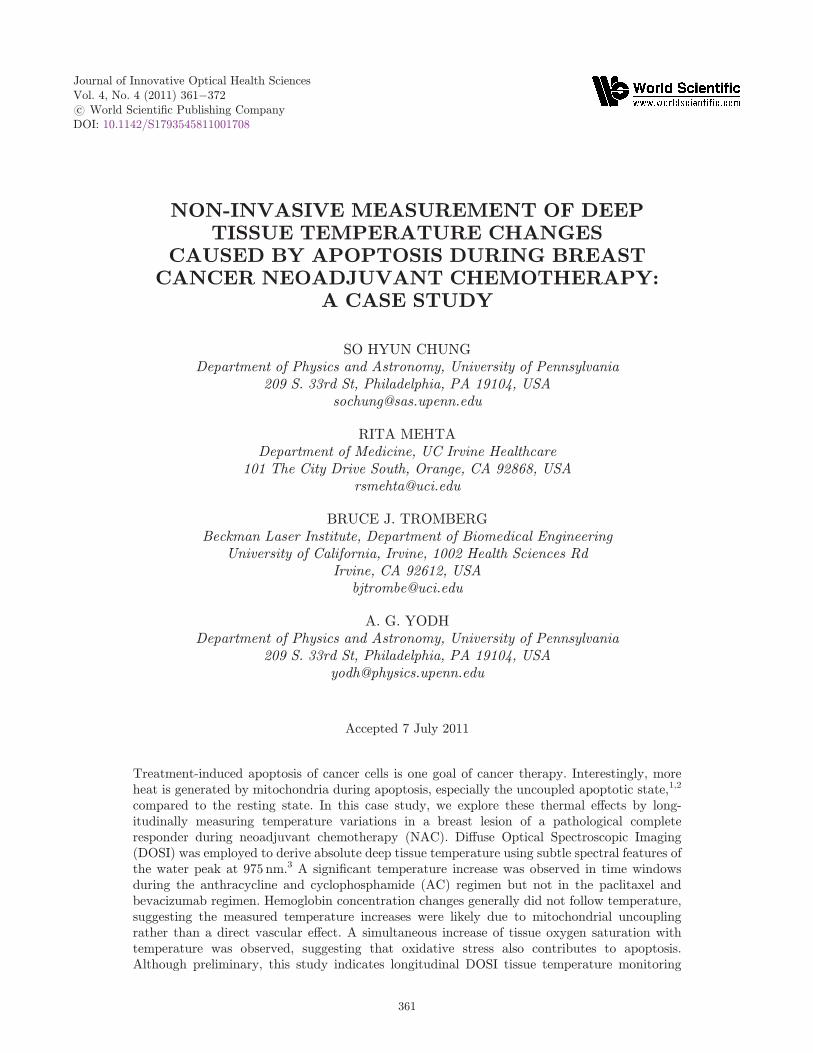
Fig. 1. NAC and DOSI monitoring schedule. Orange arrows: AC dosage; Green arrows: CAA dosage; Red arrows: DOSImeasurements.
362 S. H. Chung et al.
(anthracycline) + Cytoxan (cyclophosphamide)(AC, one-and-a-half months) and Carboplatin +Albumin-bound paclitaxel +Avastin (Bevacizumab)(CAA, three months). The patient was measured 19times during the course of therapy: at a pre-treat-ment time (13 days before the ¯rst chemotherapy), at8 points during AC (day 1, 2, 5, 6, 7, 12, 15 and 29post the ¯rst chemotherapy), at 1 point in betweenAC and CAA (day 50) at 8 points during CAA (day65, 71, 72, 78, 92, 99, 146 and 153), and after com-pletion of therapy (day 175) (Fig. 1). The patient wasa pathological complete responder.
2.2. Methods
DOSI employs low power near-infrared light toquantify optical and physiological properties of tis-sues. The di®usion model a®ords quantitative deter-mination of tissue chromophore absorption spectra byseparating scattering from absorption. A detaileddescription of the DOSI system employed in thisstudy has been given in previous publications.3,8,11�13
Brie°y, DOSI combines multimodulation frequency(50�600MHz), frequency-domain photon migration(FDPM) with broadband steady-state (SS) spec-troscopy. FDPM employs a model-based analysis
(a) (b)
(c) (d)
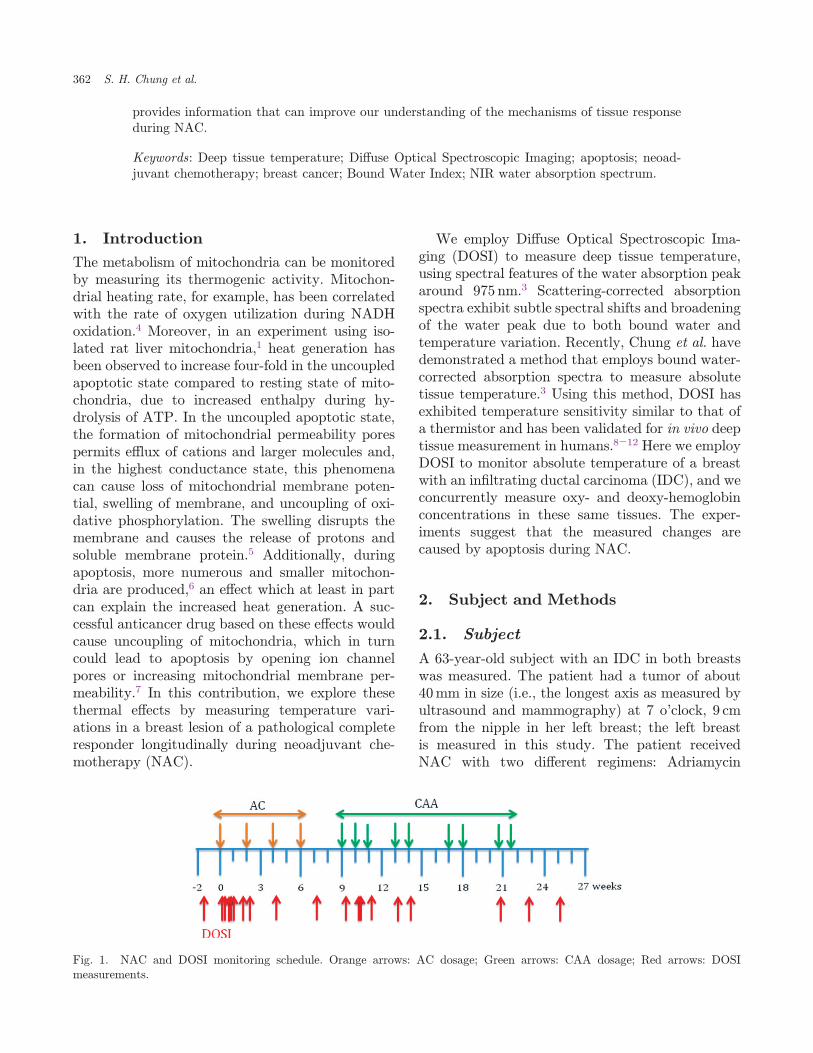
Fig. 2. Tissue temperature estimation procedure. (a) Breast tissue absorption spectrum (from areola); (b) Spectrum after removalof the contributions of all chromophores except water (dashed blue) and after subsequent normalization (solid red); (c) Normalizedtissue water spectrum before (solid red) and after (dashed blue) bound-water-correction by blue-shifting; (d) Fit of a pure waterspectrum to the \bound-water-corrected tissue water spectrum".
Non-Invasive Measurement of Deep Tissue Temperature Changes 363
(i.e., the di®usion approximation in the semi-in¯nitegeometry with extrapolated zero boundary con-ditions) to quantify tissue absorption (�aÞ and scat-tering (� 0
s) parameters at discrete wavelengths.14�17
The � 0s derived at each wavelength (658, 682, 785,
810, 830 and 850 nm) is ¯t to Mie theory to derivea continuous wavelength-dependent predictionof the tissue-scattering parameter.18 Using theso-determined � 0
s, we readily extract a continuoustissue absorption spectrum from the broadband SSre°ectance data. The scattering-separated absorptionspectrum from 650 to 1010nm reveals features of thewater absorption that are utilized for the temperaturecalculation.3 Major tissue chromophore concen-trations such as oxy- and deoxy-hemoglobin (ctHbO2
and ctHb, respectively), lipid (ctLipid), and tissueoxygen saturation (StO2 ¼ ctHbO2=ðctHbO2 þctHbÞ � 100) were also derived from these tissueabsorption spectra.
The instrument response functions were cali-brated using tissue-simulating phantoms for FDPMand a spectra°ect-coated re°ectance phantom withknown scattering and absorption values for broad-band SS measurements as described in Cerussi et al.8
The source-detector separation for all measurementswas 29mm.
2.3. Deep tissue temperature
measurement
The water peak appears between 935 and 1010 nm,and it provides information about tissue water state,water concentration, and absolute temperature.3,11
The e®ect of bound water on the peak was removedby spectral processing as explained in detail inChung et al.3 Brie°y, starting with the \total"tissue absorption spectrum (Fig. 2(a)), the contri-butions from other chromophores (oxy- and deoxy-hemoglobin, lipid and baseline-o®set) were removedby subtracting their distinct spectra (i.e., chromo-phore extinction coe±cient spectra times chromo-phore concentration) (Fig. 2(b) dashed-blue). Theremaining \tissue water spectrum" was then nor-malized by amultiplicative constant so that the peakof the \tissue water spectrum" matched that of thepure water spectrum (Fig. 2(b) red).We then correctfor bound water e®ects, which appear as broadening
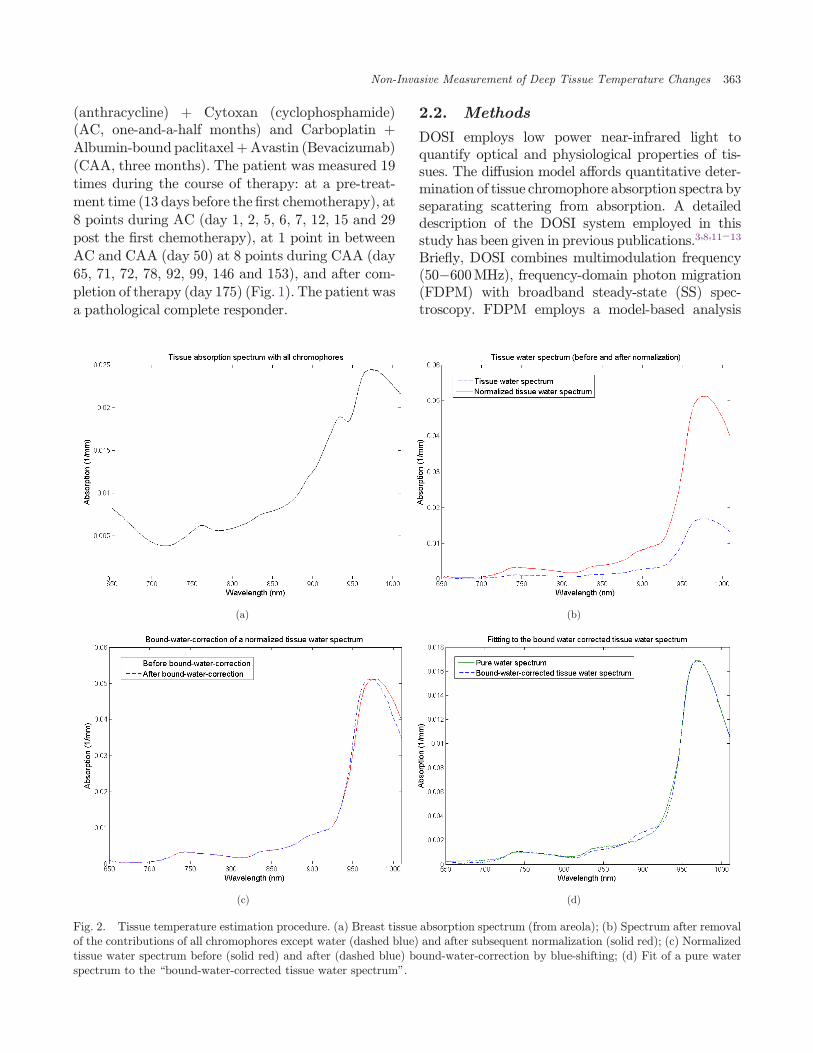
Fig. 3. Free water absorption spectra measured as a functionof temperature (15��65�C). An isosbestic point at 996 nm isclearly observed. (Reprinted with permission from Phys. Biol.Med. doi: 10.1088/0031-9155/53/23/005).
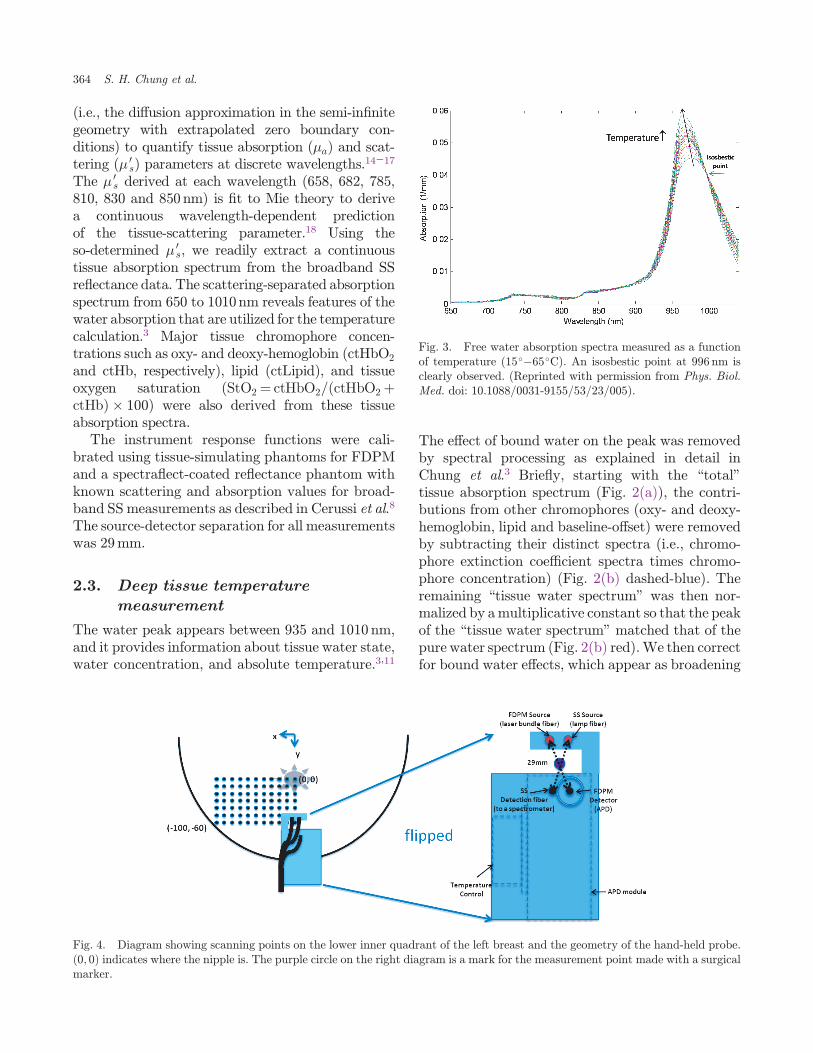
Fig. 4. Diagram showing scanning points on the lower inner quadrant of the left breast and the geometry of the hand-held probe.ð0; 0Þ indicates where the nipple is. The purple circle on the right diagram is a mark for the measurement point made with a surgicalmarker.
364 S. H. Chung et al.

of the water peak; in particular the \normalizedtissue water spectrum" between 935 and 1010 nmwas linearly blue-shifted (Fig. 2(c)) until itsabsorption at 996 nm (i.e., at the isosbestic point) isthe same as that of pure water at 996 nm (Fig. 3).Finally, the bound-water-corrected water spectrumwas \de-normalized" by the reciprocal of the nor-malizing multiplicative constant. The result is a\bound-water-corrected tissue water spectrum"(Fig. 2(d)). This resultant spectrum is ¯t to thewater spectrum library at varying temperatures todetermine a \best-¯t" tissue temperature.
2.4. Spectroscopic images
Figure 4 illustrates how the hand-held probe is usedto measure multiple locations on the left breast. Allpoints were used to form a spectroscopic image of thelower inner quadrant of the left breast (77 points,11� 7), and to calculate averages of the underlyingtissue temperature and tissue chromophore concen-trations. In order to generate \smoothed" spectro-scopic images, linear interpolation was used to
assign values in between the discrete measurements(taken in 1-cm increments).19 Temperature vari-ations for the subject were determined from the fullspectroscopic images of the lesion breast at each timepoint during NAC (Fig. 1). The lesion size, measuredby ultrasound, varied during therapy. Approxi-mately twomonths before NAC began, the lesion was40mm (longest axis, by ultrasound and mammo-graphy), and a month before starting it was 34mmby PET-CT. The breast had high density plusmultiple, scattered punctate-calci¯cations. After allAC doses, the size of the lesion shrunk to 17mm. Dueto these dynamic size changes and the relativemovement of the tumor in the ¯eld of view, anaverage value of all spatial points, including bothlesion and normal tissues, was used to monitor andassign a value for tissue temperature variation duringtherapy.
3. Results
Figure 5 shows temperature changes of the subject'sleft breast during NAC. All images are derived from
Fig. 5. DOSI images of temperature variation in a lesion breast during NAC. In clockwise order: (a) baseline, (b) after three dosesof AC, (c) after three doses of CAA, (d) after completion of therapy. The color bar indicates temperature in degree Celsius.
Non-Invasive Measurement of Deep Tissue Temperature Changes 365

the lower left inner quadrant of the left breast. Thepoint ð0; 0Þ is at the nipple; from the nipple,the vertical scan extends from 0 to �60mm and thehorizontal scan extends from 0 to �100mm. Theimage (a) is derived 13 days prior to the beginningof the therapy (baseline), (b) is post three doses ofAC (¯rst regimen), (c) is after three doses of CAA
(second regimen), and (d) is after completion of theentire therapy. The average tissue temperature �standard deviation is derived using all the points oneach image (i.e., N ¼ 77 for each image); these tem-peratures are 36� 0:6�C, 39:5� 1:2�C, 38� 0:8�Cand 36:9� 0:7�C, respectively. The patient had acore temperature measurement of 36.6�C.
Fig. 6. TOI images at the same time points measured as the temperature images in Fig. 5. In clockwise order: (a) baseline, (b) afterthree doses of AC, (c) after three doses of CAA, (d) after completion of the therapy. The color bar is the contrast ofTOI ¼ ðctHb� ctH2O/ctLipid).
Fig. 7. Temperature change during NAC. All the points on a spectroscopic image were averaged to get blue points. Error barsrepresent � twice-the-standard-error for the points in the image, which gives a 95% con¯dence interval.
366 S. H. Chung et al.
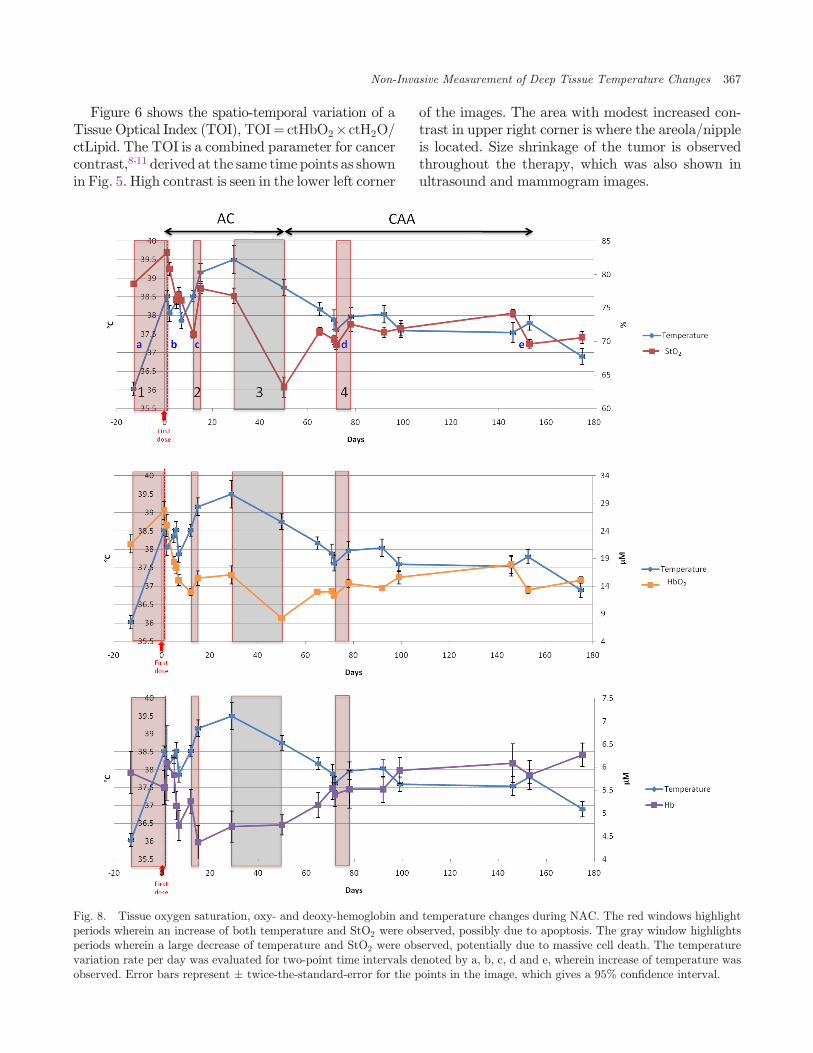
Figure 6 shows the spatio-temporal variation of aTissue Optical Index (TOI), TOI¼ ctHbO2�ctH2O/ctLipid. The TOI is a combined parameter for cancercontrast,8,11 derived at the same time points as shownin Fig. 5. High contrast is seen in the lower left corner
of the images. The area with modest increased con-trast in upper right corner is where the areola/nippleis located. Size shrinkage of the tumor is observedthroughout the therapy, which was also shown inultrasound and mammogram images.
Fig. 8. Tissue oxygen saturation, oxy- and deoxy-hemoglobin and temperature changes during NAC. The red windows highlightperiods wherein an increase of both temperature and StO2 were observed, possibly due to apoptosis. The gray window highlightsperiods wherein a large decrease of temperature and StO2 were observed, potentially due to massive cell death. The temperaturevariation rate per day was evaluated for two-point time intervals denoted by a, b, c, d and e, wherein increase of temperature wasobserved. Error bars represent � twice-the-standard-error for the points in the image, which gives a 95% con¯dence interval.
Non-Invasive Measurement of Deep Tissue Temperature Changes 367
Longitudinal measurements of average tissuetemperature are shown in Fig. 7. Each blue point isan average of all points in the image (total 77points) and the error bars indicate � twice-the-standard-error for the points in the image, whichgives a 95% con¯dence interval.20 The average tis-sue temperature increased with some °uctuationsduring AC therapy. The range of variation is from36.0 to 39.5�C, and the di®erence, 3.5�C, wasselected as our de¯nition of \100% temperaturevariation" in following text. In the following wedescribe variations as a percent of this maximumtemperature change. During CAA, tissue tempera-ture generally decreased. After completion oftherapy (i.e., the last DOSI measurement), theaverage tissue temperature was 36:9� 0:7�C.
Tissue oxygen saturation (StO2Þ and tissue oxy-and deoxy-hemoglobin concentration (ctHbO2 andctHb) are plotted along with tissue temperature inFig. 8. A rapid increase of both temperature andStO2 was observed in the beginning of therapy(window 1). In window 1, overall consumption ofoxygen decreased; this decrease might be due to celldeath, as indicated by a decrease of ctHb and an
accompanying increase in ctHbO2. Hypoxia with°uctuating temperature followed, and then anotherconcurrent period of rapid increase of both tem-perature and StO2 was observed (window 2), with adecrease of oxygen consumption similar to thatobserved in window 1. After a rather slow increaseof temperature between windows 2 and 3, an overallgentle decrease of temperature was observed duringthe rest of therapy with exception during a fewperiods such as in window 4 (with an accompanyingincrease of StO2Þ. However in this case (window 4),both oxy- and deoxy-Hb increased. In window 3, alarge decrease of StO2 was accompanied by adecrease in temperature.
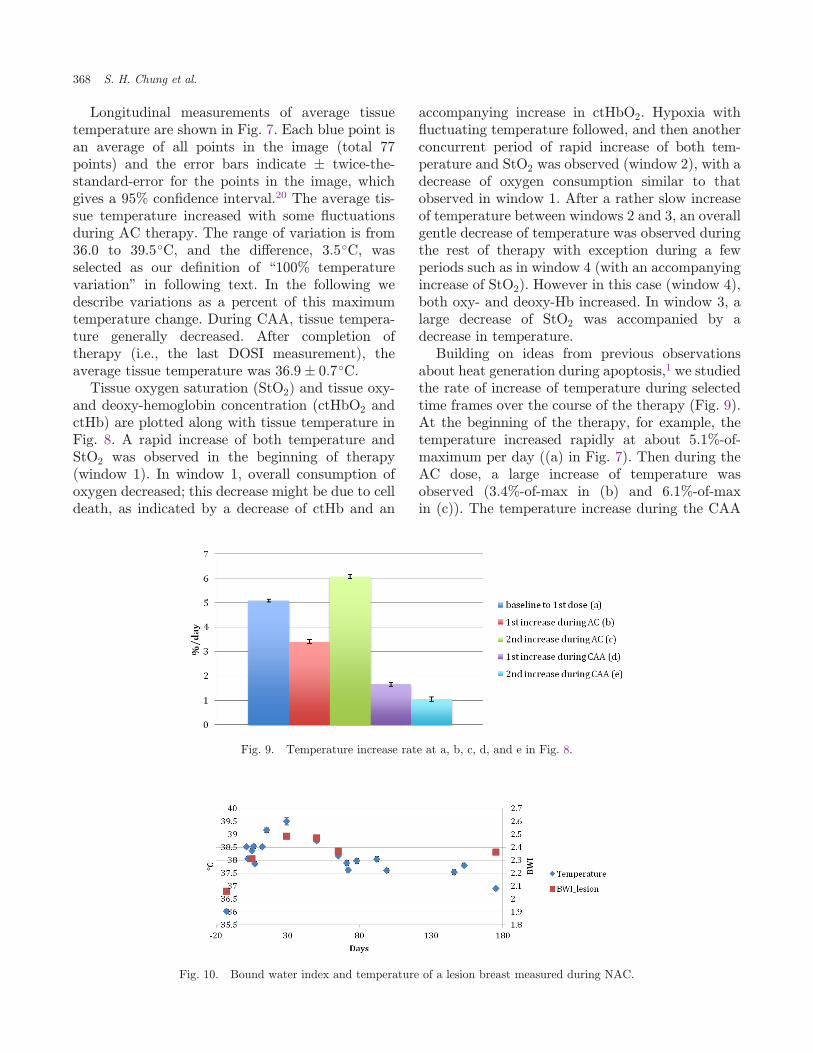
Building on ideas from previous observationsabout heat generation during apoptosis,1 we studiedthe rate of increase of temperature during selectedtime frames over the course of the therapy (Fig. 9).At the beginning of the therapy, for example, thetemperature increased rapidly at about 5.1%-of-maximum per day ((a) in Fig. 7). Then during theAC dose, a large increase of temperature wasobserved (3.4%-of-max in (b) and 6.1%-of-maxin (c)). The temperature increase during the CAA
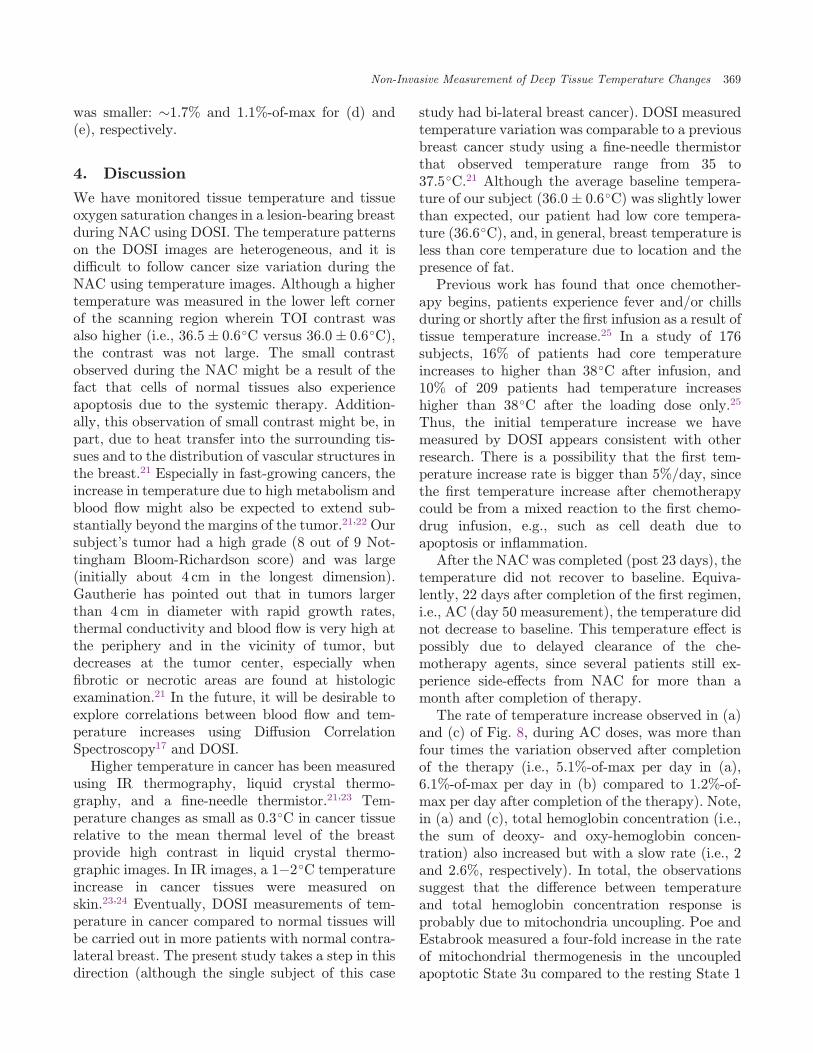
Fig. 10. Bound water index and temperature of a lesion breast measured during NAC.
Fig. 9. Temperature increase rate at a, b, c, d, and e in Fig. 8.
368 S. H. Chung et al.
was smaller: �1.7% and 1.1%-of-max for (d) and(e), respectively.
4. Discussion
We have monitored tissue temperature and tissueoxygen saturation changes in a lesion-bearing breastduring NAC using DOSI. The temperature patternson the DOSI images are heterogeneous, and it isdi±cult to follow cancer size variation during theNAC using temperature images. Although a highertemperature was measured in the lower left cornerof the scanning region wherein TOI contrast wasalso higher (i.e., 36:5� 0:6�C versus 36:0� 0:6�C),the contrast was not large. The small contrastobserved during the NAC might be a result of thefact that cells of normal tissues also experienceapoptosis due to the systemic therapy. Addition-ally, this observation of small contrast might be, inpart, due to heat transfer into the surrounding tis-sues and to the distribution of vascular structures inthe breast.21 Especially in fast-growing cancers, theincrease in temperature due to high metabolism andblood °ow might also be expected to extend sub-stantially beyond the margins of the tumor.21,22 Oursubject's tumor had a high grade (8 out of 9 Not-tingham Bloom-Richardson score) and was large(initially about 4 cm in the longest dimension).Gautherie has pointed out that in tumors largerthan 4 cm in diameter with rapid growth rates,thermal conductivity and blood °ow is very high atthe periphery and in the vicinity of tumor, butdecreases at the tumor center, especially when¯brotic or necrotic areas are found at histologicexamination.21 In the future, it will be desirable toexplore correlations between blood °ow and tem-perature increases using Di®usion CorrelationSpectroscopy17 and DOSI.
Higher temperature in cancer has been measuredusing IR thermography, liquid crystal thermo-graphy, and a ¯ne-needle thermistor.21,23 Tem-perature changes as small as 0.3�C in cancer tissuerelative to the mean thermal level of the breastprovide high contrast in liquid crystal thermo-graphic images. In IR images, a 1�2�C temperatureincrease in cancer tissues were measured onskin.23,24 Eventually, DOSI measurements of tem-perature in cancer compared to normal tissues willbe carried out in more patients with normal contra-lateral breast. The present study takes a step in thisdirection (although the single subject of this case
study had bi-lateral breast cancer). DOSI measuredtemperature variation was comparable to a previousbreast cancer study using a ¯ne-needle thermistorthat observed temperature range from 35 to37.5�C.21 Although the average baseline tempera-ture of our subject (36:0� 0:6�C) was slightly lowerthan expected, our patient had low core tempera-ture (36.6�C), and, in general, breast temperature isless than core temperature due to location and thepresence of fat.
Previous work has found that once chemother-apy begins, patients experience fever and/or chillsduring or shortly after the ¯rst infusion as a result oftissue temperature increase.25 In a study of 176subjects, 16% of patients had core temperatureincreases to higher than 38�C after infusion, and10% of 209 patients had temperature increaseshigher than 38�C after the loading dose only.25
Thus, the initial temperature increase we havemeasured by DOSI appears consistent with otherresearch. There is a possibility that the ¯rst tem-perature increase rate is bigger than 5%/day, sincethe ¯rst temperature increase after chemotherapycould be from a mixed reaction to the ¯rst chemo-drug infusion, e.g., such as cell death due toapoptosis or in°ammation.
After the NAC was completed (post 23 days), thetemperature did not recover to baseline. Equiva-lently, 22 days after completion of the ¯rst regimen,i.e., AC (day 50 measurement), the temperature didnot decrease to baseline. This temperature e®ect ispossibly due to delayed clearance of the che-motherapy agents, since several patients still ex-perience side-e®ects from NAC for more than amonth after completion of therapy.
The rate of temperature increase observed in (a)and (c) of Fig. 8, during AC doses, was more thanfour times the variation observed after completionof the therapy (i.e., 5.1%-of-max per day in (a),6.1%-of-max per day in (b) compared to 1.2%-of-max per day after completion of the therapy). Note,in (a) and (c), total hemoglobin concentration (i.e.,the sum of deoxy- and oxy-hemoglobin concen-tration) also increased but with a slow rate (i.e., 2and 2.6%, respectively). In total, the observationssuggest that the di®erence between temperatureand total hemoglobin concentration response isprobably due to mitochondria uncoupling. Poe andEstabrook measured a four-fold increase in the rateof mitochondrial thermogenesis in the uncoupledapoptotic State 3u compared to the resting State 1
Non-Invasive Measurement of Deep Tissue Temperature Changes 369

by measuring generated heat per minute in a Dewarcontaining rat liver mitochondria, using a di®eren-tial calorimeter.1,2 They corroborated this result byadding the protonphore, dinitrophenol (DNP), togenerate uncoupling of the mitochondria. Thisincrease in heat generation was suggested to be dueto the heat evolved during hydrolysis of the ATPpresent in the uncoupled apoptotic state, whichgenerates twice as much heat as oxidative phos-phorylation.1,26,27 Thus, the approximately four-fold rate of temperature increase during AC therapymeasured in our study may be closely related tothermogenesis during the uncoupled apoptoticstate.
Additionally, the concurrent increase of tissueoxygen saturation and decrease of Hb concentrationduring AC periods of rapid temperature increaseindicate that oxygenuptake by tissuewas diminishedduring these periods. This observation suggestsgreater uncoupling, rather than oxidative phos-phorylation.1 An oxygen concentration increaseduring the uncoupling state promotes formation ofproducts of reactive oxygen species (ROS), whicheventually damage cellular components includingDNA.28,29 Evidence30�37 that oxidative stressinitiates uncoupling of mitochondria that leads toapoptosis is this: high levels of ROS open mitochon-drial pores leading to maximal substrate consump-tion, ATP hydrolysis, and release of mitochondrialapoptosis-inducing factor. Eliminating superoxide-producing cells is a mechanism for arresting cellproliferation observed in cancer tissues.38
Thus the observed increase of temperature andStO2 suggests that uncoupling of mitochondria isoccurring during NAC. The behavior in window 3during AC (Fig. 8) might be due to massive celldeath following the large amount of uncoupling incancer tissues that occurred in windows 1 and 2.Another increase of temperature and StO2 wasobserved during CAA, but its small magnitudemight not have caused signi¯cant cell death. Ourresults are thus consistent with the notion that theAC therapy is the major cause of cancer cell death,which can ultimately lead to complete therapeuticresponse.
We also measured the Bound Water Index(BWI) in the lesion-bearing breast at a few timepoints during chemotherapy (Fig. 10). BWI gener-ally increased with temperature as therapy pro-gressed and the tissue returned to a more normalstate.9�11 The correlation of BWI with temperature
may be related to apoptosis-induced changes in thetissue distribution of water-associated macromol-ecules and could be a consequence of uncoupling ofmitochondria, membrane disruption and release ofsoluble membrane proteins (more than 1500 Dal)during AC dosage.5 The observed decrease of BWIafter AC dosage (but with a value still higher thanbaseline) might be due to cleaning of excessive deadcells after apoptosis and remaining normal cells byphagocytes.
It is possible that there is an e®ect from collagenchanges in the stroma, although most chemother-apy agents target cancer cells, and lipid compositionincreases as therapy progresses. The absorption ofcollagen in normal human breast tissues is very low(approximately 0.0017�0.0028mm�1 for collagendensity of 100mg/cm3Þ39 compared to waterabsorption in the wavelength regime wherein thelarge water peak is observed. Especially in the rangewhere the water peak shape varies noticeably withtemperature (950�996 nm), the e®ect of collagenconcentration variation is small (less than 0.1�C)based on simple simulations that assumed 20%changes in collagen composition. Furthermore, thealmost perfect ¯t of the \¯nal" tissue water spec-trum to a pure water spectrum suggests that thecollagen is not playing a signi¯cant role in ourcomputed temperature. However, in the future itwill be desirable to explore the use of the full col-lagen spectral features in the spectral processingalgorithm for temperature estimation.
In summary, deep tissue temperature, tissueoxygen saturation, and Bound Water Index weremeasured non-invasively in a lesion breast of apathological complete responder using DOSI overthe course of NAC. Rapid increases of temperatureand StO2 observed in selected time windows duringearly-stage AC therapy are suggestive of mito-chondrial thermogenesis, oxidative stress, andapoptosis. Although preliminary, the results of thiscase study suggest that simultaneous measurementsof deep tissue temperature and StO2 may help toreveal mechanisms of tissue response to che-motherapy and provide feedback for optimizingtreatment.
Acknowledgments
SHC greatly appreciates the precious opportunityto have worked with Britton Chance on this projectand particularly thanks him for guidance about
370 S. H. Chung et al.
biochemical mechanisms in breast cancer. We allthank Montana Compton, who coordinated theNAC studies, and the patient volunteer. This workwas supported by NIH R01-CA75124, R01-EB002109 and Susan G. Komen for the CurePostdoctoral Fellowship provided to University ofPennsylvania, and P41-RR01192, U54-CA105480,U54CA136400, P30-CA62203 provided to Univer-sity of California, Irvine. BJT reports patents,owned by the University of California, related to thetechnology and analysis methods described in thisstudy. The DOSI instrumentation used in this studywas constructed in a university laboratory usingfederal grant support (NIH). The University ofCalifornia has licensed DOSI technology and anal-ysis methods to two companies, FirstScan, Inc. andVolighten, Inc. for di®erent ¯elds of use, includingbreast cancer (FirstScan). This research was com-pleted without participation, knowledge, or ¯nan-cial support of either company, and data wereacquired and processed from patients by coauthorsuna±liated with either entity. The IRB and Con-°ict of Interest O±ce of the University of California,Irvine, have reviewed both patent and corporatedisclosures and no concerns were found.
References
1. M. Poe, R. W. Estabrook, \Kinetic studies of tem-perature changes and oxygen uptake concomitantwith substrate oxidation by mitochondria —
Enthalpy of succinate oxidation during Atp for-mation by mitochondria," Arch. Biochem. Biophys.126, 320�330 (1968).
2. B. Chance, B. Schoener, \High and low energystates of cytochromes. I. In mitochondria," J. Biol.Chem. 241, 4567�4573 (1966).
3. S. H. Chung, A. E. Cerussi, S. I. Merritt, J. Ruth,B. J. Tromberg, \Non-invasive tissue temperaturemeasurements based on quantitative di®use opticalspectroscopy (DOS) of water," Phys. Med. Biol. 55,3753�3765 (2010).
4. M. Poe, H. Gutfreun, R. W. Estabrook, \Kineticstudies of temperature changes and oxygen uptakein a di®erential calorimeter — Heat of oxidation ofNADH and succinate," Arch. Biochem. Biophys.122, 204�211 (1967).
5. C. J. Cot�e, J. Lerman, I. D. Todres, A Practice ofAnesthesia for Infants and Children, p. 392, Saun-ders Elsevier, Philadelphia (2009).
6. D. F. Suen, K. L. Norris, R. J. Youle, \Mitochondrialdynamics and apoptosis,"Gen.Devel.22, 1577�1590(2008).
7. R. W. Johnstone, A. A. Rue°i, S. W. Lowe,\Apoptosis: A link between cancer genetics andchemotherapy," Cell 108, 153�164 (2002).
8. A. E. Cerussi et al., \In vivo absorption, scattering,and physiologic properties of 58 malignant breasttumors determined by broadband di®use opticalspectroscopy," J. Biomed. Optic. 11, 044005 (2006).
9. S. H. Chung, A. Cerussi, R. Mehta, D. Hsiang, B. J.Tromberg, \Non-invasive detection and monitoringof tumor pathological grade during neoadjuvantchemotherapy by measuring tissue water state usingdi®use optical spectroscopic imaging," Cancer Res.69, 101S�101S (2009).
10. S. H. Chung, A. E. Cerussi, D. Hsiang, B. J.Tromberg, \Non-invasive measurement of patho-logical heterogeneity of cancer tissues using waterstate information from di®use optical spectroscopicimaging," Cancer Res. 69, 767S-767S (2009).
11. S. H. Chung et al., \In vivo water state measure-ments in breast cancer using broadband di®useoptical spectroscopy," Phys. Med. Biol. 53, 6713(2008).
12. D. Jakubowski, F. Bevilaqua, S. Merritt, A. Cerussi,B. J. Tromberg, in Biomedical Optical Imaging,J. G. Fujimoto, D. L. Farkas, Eds., 330�355,Oxford University Press, New York (2009).
13. F. Bevilacqua, A. J. Berger, A. E. Cerussi, D.Jakubowski, B. J. Tromberg, \Broadband absorp-tion spectroscopy in turbid media by combined fre-quency-domain and steady-state methods," Appl.Optic 39, 6498�6507 (2000).
14. B. J. Tromberg, L. O. Svaasand, T. T. Tsay, R. C.Haskell, \Properties of photon density waves inmultiple-scattering media," Appl. Optics 32,607�616 (1993).
15. J. B. Fishkin, E. Gratton, \Propagation of photon-density waves in strongly scattering media con-taining an absorbing semi-in¯nite plane bounded bya straight edge," J. Optic. Soc. Amer. — OpticImage Sci. Vision 10, 127�140 (1993).
16. R. C. Haskell, L. O. Svaasand, T. T. Tsay, T. C.Feng, M. S. Mcadams, \Boundary conditions for thedi®usion equation in radiative transfer," J. Opt. Soc.Amer. A 11, 2727�2741 (1994).
17. T. Durduran, R. Choe, W. B. Baker, A. G. Yodh,\Di®use optics for tissue monitoring andtomography," Reports Prog. Phys. 73, 1�43 (2010).
18. R. Graa® et al., \Reduced light-scattering propertiesfor mixtures of spherical-particles — A simpleapproximation derived from Mie calculations,"Appl. Opt. 31, 1370�1376 (1992).
19. W. Tanamai, C. Chen, S. Siavoshi, A. Cerussi,\Di®use optical spectroscopy measurements ofhealing in breast tissue after core biopsy: Casestudy," J. Biomed. Optic 14, 014024 (2009).
Non-Invasive Measurement of Deep Tissue Temperature Changes 371

20. D. L. Streiner, \Maintaining standards: Di®erencesbetween the standard deviation and standard error,and when to use each," Canadian J. Psych.-RevueCanadienne De Psychiatrie 41, 498�502 (1996).
21. M. Gautherie, \Thermopathology of breast cancer:Measurement and analysis of in vivo temperatureand blood °ow," Annals New York Acad. Sci. 335,383�415 (1980).
22. P. M. Gullino, In vitro Perfusion of Tumors, J. C.Norman, Ed., pp. 877�898, Appleton-CenturyCrofts, New York, NY (1968).
23. J. R. Keyserlingk, P. D. Ahlgren, E. Yu, N. Belli-veau, M. Yassa, \Functional infrared imaging of thebreast — Historical perspectives, current appli-cations, and future considerations," IEEE Eng.Med. Biol. Magazine 19, 30�41 (2000).
24. K. L. Williams, R. S. Handley, F. J. Williams,\Infra-red thermometry in diagnosis of breast dis-ease," Lancet 2, 1378�1381 (1961).
25. M. A. Cobleigh et al., \Multinational study ofthe e±cacy and safety of humanized anti-HER2monoclonal antibody in women who have HER2-overexpressing metastatic breast cancer that hasprogressed after chemotherapy for metastatic dis-ease," J. Clin. Oncol. 17, 2639�2648 (1999).
26. B. Chance, G. R. Williams, The Respiratory Chainand Oxidative Phosphorylation, F. F. Nord, Ed.,John Wiley and Sons, Inc., Hobooken, NJ (1956).
27. E. Gnaiger, \MitoPathways: Respiratory states andcoupling control ratios,"Mitochondr. Physiol. Netw.12.15, 1�12 (2010).
28. A. Boveris, B. Chance, \Mitochondrial generation ofhydrogen-peroxide — General properties and e®ectof hyperbaric-oxygen," Biochem. J. 134, 707�716(1973).
29. S. Papa, V. P. Skulachev, \Reactive oxygen species,mitochondria, apoptosis and aging," Molec. Cell.Biochem. 174, 305�319 (1997).
30. A. F. G. Slater et al., Oxidative Stress and Apopto-sis, R. G. Cutler, L. Packer, J. Bertram, A. Mori,Eds., Birkhäuser-Verlag, Basel (1995).
31. P. X. Petit et al., \Alterations in mitochondrialstructure and function are early events of dexa-methasone-induced thymocyte apoptosis," J. CellBiol. 130, 157�167 (1995).
32. C. Richter, M. Schweizer, A. Cossarizza, C. Fran-ceschi, \Control of apoptosis by the cellular ATPlevel," FEBS Lett. 378, 107�110 (1996).
33. E. J. Wolvetang, K. L. Johnson, K. Krauer, S. J.Ralph, A. W. Linnane, \Mitochondrial respiratory-chain inhibitors induce apoptosis," FEBS Lett. 339,40�44 (1994).
34. M. Yoneda, K. Katsumata, M. Hayakawa, M.Tanaka, T. Ozawa, \Oxygen stress induces anapoptotic cell-death associated with fragmentationof mitochondrial genome," Biochem. Biophys. Res.Commun. 209, 723�729 (1995).
35. N. Zamzami et al., \Inhibitors of permeability tran-sition interfere with the disruption of the mitochon-drial transmembrane potential during apoptosis,"FEBS Lett. 384, 53�57 (1996).
36. P. Marchetti et al., \Apoptosis-associated derange-ment of mitochondrial function in cells lackingmitochondrial DNA," Cancer Res. 56, 2033�2038(1996).
37. N. Zamzami et al., \Mitochondrial control of nuclearapoptosis," J. Exp. Med. 183, 1533�1544 (1996).
38. J. M. Mates, F. M. Sanchez-Jimenez, \Role ofreactive oxygen species in apoptosis: Implicationsfor cancer therapy," Int. J. Biochem. Cell Biol. 32,157�170 (2000).
39. P. Taroni, D. Comelli, A. Pi®eri, A. Torricelli,R. Cubeddu, \Absorption of collagen: E®ects on theestimate of breast composition and related diag-nostic implications," J. Biomed. Optic 12, 014021(2007).
372 S. H. Chung et al.