non-contact methods of measuring stresses in high ... · non-contact methods of measuring stresses...
TRANSCRIPT

NonNon--Contact Methods of MeasuringContact Methods of Measuring
Stresses in High Temperature MaterialsStresses in High Temperature Materials
David R. Clarke
Qing Ma, Jun He, Don Lipkin, John Nychka
Samuel Margueron, Vladimir Tolpygo, Derek Gardiner

Everyone talks about the weather.. but nobody does anything about it
Mark Twain(Samuel Clemens)

Everyone talks about stresses……. but nobody does anything about them

• Introduction to Cr3+ based luminescence and piezospectroscopy (luminescence and Raman).
• Phase transformations during the growth of alumina by thermal oxidation
• Latest developments on piezospectroscopy
• Modes of strain energy relief in oxide films and coatings
• Wrinkling, wrinkling kinetics leading to oxide film failure
• Buckling and buckle growth
• Conditions for spalling by the growth of buckles
• Large scale buckling
• Rumpling
• Monitoring damage evolution in TBCs by piezospectroscopy
• Summary
OutlineOutline

Vibrational piezospectroscopy –Raman piezospectroscopy Luminescence piezospectroscopy
Single crystal silicon Sapphire containing Cr dopant
Principal Types of Piezospectroscopy Principal Types of Piezospectroscopy

Octahedral coordination of Cr3+
Physical Basis of Luminescence Piezospectroscopy: Synopsis Physical Basis of Luminescence Piezospectroscopy: Synopsis
Piezospectroscopy Relation

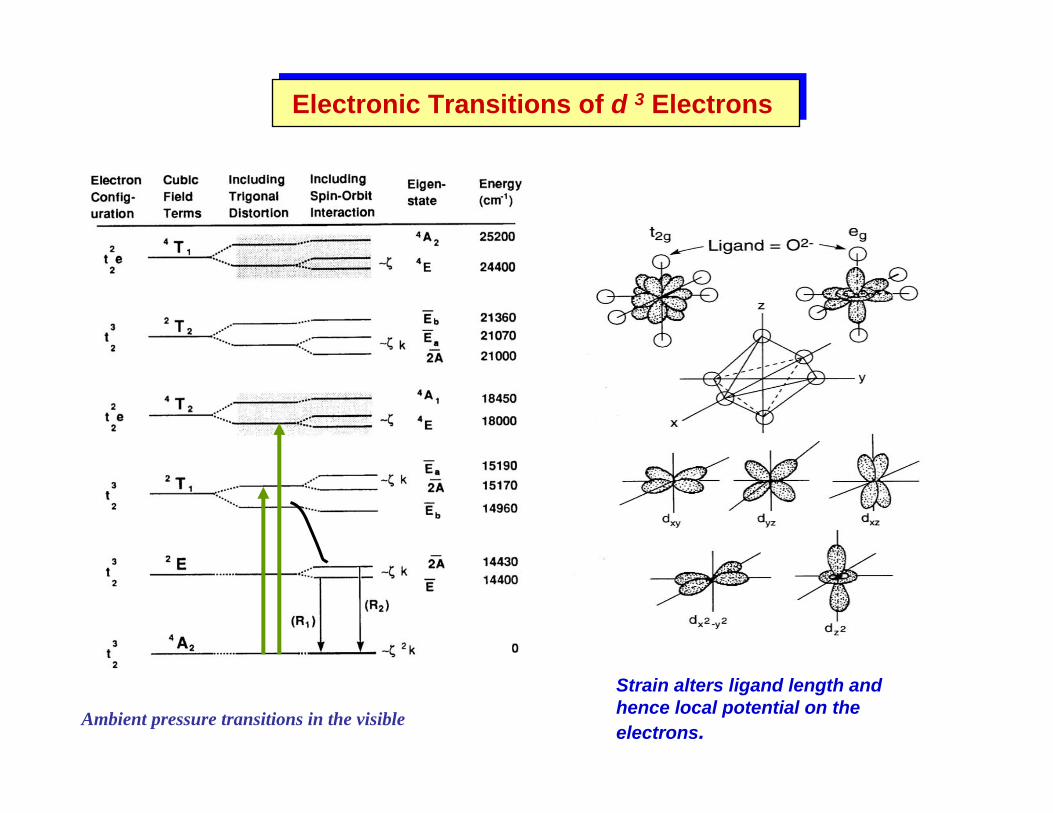
Ambient pressure transitions in the visible
Electronic Transitions of d 3 Electrons Electronic Transitions of d 3 Electrons
Strain alters ligand length and hence local potential on the electrons.
Ambient pressure transitions in the visible
Electronic Transitions of d 3 Electrons Electronic Transitions of d 3 Electrons
Strain alters ligand length and hence local potential on the electrons.
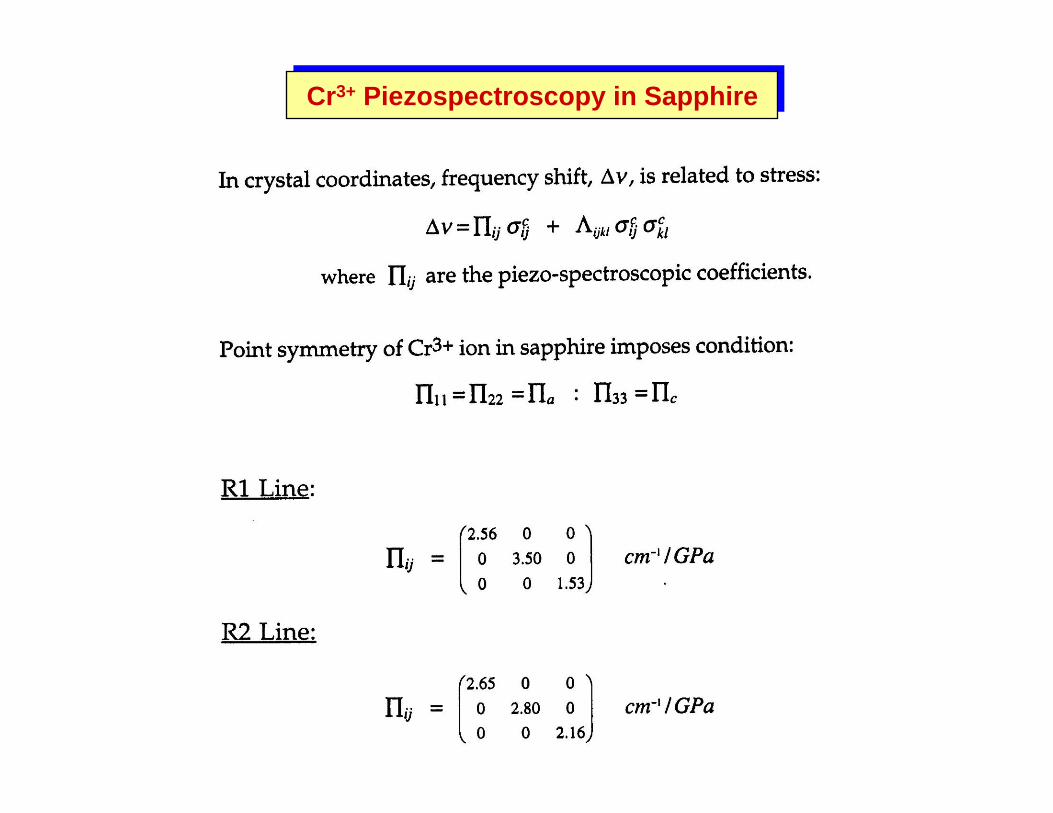
Cr3+ Piezospectroscopy in SapphireCr3+ Piezospectroscopy in Sapphire
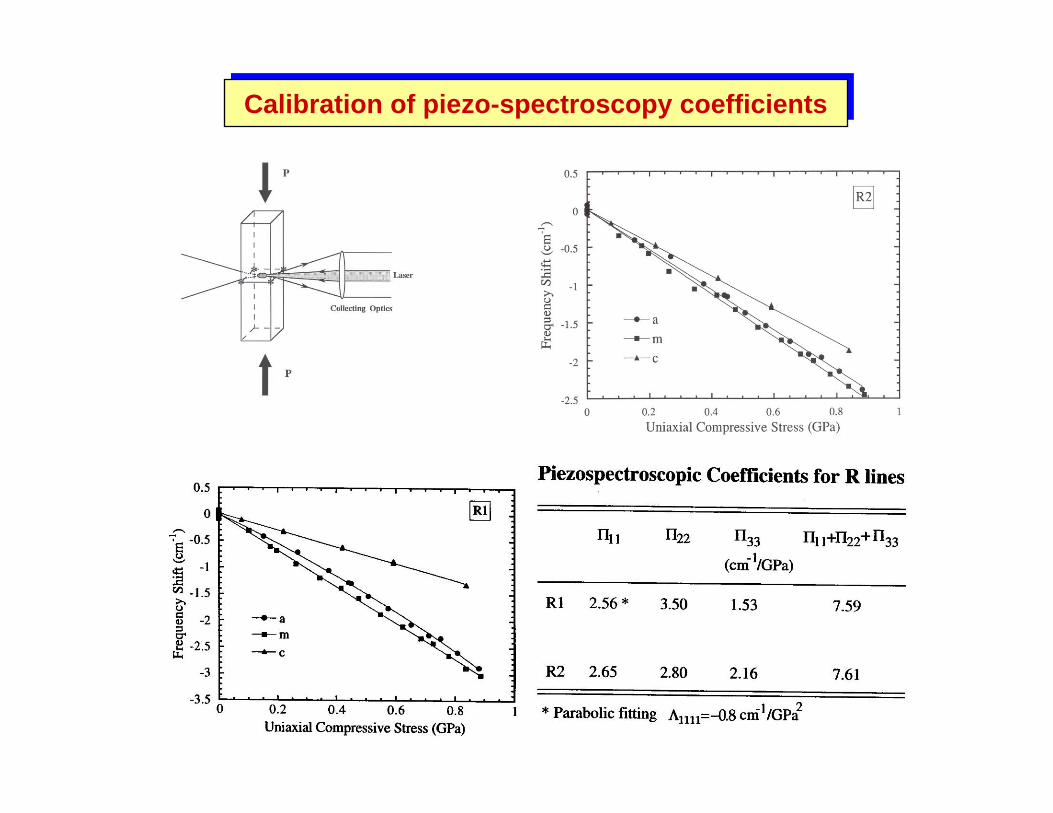
Calibration of piezo-spectroscopy coefficientsCalibration of piezo-spectroscopy coefficients

Analysis for General OrientationAnalysis for General Orientation

Calibration for polycrystalline, randomly oriented aluminaCalibration for polycrystalline, randomly oriented alumina
Uniaxial Compression to tensionHydrostatic stress

Summary of Luminescence ShiftsSummary of Luminescence Shifts

Effect of Stress GradientEffect of Stress Gradient
( )223o
ii
wwtzd
d−
Π=
σ
Stress gradient causes peak broadening

Optical Microprobe ConfigurationOptical Microprobe Configuration

Internal Stress Distribution in Polycrystalline Alumina Internal Stress Distribution in Polycrystalline Alumina
Observation in transmitted light through cross-polarizers of alumna.
Variation in stress made visible through the piezo-optical effect.
Raman PiezospectroscopyRaman Piezospectroscopy

Raman PiezospectroscopyRaman Piezospectroscopy

Active vibrational modesTransverse Optical --- TO1 along [100], TO2 along [010]Longitudinal Optical – LO along [001]
Raman Piezospectroscopy of SiliconRaman Piezospectroscopy of Silicon

Raman PiezospectroscopyRaman Piezospectroscopy

Raman Piezospectroscopy In ElectromigrationRaman Piezospectroscopy In Electromigration

Phase Transformations in Alumina During
High Temperature OxidationPhase Transformations in Alumina During
High Temperature Oxidation

Reported Phase Transformations in Alumina Ceramics, Powders and Films
Reported Phase Transformations in Alumina Ceramics, Powders and Films

0
100
200
300
400
500
600
14000 14200 14400 14600 14800 15000
Inte
nsity
[cp
s]
Frequency [cm -1]
α -Al2O
3
θ -A l2O
3
γ -A l2O
3
Luminescence Identification of Alumina PhasesLuminescence Identification of Alumina Phases

Oxidation Induced Transformation Sequence on MCrAl vs NiPtAlOxidation Induced Transformation Sequence on MCrAl vs NiPtAl

Alumina Transformation Kinetics on NiAlAlumina Transformation Kinetics on NiAl
Grumm and GrabkePhase identification by X-ray diffraction
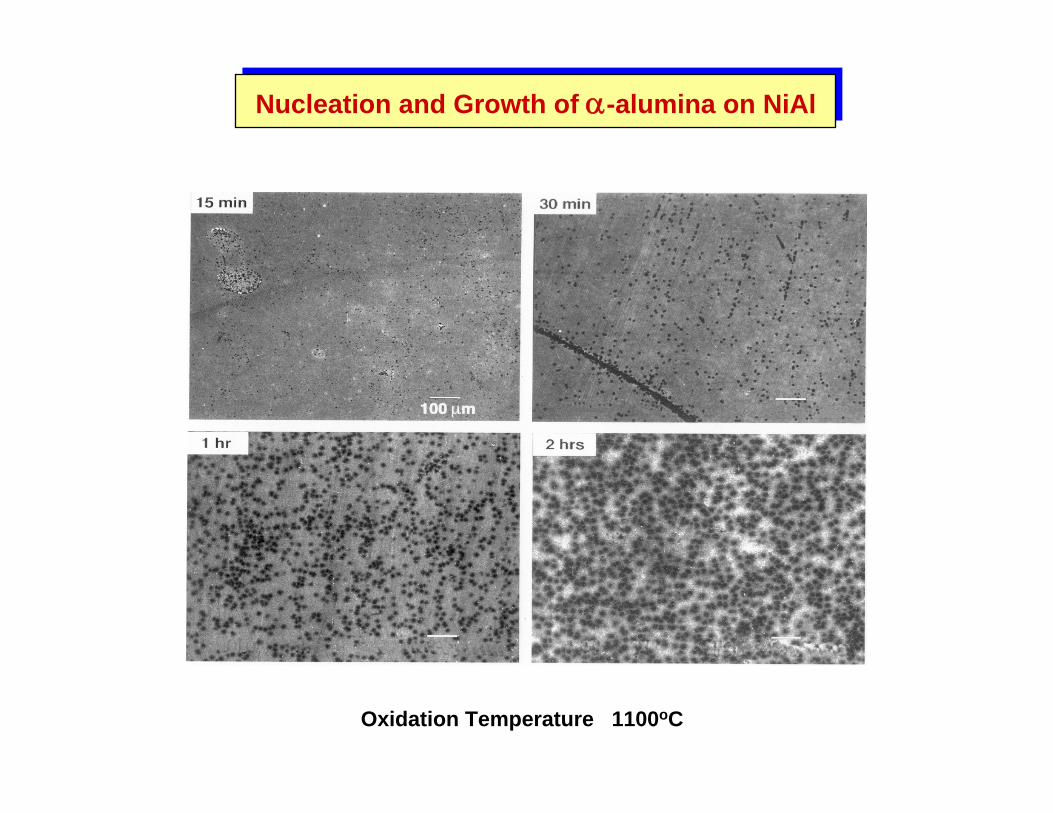
Nucleation and Growth of α-alumina on NiAlNucleation and Growth of α-alumina on NiAl
Oxidation Temperature 1100oC
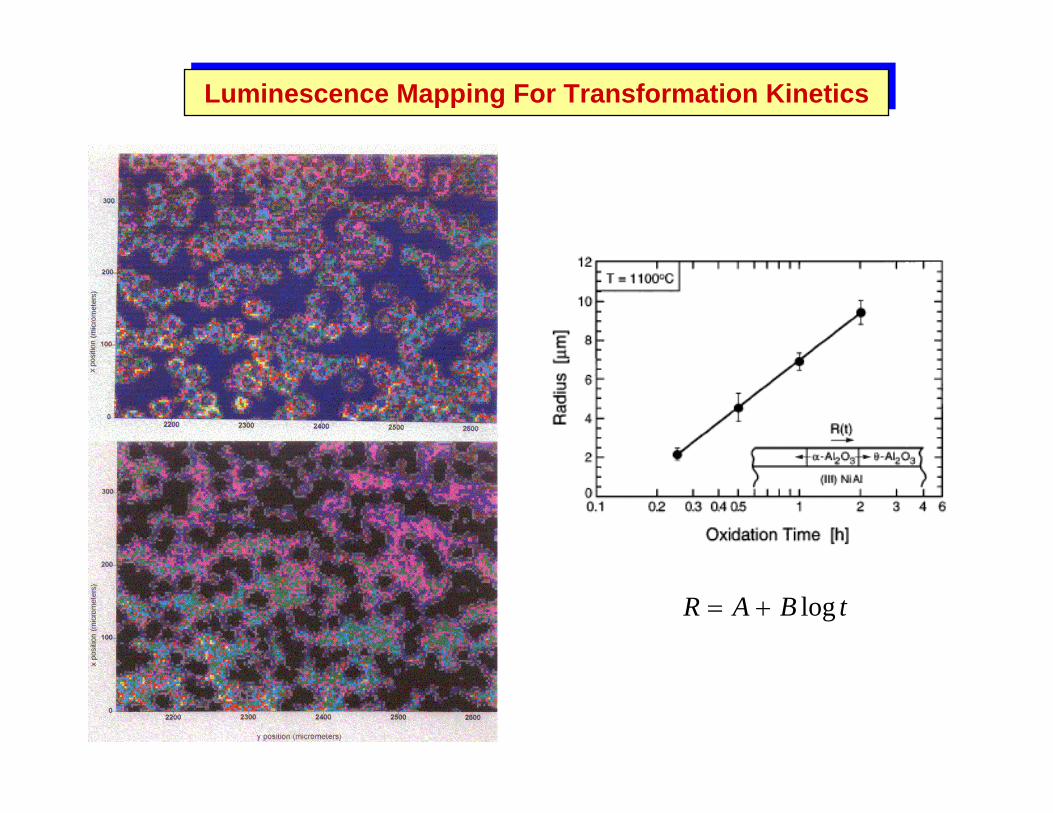
Luminescence Mapping For Transformation KineticsLuminescence Mapping For Transformation Kinetics
tBAR log+=

αθ+α
Evolution of Stress in NiAl Single CrystalEvolution of Stress in NiAl Single Crystal
Thermalexpansionstress
NB. Alpha phase is under net tension under transformation is complete. Then oxide is under compression.
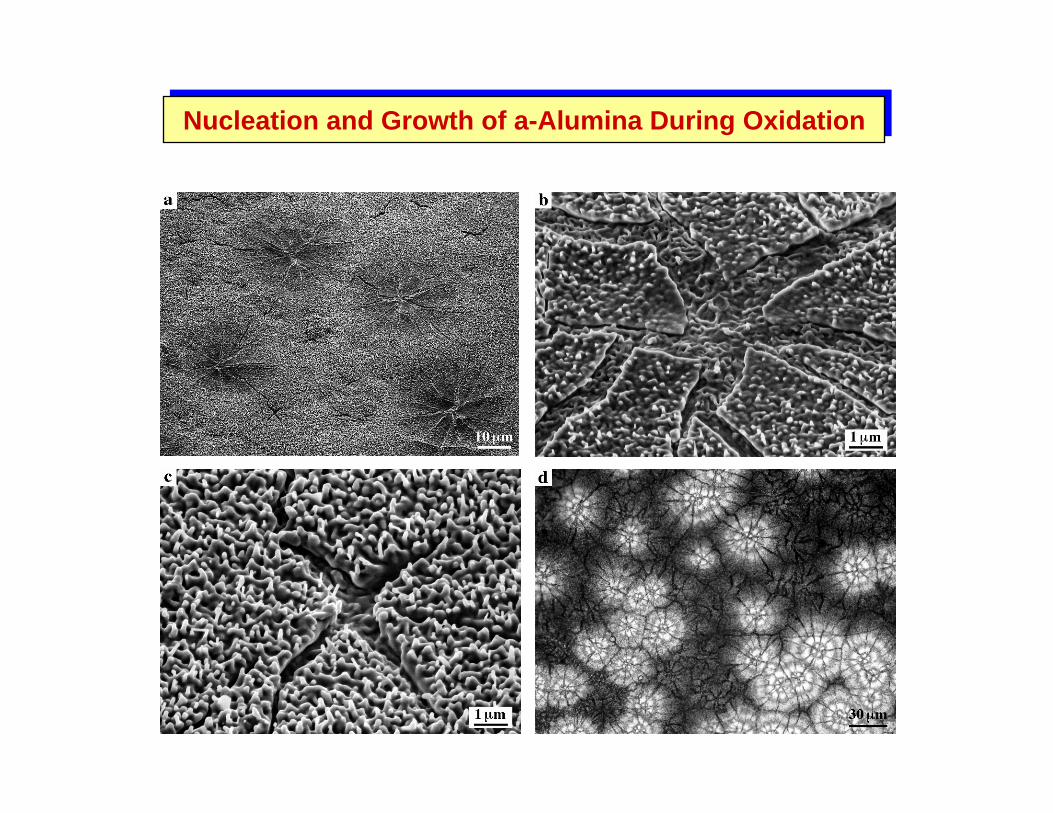
Nucleation and Growth of a-Alumina During OxidationNucleation and Growth of a-Alumina During Oxidation

Origin of Transformation StressesOrigin of Transformation Stresses
αθ → transformation is accompanied by a 9.5 % volume decrease.
The transformation is constrained by the surrounding θ oxide, placing theα - islands under tension. This causes “tearing” of islands.
Alpha-island
θ - matrix

Heterogeneous Nucleation and Growth of α-alumina on NiAlHeterogeneous Nucleation and Growth of α-alumina on NiAl
Note the radial cracks in the islands, giving the“star” contrast

1 hour θ ~ 0.5 μm thick 25 hour mixed α + θ
TGO Morphology at 1000oCTGO Morphology at 1000oC

0
200
400
600
800
1000
14300 14400 14500 14600 14700
Inte
nsity
[cp
s]
Frequency [cm -1]
Ar θ -Al2O
3
α-Al2O
3
(σ ~ -3.75 GPa)
0
2000
4000
6000
14350 14400 14450
Inte
nsity
[cp
s]
Frequency [cm -1]
α-Al2O
3
(whiskers)
α-Al2O
3
(layer)
Ar
"transition" c
1 hour at 1100oC 25 hour at 1100oC
Fibrous θ-phase Transforms to α−aluminaFibrous θ-phase Transforms to α−alumina

Recent DevelopmentsRecent Developments

Stress Effects on the Luminescence LifetimeStress Effects on the Luminescence Lifetime
Lifetime varies with crystallographic direction and linearly with stress
Polycrystalline alumina

Use of Polarization to Distinguish Stress ComponentsUse of Polarization to Distinguish Stress Components
FIB cuts create a stripunder uniaxial stress
Luminescence intensitymap around strip
( ) 3/62.72 zzyyxxR σσσν ++=Δ
Frequency shift proportional to meanstress in polycrystalline alumina:

Use of Polarization to Distinguish Stress ComponentsUse of Polarization to Distinguish Stress Components
Imaging under different polarization conditions reveals directions of principal stresses by affecting R2/R1 peak area ratio.

End of Part IEnd of Part I