nominal effective exchange rate, april 1, 2013=100...
TRANSCRIPT
Developing Trends: February 2014
Overview
Developing Trends was prepared by the Development Economics Prospects Group (DECPG) of the World Bank. The team is coordinated by Allen
Dennis (Overview), and is comprised of Tehmina Khan (High-Income), Gerard Kambou (Industrial Production), Derek Chen (Business sentiment),
Eung Ju Kim (High-income and Finance), John Baffes and Damir Cosic (Commodities), and Sanket Mohapatra (Exchange rate) Ekaterine
Vashakmadze (Inflation and Trade), and Adil Islam (Statistical Annex). The report was prepared under the guidance of Andrew Burns.
This note reflects the views of the team, but is not formally cleared by the World Bank Group.
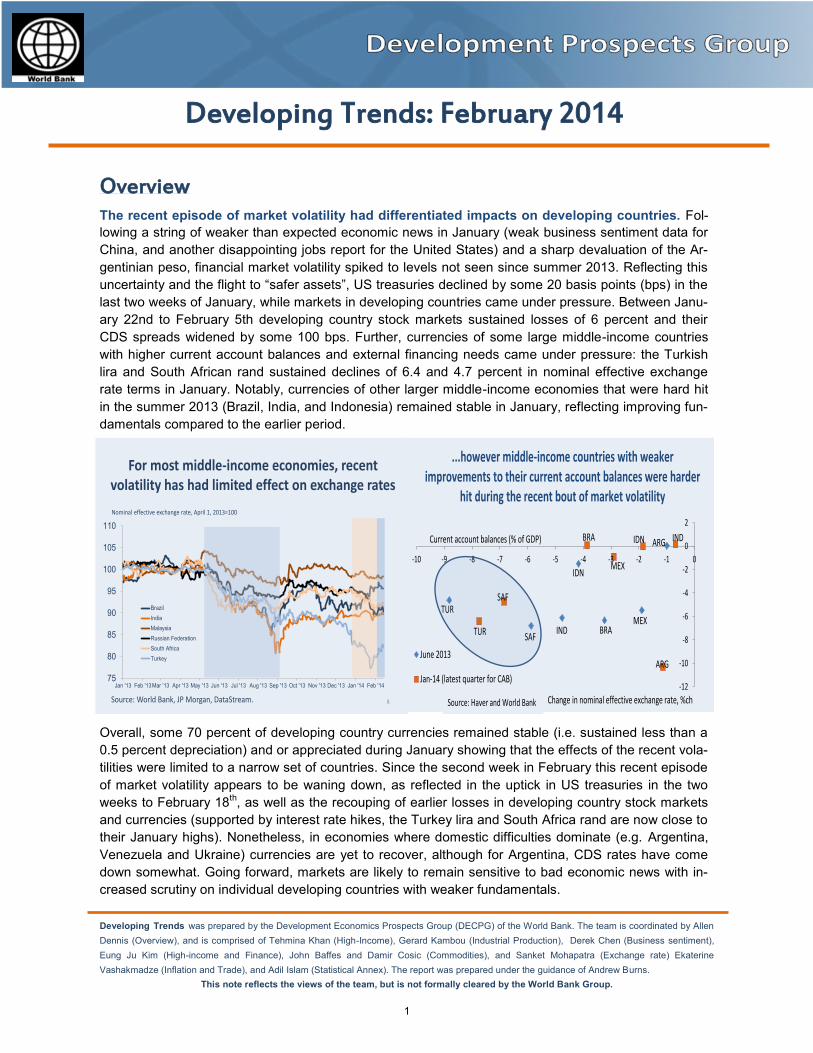
The recent episode of market volatility had differentiated impacts on developing countries. Fol-
lowing a string of weaker than expected economic news in January (weak business sentiment data for
China, and another disappointing jobs report for the United States) and a sharp devaluation of the Ar-
gentinian peso, financial market volatility spiked to levels not seen since summer 2013. Reflecting this
uncertainty and the flight to “safer assets”, US treasuries declined by some 20 basis points (bps) in the
last two weeks of January, while markets in developing countries came under pressure. Between Janu-
ary 22nd to February 5th developing country stock markets sustained losses of 6 percent and their
CDS spreads widened by some 100 bps. Further, currencies of some large middle-income countries
with higher current account balances and external financing needs came under pressure: the Turkish
lira and South African rand sustained declines of 6.4 and 4.7 percent in nominal effective exchange
rate terms in January. Notably, currencies of other larger middle-income economies that were hard hit
in the summer 2013 (Brazil, India, and Indonesia) remained stable in January, reflecting improving fun-
damentals compared to the earlier period.
Overall, some 70 percent of developing country currencies remained stable (i.e. sustained less than a
0.5 percent depreciation) and or appreciated during January showing that the effects of the recent vola-
tilities were limited to a narrow set of countries. Since the second week in February this recent episode
of market volatility appears to be waning down, as reflected in the uptick in US treasuries in the two
weeks to February 18th, as well as the recouping of earlier losses in developing country stock markets
and currencies (supported by interest rate hikes, the Turkey lira and South Africa rand are now close to
their January highs). Nonetheless, in economies where domestic difficulties dominate (e.g. Argentina,
Venezuela and Ukraine) currencies are yet to recover, although for Argentina, CDS rates have come
down somewhat. Going forward, markets are likely to remain sensitive to bad economic news with in-
creased scrutiny on individual developing countries with weaker fundamentals.
75
80
85
90
95
100
105
110
Jan '13 Feb '13Mar '13 Apr '13 May '13 Jun '13 Jul '13 Aug '13 Sep '13 Oct '13 Nov '13 Dec '13 Jan '14 Feb '14
Brazil
India
Malaysia
Russian Federation
South Africa
Turkey
For most middle-income economies, recent volatility has had limited effect on exchange rates
Nominal effective exchange rate, April 1, 2013=100
Source: World Bank, JP Morgan, DataStream. 8
-12
-10
-8
-6
-4
-2
0
2
-10 -9 -8 -7 -6 -5 -4 -3 -2 -1 0
June 2013
Jan-14 (latest quarter for CAB)
TUR
TUR
SAFIND BRA
SAF
ARG
MEX
MEX
INDBRA
IDN
...however middle-income countries with weaker improvements to their current account balances were harder
hit during the recent bout of market volatility
ARGIDN
Change in nominal effective exchange rate, %ch
Current account balances (% of GDP)
Source: Haver and World Bank
1
February 20, 2013
Developing Trends: February 2014
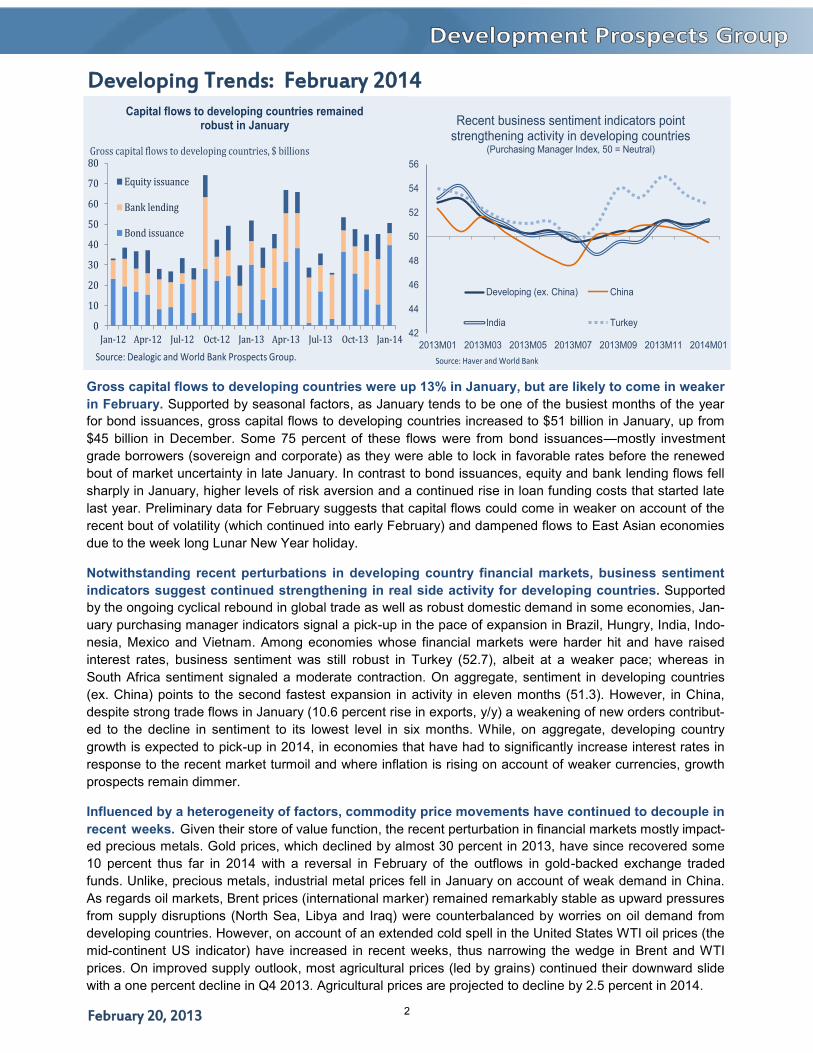
Gross capital flows to developing countries were up 13% in January, but are likely to come in weaker
in February. Supported by seasonal factors, as January tends to be one of the busiest months of the year
for bond issuances, gross capital flows to developing countries increased to $51 billion in January, up from
$45 billion in December. Some 75 percent of these flows were from bond issuances—mostly investment
grade borrowers (sovereign and corporate) as they were able to lock in favorable rates before the renewed
bout of market uncertainty in late January. In contrast to bond issuances, equity and bank lending flows fell
sharply in January, higher levels of risk aversion and a continued rise in loan funding costs that started late
last year. Preliminary data for February suggests that capital flows could come in weaker on account of the
recent bout of volatility (which continued into early February) and dampened flows to East Asian economies
due to the week long Lunar New Year holiday.
Notwithstanding recent perturbations in developing country financial markets, business sentiment
indicators suggest continued strengthening in real side activity for developing countries. Supported
by the ongoing cyclical rebound in global trade as well as robust domestic demand in some economies, Jan-
uary purchasing manager indicators signal a pick-up in the pace of expansion in Brazil, Hungry, India, Indo-
nesia, Mexico and Vietnam. Among economies whose financial markets were harder hit and have raised
interest rates, business sentiment was still robust in Turkey (52.7), albeit at a weaker pace; whereas in
South Africa sentiment signaled a moderate contraction. On aggregate, sentiment in developing countries
(ex. China) points to the second fastest expansion in activity in eleven months (51.3). However, in China,
despite strong trade flows in January (10.6 percent rise in exports, y/y) a weakening of new orders contribut-
ed to the decline in sentiment to its lowest level in six months. While, on aggregate, developing country
growth is expected to pick-up in 2014, in economies that have had to significantly increase interest rates in
response to the recent market turmoil and where inflation is rising on account of weaker currencies, growth
prospects remain dimmer.
Influenced by a heterogeneity of factors, commodity price movements have continued to decouple in
recent weeks. Given their store of value function, the recent perturbation in financial markets mostly impact-
ed precious metals. Gold prices, which declined by almost 30 percent in 2013, have since recovered some
10 percent thus far in 2014 with a reversal in February of the outflows in gold-backed exchange traded
funds. Unlike, precious metals, industrial metal prices fell in January on account of weak demand in China.
As regards oil markets, Brent prices (international marker) remained remarkably stable as upward pressures
from supply disruptions (North Sea, Libya and Iraq) were counterbalanced by worries on oil demand from
developing countries. However, on account of an extended cold spell in the United States WTI oil prices (the
mid-continent US indicator) have increased in recent weeks, thus narrowing the wedge in Brent and WTI
prices. On improved supply outlook, most agricultural prices (led by grains) continued their downward slide
with a one percent decline in Q4 2013. Agricultural prices are projected to decline by 2.5 percent in 2014.
42
44
46
48
50
52
54
56
2013M01 2013M03 2013M05 2013M07 2013M09 2013M11 2014M01
Developing (ex. China) China
India Turkey
Recent business sentiment indicators point strengthening activity in developing countries
(Purchasing Manager Index, 50 = Neutral)
Source: Haver and World Bank
0
10
20
30
40
50
60
70
80
Jan-12 Apr-12 Jul-12 Oct-12 Jan-13 Apr-13 Jul-13 Oct-13 Jan-14
Equity issuance
Bank lending
Bond issuance
Source: Dealogic and World Bank Prospects Group.
Gross capital flows to developing countries, $ billions
Capital flows to developing countries remained robust in January
2
February 20, 2014
High income (1)
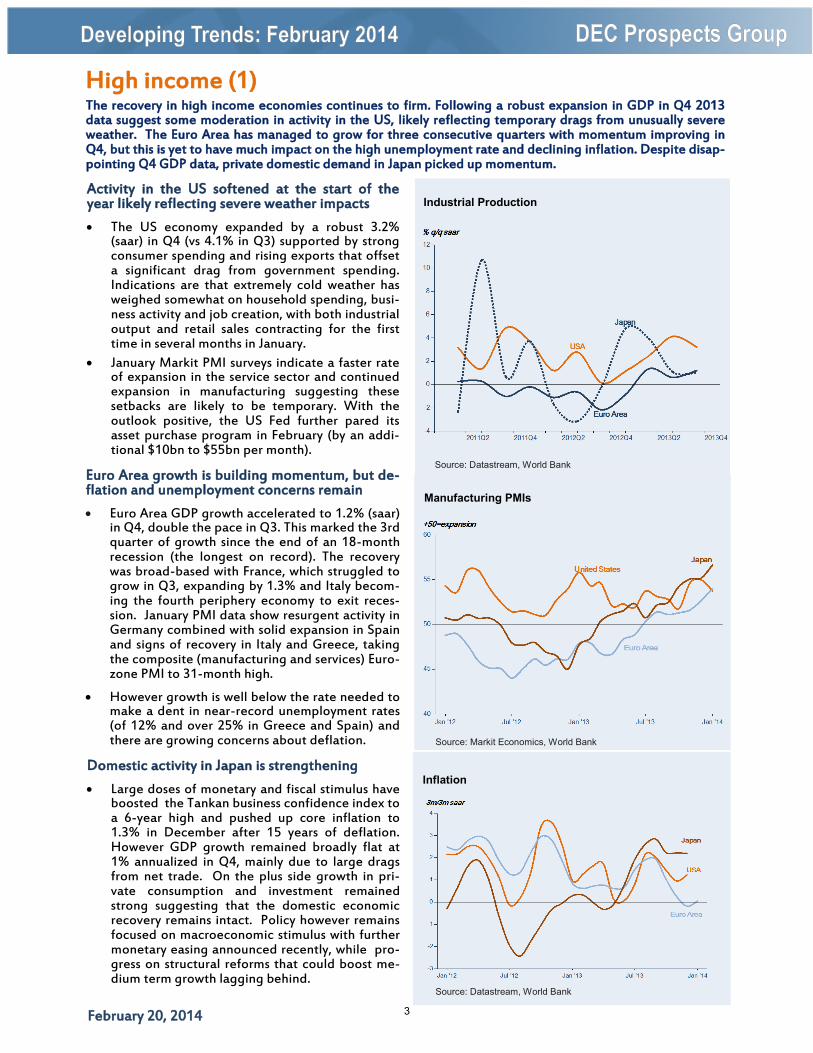
Activity in the US softened at the start of the year likely reflecting severe weather impacts
The US economy expanded by a robust 3.2% (saar) in Q4 (vs 4.1% in Q3) supported by strong consumer spending and rising exports that offset a significant drag from government spending. Indications are that extremely cold weather has weighed somewhat on household spending, busi-ness activity and job creation, with both industrial output and retail sales contracting for the first time in several months in January.
January Markit PMI surveys indicate a faster rate of expansion in the service sector and continued expansion in manufacturing suggesting these setbacks are likely to be temporary. With the outlook positive, the US Fed further pared its asset purchase program in February (by an addi-tional $10bn to $55bn per month).
Euro Area growth is building momentum, but de-flation and unemployment concerns remain
Euro Area GDP growth accelerated to 1.2% (saar) in Q4, double the pace in Q3. This marked the 3rd quarter of growth since the end of an 18-month recession (the longest on record). The recovery was broad-based with France, which struggled to grow in Q3, expanding by 1.3% and Italy becom-ing the fourth periphery economy to exit reces-sion. January PMI data show resurgent activity in Germany combined with solid expansion in Spain and signs of recovery in Italy and Greece, taking the composite (manufacturing and services) Euro-zone PMI to 31-month high.
However growth is well below the rate needed to make a dent in near-record unemployment rates (of 12% and over 25% in Greece and Spain) and there are growing concerns about deflation.
Domestic activity in Japan is strengthening
Large doses of monetary and fiscal stimulus have boosted the Tankan business confidence index to a 6-year high and pushed up core inflation to 1.3% in December after 15 years of deflation. However GDP growth remained broadly flat at 1% annualized in Q4, mainly due to large drags from net trade. On the plus side growth in pri-vate consumption and investment remained strong suggesting that the domestic economic recovery remains intact. Policy however remains focused on macroeconomic stimulus with further monetary easing announced recently, while pro-gress on structural reforms that could boost me-dium term growth lagging behind.
The recovery in high income economies continues to firm. Following a robust expansion in GDP in Q4 2013 data suggest some moderation in activity in the US, likely reflecting temporary drags from unusually severe weather. The Euro Area has managed to grow for three consecutive quarters with momentum improving in Q4, but this is yet to have much impact on the high unemployment rate and declining inflation. Despite disap-pointing Q4 GDP data, private domestic demand in Japan picked up momentum.
Industrial Production
Source: Datastream, World Bank
Inflation
Source: Datastream, World Bank
Manufacturing PMIs
Source: Markit Economics, World Bank
3
February 20, 2014 page 1
High income (2)
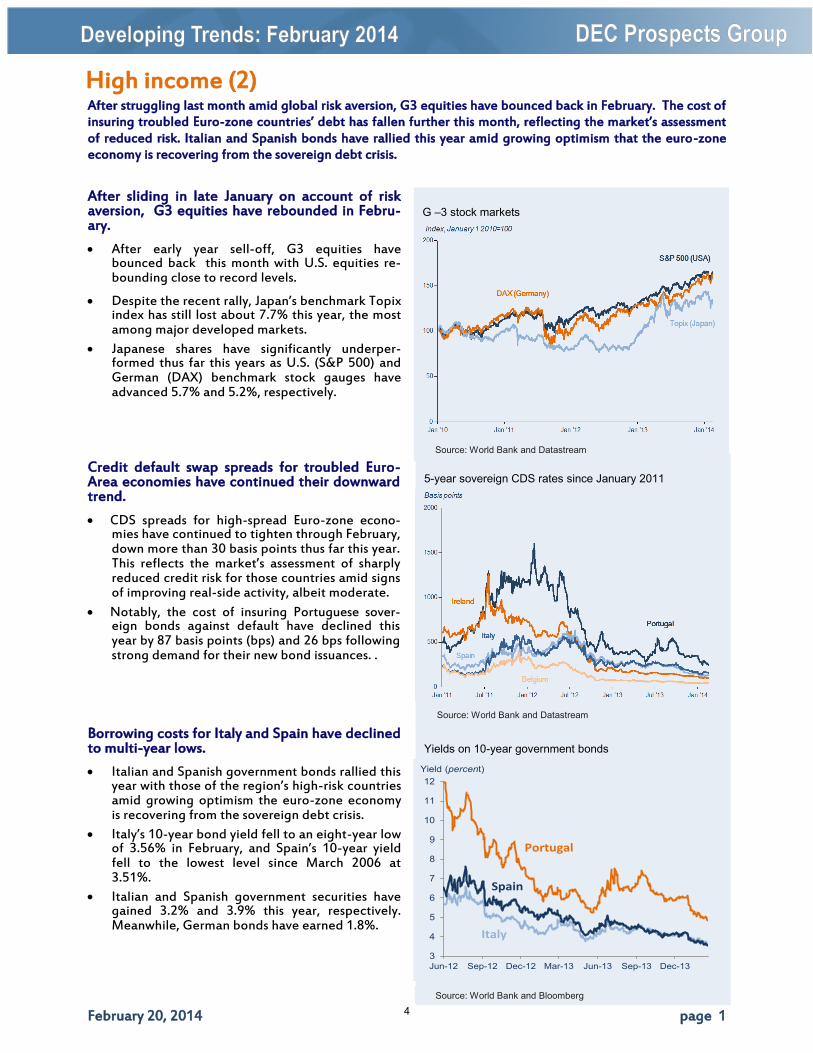
After sliding in late January on account of risk aversion, G3 equities have rebounded in Febru-ary.
After early year sell-off, G3 equities have bounced back this month with U.S. equities re-bounding close to record levels.
Despite the recent rally, Japan’s benchmark Topix index has still lost about 7.7% this year, the most among major developed markets.
Japanese shares have significantly underper-formed thus far this years as U.S. (S&P 500) and German (DAX) benchmark stock gauges have advanced 5.7% and 5.2%, respectively.
Credit default swap spreads for troubled Euro-Area economies have continued their downward trend.
CDS spreads for high-spread Euro-zone econo-mies have continued to tighten through February, down more than 30 basis points thus far this year. This reflects the market’s assessment of sharply reduced credit risk for those countries amid signs of improving real-side activity, albeit moderate.
Notably, the cost of insuring Portuguese sover-eign bonds against default have declined this year by 87 basis points (bps) and 26 bps following strong demand for their new bond issuances. .
Borrowing costs for Italy and Spain have declined to multi-year lows.
Italian and Spanish government bonds rallied this year with those of the region’s high-risk countries amid growing optimism the euro-zone economy is recovering from the sovereign debt crisis.
Italy’s 10-year bond yield fell to an eight-year low of 3.56% in February, and Spain’s 10-year yield fell to the lowest level since March 2006 at 3.51%.
Italian and Spanish government securities have gained 3.2% and 3.9% this year, respectively. Meanwhile, German bonds have earned 1.8%.
After struggling last month amid global risk aversion, G3 equities have bounced back in February. The cost of insuring troubled Euro-zone countries’ debt has fallen further this month, reflecting the market’s assessment of reduced risk. Italian and Spanish bonds have rallied this year amid growing optimism that the euro-zone economy is recovering from the sovereign debt crisis.
Yields on 10-year government bonds
Source: World Bank and Bloomberg
5-year sovereign CDS rates since January 2011
Source: World Bank and Datastream
G –3 stock markets
Source: World Bank and Datastream
3
4
5
6
7
8
9
10
11
12
Jun-12 Sep-12 Dec-12 Mar-13 Jun-13 Sep-13 Dec-13
Yield (percent)
Italy
Portugal
Spain
4
February 20, 2014
Industrial Activity
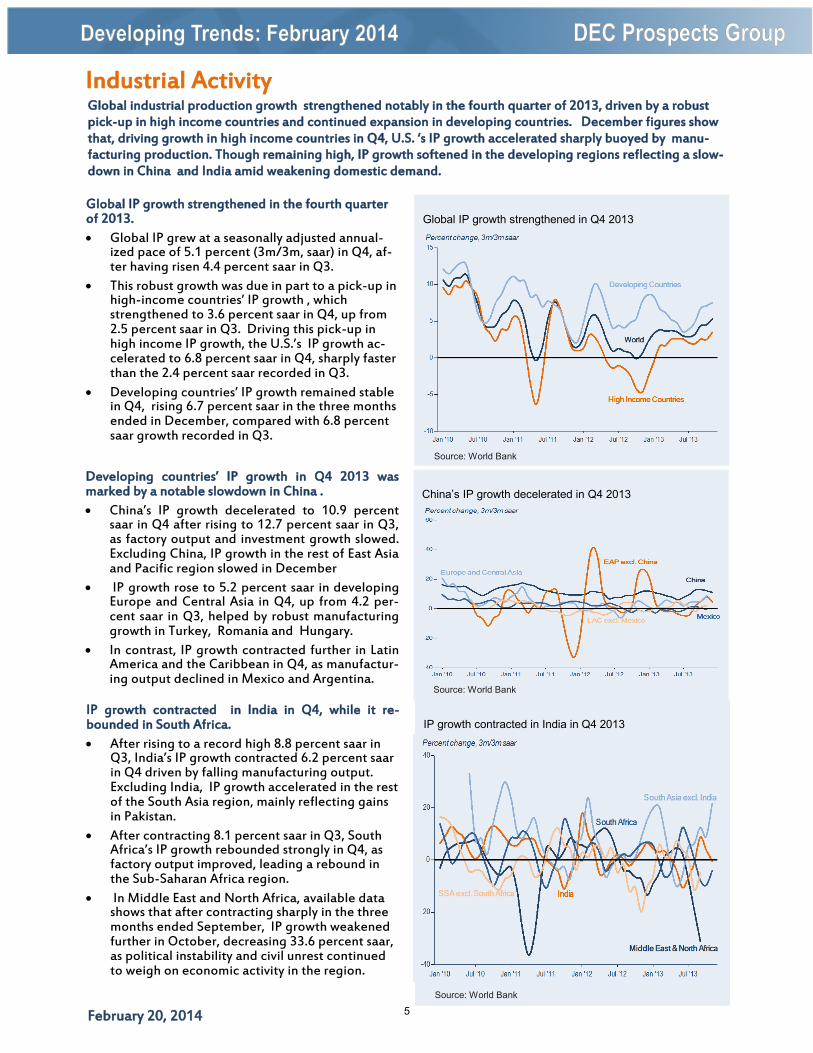
Global IP growth strengthened in the fourth quarter of 2013.
Global IP grew at a seasonally adjusted annual-ized pace of 5.1 percent (3m/3m, saar) in Q4, af-ter having risen 4.4 percent saar in Q3.
This robust growth was due in part to a pick-up in high-income countries’ IP growth , which strengthened to 3.6 percent saar in Q4, up from 2.5 percent saar in Q3. Driving this pick-up in high income IP growth, the U.S.’s IP growth ac-celerated to 6.8 percent saar in Q4, sharply faster than the 2.4 percent saar recorded in Q3.
Developing countries’ IP growth remained stable in Q4, rising 6.7 percent saar in the three months ended in December, compared with 6.8 percent saar growth recorded in Q3.
Developing countries’ IP growth in Q4 2013 was marked by a notable slowdown in China .
China’s IP growth decelerated to 10.9 percent saar in Q4 after rising to 12.7 percent saar in Q3, as factory output and investment growth slowed. Excluding China, IP growth in the rest of East Asia and Pacific region slowed in December
IP growth rose to 5.2 percent saar in developing Europe and Central Asia in Q4, up from 4.2 per-cent saar in Q3, helped by robust manufacturing growth in Turkey, Romania and Hungary.
In contrast, IP growth contracted further in Latin America and the Caribbean in Q4, as manufactur-ing output declined in Mexico and Argentina.
IP growth contracted in India in Q4, while it re-bounded in South Africa.
After rising to a record high 8.8 percent saar in Q3, India’s IP growth contracted 6.2 percent saar in Q4 driven by falling manufacturing output. Excluding India, IP growth accelerated in the rest of the South Asia region, mainly reflecting gains in Pakistan.
After contracting 8.1 percent saar in Q3, South Africa’s IP growth rebounded strongly in Q4, as factory output improved, leading a rebound in the Sub-Saharan Africa region.
In Middle East and North Africa, available data shows that after contracting sharply in the three months ended September, IP growth weakened further in October, decreasing 33.6 percent saar, as political instability and civil unrest continued to weigh on economic activity in the region.
Global industrial production growth strengthened notably in the fourth quarter of 2013, driven by a robust pick-up in high income countries and continued expansion in developing countries. December figures show that, driving growth in high income countries in Q4, U.S. ‘s IP growth accelerated sharply buoyed by manu-facturing production. Though remaining high, IP growth softened in the developing regions reflecting a slow-down in China and India amid weakening domestic demand.
Global IP growth strengthened in Q4 2013
Source: World Bank
IP growth contracted in India in Q4 2013
Source: World Bank
China’s IP growth decelerated in Q4 2013
Source: World Bank
5
February 20, 2014
Business Sentiment
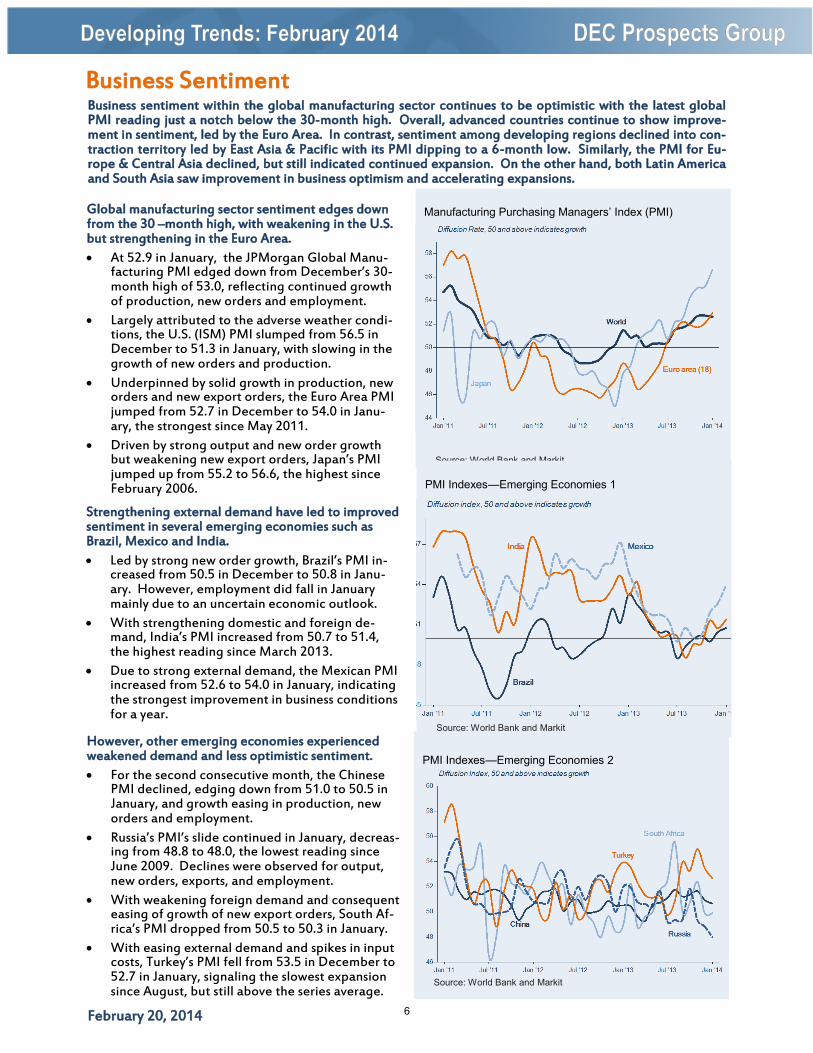
Global manufacturing sector sentiment edges down from the 30 –month high, with weakening in the U.S. but strengthening in the Euro Area.
At 52.9 in January, the JPMorgan Global Manu-facturing PMI edged down from December’s 30- month high of 53.0, reflecting continued growth of production, new orders and employment.
Largely attributed to the adverse weather condi-tions, the U.S. (ISM) PMI slumped from 56.5 in December to 51.3 in January, with slowing in the growth of new orders and production.
Underpinned by solid growth in production, new orders and new export orders, the Euro Area PMI jumped from 52.7 in December to 54.0 in Janu-ary, the strongest since May 2011.
Driven by strong output and new order growth but weakening new export orders, Japan’s PMI jumped up from 55.2 to 56.6, the highest since February 2006.
Strengthening external demand have led to improved sentiment in several emerging economies such as Brazil, Mexico and India.
Led by strong new order growth, Brazil’s PMI in-creased from 50.5 in December to 50.8 in Janu-ary. However, employment did fall in January mainly due to an uncertain economic outlook.
With strengthening domestic and foreign de-mand, India’s PMI increased from 50.7 to 51.4, the highest reading since March 2013.
Due to strong external demand, the Mexican PMI increased from 52.6 to 54.0 in January, indicating the strongest improvement in business conditions for a year.
However, other emerging economies experienced weakened demand and less optimistic sentiment.
For the second consecutive month, the Chinese PMI declined, edging down from 51.0 to 50.5 in January, and growth easing in production, new orders and employment.
Russia’s PMI’s slide continued in January, decreas-ing from 48.8 to 48.0, the lowest reading since June 2009. Declines were observed for output, new orders, exports, and employment.
With weakening foreign demand and consequent easing of growth of new export orders, South Af-rica’s PMI dropped from 50.5 to 50.3 in January.
With easing external demand and spikes in input costs, Turkey’s PMI fell from 53.5 in December to 52.7 in January, signaling the slowest expansion since August, but still above the series average.
Business sentiment within the global manufacturing sector continues to be optimistic with the latest global PMI reading just a notch below the 30-month high. Overall, advanced countries continue to show improve-ment in sentiment, led by the Euro Area. In contrast, sentiment among developing regions declined into con-traction territory led by East Asia & Pacific with its PMI dipping to a 6-month low. Similarly, the PMI for Eu-rope & Central Asia declined, but still indicated continued expansion. On the other hand, both Latin America and South Asia saw improvement in business optimism and accelerating expansions.
Manufacturing Purchasing Managers’ Index (PMI)
Source: World Bank and Markit
PMI Indexes—Emerging Economies 2
Source: World Bank and Markit
PMI Indexes—Emerging Economies 1
Source: World Bank and Markit
6
February 20, 2014
International Trade (1)
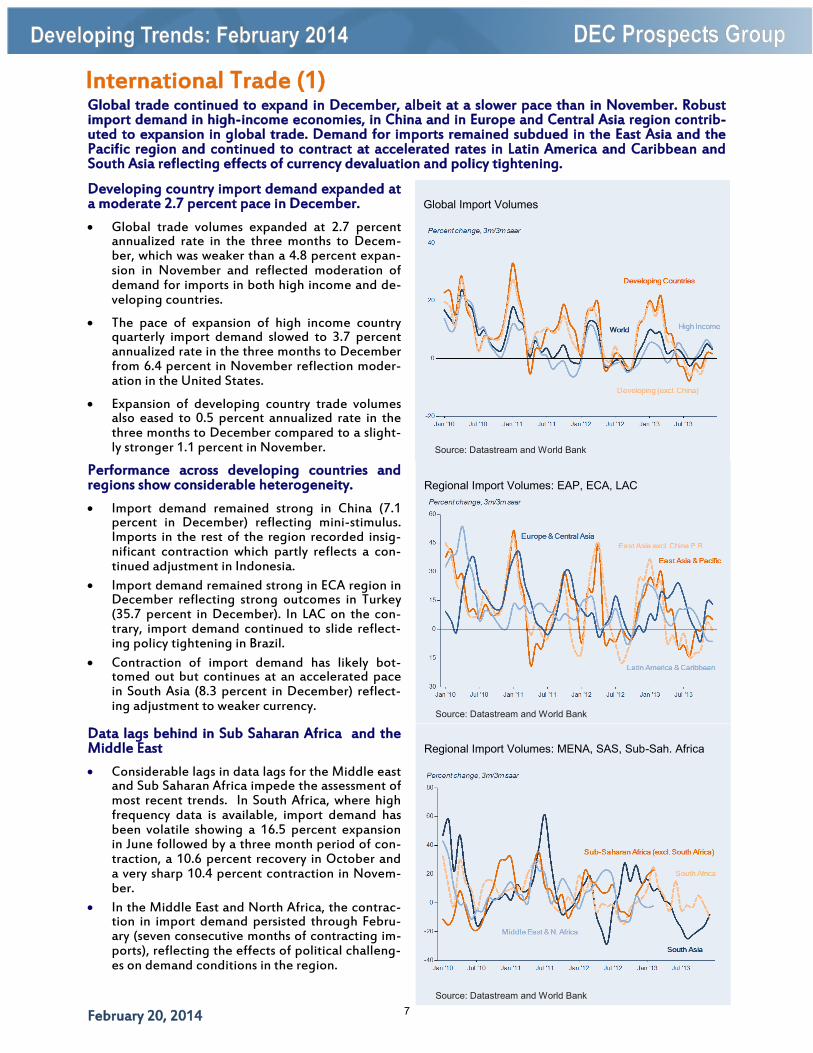
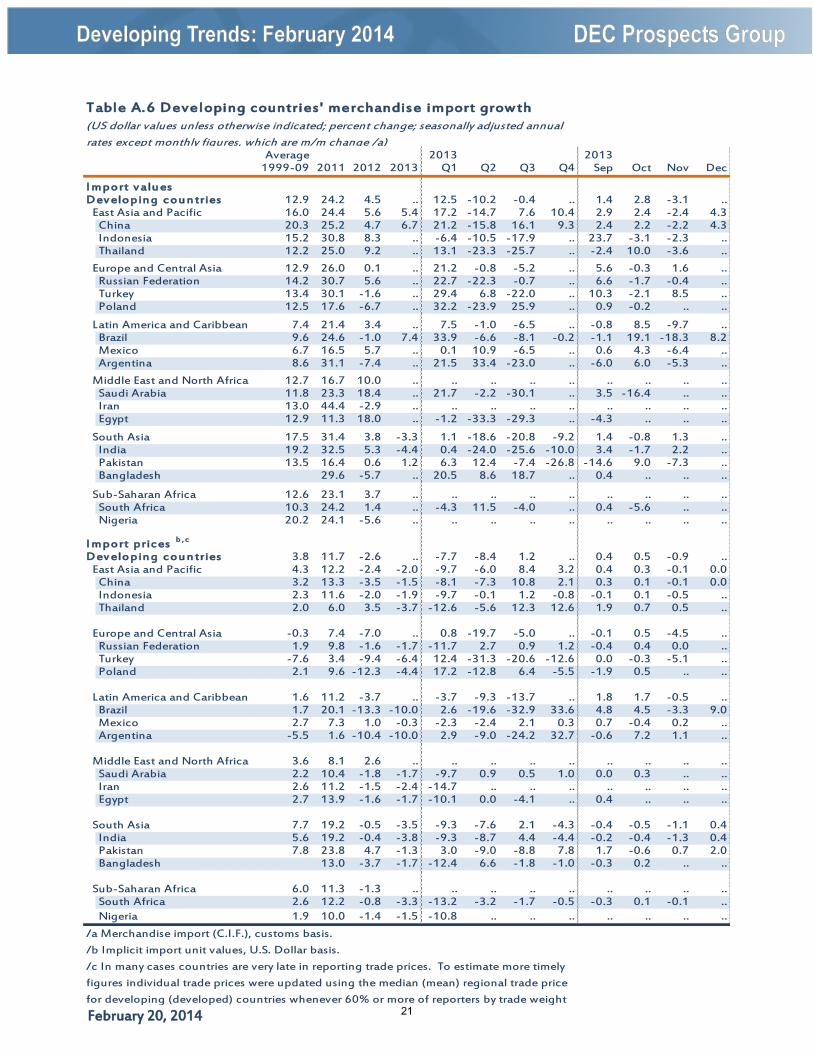
Developing country import demand expanded at a moderate 2.7 percent pace in December.
Global trade volumes expanded at 2.7 percent annualized rate in the three months to Decem-ber, which was weaker than a 4.8 percent expan-sion in November and reflected moderation of demand for imports in both high income and de-veloping countries.
The pace of expansion of high income country quarterly import demand slowed to 3.7 percent annualized rate in the three months to December from 6.4 percent in November reflection moder-ation in the United States.
Expansion of developing country trade volumes also eased to 0.5 percent annualized rate in the three months to December compared to a slight-ly stronger 1.1 percent in November.
Performance across developing countries and regions show considerable heterogeneity.
Import demand remained strong in China (7.1 percent in December) reflecting mini-stimulus. Imports in the rest of the region recorded insig-nificant contraction which partly reflects a con-tinued adjustment in Indonesia.
Import demand remained strong in ECA region in December reflecting strong outcomes in Turkey (35.7 percent in December). In LAC on the con-trary, import demand continued to slide reflect-ing policy tightening in Brazil.
Contraction of import demand has likely bot-tomed out but continues at an accelerated pace in South Asia (8.3 percent in December) reflect-ing adjustment to weaker currency.
Data lags behind in Sub Saharan Africa and the Middle East
Considerable lags in data lags for the Middle east and Sub Saharan Africa impede the assessment of most recent trends. In South Africa, where high frequency data is available, import demand has been volatile showing a 16.5 percent expansion in June followed by a three month period of con-traction, a 10.6 percent recovery in October and a very sharp 10.4 percent contraction in Novem-ber.
In the Middle East and North Africa, the contrac-tion in import demand persisted through Febru-ary (seven consecutive months of contracting im-ports), reflecting the effects of political challeng-es on demand conditions in the region.
Global trade continued to expand in December, albeit at a slower pace than in November. Robust import demand in high-income economies, in China and in Europe and Central Asia region contrib-uted to expansion in global trade. Demand for imports remained subdued in the East Asia and the Pacific region and continued to contract at accelerated rates in Latin America and Caribbean and South Asia reflecting effects of currency devaluation and policy tightening.
Global Import Volumes
Source: Datastream and World Bank
Regional Import Volumes: EAP, ECA, LAC
Source: Datastream and World Bank
Regional Import Volumes: MENA, SAS, Sub-Sah. Africa
Source: Datastream and World Bank
7
February 20, 2014
International Trade (2)
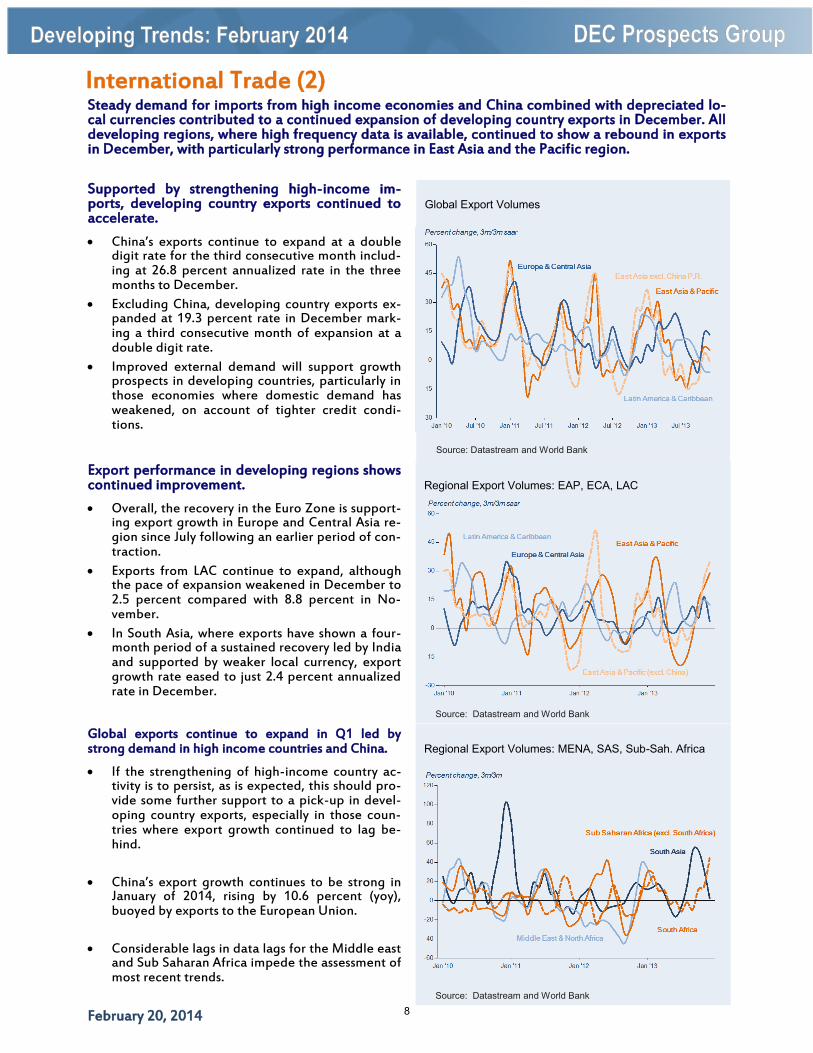
Supported by strengthening high-income im-ports, developing country exports continued to accelerate.
China’s exports continue to expand at a double digit rate for the third consecutive month includ-ing at 26.8 percent annualized rate in the three months to December.
Excluding China, developing country exports ex-panded at 19.3 percent rate in December mark-ing a third consecutive month of expansion at a double digit rate.
Improved external demand will support growth prospects in developing countries, particularly in those economies where domestic demand has weakened, on account of tighter credit condi-tions.
Export performance in developing regions shows continued improvement.
Overall, the recovery in the Euro Zone is support-ing export growth in Europe and Central Asia re-gion since July following an earlier period of con-traction.
Exports from LAC continue to expand, although the pace of expansion weakened in December to 2.5 percent compared with 8.8 percent in No-vember.
In South Asia, where exports have shown a four-month period of a sustained recovery led by India and supported by weaker local currency, export growth rate eased to just 2.4 percent annualized rate in December.
Global exports continue to expand in Q1 led by strong demand in high income countries and China.
If the strengthening of high-income country ac-tivity is to persist, as is expected, this should pro-vide some further support to a pick-up in devel-oping country exports, especially in those coun-tries where export growth continued to lag be-hind.
China’s export growth continues to be strong in January of 2014, rising by 10.6 percent (yoy), buoyed by exports to the European Union.
Considerable lags in data lags for the Middle east and Sub Saharan Africa impede the assessment of most recent trends.
Steady demand for imports from high income economies and China combined with depreciated lo-cal currencies contributed to a continued expansion of developing country exports in December. All developing regions, where high frequency data is available, continued to show a rebound in exports in December, with particularly strong performance in East Asia and the Pacific region.
Regional Export Volumes: EAP, ECA, LAC
Source: Datastream and World Bank
Regional Export Volumes: MENA, SAS, Sub-Sah. Africa
Source: Datastream and World Bank
Global Export Volumes
Source: Datastream and World Bank
8
February 20, 2014
Commodities (1)
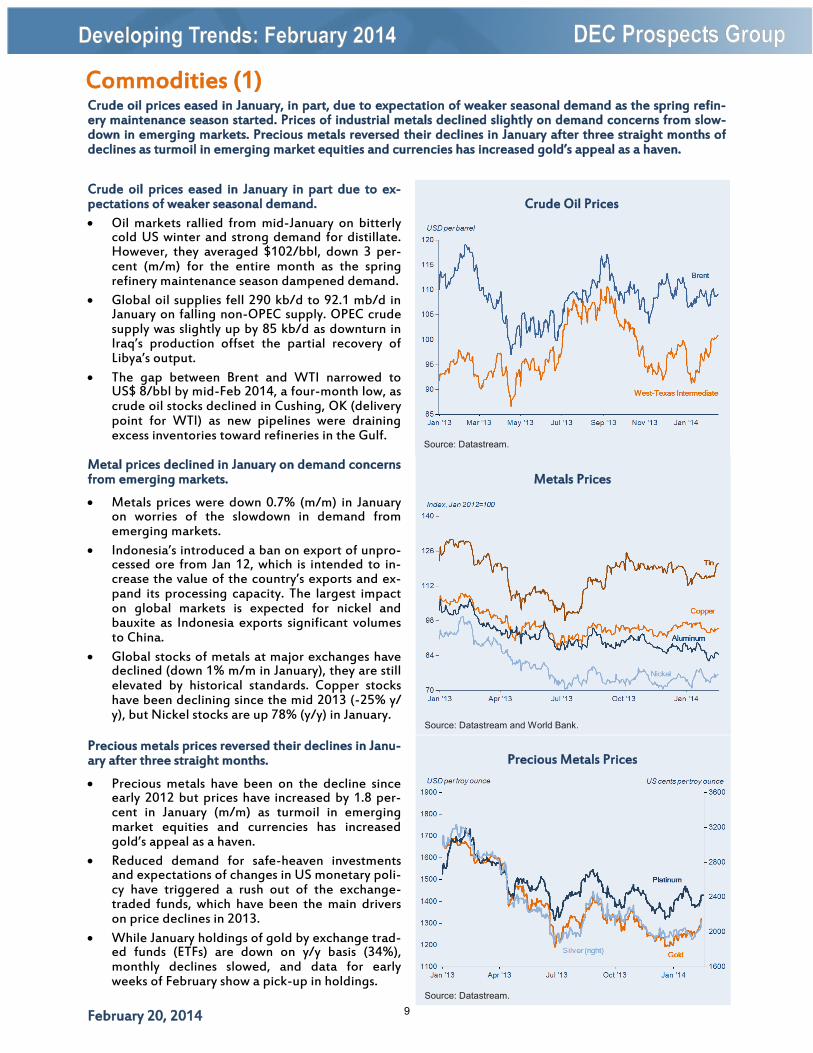
Crude oil prices eased in January in part due to ex-pectations of weaker seasonal demand.
Oil markets rallied from mid-January on bitterly cold US winter and strong demand for distillate. However, they averaged $102/bbl, down 3 per-cent (m/m) for the entire month as the spring refinery maintenance season dampened demand.
Global oil supplies fell 290 kb/d to 92.1 mb/d in January on falling non-OPEC supply. OPEC crude supply was slightly up by 85 kb/d as downturn in Iraq’s production offset the partial recovery of Libya’s output.
The gap between Brent and WTI narrowed to US$ 8/bbl by mid-Feb 2014, a four-month low, as crude oil stocks declined in Cushing, OK (delivery point for WTI) as new pipelines were draining excess inventories toward refineries in the Gulf.
Metal prices declined in January on demand concerns from emerging markets.
Metals prices were down 0.7% (m/m) in January on worries of the slowdown in demand from emerging markets.
Indonesia’s introduced a ban on export of unpro-cessed ore from Jan 12, which is intended to in-crease the value of the country’s exports and ex-pand its processing capacity. The largest impact on global markets is expected for nickel and bauxite as Indonesia exports significant volumes to China.
Global stocks of metals at major exchanges have declined (down 1% m/m in January), they are still elevated by historical standards. Copper stocks have been declining since the mid 2013 (-25% y/y), but Nickel stocks are up 78% (y/y) in January.
Precious metals prices reversed their declines in Janu-ary after three straight months.
Precious metals have been on the decline since early 2012 but prices have increased by 1.8 per-cent in January (m/m) as turmoil in emerging market equities and currencies has increased gold’s appeal as a haven.
Reduced demand for safe-heaven investments and expectations of changes in US monetary poli-cy have triggered a rush out of the exchange-traded funds, which have been the main drivers on price declines in 2013.
While January holdings of gold by exchange trad-ed funds (ETFs) are down on y/y basis (34%), monthly declines slowed, and data for early weeks of February show a pick-up in holdings.
Crude oil prices eased in January, in part, due to expectation of weaker seasonal demand as the spring refin-ery maintenance season started. Prices of industrial metals declined slightly on demand concerns from slow-down in emerging markets. Precious metals reversed their declines in January after three straight months of declines as turmoil in emerging market equities and currencies has increased gold’s appeal as a haven.
Crude Oil Prices
Source: Datastream.
Precious Metals Prices
Source: Datastream.
Metals Prices
Source: Datastream and World Bank.
9
February 20, 2014
Commodities (2)
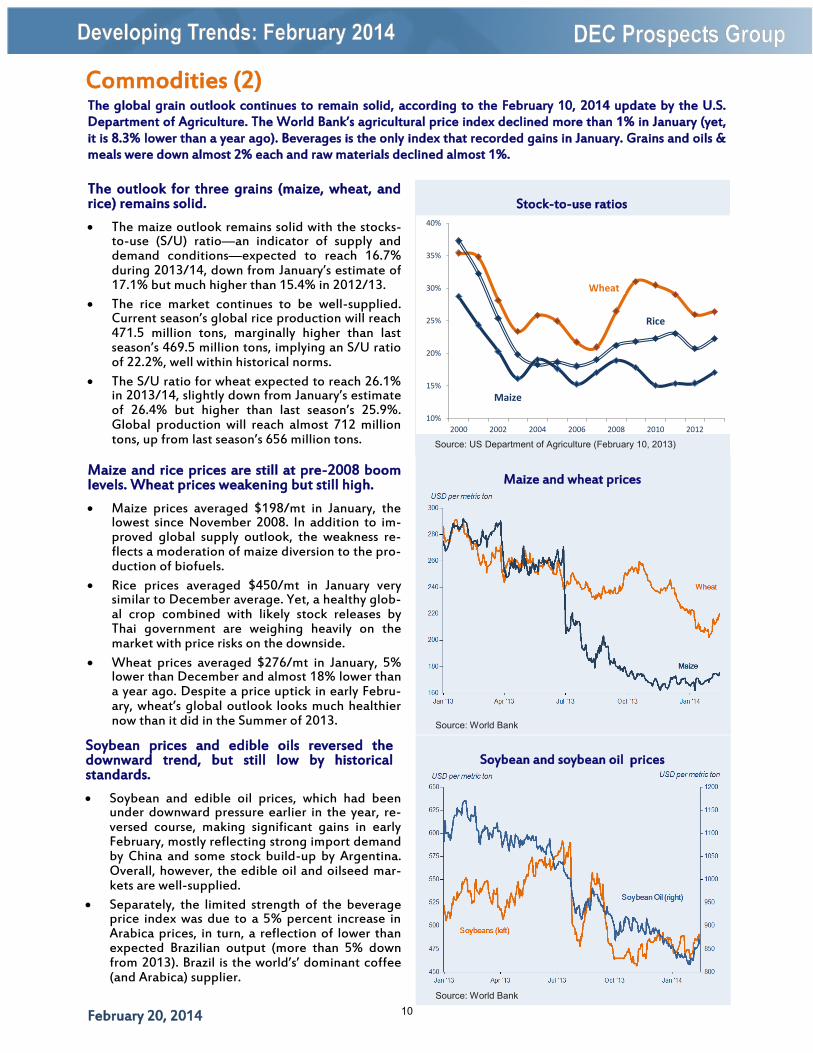
The outlook for three grains (maize, wheat, and rice) remains solid.
The maize outlook remains solid with the stocks-to-use (S/U) ratio—an indicator of supply and demand conditions—expected to reach 16.7% during 2013/14, down from January’s estimate of 17.1% but much higher than 15.4% in 2012/13.
The rice market continues to be well-supplied. Current season’s global rice production will reach 471.5 million tons, marginally higher than last season’s 469.5 million tons, implying an S/U ratio of 22.2%, well within historical norms.
The S/U ratio for wheat expected to reach 26.1% in 2013/14, slightly down from January’s estimate of 26.4% but higher than last season’s 25.9%. Global production will reach almost 712 million tons, up from last season’s 656 million tons.
Maize and rice prices are still at pre-2008 boom levels. Wheat prices weakening but still high.
Maize prices averaged $198/mt in January, the lowest since November 2008. In addition to im-proved global supply outlook, the weakness re-flects a moderation of maize diversion to the pro-duction of biofuels.
Rice prices averaged $450/mt in January very similar to December average. Yet, a healthy glob-al crop combined with likely stock releases by Thai government are weighing heavily on the market with price risks on the downside.
Wheat prices averaged $276/mt in January, 5% lower than December and almost 18% lower than a year ago. Despite a price uptick in early Febru-ary, wheat’s global outlook looks much healthier now than it did in the Summer of 2013.
Soybean prices and edible oils reversed the downward trend, but still low by historical standards.
Soybean and edible oil prices, which had been under downward pressure earlier in the year, re-versed course, making significant gains in early February, mostly reflecting strong import demand by China and some stock build-up by Argentina. Overall, however, the edible oil and oilseed mar-kets are well-supplied.
Separately, the limited strength of the beverage price index was due to a 5% percent increase in Arabica prices, in turn, a reflection of lower than expected Brazilian output (more than 5% down from 2013). Brazil is the world’s’ dominant coffee (and Arabica) supplier.
The global grain outlook continues to remain solid, according to the February 10, 2014 update by the U.S. Department of Agriculture. The World Bank’s agricultural price index declined more than 1% in January (yet, it is 8.3% lower than a year ago). Beverages is the only index that recorded gains in January. Grains and oils & meals were down almost 2% each and raw materials declined almost 1%.
Stock-to-use ratios
Source: US Department of Agriculture (February 10, 2013)
Soybean and soybean oil prices
Source: World Bank
Maize and wheat prices
Source: World Bank
10%
15%
20%
25%
30%
35%
40%
2000 2002 2004 2006 2008 2010 2012
Maize
Wheat
Rice
10
February 20, 2014
International Finance (1)
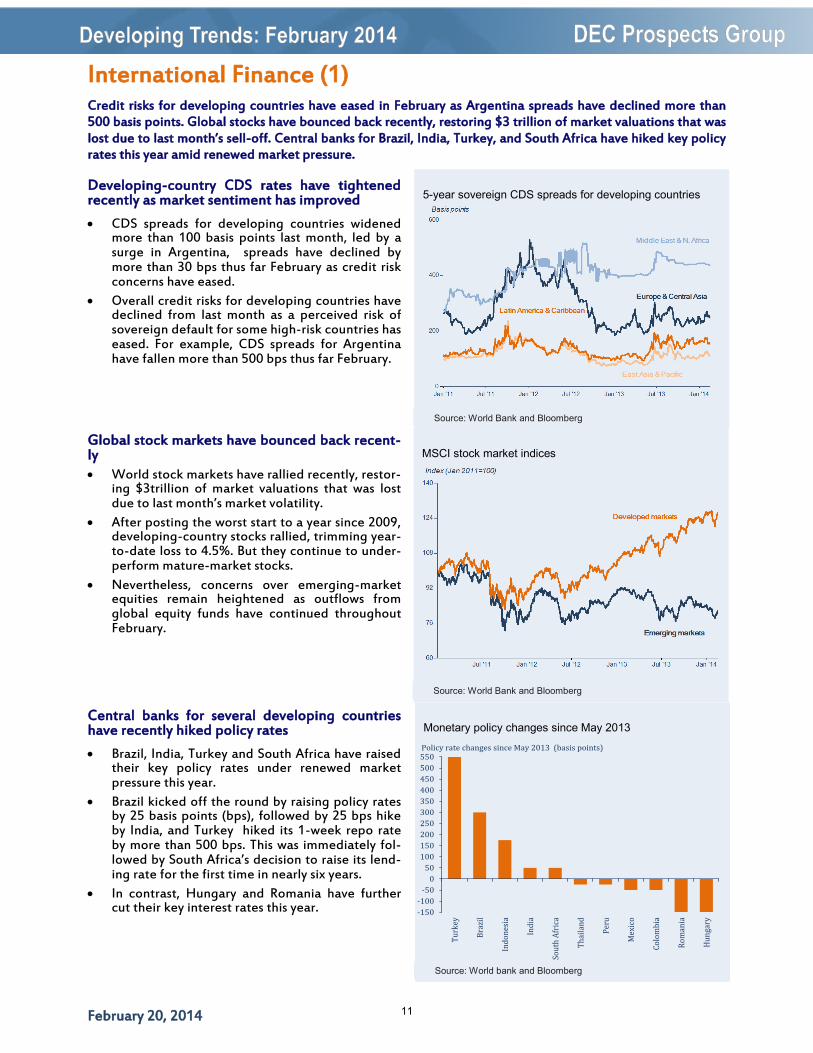
Developing-country CDS rates have tightened recently as market sentiment has improved
CDS spreads for developing countries widened more than 100 basis points last month, led by a surge in Argentina, spreads have declined by more than 30 bps thus far February as credit risk concerns have eased.
Overall credit risks for developing countries have declined from last month as a perceived risk of sovereign default for some high-risk countries has eased. For example, CDS spreads for Argentina have fallen more than 500 bps thus far February.
Global stock markets have bounced back recent-ly World stock markets have rallied recently, restor-
ing $3trillion of market valuations that was lost due to last month’s market volatility.
After posting the worst start to a year since 2009, developing-country stocks rallied, trimming year-to-date loss to 4.5%. But they continue to under-perform mature-market stocks.
Nevertheless, concerns over emerging-market equities remain heightened as outflows from global equity funds have continued throughout February.
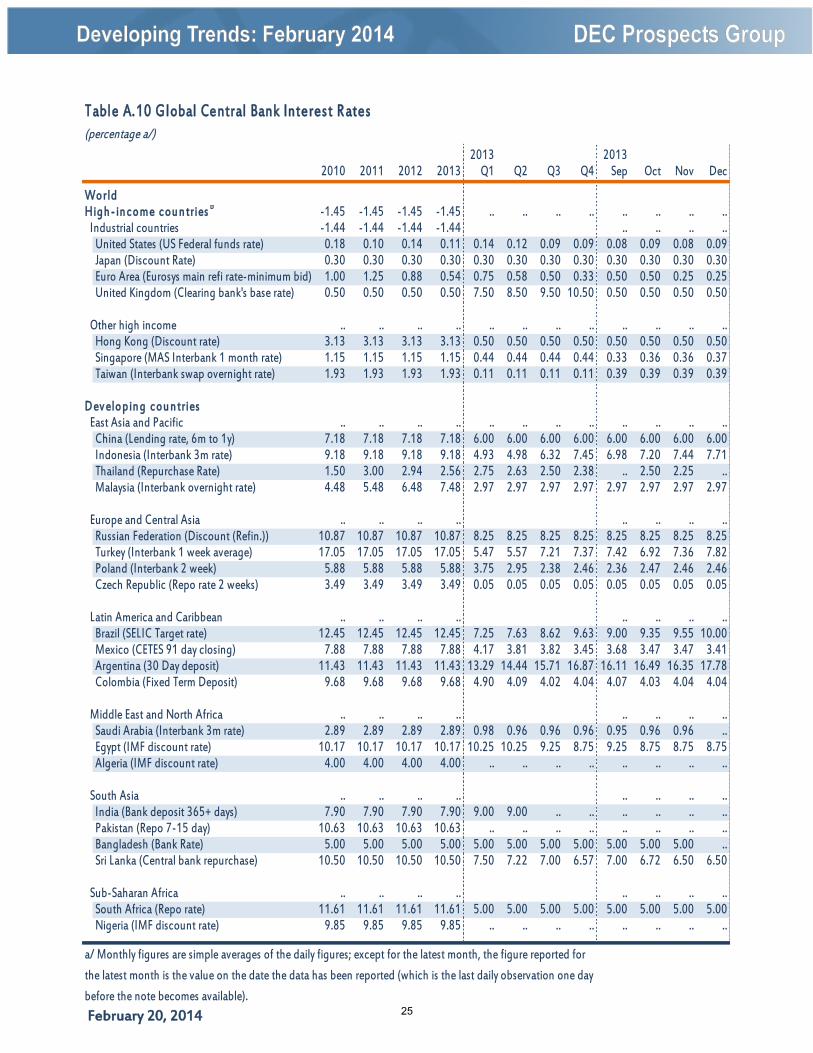
Central banks for several developing countries have recently hiked policy rates
Brazil, India, Turkey and South Africa have raised their key policy rates under renewed market pressure this year.
Brazil kicked off the round by raising policy rates by 25 basis points (bps), followed by 25 bps hike by India, and Turkey hiked its 1-week repo rate by more than 500 bps. This was immediately fol-lowed by South Africa’s decision to raise its lend-ing rate for the first time in nearly six years.
In contrast, Hungary and Romania have further cut their key interest rates this year.
Credit risks for developing countries have eased in February as Argentina spreads have declined more than 500 basis points. Global stocks have bounced back recently, restoring $3 trillion of market valuations that was lost due to last month’s sell-off. Central banks for Brazil, India, Turkey, and South Africa have hiked key policy rates this year amid renewed market pressure.
5-year sovereign CDS spreads for developing countries
Source: World Bank and Bloomberg
Monetary policy changes since May 2013
Source: World bank and Bloomberg
MSCI stock market indices
Source: World Bank and Bloomberg
-150
-100
-50
0
50
100
150
200
250
300
350
400
450
500
550
Tu
rkey
Bra
zil
Ind
on
esia
Ind
ia
Sou
th A
fric
a
Th
aila
nd
Per
u
Mex
ico
Co
lom
bia
Ro
man
ia
Hu
nga
ry
Policy rate changes since May 2013 (basis points)
11
February 20, 2014
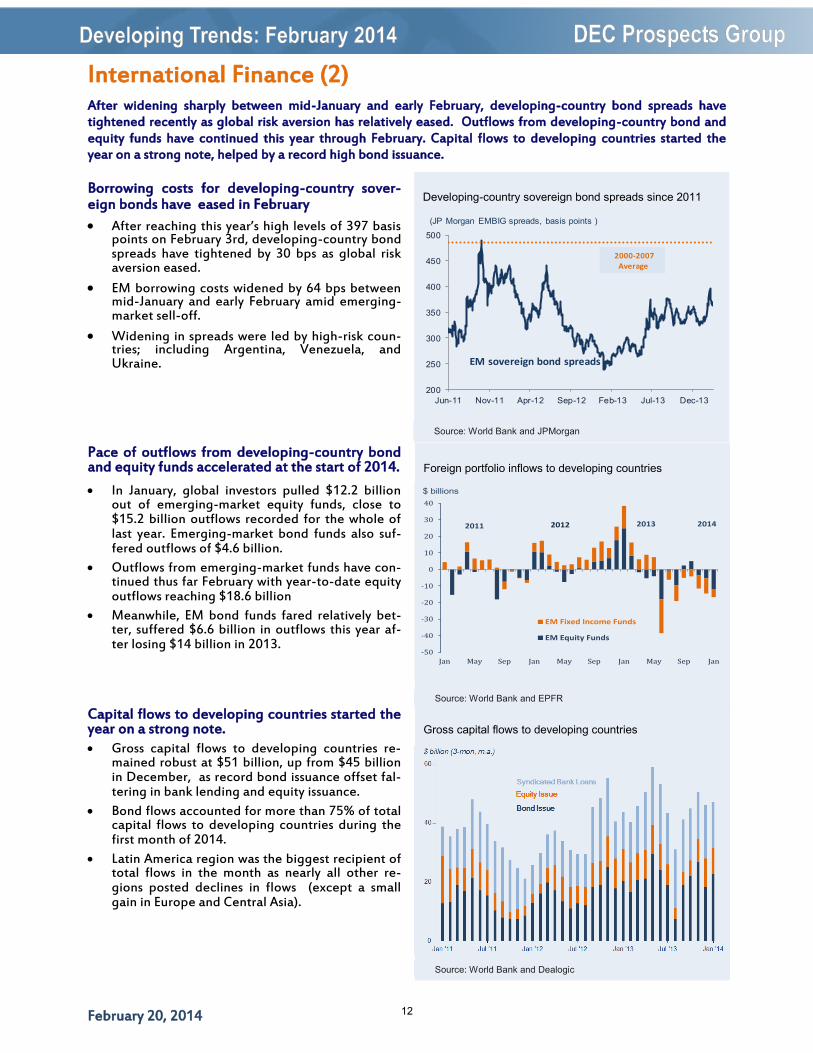
International Finance (2)
Pace of outflows from developing-country bond and equity funds accelerated at the start of 2014.
In January, global investors pulled $12.2 billion out of emerging-market equity funds, close to $15.2 billion outflows recorded for the whole of last year. Emerging-market bond funds also suf-fered outflows of $4.6 billion.
Outflows from emerging-market funds have con-tinued thus far February with year-to-date equity outflows reaching $18.6 billion
Meanwhile, EM bond funds fared relatively bet-ter, suffered $6.6 billion in outflows this year af-ter losing $14 billion in 2013.
Capital flows to developing countries started the year on a strong note. Gross capital flows to developing countries re-
mained robust at $51 billion, up from $45 billion in December, as record bond issuance offset fal-tering in bank lending and equity issuance.
Bond flows accounted for more than 75% of total capital flows to developing countries during the first month of 2014.
Latin America region was the biggest recipient of total flows in the month as nearly all other re-gions posted declines in flows (except a small gain in Europe and Central Asia).
After widening sharply between mid-January and early February, developing-country bond spreads have tightened recently as global risk aversion has relatively eased. Outflows from developing-country bond and equity funds have continued this year through February. Capital flows to developing countries started the year on a strong note, helped by a record high bond issuance.
Borrowing costs for developing-country sover-eign bonds have eased in February
After reaching this year’s high levels of 397 basis points on February 3rd, developing-country bond spreads have tightened by 30 bps as global risk aversion eased.
EM borrowing costs widened by 64 bps between mid-January and early February amid emerging-market sell-off.
Widening in spreads were led by high-risk coun-tries; including Argentina, Venezuela, and Ukraine.
Developing-country sovereign bond spreads since 2011
Source: World Bank and JPMorgan
Gross capital flows to developing countries
Source: World Bank and Dealogic
Foreign portfolio inflows to developing countries
Source: World Bank and EPFR
-50
-40
-30
-20
-10
0
10
20
30
40
Jan May Sep Jan May Sep Jan May Sep Jan
EM Fixed Income Funds
EM Equity Funds
$ billions
2011 2012 2013 2014
200
250
300
350
400
450
500
Jun-11 Nov-11 Apr-12 Sep-12 Feb-13 Jul-13 Dec-13
(JP Morgan EMBIG spreads, basis points )
EM sovereign bond spreads
2000-2007Average
12
February 20, 2014
International Finance (3)
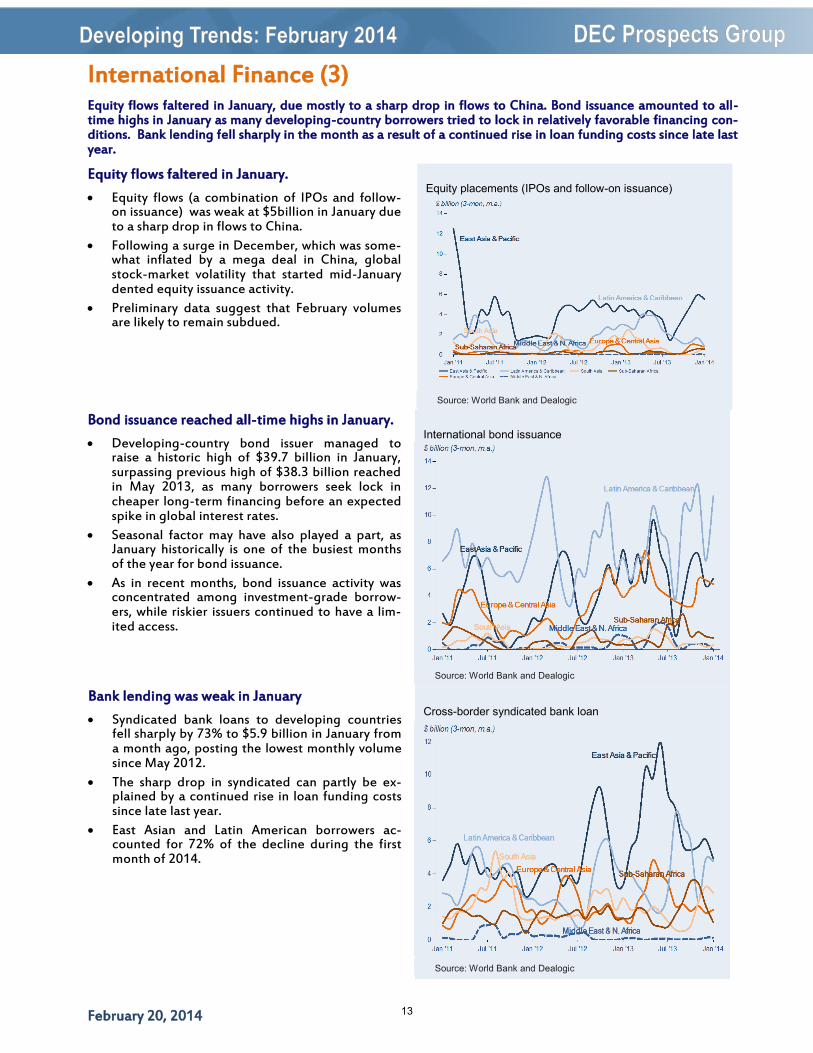
Equity flows faltered in January.
Equity flows (a combination of IPOs and follow-on issuance) was weak at $5billion in January due to a sharp drop in flows to China.
Following a surge in December, which was some-what inflated by a mega deal in China, global stock-market volatility that started mid-January dented equity issuance activity.
Preliminary data suggest that February volumes are likely to remain subdued.
Bond issuance reached all-time highs in January.
Developing-country bond issuer managed to raise a historic high of $39.7 billion in January, surpassing previous high of $38.3 billion reached in May 2013, as many borrowers seek lock in cheaper long-term financing before an expected spike in global interest rates.
Seasonal factor may have also played a part, as January historically is one of the busiest months of the year for bond issuance.
As in recent months, bond issuance activity was concentrated among investment-grade borrow-ers, while riskier issuers continued to have a lim-ited access.
Bank lending was weak in January
Syndicated bank loans to developing countries fell sharply by 73% to $5.9 billion in January from a month ago, posting the lowest monthly volume since May 2012.
The sharp drop in syndicated can partly be ex-plained by a continued rise in loan funding costs since late last year.
East Asian and Latin American borrowers ac-counted for 72% of the decline during the first month of 2014.
Equity flows faltered in January, due mostly to a sharp drop in flows to China. Bond issuance amounted to all-time highs in January as many developing-country borrowers tried to lock in relatively favorable financing con-ditions. Bank lending fell sharply in the month as a result of a continued rise in loan funding costs since late last year.
Equity placements (IPOs and follow-on issuance)
Source: World Bank and Dealogic
Cross-border syndicated bank loan
Source: World Bank and Dealogic
International bond issuance
Source: World Bank and Dealogic
13
February 20, 2014
Exchange Rates
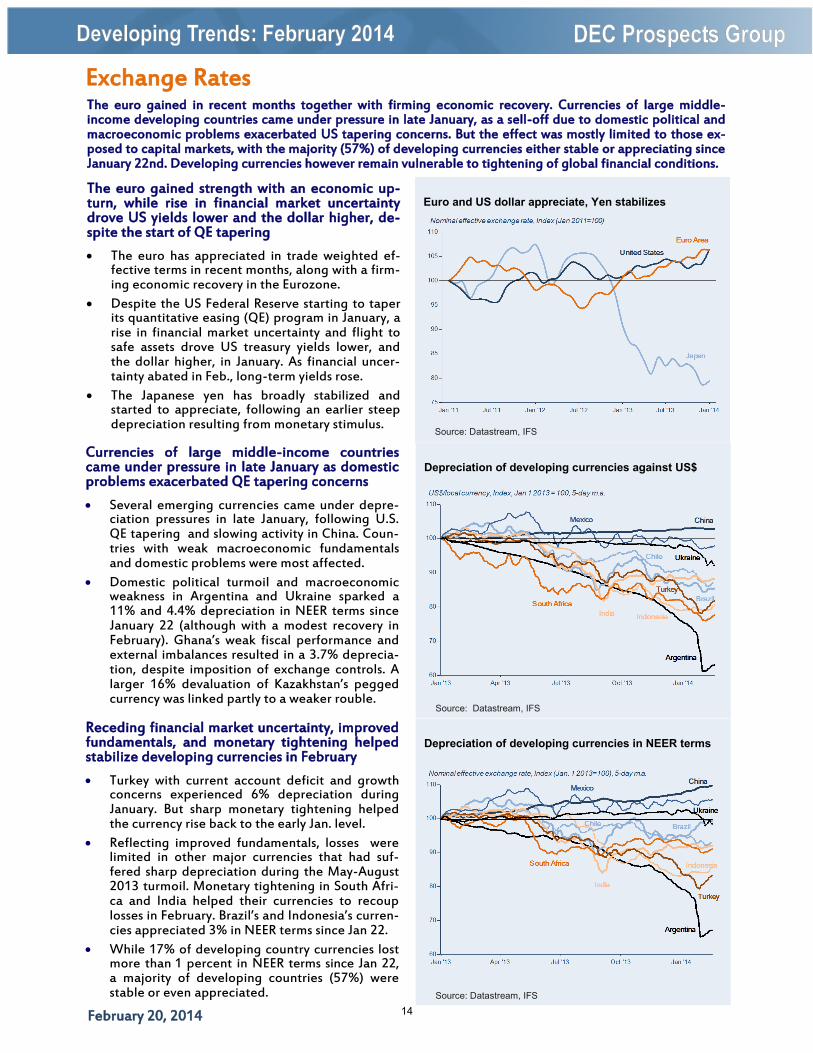
The euro gained strength with an economic up-turn, while rise in financial market uncertainty drove US yields lower and the dollar higher, de-spite the start of QE tapering
The euro has appreciated in trade weighted ef-fective terms in recent months, along with a firm-ing economic recovery in the Eurozone.
Despite the US Federal Reserve starting to taper its quantitative easing (QE) program in January, a rise in financial market uncertainty and flight to safe assets drove US treasury yields lower, and the dollar higher, in January. As financial uncer-tainty abated in Feb., long-term yields rose.
The Japanese yen has broadly stabilized and started to appreciate, following an earlier steep depreciation resulting from monetary stimulus.
Currencies of large middle-income countries came under pressure in late January as domestic problems exacerbated QE tapering concerns
Several emerging currencies came under depre-ciation pressures in late January, following U.S. QE tapering and slowing activity in China. Coun-tries with weak macroeconomic fundamentals and domestic problems were most affected.
Domestic political turmoil and macroeconomic weakness in Argentina and Ukraine sparked a 11% and 4.4% depreciation in NEER terms since January 22 (although with a modest recovery in February). Ghana’s weak fiscal performance and external imbalances resulted in a 3.7% deprecia-tion, despite imposition of exchange controls. A larger 16% devaluation of Kazakhstan’s pegged currency was linked partly to a weaker rouble.
Receding financial market uncertainty, improved fundamentals, and monetary tightening helped stabilize developing currencies in February
Turkey with current account deficit and growth concerns experienced 6% depreciation during January. But sharp monetary tightening helped the currency rise back to the early Jan. level.
Reflecting improved fundamentals, losses were limited in other major currencies that had suf-fered sharp depreciation during the May-August 2013 turmoil. Monetary tightening in South Afri-ca and India helped their currencies to recoup losses in February. Brazil’s and Indonesia’s curren-cies appreciated 3% in NEER terms since Jan 22.
While 17% of developing country currencies lost more than 1 percent in NEER terms since Jan 22, a majority of developing countries (57%) were stable or even appreciated.
The euro gained in recent months together with firming economic recovery. Currencies of large middle-income developing countries came under pressure in late January, as a sell-off due to domestic political and macroeconomic problems exacerbated US tapering concerns. But the effect was mostly limited to those ex-posed to capital markets, with the majority (57%) of developing currencies either stable or appreciating since January 22nd. Developing currencies however remain vulnerable to tightening of global financial conditions.
Euro and US dollar appreciate, Yen stabilizes
Source: Datastream, IFS
Depreciation of developing currencies in NEER terms
Source: Datastream, IFS
Depreciation of developing currencies against US$
Source: Datastream, IFS
14
February 20, 2014
Inflation
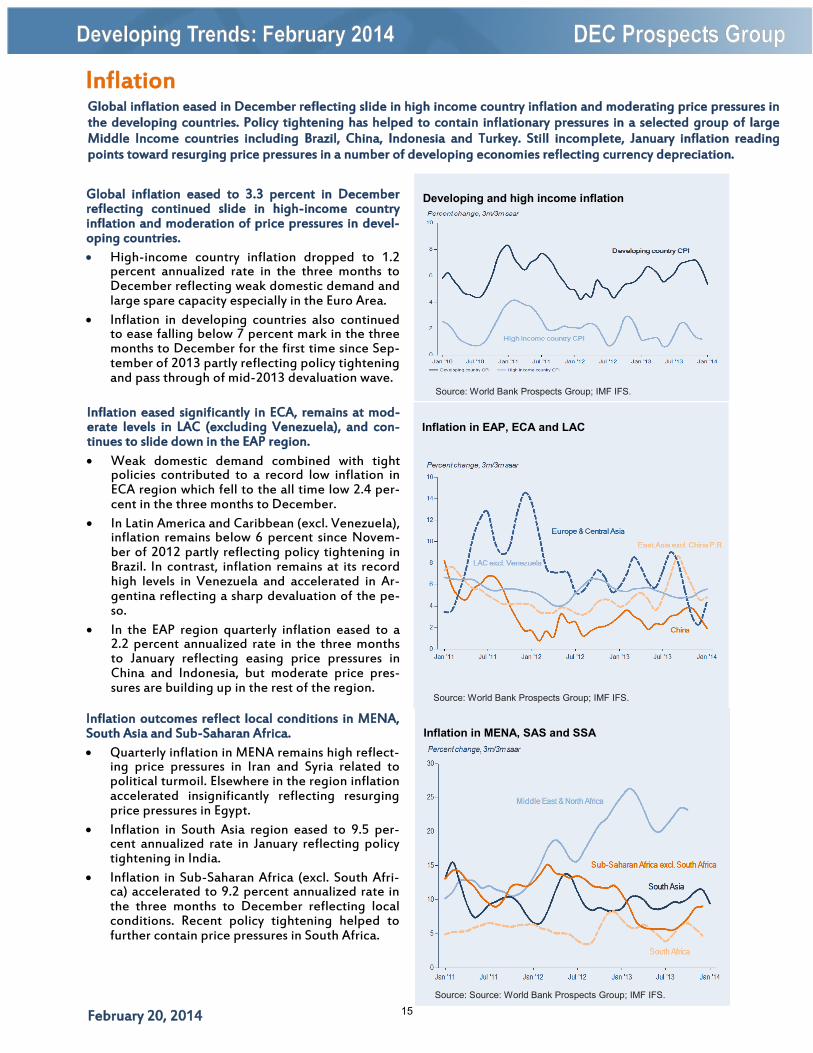
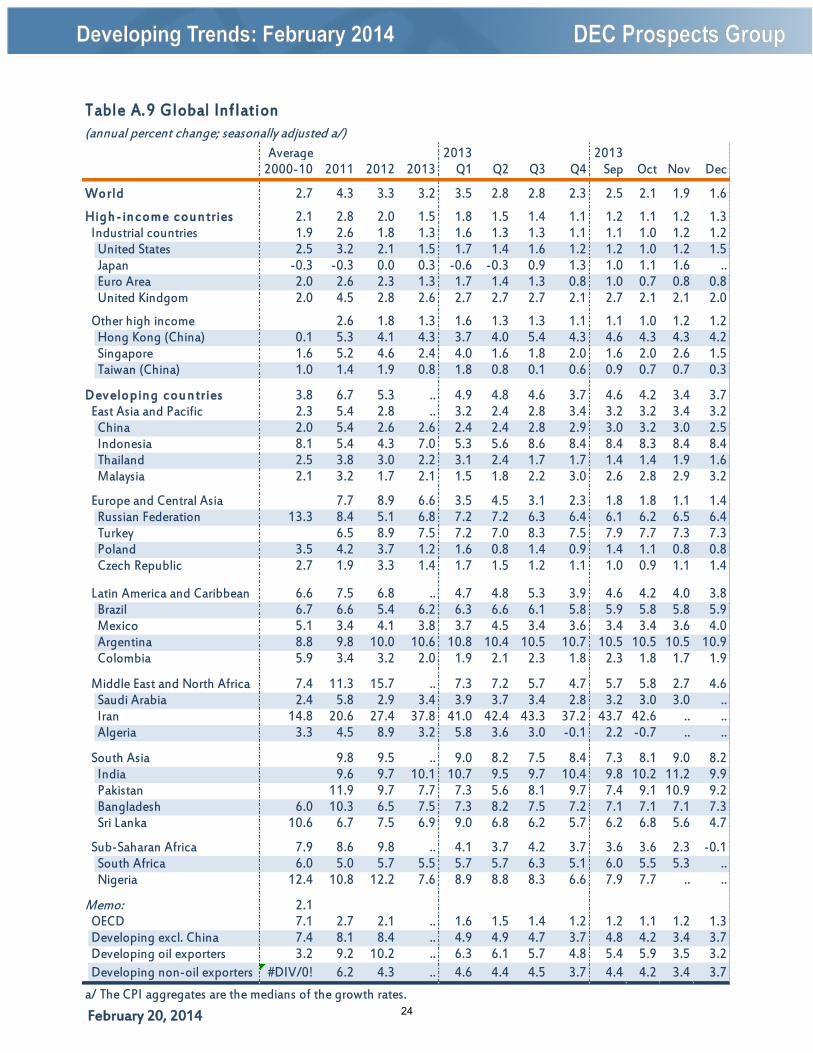
Global inflation eased to 3.3 percent in December reflecting continued slide in high-income country inflation and moderation of price pressures in devel-oping countries.
High-income country inflation dropped to 1.2 percent annualized rate in the three months to December reflecting weak domestic demand and large spare capacity especially in the Euro Area.
Inflation in developing countries also continued to ease falling below 7 percent mark in the three months to December for the first time since Sep-tember of 2013 partly reflecting policy tightening and pass through of mid-2013 devaluation wave.
Inflation eased significantly in ECA, remains at mod-erate levels in LAC (excluding Venezuela), and con-tinues to slide down in the EAP region.
Weak domestic demand combined with tight policies contributed to a record low inflation in ECA region which fell to the all time low 2.4 per-cent in the three months to December.
In Latin America and Caribbean (excl. Venezuela), inflation remains below 6 percent since Novem-ber of 2012 partly reflecting policy tightening in Brazil. In contrast, inflation remains at its record high levels in Venezuela and accelerated in Ar-gentina reflecting a sharp devaluation of the pe-so.
In the EAP region quarterly inflation eased to a 2.2 percent annualized rate in the three months to January reflecting easing price pressures in China and Indonesia, but moderate price pres-sures are building up in the rest of the region.
Inflation outcomes reflect local conditions in MENA, South Asia and Sub-Saharan Africa.
Quarterly inflation in MENA remains high reflect-ing price pressures in Iran and Syria related to political turmoil. Elsewhere in the region inflation accelerated insignificantly reflecting resurging price pressures in Egypt.
Inflation in South Asia region eased to 9.5 per-cent annualized rate in January reflecting policy tightening in India.
Inflation in Sub-Saharan Africa (excl. South Afri-ca) accelerated to 9.2 percent annualized rate in the three months to December reflecting local conditions. Recent policy tightening helped to further contain price pressures in South Africa.
Global inflation eased in December reflecting slide in high income country inflation and moderating price pressures in the developing countries. Policy tightening has helped to contain inflationary pressures in a selected group of large Middle Income countries including Brazil, China, Indonesia and Turkey. Still incomplete, January inflation reading points toward resurging price pressures in a number of developing economies reflecting currency depreciation.
Developing and high income inflation
Source: World Bank Prospects Group; IMF IFS.
Inflation in EAP, ECA and LAC
Source: World Bank Prospects Group; IMF IFS.
Inflation in MENA, SAS and SSA
Source: Source: World Bank Prospects Group; IMF IFS.
15
February 20, 2014
Average 2012 2013 20131999-09 2010 2011 2012 Q4 Q1 Q2 Q3 Aug Sep Oct Nov
World 2.3 9.3 4.8 3.0 2.1 3.7 3.0 4.4 0.2 0.5 0.3 0.8High - in come cou n tries 0.4 7.9 2.5 0.8 -2.7 1.7 2.6 2.5 0.1 0.3 0.1 0.8
Industrial countries 0.2 7.7 2.0 0.6 -3.1 2.4 2.6 2.4 0.0 0.3 0.1 0.9United States 0.2 5.7 3.4 3.6 2.5 4.1 1.2 2.4 0.5 0.6 0.3 1.0Japan -1.0 15.6 -2.6 0.2 -7.0 2.3 6.2 7.0 -0.9 1.3 1.0 -0.1Euro Area 0.0 6.8 3.1 -2.7 -8.4 1.7 3.0 0.0 0.9 -0.1 -0.9 1.6United Kingdom -1.1 2.8 -1.2 -2.5 -7.9 2.4 3.3 2.2 -1.1 0.9 0.2 0.0
Other high income 0.2 7.7 2.0 0.6 -3.1 2.4 2.6 2.4 0.0 0.3 0.1 0.9Hong Kong (China) -3.7 3.4 0.8 -0.9 2.1 -3.1 -3.2 0.3 0.1 0.2 .. ..Singapore 5.6 29.6 7.9 0.2 8.7 -9.2 32.2 -6.2 -1.4 4.1 0.3 -2.8Taiwan (China) 3.5 24.2 4.4 -0.2 1.7 -1.2 -5.3 6.0 -0.2 0.1 0.3 0.9
Dev elopin g cou n tries 6.5 11.4 8.0 6.1 8.5 6.2 3.5 6.7 0.4 0.7 0.5 0.7East Asia and Pacific 11.6 14.5 11.7 9.2 13.7 8.6 4.8 11.3 1.1 0.9 0.7 0.8
China 13.7 15.5 13.7 10.0 11.9 10.1 6.1 12.7 1.2 0.8 1.0 0.8Indonesia 3.4 4.7 4.0 4.1 40.9 -0.5 -6.4 0.5 1.0 2.8 -2.9 0.0Thailand 8.6 14.6 -8.5 2.1 9.0 -3.6 -12.6 -6.9 1.3 -2.4 -0.2 1.9Malaysia 4.7 7.2 1.2 4.4 16.5 -9.7 11.0 -0.5 -4.2 2.2 1.8 3.6
Europe and Central Asia .. 11.9 5.9 0.7 3.5 2.9 4.2 4.7 -2.0 3.8 -1.2 1.3Russian Federation 4.1 8.3 4.8 2.5 -0.9 0.6 -2.0 2.1 0.3 -0.1 -0.3 -0.1Turkey .. 12.4 9.7 2.5 3.2 2.8 5.4 4.1 -3.7 5.9 -3.0 2.8Poland 6.3 10.8 7.1 1.8 -2.0 -1.0 7.5 9.8 -0.8 1.4 0.2 -0.3Czech Republic 3.0 8.1 5.9 -0.8 -11.2 6.5 1.5 9.8 3.1 -1.4 1.8 1.3
Latin America and Caribbean 1.0 5.9 2.7 -0.5 -1.9 0.3 3.5 -0.9 -0.1 0.3 0.5 -0.2Brazil 2.4 10.6 0.4 -2.7 -1.0 4.2 3.2 -4.5 0.2 0.6 0.6 -0.2Mexico 1.1 4.6 3.4 2.5 -1.9 -0.7 -2.0 1.4 0.3 -0.7 0.4 0.1Argentina 2.3 9.2 5.9 -1.9 -0.9 1.0 7.5 1.0 0.2 0.9 0.2 0.2Colombia 1.9 4.2 5.0 -0.5 -7.7 -14.0 23.9 -0.3 -2.8 1.4 0.9 ..
Middle East and North Africa 2.0 2.2 -9.1 2.9 -13.8 1.5 2.4 -31.8 -3.6 -7.4 .. ..Saudi Arabia 0.1 7.9 6.3 4.0 -3.2 -11.6 17.6 7.4 1.6 1.1 .. ..Iran 1.1 1.1 -0.6 -17.0 -17.1 19.8 0.6 7.0 -0.2 -0.1 .. ..Egypt .. 10.0 -6.8 4.9 17.4 10.8 -26.6 -48.3 -5.4 -5.4 0.2 7.9Algeria 2.5 -2.8 0.0 -0.5 -14.2 2.3 3.7 -7.2 -0.2 -6.7 .. ..
South Asia 7.1 9.9 5.6 1.3 7.9 4.6 -9.8 9.4 -1.1 1.4 -1.6 0.2India 7.3 9.7 4.8 0.7 6.6 3.4 -10.5 8.8 -0.5 -0.1 -1.4 0.1Pakistan 5.8 11.0 6.4 1.6 11.5 19.0 -10.6 7.4 0.6 5.2 -3.9 1.7Sri Lanka .. 15.1 8.0 -0.3 6.5 4.0 0.5 .. 0.4 .. .. ..
Sub-Saharan Africa 0.8 4.9 0.6 1.5 -0.8 -3.3 8.7 -6.5 -3.0 -1.7 .. ..South Africa 0.8 4.5 2.7 2.5 6.8 -6.3 12.4 -7.8 -3.8 -4.5 6.8 0.3Nigeria 0.4 11.2 3.9 -1.2 -17.1 -1.6 -3.4 -3.1 -2.9 2.9 .. ..
Memo:OECD 0.3 7.7 2.3 0.7 -2.9 2.3 2.4 2.4 -0.1 0.3 0.1 0.9Developing excl. China 2.5 7.3 1.8 1.2 4.1 1.1 0.0 -1.4 -0.8 0.5 -0.3 0.5Developing oil exporters 3.6 0.9 1.7 4.2 -2.0 3.0 -3.4 -0.7 -0.1 -0.8 0.4Dev. non-oil exporters 8.8 13.9 10.1 7.2 9.6 8.3 3.7 9.2 0.6 0.8 0.7 0.7
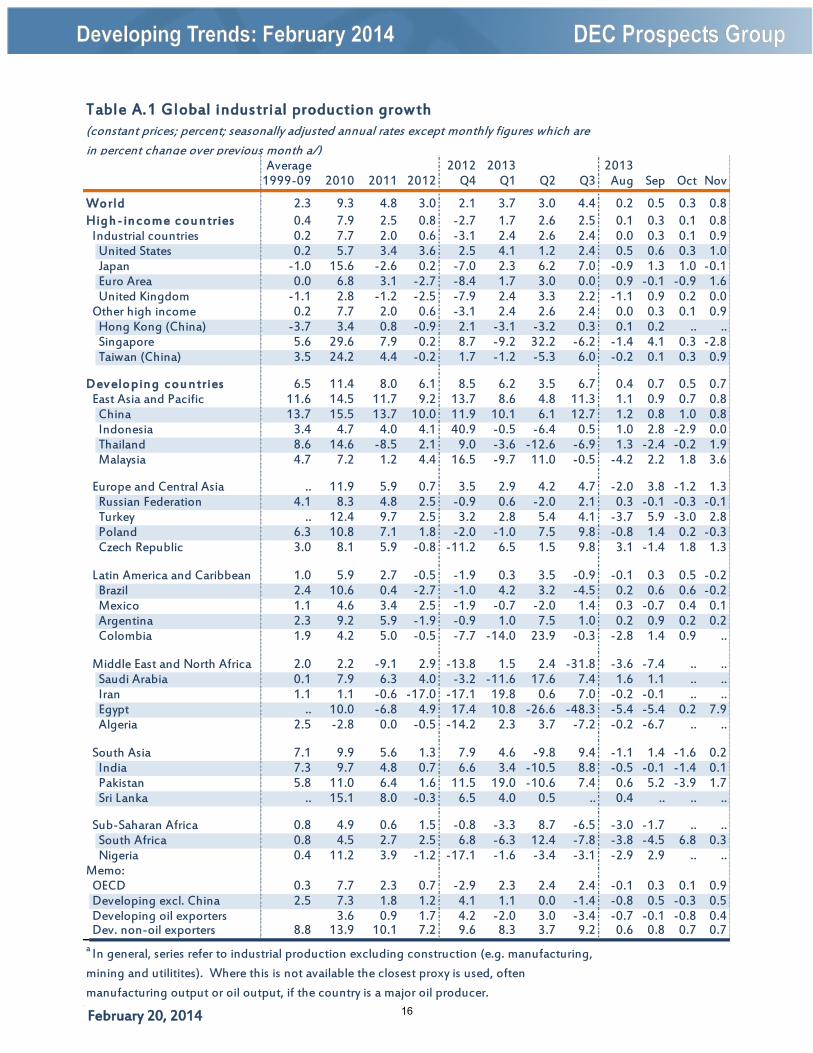
Table A.1 Global industrial production growth(constant prices; percent; seasonally adjusted annual rates except monthly figures which are
in percent change over previous month a/)
a In general, series refer to industrial production excluding construction (e.g. manufacturing,
mining and utilitites). Where this is not available the closest proxy is used, often
manufacturing output or oil output, if the country is a major oil producer.
16
February 20, 2014
Avg 2013 20131999-09 2010 2011 2012 2013 Q1 Q2 Q3 Q4 Sep Oct Nov Dec
Real GDP
High - in come cou n tries 1.5 3.4 1.2 1.5 -23.8 2.0 2.7 2.1 .. .. .. .. ..Industrial countries 1.4 3.3 1.0 0.0 0.0 2.1 2.7 2.0 .. .. .. .. ..
United States 2.1 2.5 1.8 0.0 0.0 1.1 2.5 4.1 .. .. .. .. ..Japan 0.5 4.7 -0.4 0.0 0.0 4.5 3.6 1.1 .. .. .. .. ..Euro Area 1.5 1.9 1.6 0.0 0.0 -0.8 1.4 0.5 .. .. .. .. ..
United Kingdom 2.0 1.7 1.1 0.0 0.0 2.0 3.2 3.1 .. .. .. .. ..
Real merch an dis e imports
High - in come cou n tries 3.3 12.3 4.8 0.5 .. 3.6 4.6 0.7 .. 1.9 2.6 -3.4 ..Industrial countries 3.4 11.2 4.6 -0.2 .. 2.4 6.5 0.5 .. 1.6 3.3 -3.7 ..
United States 3.0 14.9 3.8 2.9 .. -2.9 11.5 -1.6 .. 2.4 3.1 -3.8 ..Japan 2.3 10.5 4.3 4.1 .. 4.3 5.1 3.2 .. 0.6 4.8 -2.9 ..Euro Area 3.4 8.1 4.7 -4.2 .. 6.5 7.0 -0.3 .. 1.5 3.4 -3.7 ..United Kingdom 2.8 10.7 0.6 2.9 .. -8.8 .. .. .. .. .. .. ..
Other high income 3.4 11.2 4.6 -0.2 .. 2.4 6.5 0.5 .. 3.7 -1.2 -1.7 ..Hong Kong (China) 3.0 18.7 4.3 1.2 .. -9.0 -0.8 4.4 .. 2.9 3.1 2.3 ..Singapore 2.3 14.7 1.5 3.3 1.1 -11.2 8.2 19.4 -7.7 3.1 0.8 -8.2 3.9Taiwan (China) 3.4 29.3 -3.0 -1.9 4.6 30.1 -17.9 -0.5 18.5 6.1 -3.3 0.4 9.0
I mport Prices
High - in come cou n tries 3.5 5.8 12.4 -1.4 .. -1.9 -9.4 5.0 .. 0.5 -0.3 0.0 ..Industrial countries 3.1 5.7 12.4 -2.0 .. -1.3 -10.1 5.8 .. 0.5 -0.4 0.0 ..
United States 2.4 6.9 10.9 0.3 -1.1 -1.2 -8.8 7.1 -2.6 0.1 -0.4 -0.7 ..Japan 4.7 14.2 18.3 -0.4 -6.3 -7.6 -16.9 -0.4 5.2 0.2 1.2 -0.2 ..Euro Area 3.5 3.2 11.9 -3.4 .. 1.1 -9.4 8.3 .. 1.1 -1.2 0.3 ..United Kingdom 1.6 4.5 13.1 -1.5 -1.3 -3.5 -11.7 .. .. .. .. .. ..
Other high income 3.1 5.7 12.4 -2.0 .. -1.3 -10.1 5.8 .. 0.3 0.6 0.2 ..Hong Kong (China) 2.4 5.1 7.4 3.2 -0.1 -2.1 -1.5 1.9 3.3 0.3 0.6 -0.1 ..Singapore 4.7 10.5 15.8 0.7 -3.0 -2.1 -12.7 0.2 6.5 1.0 0.5 0.4 0.2Taiwan (China) 3.5 12.2 15.3 -1.9 -4.8 -8.4 -10.0 0.8 2.4 0.3 0.4 -0.2 0.2
Real effectiv e ex ch an ge rates a
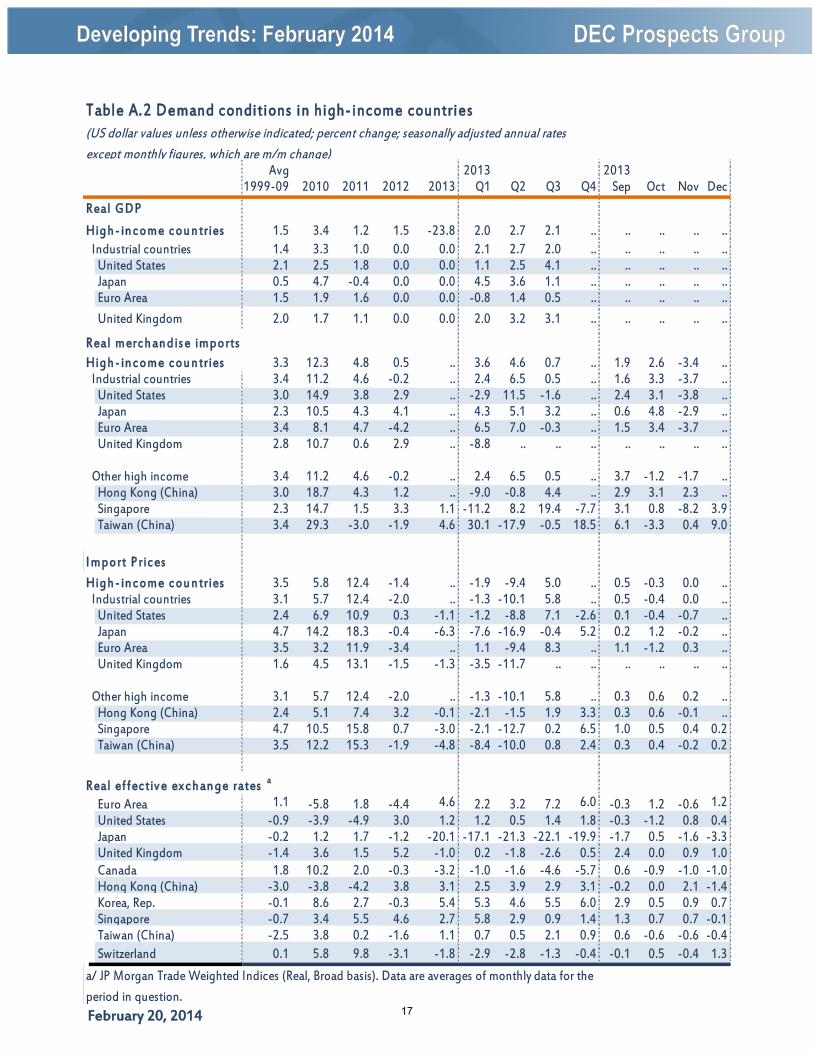
Euro Area 1.1 -5.8 1.8 -4.4 4.6 2.2 3.2 7.2 6.0 -0.3 1.2 -0.6 1.2United States -0.9 -3.9 -4.9 3.0 1.2 1.2 0.5 1.4 1.8 -0.3 -1.2 0.8 0.4Japan -0.2 1.2 1.7 -1.2 -20.1 -17.1 -21.3 -22.1 -19.9 -1.7 0.5 -1.6 -3.3United Kingdom -1.4 3.6 1.5 5.2 -1.0 0.2 -1.8 -2.6 0.5 2.4 0.0 0.9 1.0Canada 1.8 10.2 2.0 -0.3 -3.2 -1.0 -1.6 -4.6 -5.7 0.6 -0.9 -1.0 -1.0Hong Kong (China) -3.0 -3.8 -4.2 3.8 3.1 2.5 3.9 2.9 3.1 -0.2 0.0 2.1 -1.4Korea, Rep. -0.1 8.6 2.7 -0.3 5.4 5.3 4.6 5.5 6.0 2.9 0.5 0.9 0.7Singapore -0.7 3.4 5.5 4.6 2.7 5.8 2.9 0.9 1.4 1.3 0.7 0.7 -0.1Taiwan (China) -2.5 3.8 0.2 -1.6 1.1 0.7 0.5 2.1 0.9 0.6 -0.6 -0.6 -0.4Switzerland 0.1 5.8 9.8 -3.1 -1.8 -2.9 -2.8 -1.3 -0.4 -0.1 0.5 -0.4 1.3
Table A.2 Demand conditions in high-income countries(US dollar values unless otherwise indicated; percent change; seasonally adjusted annual rates
except monthly figures, which are m/m change)
a/ JP Morgan Trade Weighted Indices (Real, Broad basis). Data are averages of monthly data for the
period in question. 17
February 20, 2014
Average 2013 20131999-08 2010 2011 2012 2013 Q2 Q3 Q4 Sep Oct Nov Dec
Policy RatesUnited States 3.44 0.16 0.16 0.16 0.16 0.12 0.12 0.12 2.12 2.12 2.78 3.28Japan 0.33 0.30 0.30 0.30 0.30 0.30 0.30 0.30 2.30 2.30 2.97 3.47Euro Area .. 1.28 1.28 1.28 1.28 1.00 1.00 1.00 3.00 3.00 3.67 4.17United Kingdom 4.80 0.65 0.65 0.65 0.65 0.50 0.50 0.50 2.50 2.50 3.17 3.67
Ten year bon dUnited States 4.70 3.24 3.20 2.77 1.78 0.72 0.76 0.64 2.80 2.60 2.71 2.90Japan 1.49 1.34 1.17 1.12 0.85 2.87 3.20 3.21 0.72 0.64 0.62 0.67Euro Area .. 4.03 3.79 4.31 3.05 1.93 2.74 2.79 3.41 3.16 3.17 3.31United Kingdom 4.77 3.66 3.58 3.06 1.85 0.00 0.00 0.00 2.89 2.69 2.75 2.93
Spreads (Bas is poin ts ) b ,c
Dev elopin g cou n tries .. 296 323 329 305 297 331 324 337 321 329 321East Asia and Pacific .. .. .. .. .. .. .. .. .. .. .. ..China 82 77 193 218 162 167 173 162 169 170 164 152Indonesia .. 218 225 228 260 230 317 298 340 286 303 305Phillippines .. 206 200 177 153 150 173 153 180 160 157 142Malaysia 129 140 145 152 134 133 151 141 153 143 142 139
Europe and Central Asia .. .. .. .. .. .. .. .. .. .. .. ..Russian Federation 262 229 259 255 206 203 225 217 228 215 220 217Turkey 404 221 260 281 239 208 275 277 287 262 278 291Poland 99 156 210 192 135 133 148 137 147 140 143 130
Latin America and Caribbean 522 345 353 345 340 334 364 361 364 356 366 360Brazil 551 202 195 183 209 197 237 240 235 227 247 245Mexico 206 187 186 188 189 183 204 201 203 200 209 192Argentina 2920 690 687 989 1067 1200 1092 850 1069 926 819 804Colombia 370 189 168 148 158 149 178 177 181 171 183 177
Middle East and North Africa .. 346 369 455 439 463 444 433 456 451 432 416Egypt .. 173 371 502 565 623 622 506 532 519 466 ..
South Asia d .. .. .. .. .. .. .. .. .. .. .. ..Pakistan .. 624 922 1067 734 753 666 612 613 604 618 ..Sri Lanka .. 369 358 414 406 383 441 449 429 463 456 ..
Sub-Saharan Africa .. .. .. .. .. .. .. .. .. .. .. ..South Africa 172 167 195 206 235 213 272 265 265 272 257 ..
Gros s in flow s e
Dev elopin g cou n tries .. 447 403 458 558 159.4 123.3 137.7 58.7 47.6 44.9 45.2East Asia and Pacific .. 154 123 163 210 69.3 36.7 50.3 21.0 20.7 11.3 18.3Europe and Central Asia .. 44 58 66 82 25.8 10.8 23.5 6.5 6.2 12.3 5.0Latin America and Carribean .. 156 146 150 178 42.8 56.8 39.6 22.2 13.3 12.1 14.1Middle East and North Africa .. 19 7 7 9 6.4 0.5 1.9 0.3 1.3 0.0 0.6South Asia .. 56 44 42 39 10.8 3.1 11.3 1.5 2.2 4.7 4.4Sub-Saharan Africa .. 18 25 30 39 4.2 15.4 11.2 7.3 4.0 4.4 2.7
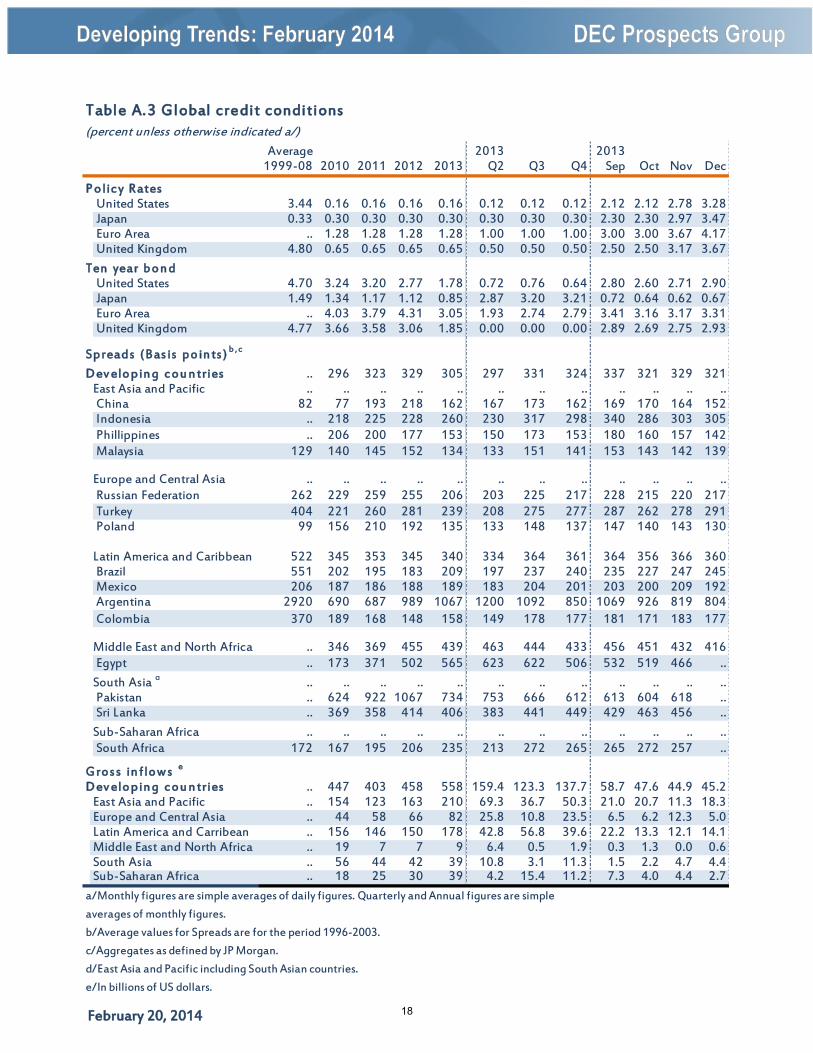
Table A.3 Global credit conditions(percent unless otherwise indicated a/)
a/Monthly figures are simple averages of daily figures. Quarterly and Annual figures are simple
averages of monthly figures.
b/Average values for Spreads are for the period 1996-2003.
c/Aggregates as defined by JP Morgan.
d/East Asia and Pacific including South Asian countries.
e/In billions of US dollars.
18
February 20, 2014
2013 2013
2010 2011 2012 2013 Q1 Q2 Q3 Q4 Sep Oct Nov Dec
Energy 100.0 128.7 127.6 127.4 128.6 123.1 130.2 127.7 131.6 128.3 125.5 129.5
Coal, Australia 100.0 122.7 97.4 85.4 93.9 87.0 78.1 82.9 78.4 80.2 83.1 85.2
Crude o il, average 100.0 131.6 132.9 131.7 133.0 125.7 135.9 132.2 137.6 133.4 129.8 133.5
Natural gas , Europe 100.0 126.9 138.4 142.2 142.8 149.2 138.7 138.1 135.7 137.2 137.8 139.4
N o n-energy 100.0 119.8 109.5 101.7 107.2 101.7 99.2 98.6 98.7 99.1 98.0 98.5
A griculture 100.0 121.6 114.5 106.3 110.1 107.3 104.3 103.5 103.6 104.0 103.1 103.3
B everages 100.0 116.0 92.6 83.3 84.5 83.3 82.2 83.1 82.6 83.1 81.5 84.7
Cocoa 100.0 95.1 76.3 77.8 70.5 73.6 78.8 88.4 83.5 87.2 87.9 90.2
Coffee, arabica 100.0 138.3 95.2 71.2 77.7 74.0 69.0 64.1 67.5 65.7 62.3 64.3
Coffee, robusta 100.0 138.7 130.6 119.6 131.2 123.5 117.3 106.4 111.5 106.3 101.2 111.6
F o o d 100.0 122.5 124.5 115.6 120.7 117.4 113.2 111.2 111.5 112.0 111.2 110.5
F ats and o ils 100.0 120.5 126.1 115.9 117.8 112.7 113.8 119.2 116.5 117.5 119.9 120.1
Palm o il 100.0 124.9 110.9 95.1 94.7 94.4 91.8 99.6 91.0 95.4 102.2 101.2
Soybean meal 100.0 105.2 138.5 144.1 140.3 139.6 145.8 150.6 149.6 153.3 149.6 149.1
Soybeans 100.0 120.2 131.5 119.7 125.9 112.3 117.2 123.4 123.6 120.9 122.9 126.3
Grains 100.0 138.2 141.3 128.2 143.6 138.3 121.6 109.5 111.7 111.7 109.0 107.6
M aize 100.0 156.9 160.5 139.5 164.0 156.7 130.1 107.3 111.6 108.5 107.1 106.2
Rice, Thailand, 5% 100.0 111.1 115.2 103.5 115.0 110.8 97.6 90.5 90.8 89.8 89.6 92.2
Wheat, US, HRW 100.0 141.5 140.1 139.7 143.7 140.3 136.8 137.8 137.5 145.7 137.2 130.4
Other fo o d 100.0 111.1 107.1 103.9 104.0 104.7 104.7 102.4 104.8 105.0 101.6 100.4
Bananas, US 100.0 111.5 113.3 106.4 107.1 104.5 107.5 106.6 107.9 107.3 106.3 106.3
Sugar, world 100.0 122.1 101.2 83.1 87.1 82.2 80.3 82.8 81.7 87.7 83.0 77.7
R aw materials 100.0 122.0 101.3 95.3 97.3 94.9 94.1 95.0 95.2 95.4 94.3 95.4
Cotton ("A" Index) 100.0 145.8 86.1 87.3 86.8 89.5 88.7 84.2 87.0 86.3 81.7 84.5
Rubber, Singapore 100.0 132.0 92.4 76.5 86.4 79.5 70.9 69.2 72.2 69.4 68.1 70.0
Sawnwood, M alaysia 100.0 110.7 103.3 100.5 99.6 98.7 99.7 104.1 102.0 103.4 103.5 105.3
F ert ilizers 100.0 142.6 137.6 113.7 128.9 119.8 108.2 97.9 102.6 98.8 96.6 98.2
Triple superphosphate 100.0 140.9 121.0 100.0 113.9 111.6 95.8 78.9 87.1 81.2 77.2 78.2
M etals and minerals 100.0 113.5 96.1 90.8 98.7 88.2 87.8 88.5 88.2 89.1 87.8 88.7
Aluminum 100.0 110.5 93.1 85.0 92.0 84.5 82.0 81.3 81.0 83.5 80.4 80.0
Copper 100.0 117.2 105.7 97.3 105.1 95.0 94.0 95.1 95.0 95.6 93.8 95.7
Gold 100.0 128.1 136.3 115.3 133.2 115.5 108.5 103.9 110.1 107.5 104.2 100.0
Nickel 100.0 105.1 80.5 68.9 79.3 68.6 64.0 63.8 63.3 64.7 62.7 63.9
M emo:
C rude Oil (US$ ) 79.0 104.0 105.0 104.1 105.1 99.3 107.4 104.5 108.8 105.4 102.6 105.5
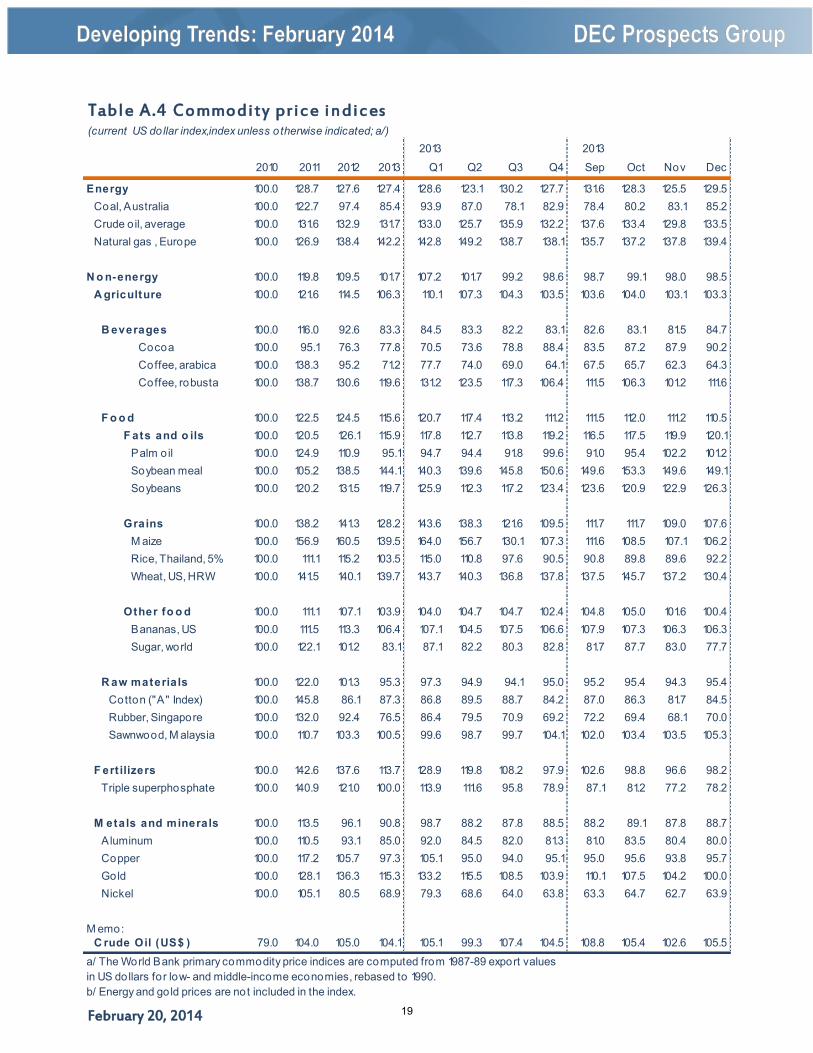
Table A.4 Commodity price indices(current US dollar index,index unless otherwise indicated; a/)
a/ The World Bank primary commodity price indices are computed from 1987-89 export values
in US dollars for low- and middle-income economies, rebased to 1990.
b/ Energy and gold prices are not included in the index.
19
February 20, 2014
Average 2013 20131999-09 2011 2012 2013 Q1 Q2 Q3 Q4 Sep Oct Nov Dec
Ex port v alu es
Dev elopin g cou n tries 13.3 21.7 3.6 .. 14.0 -13.4 3.5 .. 0.5 4.2 -0.6 ..East Asia and Pacific 15.1 19.6 6.4 6.2 25.1 -19.1 -1.3 29.8 -0.7 5.9 0.1 1.9
China 19.5 20.1 8.1 8.3 35.7 -21.9 -2.6 28.9 -2.1 6.0 0.3 1.9Indonesia 9.0 28.9 -6.4 .. 9.4 -15.7 -21.9 .. 16.8 6.6 -2.0 ..Thailand 10.4 15.0 3.1 .. -0.4 -14.0 -5.6 .. -6.3 7.0 -0.8 ..
Europe and Central Asia 14.0 25.4 1.2 .. 16.1 -7.5 9.8 .. 6.3 -3.3 5.0 ..Russian Federation 15.8 31.1 2.7 .. -8.7 -10.3 27.1 .. 2.6 -5.2 6.1 ..Turkey 14.0 18.7 13.1 .. 5.4 -12.0 5.9 .. 13.8 -11.2 18.8 ..Poland 17.2 18.3 -3.8 .. 46.2 -7.2 16.6 .. 0.0 -2.2 .. ..
Latin America and Caribbean 8.0 23.2 2.3 .. -9.2 8.2 2.9 .. 2.3 3.5 -4.0 ..Brazil 11.5 27.0 -4.7 -0.5 -6.5 8.7 -10.4 27.8 6.5 6.3 -2.9 -1.1Mexico 7.0 17.2 6.2 .. -7.5 11.6 10.7 .. 3.3 2.3 -6.2 ..Argentina 8.0 23.2 -3.2 .. -2.1 22.0 -12.2 .. -1.2 5.1 0.3 ..
Middle East and North Africa 18.5 17.0 1.4 .. .. .. .. .. .. .. .. ..Saudi Arabia 18.3 42.3 10.8 .. .. .. .. .. .. .. .. ..Iran 21.8 29.9 -20.2 .. .. .. .. .. .. .. .. ..Egypt 21.4 15.0 -3.4 .. 0.4 -29.9 -8.8 .. 5.5 .. .. ..
South Asia 14.3 32.5 -2.2 5.9 9.5 -20.5 53.3 2.0 1.5 1.8 -4.5 -1.6India 16.5 33.3 -1.9 5.5 10.1 -24.4 57.5 2.5 -0.1 4.1 -5.8 -2.4Pakistan 7.5 19.2 -2.5 2.7 -18.9 8.3 56.3 -24.3 23.4 -26.9 11.4 8.9Bangladesh 13.4 40.1 -3.9 .. 29.0 3.4 21.7 .. 0.1 7.8 -1.4 ..
Sub-Saharan Africa 13.1 23.9 -3.4 .. .. .. .. .. .. .. .. ..South Africa 9.0 20.9 -9.6 .. 11.9 -4.6 -13.8 .. -6.9 9.9 -2.4 ..Nigeria 20.7 36.5 -0.1 .. .. .. .. .. .. .. .. ..
Ex port prices b,c
Dev elopin g cou n tries 4.7 12.4 -1.7 .. -7.7 -4.6 0.8 .. -0.1 0.3 0.2 ..East Asia and Pacific 2.9 9.8 -1.7 -1.7 -7.3 -2.1 1.3 1.1 0.1 0.1 0.6 -0.8
China 1.7 9.2 -1.3 -1.4 -6.4 -2.3 1.5 1.6 0.0 0.1 0.8 -0.8Indonesia 7.5 16.8 -6.9 -4.7 -18.2 -0.8 -2.2 2.8 -0.3 0.9 -0.1 ..Thailand 2.8 5.7 0.6 -0.4 -1.2 -3.4 1.0 -1.2 0.3 -0.2 -0.1 ..
Europe and Central Asia 3.0 12.3 -2.9 .. -2.0 -4.7 -2.1 .. 0.1 0.8 0.0 ..Russian Federation 9.3 24.5 -1.4 -2.0 -10.2 -12.4 28.0 -2.7 0.5 -0.5 -1.7 ..Turkey 3.3 11.5 -2.8 0.2 11.1 -7.6 -2.8 2.2 -0.4 0.6 0.1 ..Poland 2.1 9.2 -11.4 -1.6 39.2 -7.8 -8.3 -24.5 2.0 -7.8 .. ..
Latin America and Caribbean 4.7 15.9 -4.5 .. -6.6 -13.7 1.2 .. -0.6 1.4 -0.8 ..Brazil 4.6 16.9 -6.4 -3.1 -7.0 -17.3 10.9 6.3 0.8 0.6 0.1 0.2Mexico 4.0 14.5 -2.6 -0.2 -2.3 -5.4 0.8 -3.7 -0.3 -0.1 -1.2 ..Argentina -1.8 12.4 -6.7 -14.4 -17.4 -17.5 -25.4 32.2 -3.2 11.0 -0.2 ..
Middle East and North Africa 11.9 16.2 20.4 .. .. .. .. .. .. .. .. ..
Saudi Arabia 19.5 34.0 6.6 0.0 -8.0 .. .. .. .. .. .. ..Iran 13.5 27.9 0.2 1.7 5.1 .. .. .. .. .. .. ..Egypt 5.3 16.9 0.1 -0.9 -8.8 2.5 7.9 .. 0.2 .. .. ..
South Asia 2.1 11.5 -3.3 -1.9 -6.1 -4.9 1.1 0.7 -0.1 0.0 -0.1 0.1
India 2.5 11.6 -3.8 -1.9 -6.9 -5.4 2.3 1.1 -0.1 0.1 -0.2 -0.1Pakistan 0.4 18.3 0.5 -2.4 10.3 -7.9 -13.4 -0.9 -1.7 1.2 -0.7 1.7Bangladesh 1.6 8.9 -1.2 .. -6.9 1.6 2.3 -0.1 0.1 0.1 0.0 ..
Sub-Saharan Africa 9.5 23.9 -3.1 .. .. .. .. .. .. .. .. ..
South Africa 8.6 19.1 -7.3 -6.3 -0.6 -3.5 -9.8 -21.6 -0.2 -5.1 0.5 ..
Nigeria 14.3 29.0 0.5 2.8 10.1 .. .. .. .. .. .. ..
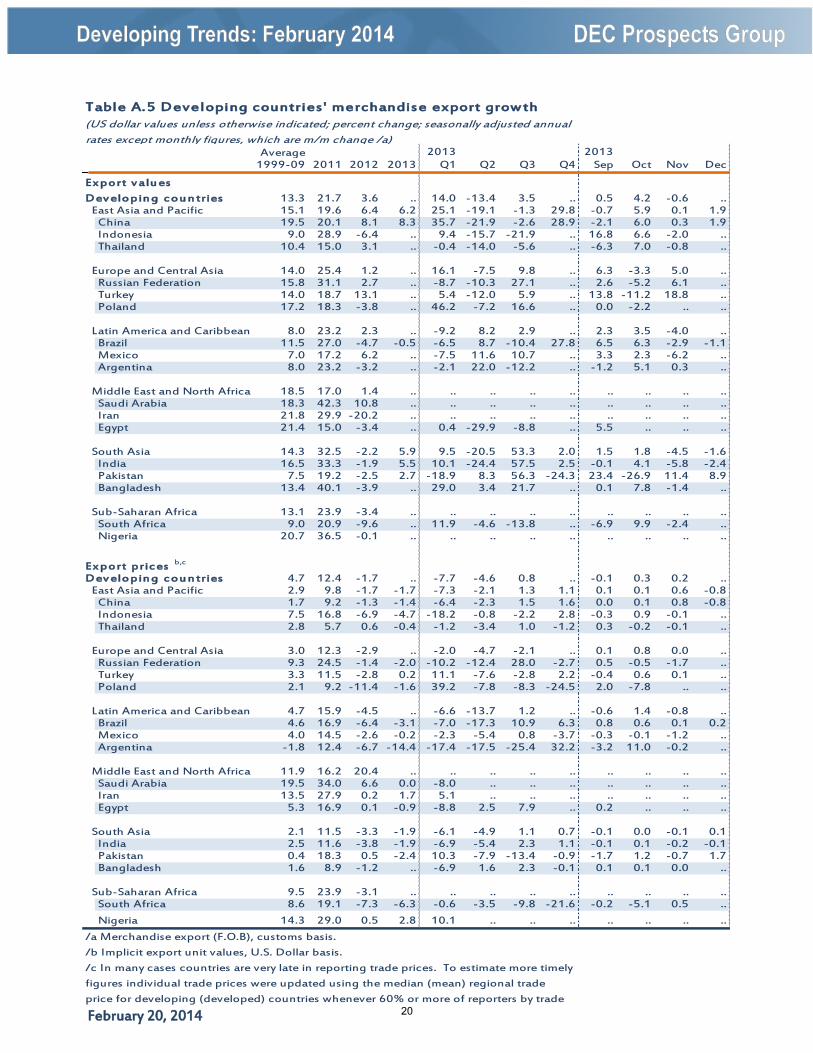
Table A.5 Developing countries ' merchandise export growth(US dollar values unless otherwise indicated; percent change; seasonally adjusted annual
rates except monthly figures, which are m/m change /a)
/a Merchandise export (F.O.B), customs basis.
/b Implicit export unit values, U.S. Dollar basis.
/c In many cases countries are very late in reporting trade prices. To estimate more timely
figures individual trade prices were updated using the median (mean) regional trade
price for developing (developed) countries whenever 60% or more of reporters by trade 20
February 20, 2014
Average 2013 20131999-09 2011 2012 2013 Q1 Q2 Q3 Q4 Sep Oct Nov Dec
I mport v alu esDev elopin g cou n tries 12.9 24.2 4.5 .. 12.5 -10.2 -0.4 .. 1.4 2.8 -3.1 ..
East Asia and Pacific 16.0 24.4 5.6 5.4 17.2 -14.7 7.6 10.4 2.9 2.4 -2.4 4.3China 20.3 25.2 4.7 6.7 21.2 -15.8 16.1 9.3 2.4 2.2 -2.2 4.3Indonesia 15.2 30.8 8.3 .. -6.4 -10.5 -17.9 .. 23.7 -3.1 -2.3 ..Thailand 12.2 25.0 9.2 .. 13.1 -23.3 -25.7 .. -2.4 10.0 -3.6 ..
Europe and Central Asia 12.9 26.0 0.1 .. 21.2 -0.8 -5.2 .. 5.6 -0.3 1.6 ..Russian Federation 14.2 30.7 5.6 .. 22.7 -22.3 -0.7 .. 6.6 -1.7 -0.4 ..Turkey 13.4 30.1 -1.6 .. 29.4 6.8 -22.0 .. 10.3 -2.1 8.5 ..Poland 12.5 17.6 -6.7 .. 32.2 -23.9 25.9 .. 0.9 -0.2 .. ..
Latin America and Caribbean 7.4 21.4 3.4 .. 7.5 -1.0 -6.5 .. -0.8 8.5 -9.7 ..Brazil 9.6 24.6 -1.0 7.4 33.9 -6.6 -8.1 -0.2 -1.1 19.1 -18.3 8.2Mexico 6.7 16.5 5.7 .. 0.1 10.9 -6.5 .. 0.6 4.3 -6.4 ..Argentina 8.6 31.1 -7.4 .. 21.5 33.4 -23.0 .. -6.0 6.0 -5.3 ..
Middle East and North Africa 12.7 16.7 10.0 .. .. .. .. .. .. .. .. ..Saudi Arabia 11.8 23.3 18.4 .. 21.7 -2.2 -30.1 .. 3.5 -16.4 .. ..Iran 13.0 44.4 -2.9 .. .. .. .. .. .. .. .. ..Egypt 12.9 11.3 18.0 .. -1.2 -33.3 -29.3 .. -4.3 .. .. ..
South Asia 17.5 31.4 3.8 -3.3 1.1 -18.6 -20.8 -9.2 1.4 -0.8 1.3 ..India 19.2 32.5 5.3 -4.4 0.4 -24.0 -25.6 -10.0 3.4 -1.7 2.2 ..Pakistan 13.5 16.4 0.6 1.2 6.3 12.4 -7.4 -26.8 -14.6 9.0 -7.3 ..Bangladesh 29.6 -5.7 .. 20.5 8.6 18.7 .. 0.4 .. .. ..
Sub-Saharan Africa 12.6 23.1 3.7 .. .. .. .. .. .. .. .. ..South Africa 10.3 24.2 1.4 .. -4.3 11.5 -4.0 .. 0.4 -5.6 .. ..Nigeria 20.2 24.1 -5.6 .. .. .. .. .. .. .. .. ..
I mport prices b ,c
Dev elopin g cou n tries 3.8 11.7 -2.6 .. -7.7 -8.4 1.2 .. 0.4 0.5 -0.9 ..East Asia and Pacific 4.3 12.2 -2.4 -2.0 -9.7 -6.0 8.4 3.2 0.4 0.3 -0.1 0.0
China 3.2 13.3 -3.5 -1.5 -8.1 -7.3 10.8 2.1 0.3 0.1 -0.1 0.0Indonesia 2.3 11.6 -2.0 -1.9 -9.7 -0.1 1.2 -0.8 -0.1 0.1 -0.5 ..Thailand 2.0 6.0 3.5 -3.7 -12.6 -5.6 12.3 12.6 1.9 0.7 0.5 ..
Europe and Central Asia -0.3 7.4 -7.0 .. 0.8 -19.7 -5.0 .. -0.1 0.5 -4.5 ..Russian Federation 1.9 9.8 -1.6 -1.7 -11.7 2.7 0.9 1.2 -0.4 0.4 0.0 ..Turkey -7.6 3.4 -9.4 -6.4 12.4 -31.3 -20.6 -12.6 0.0 -0.3 -5.1 ..Poland 2.1 9.6 -12.3 -4.4 17.2 -12.8 6.4 -5.5 -1.9 0.5 .. ..
Latin America and Caribbean 1.6 11.2 -3.7 .. -3.7 -9.3 -13.7 .. 1.8 1.7 -0.5 ..Brazil 1.7 20.1 -13.3 -10.0 2.6 -19.6 -32.9 33.6 4.8 4.5 -3.3 9.0Mexico 2.7 7.3 1.0 -0.3 -2.3 -2.4 2.1 0.3 0.7 -0.4 0.2 ..Argentina -5.5 1.6 -10.4 -10.0 2.9 -9.0 -24.2 32.7 -0.6 7.2 1.1 ..
Middle East and North Africa 3.6 8.1 2.6 .. .. .. .. .. .. .. .. ..
Saudi Arabia 2.2 10.4 -1.8 -1.7 -9.7 0.9 0.5 1.0 0.0 0.3 .. ..Iran 2.6 11.2 -1.5 -2.4 -14.7 .. .. .. .. .. .. ..Egypt 2.7 13.9 -1.6 -1.7 -10.1 0.0 -4.1 .. 0.4 .. .. ..
South Asia 7.7 19.2 -0.5 -3.5 -9.3 -7.6 2.1 -4.3 -0.4 -0.5 -1.1 0.4
India 5.6 19.2 -0.4 -3.8 -9.3 -8.7 4.4 -4.4 -0.2 -0.4 -1.3 0.4Pakistan 7.8 23.8 4.7 -1.3 3.0 -9.0 -8.8 7.8 1.7 -0.6 0.7 2.0Bangladesh 13.0 -3.7 -1.7 -12.4 6.6 -1.8 -1.0 -0.3 0.2 .. ..
Sub-Saharan Africa 6.0 11.3 -1.3 .. .. .. .. .. .. .. .. ..
South Africa 2.6 12.2 -0.8 -3.3 -13.2 -3.2 -1.7 -0.5 -0.3 0.1 -0.1 ..Nigeria 1.9 10.0 -1.4 -1.5 -10.8 .. .. .. .. .. .. ..
Table A.6 Developing countries ' merchandise import growth(US dollar values unless otherwise indicated; percent change; seasonally adjusted annual
rates except monthly figures, which are m/m change /a)
/a Merchandise import (C.I.F.), customs basis.
/b Implicit import unit values, U.S. Dollar basis.
/c In many cases countries are very late in reporting trade prices. To estimate more timely
figures individual trade prices were updated using the median (mean) regional trade price
for developing (developed) countries whenever 60% or more of reporters by trade weight 21
February 20, 2014
2013 2013
2010 2011 2012 2013 Q1 Q2 Q3 Q4 Sep Oct Nov Dec
World -70.3 -143.4 -193.7 .. -133.8 -41.8 -66.8 .. -75.9 54.5 467.7 ..
High - in come cou n tries a -11.8 35.5 44.2 .. 108.3 240.6 164.3 .. 82.0 144.3 408.8 ..Industrial countries -419.3 -576.7 -578.5 .. -435.2 -353.9 -468.3 .. -526.3 -493.8 -289.1 ..
United States -690.9 -786.9 -791.9 .. -751.6 -743.2 -768.9 .. -804.6 -792.0 -674.5 ..Japan 75.3 -32.6 -87.0 .. -109.0 -91.4 -123.0 .. -145.3 -148.1 -118.6 ..Euro Area 34.6 27.8 145.2 .. 220.2 256.5 228.6 .. 227.3 243.7 258.7 ..United Kingdom -154.0 -161.8 -175.3 .. -169.3 .. .. .. .. .. .. ..
Other high income -419.3 -576.7 -578.5 .. -435.2 -353.9 -468.3 .. 82.0 144.3 408.8 ..Hong Kong (China) -43.1 -54.3 -61.5 .. -59.6 -67.8 -64.3 .. -63.8 -69.3 -65.9 ..Singapore 40.64 43.80 28.97 36.98 29.82 46.77 31.42 39.93 29.70 36.04 49.66 34.07Taiwan (China) 22.5 25.9 30.5 34.0 19.3 40.2 41.1 35.5 35.1 38.1 44.2 24.1
Dev elopin g cou n tries -59.0 -180.2 -239.9 .. -249.2 -292.5 -239.2 .. -163.2 -94.0 54.8 ..East Asia and Pacific 240.5 189.9 221.5 258.0 294.3 242.9 182.2 312.6 176.9 285.3 357.0 295.5
China 182.4 147.6 218.4 266.1 326.2 271.2 185.6 281.5 176.3 261.9 312.1 270.4Indonesia 22.1 26.0 -1.6 .. -5.6 -8.1 -9.9 .. -13.7 3.9 4.4 ..Thailand 10.3 -6.6 -20.8 .. -37.2 -28.4 -13.4 .. -15.3 -23.3 -15.9 ..Malaysia 34.3 40.5 31.0 .. 15.0 15.3 25.6 .. 33.5 27.2 32.9 ..
Europe and Central Asia -140.0 -178.8 -173.4 .. -185.4 -193.7 -172.8 .. -163.2 -178.1 -164.1 ..Russian Federation 149.2 196.5 192.7 .. 159.1 167.2 199.1 .. 198.3 176.1 208.9 ..Turkey -71.5 -106.0 -84.3 .. -98.8 -107.9 -90.2 .. -85.4 -98.3 -92.1 ..Poland -18.4 -20.6 -13.9 .. -7.5 2.6 -1.2 .. -2.2 -6.2 .. ..Czech Republic 6.6 10.7 15.5 .. 15.4 18.5 19.4 .. 19.5 20.6 21.4 ..
Latin America and Caribbean -49.3 -47.2 -58.4 .. -110.4 -90.2 -67.3 .. -29.3 -77.6 -15.8 ..Brazil 19.8 29.4 19.8 2.2 -7.7 1.5 0.0 15.1 21.8 -5.1 35.4 14.9Mexico -3.0 -1.5 0.0 .. -10.9 -10.7 5.5 .. 15.6 8.8 9.1 ..Argentina 11.5 9.7 12.6 .. 8.3 7.0 9.2 .. 10.2 10.0 14.3 ..Colombia -0.7 2.8 1.0 .. -2.6 0.1 0.3 .. 2.2 -2.8 1.7 ..
Middle East and North Africa 20.9 25.5 -5.4 .. .. .. .. .. .. .. .. ..Saudi Arabia 128.9 203.0 215.1 .. .. .. .. .. .. .. .. ..Iran 39.3 41.3 16.4 .. .. .. .. .. .. .. .. ..Egypt -26.4 -28.4 -40.0 .. -34.9 -31.2 -26.9 .. -21.9 .. .. ..Algeria 16.1 26.3 5.7 .. .. .. .. .. .. .. .. ..
South Asia -161.2 -208.9 -238.9 -198.5 -246.5 -236.2 -163.2 -148.0 -133.8 -134.3 -148.4 -161.4India -124.0 -162.3 -192.6 -154.5 -202.3 -189.2 -120.1 -106.5 -91.8 -92.5 -105.0 -122.0Pakistan -16.6 -18.8 -19.7 -19.5 -21.1 -22.0 -18.2 -16.7 -16.3 -17.8 -18.9 -13.3Bangladesh -11.5 -13.1 -12.0 .. -9.7 -10.2 -10.5 .. -11.2 -9.4 .. ..
Sub-Saharan Africa 30.7 40.4 14.9 .. .. .. .. .. .. .. .. ..South Africa -0.6 -3.4 -14.0 .. -13.6 -17.4 -19.4 .. -23.6 -16.4 -12.8 ..Nigeria 30.3 47.3 50.5 .. .. .. .. .. .. .. .. ..
Memo:OECD -470.9 -664.0 -650.9 .. -536.3 -459.8 -535.2 .. -576.4 -560.5 -356.9 ..Developing excl. China -241.6 -327.7 -458.9 .. -568.5 -549.7 -383.7 .. -288.5 -323.3 -225.8 ..Developing oil exporters 183.3 238.3 174.2 .. 129.0 130.8 185.4 .. 214.9 .. .. ..Developing non-oil exporters -243.0 -419.6 -415.1 -365.0 -377.5 -414.3 -406.5 -261.6 -355.9 -297.9 -181.3 -305.5
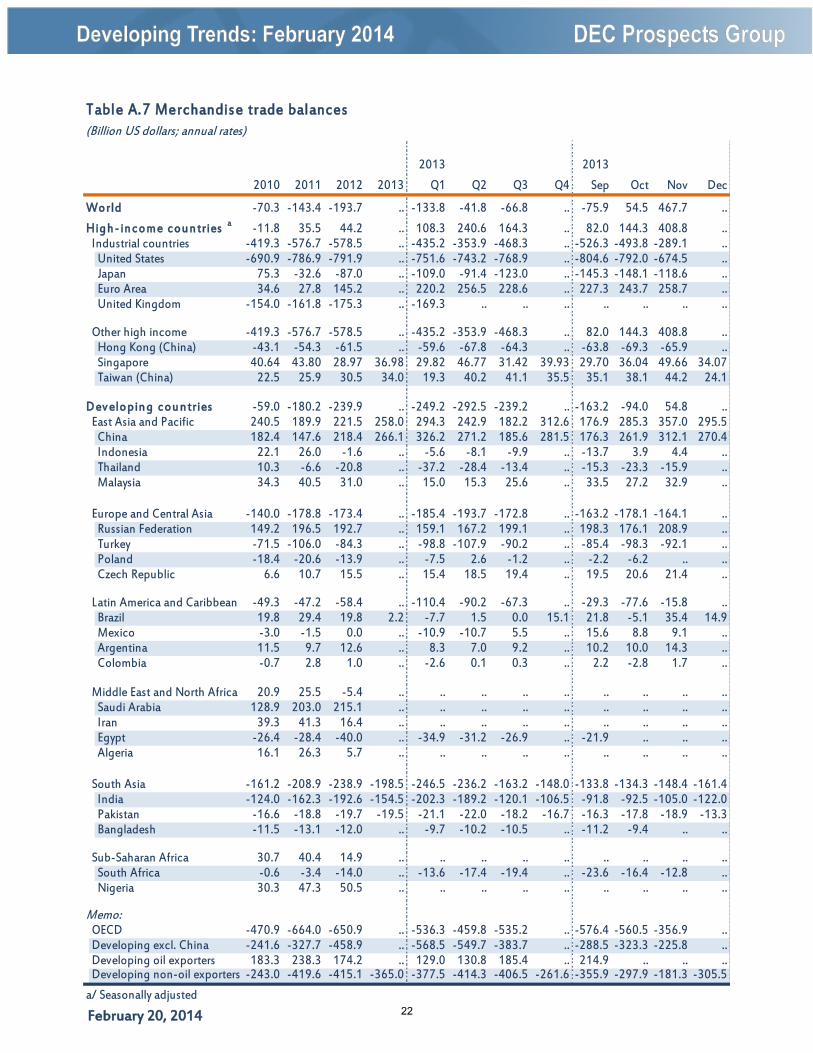
Table A.7 Merchandise trade balances(Billion US dollars; annual rates)
a/ Seasonally adjusted22
February 20, 2014
2013 2013
2010 2011 2012 2013 Q1 Q2 Q3 Q4 Sep Oct Nov Dec
World .. .. .. .. .. .. .. .. .. .. .. ..
High - in come cou n tries .. .. .. .. .. .. .. .. .. .. .. ..
Industrial countries 9.2 5.7 -1.4 -3.1 -0.9 -3.4 -4.2 -3.8 1.6 1.6 -0.5 -0.5
United States (SDR/USD) 0.0 0.0 0.0 0.0 0.0 0.0 0.0 0.0 0.0 0.0 0.0 0.0
Japan 6.7 10.1 -0.1 -18.2 -14.0 -18.8 -20.5 -19.1 -1.5 1.5 -2.4 -3.2
Euro Area -4.7 5.0 -7.6 3.3 .. .. .. .. 0.3 2.2 -1.1 1.6
United Kingdom -0.9 3.8 -1.1 -1.4 -1.3 -2.9 -1.9 0.8 2.3 1.5 0.1 1.7
Other high income .. .. .. .. .. .. .. .. .. .. .. ..
Hong Kong (China) -0.2 -0.2 0.4 0.0 0.1 0.0 0.0 0.0 0.0 0.0 0.0 0.0
Singapore 6.7 8.4 0.6 -0.1 2.1 1.2 -1.7 -2.2 0.7 1.6 -0.4 -0.9
Taiwan (China) 4.9 7.2 -0.6 -0.3 0.7 -0.7 0.0 -1.4 1.0 0.9 -0.4 -0.7
Dev elopin g cou n tries .. .. .. .. .. .. .. .. .. .. .. ..
East Asia and Pacific 7.8 0.1 -4.6 -7.5 -4.3 -3.7 -8.0 -13.1 -5.0 -0.1 -1.6 -2.9
China 0.9 4.7 2.5 2.6 1.4 2.9 3.7 2.5 0.0 0.3 0.2 0.3
Indonesia 14.3 3.6 -6.4 -10.4 -6.4 -5.2 -10.8 -17.7 -7.0 -0.2 -2.3 -3.9
Thailand 8.2 4.1 -1.9 1.1 4.0 4.7 -0.4 -3.4 -0.3 1.6 -1.4 -2.3
Malaysia 9.4 5.3 -0.9 -2.0 -0.7 1.4 -3.7 -4.8 0.8 2.4 -0.7 -1.6
Europe and Central Asia -5.7 -32.8 -32.4 -6.0 -4.6 -5.6 -6.0 -7.5 -1.3 -1.1 -1.3 -1.3
Russian Federation 4.6 3.3 -5.3 -2.5 -0.9 -1.9 -2.6 -4.6 1.4 1.6 -2.1 -0.3
Turkey 3.2 -10.3 -6.7 -5.5 0.6 -1.9 -8.5 -11.4 -2.7 1.7 -2.0 -2.0
Poland 3.4 1.8 -8.9 3.0 2.5 3.2 3.1 3.1 0.1 3.4 -1.3 2.1
Czech Republic -0.2 8.0 -9.6 0.0 -1.2 -0.4 2.7 -1.1 0.4 2.7 -5.8 -0.5
Latin America and Caribbean .. .. .. .. .. .. .. .. .. .. .. ..
Brazil 13.6 5.1 -14.3 -9.5 -11.4 -5.3 -11.3 -9.7 3.2 3.7 -4.8 -2.1
Mexico 6.9 1.6 -5.5 3.0 2.7 8.3 1.9 -0.7 -1.2 0.5 -0.6 0.5
Argentina -4.7 -5.2 -9.3 -16.9 -13.4 -15.1 -17.5 -20.9 -2.7 -1.9 -2.8 -5.1
Colombia 13.6 2.8 2.8 -3.9 0.4 -4.2 -5.7 -5.7 -0.7 1.8 -2.0 -0.5
Middle East and North Africa .. .. .. .. .. .. .. .. .. .. .. ..
Saudi Arabia 0.0 0.0 0.0 0.0 0.0 0.0 0.0 0.0 0.0 0.0 0.0 0.0
Iran -4.1 3.8 -11.6 -33.9 -2.7 0.0 -49.5 -50.6 0.1 -0.4 0.0 0.3
Egypt -1.4 -5.2 -2.1 -11.7 -9.8 -13.0 -12.7 -11.2 1.2 0.2 0.0 -0.2
Algeria -1.8 1.1 -5.9 -2.5 -4.6 -4.4 0.1 -1.2 -1.5 0.5 1.3 2.2
South Asia 3.8 -2.0 -11.8 -7.5 -6.4 -2.9 -9.4 -10.7 -1.4 2.6 -1.4 1.0
India 5.9 -2.0 -12.6 -8.8 -7.2 -3.3 -11.3 -12.6 -1.4 3.5 -1.6 1.2
Pakistan -4.1 -1.3 -7.5 -8.0 -7.5 -6.5 -8.1 -10.0 -2.2 -1.0 -1.2 0.7
Bangladesh -0.8 -6.0 -9.5 4.8 4.7 5.1 5.1 4.4 0.0 0.1 0.0 0.0
Sri Lanka 1.7 2.2 -13.4 -1.1 -6.1 2.6 0.2 -1.4 -0.3 1.1 -0.1 0.3
Sub-Saharan Africa -6.8 -7.5 -2.5 -1.3 -0.4 0.6 -0.1 0.1
South Africa 15.1 0.8 -11.6 -14.9 -13.4 -14.4 -17.3 -14.5 0.9 0.7 -3.0 -1.5
Nigeria -0.9 -3.1 -1.8 -0.3 1.0 0.4 -1.3 -1.2 -0.6 1.3 0.7 -0.2
Memo:
OECD 9.0 5.6 -1.5 -2.9 -0.6 -3.0 -4.1 -3.9 1.5 1.6 -0.7 -0.6
Developing excl. China .. .. .. .. .. .. .. .. .. .. .. ..
Developing oil exporters .. .. .. .. .. .. .. .. .. .. .. ..
Developing non-oil exporters .. .. .. .. .. .. .. .. .. .. .. ..
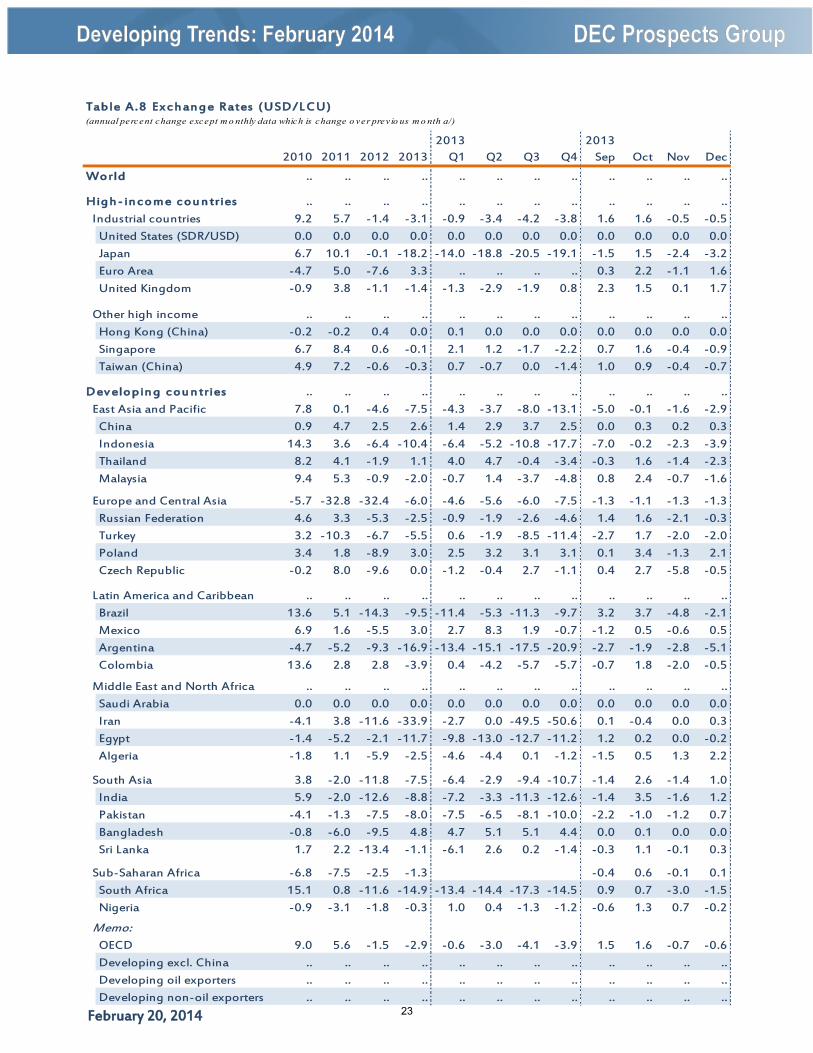
Table A.8 Ex ch an ge Rates (USD/L CU)(annual percent change except m o nthly data which is change o ver prev io us m o nth a/)
23
February 20, 2014
Average 2013 20132000-10 2011 2012 2013 Q1 Q2 Q3 Q4 Sep Oct Nov Dec
World 2.7 4.3 3.3 3.2 3.5 2.8 2.8 2.3 2.5 2.1 1.9 1.6
High - in come cou n tries 2.1 2.8 2.0 1.5 1.8 1.5 1.4 1.1 1.2 1.1 1.2 1.3Industrial countries 1.9 2.6 1.8 1.3 1.6 1.3 1.3 1.1 1.1 1.0 1.2 1.2
United States 2.5 3.2 2.1 1.5 1.7 1.4 1.6 1.2 1.2 1.0 1.2 1.5Japan -0.3 -0.3 0.0 0.3 -0.6 -0.3 0.9 1.3 1.0 1.1 1.6 ..Euro Area 2.0 2.6 2.3 1.3 1.7 1.4 1.3 0.8 1.0 0.7 0.8 0.8United Kindgom 2.0 4.5 2.8 2.6 2.7 2.7 2.7 2.1 2.7 2.1 2.1 2.0
Other high income 2.6 1.8 1.3 1.6 1.3 1.3 1.1 1.1 1.0 1.2 1.2Hong Kong (China) 0.1 5.3 4.1 4.3 3.7 4.0 5.4 4.3 4.6 4.3 4.3 4.2Singapore 1.6 5.2 4.6 2.4 4.0 1.6 1.8 2.0 1.6 2.0 2.6 1.5Taiwan (China) 1.0 1.4 1.9 0.8 1.8 0.8 0.1 0.6 0.9 0.7 0.7 0.3
Dev elopin g cou n tries 3.8 6.7 5.3 .. 4.9 4.8 4.6 3.7 4.6 4.2 3.4 3.7East Asia and Pacific 2.3 5.4 2.8 .. 3.2 2.4 2.8 3.4 3.2 3.2 3.4 3.2
China 2.0 5.4 2.6 2.6 2.4 2.4 2.8 2.9 3.0 3.2 3.0 2.5Indonesia 8.1 5.4 4.3 7.0 5.3 5.6 8.6 8.4 8.4 8.3 8.4 8.4Thailand 2.5 3.8 3.0 2.2 3.1 2.4 1.7 1.7 1.4 1.4 1.9 1.6Malaysia 2.1 3.2 1.7 2.1 1.5 1.8 2.2 3.0 2.6 2.8 2.9 3.2
Europe and Central Asia 7.7 8.9 6.6 3.5 4.5 3.1 2.3 1.8 1.8 1.1 1.4Russian Federation 13.3 8.4 5.1 6.8 7.2 7.2 6.3 6.4 6.1 6.2 6.5 6.4Turkey 6.5 8.9 7.5 7.2 7.0 8.3 7.5 7.9 7.7 7.3 7.3Poland 3.5 4.2 3.7 1.2 1.6 0.8 1.4 0.9 1.4 1.1 0.8 0.8Czech Republic 2.7 1.9 3.3 1.4 1.7 1.5 1.2 1.1 1.0 0.9 1.1 1.4
Latin America and Caribbean 6.6 7.5 6.8 .. 4.7 4.8 5.3 3.9 4.6 4.2 4.0 3.8Brazil 6.7 6.6 5.4 6.2 6.3 6.6 6.1 5.8 5.9 5.8 5.8 5.9Mexico 5.1 3.4 4.1 3.8 3.7 4.5 3.4 3.6 3.4 3.4 3.6 4.0Argentina 8.8 9.8 10.0 10.6 10.8 10.4 10.5 10.7 10.5 10.5 10.5 10.9Colombia 5.9 3.4 3.2 2.0 1.9 2.1 2.3 1.8 2.3 1.8 1.7 1.9
Middle East and North Africa 7.4 11.3 15.7 .. 7.3 7.2 5.7 4.7 5.7 5.8 2.7 4.6Saudi Arabia 2.4 5.8 2.9 3.4 3.9 3.7 3.4 2.8 3.2 3.0 3.0 ..Iran 14.8 20.6 27.4 37.8 41.0 42.4 43.3 37.2 43.7 42.6 .. ..Algeria 3.3 4.5 8.9 3.2 5.8 3.6 3.0 -0.1 2.2 -0.7 .. ..
South Asia 9.8 9.5 .. 9.0 8.2 7.5 8.4 7.3 8.1 9.0 8.2India 9.6 9.7 10.1 10.7 9.5 9.7 10.4 9.8 10.2 11.2 9.9Pakistan 11.9 9.7 7.7 7.3 5.6 8.1 9.7 7.4 9.1 10.9 9.2Bangladesh 6.0 10.3 6.5 7.5 7.3 8.2 7.5 7.2 7.1 7.1 7.1 7.3Sri Lanka 10.6 6.7 7.5 6.9 9.0 6.8 6.2 5.7 6.2 6.8 5.6 4.7
Sub-Saharan Africa 7.9 8.6 9.8 .. 4.1 3.7 4.2 3.7 3.6 3.6 2.3 -0.1South Africa 6.0 5.0 5.7 5.5 5.7 5.7 6.3 5.1 6.0 5.5 5.3 ..Nigeria 12.4 10.8 12.2 7.6 8.9 8.8 8.3 6.6 7.9 7.7 .. ..
Memo: 2.1OECD 7.1 2.7 2.1 .. 1.6 1.5 1.4 1.2 1.2 1.1 1.2 1.3Developing excl. China 7.4 8.1 8.4 .. 4.9 4.9 4.7 3.7 4.8 4.2 3.4 3.7Developing oil exporters 3.2 9.2 10.2 .. 6.3 6.1 5.7 4.8 5.4 5.9 3.5 3.2Developing non-oil exporters #DIV/0! 6.2 4.3 .. 4.6 4.4 4.5 3.7 4.4 4.2 3.4 3.7
Table A.9 Global Inflation(annual percent change; seasonally adjusted a/)
a/ The CPI aggregates are the medians of the growth rates. 24
February 20, 2014
2013 20132010 2011 2012 2013 Q1 Q2 Q3 Q4 Sep Oct Nov Dec
WorldHigh - in come cou n tries b -1.45 -1.45 -1.45 -1.45 .. .. .. .. .. .. .. ..
Industrial countries -1.44 -1.44 -1.44 -1.44 .. .. .. ..United States (US Federal funds rate) 0.18 0.10 0.14 0.11 0.14 0.12 0.09 0.09 0.08 0.09 0.08 0.09Japan (Discount Rate) 0.30 0.30 0.30 0.30 0.30 0.30 0.30 0.30 0.30 0.30 0.30 0.30Euro Area (Eurosys main refi rate-minimum bid) 1.00 1.25 0.88 0.54 0.75 0.58 0.50 0.33 0.50 0.50 0.25 0.25United Kingdom (Clearing bank's base rate) 0.50 0.50 0.50 0.50 7.50 8.50 9.50 10.50 0.50 0.50 0.50 0.50
Other high income .. .. .. .. .. .. .. .. .. .. .. ..Hong Kong (Discount rate) 3.13 3.13 3.13 3.13 0.50 0.50 0.50 0.50 0.50 0.50 0.50 0.50Singapore (MAS Interbank 1 month rate) 1.15 1.15 1.15 1.15 0.44 0.44 0.44 0.44 0.33 0.36 0.36 0.37Taiwan (Interbank swap overnight rate) 1.93 1.93 1.93 1.93 0.11 0.11 0.11 0.11 0.39 0.39 0.39 0.39
Dev elopin g cou n triesEast Asia and Pacific .. .. .. .. .. .. .. .. .. .. .. ..
China (Lending rate, 6m to 1y) 7.18 7.18 7.18 7.18 6.00 6.00 6.00 6.00 6.00 6.00 6.00 6.00Indonesia (Interbank 3m rate) 9.18 9.18 9.18 9.18 4.93 4.98 6.32 7.45 6.98 7.20 7.44 7.71Thailand (Repurchase Rate) 1.50 3.00 2.94 2.56 2.75 2.63 2.50 2.38 .. 2.50 2.25 ..Malaysia (Interbank overnight rate) 4.48 5.48 6.48 7.48 2.97 2.97 2.97 2.97 2.97 2.97 2.97 2.97
Europe and Central Asia .. .. .. .. .. .. .. ..Russian Federation (Discount (Refin.)) 10.87 10.87 10.87 10.87 8.25 8.25 8.25 8.25 8.25 8.25 8.25 8.25Turkey (Interbank 1 week average) 17.05 17.05 17.05 17.05 5.47 5.57 7.21 7.37 7.42 6.92 7.36 7.82Poland (Interbank 2 week) 5.88 5.88 5.88 5.88 3.75 2.95 2.38 2.46 2.36 2.47 2.46 2.46Czech Republic (Repo rate 2 weeks) 3.49 3.49 3.49 3.49 0.05 0.05 0.05 0.05 0.05 0.05 0.05 0.05
Latin America and Caribbean .. .. .. .. .. .. .. ..Brazil (SELIC Target rate) 12.45 12.45 12.45 12.45 7.25 7.63 8.62 9.63 9.00 9.35 9.55 10.00Mexico (CETES 91 day closing) 7.88 7.88 7.88 7.88 4.17 3.81 3.82 3.45 3.68 3.47 3.47 3.41Argentina (30 Day deposit) 11.43 11.43 11.43 11.43 13.29 14.44 15.71 16.87 16.11 16.49 16.35 17.78Colombia (Fixed Term Deposit) 9.68 9.68 9.68 9.68 4.90 4.09 4.02 4.04 4.07 4.03 4.04 4.04
Middle East and North Africa .. .. .. .. .. .. .. ..Saudi Arabia (Interbank 3m rate) 2.89 2.89 2.89 2.89 0.98 0.96 0.96 0.96 0.95 0.96 0.96 ..Egypt (IMF discount rate) 10.17 10.17 10.17 10.17 10.25 10.25 9.25 8.75 9.25 8.75 8.75 8.75Algeria (IMF discount rate) 4.00 4.00 4.00 4.00 .. .. .. .. .. .. .. ..
South Asia .. .. .. .. .. .. .. ..India (Bank deposit 365+ days) 7.90 7.90 7.90 7.90 9.00 9.00 .. .. .. .. .. ..Pakistan (Repo 7-15 day) 10.63 10.63 10.63 10.63 .. .. .. .. .. .. .. ..Bangladesh (Bank Rate) 5.00 5.00 5.00 5.00 5.00 5.00 5.00 5.00 5.00 5.00 5.00 ..Sri Lanka (Central bank repurchase) 10.50 10.50 10.50 10.50 7.50 7.22 7.00 6.57 7.00 6.72 6.50 6.50
Sub-Saharan Africa .. .. .. .. .. .. .. ..South Africa (Repo rate) 11.61 11.61 11.61 11.61 5.00 5.00 5.00 5.00 5.00 5.00 5.00 5.00Nigeria (IMF discount rate) 9.85 9.85 9.85 9.85 .. .. .. .. .. .. .. ..
Table A.10 Global Central Bank Interest Rates(percentage a/)
a/ Monthly figures are simple averages of the daily figures; except for the latest month, the figure reported for
the latest month is the value on the date the data has been reported (which is the last daily observation one day
before the note becomes available).25
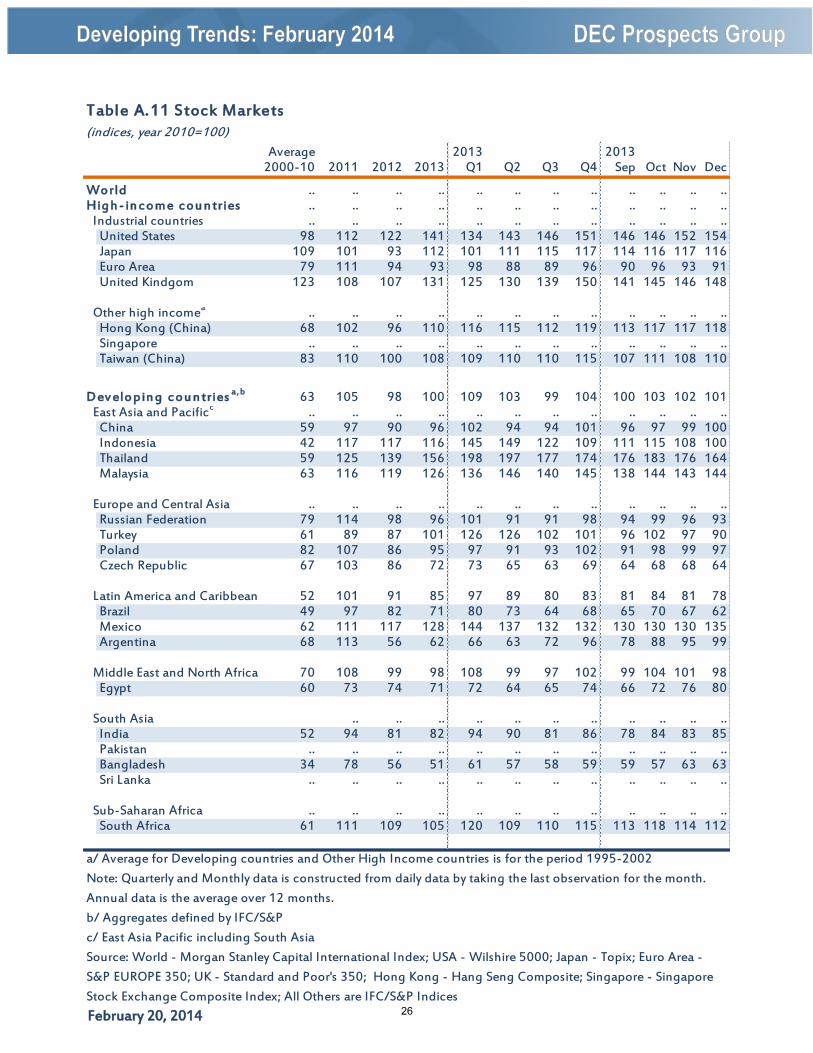
February 20, 2014
Average 2013 20132000-10 2011 2012 2013 Q1 Q2 Q3 Q4 Sep Oct Nov Dec
World .. .. .. .. .. .. .. .. .. .. .. ..High - in come cou n tries .. .. .. .. .. .. .. .. .. .. .. ..
Industrial countries .. .. .. .. .. .. .. .. .. .. .. ..United States 98 112 122 141 134 143 146 151 146 146 152 154Japan 109 101 93 112 101 111 115 117 114 116 117 116Euro Area 79 111 94 93 98 88 89 96 90 96 93 91United Kindgom 123 108 107 131 125 130 139 150 141 145 146 148
Other high incomea .. .. .. .. .. .. .. .. .. .. .. ..Hong Kong (China) 68 102 96 110 116 115 112 119 113 117 117 118Singapore .. .. .. .. .. .. .. .. .. .. .. ..Taiwan (China) 83 110 100 108 109 110 110 115 107 111 108 110
Dev elopin g cou n tries a,b 63 105 98 100 109 103 99 104 100 103 102 101East Asia and Pacificc .. .. .. .. .. .. .. .. .. .. .. ..
China 59 97 90 96 102 94 94 101 96 97 99 100Indonesia 42 117 117 116 145 149 122 109 111 115 108 100Thailand 59 125 139 156 198 197 177 174 176 183 176 164Malaysia 63 116 119 126 136 146 140 145 138 144 143 144
Europe and Central Asia .. .. .. .. .. .. .. .. .. .. .. ..Russian Federation 79 114 98 96 101 91 91 98 94 99 96 93Turkey 61 89 87 101 126 126 102 101 96 102 97 90Poland 82 107 86 95 97 91 93 102 91 98 99 97Czech Republic 67 103 86 72 73 65 63 69 64 68 68 64
Latin America and Caribbean 52 101 91 85 97 89 80 83 81 84 81 78Brazil 49 97 82 71 80 73 64 68 65 70 67 62Mexico 62 111 117 128 144 137 132 132 130 130 130 135Argentina 68 113 56 62 66 63 72 96 78 88 95 99
Middle East and North Africa 70 108 99 98 108 99 97 102 99 104 101 98Egypt 60 73 74 71 72 64 65 74 66 72 76 80
South Asia .. .. .. .. .. .. .. .. .. .. ..India 52 94 81 82 94 90 81 86 78 84 83 85Pakistan .. .. .. .. .. .. .. .. .. .. .. ..Bangladesh 34 78 56 51 61 57 58 59 59 57 63 63Sri Lanka .. .. .. .. .. .. .. .. .. .. .. ..
Sub-Saharan Africa .. .. .. .. .. .. .. .. .. .. .. ..South Africa 61 111 109 105 120 109 110 115 113 118 114 112
Table A.11 Stock Markets(indices, year 2010=100)
a/ Average for Developing countries and Other High Income countries is for the period 1995-2002
Note: Quarterly and Monthly data is constructed from daily data by taking the last observation for the month.
Annual data is the average over 12 months.
b/ Aggregates defined by IFC/S&P
c/ East Asia Pacific including South Asia
Source: World - Morgan Stanley Capital International Index; USA - Wilshire 5000; Japan - Topix; Euro Area -
S&P EUROPE 350; UK - Standard and Poor's 350; Hong Kong - Hang Seng Composite; Singapore - Singapore
Stock Exchange Composite Index; All Others are IFC/S&P Indices26