industrial production, ch% 3m/3m, saar global economic...
TRANSCRIPT

Global Economic Prospects January 2012 East Asia & the Pacific Annex
Overview
Economies in the East Asia and Pacific region
are being affected in varying ways by the
current, difficult economic times.1 After
expanding 9.7 percent in 2010 on the back of
strong performance in China, GDP in developing
East Asia is estimated to have slowed to an 8.2
percent pace in 2011, and is projected to ease
further to 7.8 percent in 2012 and 2013 (table
EAP.1). The middle income countries of the
region are generally well positioned to withstand
the global slowdown underway (see main text),
with substantial fiscal space available, a degree
of downside flexibility in policy interest rates,
significant reserve levels, and a still-strong
underpinning for domestic demand.
Still, a more serious deterioration of conditions
in high-income economies and an attendant
sharp decline in global trade could have serious
implications for these countries, which as a
group are exceptionally open to world trade.
Vietnam, and the region’s low-income to lower-
middle income economies (Cambodia and Lao
PDR), as well as the small island economies are
less well positioned than the major countries of
the region, with limited space for policy change
and less reserves to stem financial disturbances.
The anticipated modest slowing of overall
growth in the base-case projections is due to an
easing in China, offset in part by what may be
sufficient vigor in ASEAN-4 domestic demand.
The larger driver for the slowdown is found in
faltering OECD demand, affecting exports both
from China and from those middle income
countries joined in tight manufacturing
production chains with the former economy and
with others. A more serious downturn in the high
-income countries could certainly exact a larger
toll on growth— and would likely be amplified
by changes in commodity prices, potential
narrowing of international sources of finance
and, importantly for East Asia, a ―second round‖
of adverse trade effects, given a ―first round‖
slowing of worldwide demand.
Declines in commodity prices alongside a global
downturn could exact a toll on East Asia’s large
exporters of agricultural products, fats and oils,
and hydrocarbons, reducing fiscal revenues and
pressuring deficits. At the same time, the diverse
nature of the region means that falling
commodity prices will help numerous countries,
foremost including China, with lower oil prices
also benefitting countries such as Indonesia,
where budgets are still burdened by fuel
subsidies. Remittance receipts are potent drivers
for growth in countries from the Philippines to
the small island economies—and these flows, as
well as tourist arrivals (important for the region
broadly) could slow because of sluggish labor
market and growth developments in the OECD,
although migrant remittances held up quite well
during the 2008-2009 crisis.
GDP growth in China, the region’s largest
economy (about 80 percent of regional GDP),
eased from 10.4 percent in 2010 to and estimated
9.1 percent in 2011, and is expected to dip
further to a (still robust) 8.4 percent in 2012 as
authorities continue to dampen quite rapid
growth in a number of sectors of the economy.
East Asia and the Pacific Region
Figure EAP.1 Industrial production showing rebound
post-Tohoku; Thailand suffers from flooding
Source: World Bank.
-35
-30
-25
-20
-15
-10
-5
0
5
10
15
20
25
30
35
2010M01 2010M05 2010M09 2011M01 2011M05 2011M09
China Indonesia Malaysia Philippines Thailand
industrial production, ch% 3m/3m, saar
1

Global Economic Prospects January 2012 East Asia & the Pacific Annex
Output is projected to ease in 2013 to 8.3
percent, in-line with the country’s longer-term
potential growth rate. GDP growth in the rest of
the region slowed sharply in 2011 from 6.9
percent to a 4.8 percent pace, but is expected to
strengthen gradually over 2012 and 2013,
coming in at 5.8 percent in the final year.
Recent developments
GDP data for developing East Asia available for
the first three quarters of 2011 (table EAP.2)
together with high-frequency indicators, point to
slowing from the region’s strong growth of
2010. Natural disasters and more recently the
financial market turmoil in Europe have started
to exact a moderate toll on regional economic
activity in the middle income countries. The
disruption to international supply chains from
the Tohoku earthquake and tsunami in Japan of
March 2011 caused industrial production growth
in the region to slip from 18 percent before the
crisis to 6 percent in the three months ending in
June (saar). Output then picked up, reaching 7.7
percent growth by November 2011. Indeed,
China’s production growth fell from a peak of 22
percent in the first quarter (saar) to 11 percent by
November (figure EAP.1, earlier). In contrast,
first quarter production in Malaysia increased by
6.5 percent; and in the Philippines by 8.8
percent, giving way to double digit declines as
of August, before undergoing moderate
rebounds. More recently the severe flooding in
Thailand has dampened industrial output
severely in the short run (72% contraction in
output in the three months to November 2011)
until repairs to infrastructure and utilities
intensify through the course of 2012—a factor
likely to boost growth for the country (box
EAP.1).
Table EAP.2 Quarterly GDP over the first 3 quarters of 2011*, estimates for the year
Source: Haver Analytics, Thomson/Reuters Datastream, China National Bureau of Statistics, World Bank.
Note: * Data at seasonally adjusted annualized rates.
East Asia China Indonesia Malaysia Philippines Thailand
2010 9.7 10.4 6.1 7.2 7.6 7.8
Q4 9.8 10.0 6.1 9.2 1.9 5.3
2011
Q1 7.5 8.2 6.5 7.3 7.8 7.5
Q2 7.3 10.0 6.2 2.5 -1.9 0.2
Q3 7.0 9.5 6.2 4.4 5.0 2.1
2011 (est) 8.2 9.1 6.3 4.4 3.7 2.0
Table EAP.1 East Asia and the Pacific forecast summary
Source: World Bank.
Est.
98-07a
2008 2009 2010 2011 2012 2013
GDP at market prices (2005 US$) b
7.9 8.5 7.5 9.7 8.2 7.8 7.8
GDP per capita (units in US$) 7.0 7.6 6.6 8.8 7.4 7.0 6.9
PPP GDP c
7.8 8.4 7.5 9.6 8.2 7.8 7.8
Private consumption 5.9 7.4 7.3 7.7 7.6 7.8 7.7
Public consumption 7.9 8.6 7.3 6.6 7.6 7.0 6.4
Fixed investment 9.2 9.1 19.0 6.6 11.0 8.9 8.8
Exports, GNFS d
13.7 7.1 -9.2 22.6 10.3 8.5 11.2
Imports, GNFS d
12.1 4.7 -1.9 20.8 13.0 10.2 11.2
Net exports, contribution to growth 1.4 1.6 -3.6 1.9 -0.2 -0.1 0.6
Current account bal/GDP (%) 4.1 7.5 5.8 4.7 3.1 2.6 2.3
GDP deflator (median, LCU) 5.0 7.8 4.4 3.6 5.0 5.2 4.6
Fiscal balance/GDP (%) -2.1 -0.5 -2.9 -1.9 -1.9 -2.3 -2.1
Memo items: GDP
East Asia excluding China 4.5 4.8 1.5 6.9 5.2 5.5 5.6
China 9.1 9.6 9.2 10.4 9.1 8.4 8.3
Indonesia 4.1 6.0 4.6 6.1 6.4 6.2 6.5
Thailand 4.5 2.5 -2.3 7.8 2.0 4.2 4.9
(annual percent change unless indicated otherwise)
a. Growth rates over intervals are compound average; growth contributions, ratios and the GDP deflator
are averages.
b. GDP measured in constant 2005 U.S. dollars.
c. GDP measured at PPP exchange rates.
d. Exports and imports of goods and non-factor services (GNFS).
e. Estimate.
f. Forecast.
Forecast
2

Global Economic Prospects January 2012 East Asia & the Pacific Annex
Quarterly GDP data for the region confirm a
slowing in annualized growth from 9.8 percent
for the final quarter of 2010 to an average of
about 7.2 percent for the first three quarters of
2011 (saar). Third quarter numbers for major
economies, excluding China and Indonesia,
show some pickup from the second quarter, but
with the exception of the Philippines the rebound
was generally modest. Growth was driven across
most countries by a surge in government outlays
offset by inventory draw-downs (given the
stalling out of industrial production) (figure
EAP.2).
From a trough following Tohoku in April 2011,
Chinese and middle-income regional exports
rebounded sharply (figure EAP.3). But export
volumes slowed dramatically beginning in
August and fell at a 10.5 percent annualized pace
during the 3 months ending November, likely
reflecting knock-on effects from the financial
turmoil in Europe. Most of the decline was due
initially to weaker Chinese exports, while
shipments from the rest of the region continued
to expand sluggishly until falling 16 percent in
the 3 months to November. Though press reports
of the time suggested significant disruption to
supply chains in specific sectors from flooding
in Thailand, such impacts are just becoming
apparent at the aggregate level. Over the course
Box EAP.1 Floods in Thailand—what consequences for growth?
Thailand is no stranger to natural disasters. However, the floods which inundated 66 of the country’s 77 provinces
from July through November 2011 were the worst in 50 years. Losses have mounted in part as the structural
makeup of the Thai economy has shifted in the last decades to one of manufacturing intensity, and damages are
well beyond what would have occurred in an earlier era.
In 2011, accumulated water from months of storms and high precipitation resulted in a severe flooding of the cen-
tral regions, with water drifting southward toward Bangkok, affecting some 5 million people in this region alone.
At the time of this writing, more than 680 lives have been lost, and the accumulated affected population is esti-
mated at 13.6 million (a large 21% of total population). Social safety nets were rapidly put in place or upgraded,
and new loans for firms and agricultural cooperatives have been proposed to invest in recovery operations. Total
damages and losses have been estimated at $46.5 billion, with the manufacturing sector carrying some 70 percent
of the damages and losses; overall the private sector has borne up to 90 percent of damages and losses.
Official Thai sources have estimated that reconstruction will be realized over three years, from 2011 through 2013,
and that the cost to Thai GDP of the flooding will be a fairly moderate loss of growth in 2011 of 1.1 percentage
points, and additions to growth of 0.2 and 0.9 percent respectively over 2012 and 2013 as reconstruction moves
toward completion.
Source: World Bank, East Asia and the Pacific region.
Figure EAP.2 Recent weakness in ASEAN sets moderate
downtrend for GDP growth
Source: Haver Analytics, China NBS, World Bank.
-4
-2
0
2
4
6
8
10
12
East Asia China Indonesia Malaysia Philippines Thailand
2010Q4 2011Q1 2011Q2 2011Q3
growth of real GDP, ch% q/q, saar
Figure EAP.3 Export volumes hit by Tohoku and
sluggish OECD demand
Source: World Bank.
-50
-25
0
25
50
75
2009M01 2009M05 2009M09 2010M01 2010M05 2010M09 2011M01 2011M05 2011M09
East Asia China East Asia excl China
export volumes, ch% 3m/3m saar
3

Global Economic Prospects January 2012 East Asia & the Pacific Annex
of 2012 these connections will likely be reset as
infrastructure repairs are completed in Thailand.
Despite the erstwhile continued growth of
regional exports (excluding China), exporters in
the Philippines, Malaysia, Indonesia and
Thailand and Vietnam are vulnerable to slowing
import demand growth in OECD economies. For
example, 48 percent of the Philippines’ exports
are destined to three markets: Europe (20%), the
United States (18%) and China (10%), the latter
in part representing demand from production
chains serving Europe and the United States
(figure EAP.4). Already, external demand for
manufactures has weakened significantly (the
dollar value of imports of the United States, the
Euro Area and China declined 10 percent in the
third quarter, saar) (figure EAP.5). A ―China
effect‖ in trade is also of concern for its regional
partners: a slowdown China’s import demand
could be grounded in a quicker-than-expected
slowdown in China’s domestic demand or a
falloff in orders from China’s production chains
due to slower high-income country demand.
These developments could constitute a ―double
hit‖ on shipments from a number of East Asia
region manufacturing export-intensive
economies.
Volatile capital flows and exchange rate
movements. During 2010, private and public
capital inflows into developing East Asia jumped
from their depressed $235 billion level of 2009
to $448 billion, with virtually all flows rising,
particularly trade and other short term credits
(one-year or less). Gross equity flows in the
form of initial public offerings were robust
during the year (table EAP.3). Although capital
inflows were relatively stable year on year in
2011, this masks a pattern of unusually strong
inflows during the first half– and sharply weaker
inflows in the second half of the year. In
particular, regional equity and bond markets
soured markedly after August, reflecting
increases in global risk aversion following the
downgrading of U.S. sovereign debt and
renewed concerns about European fiscal
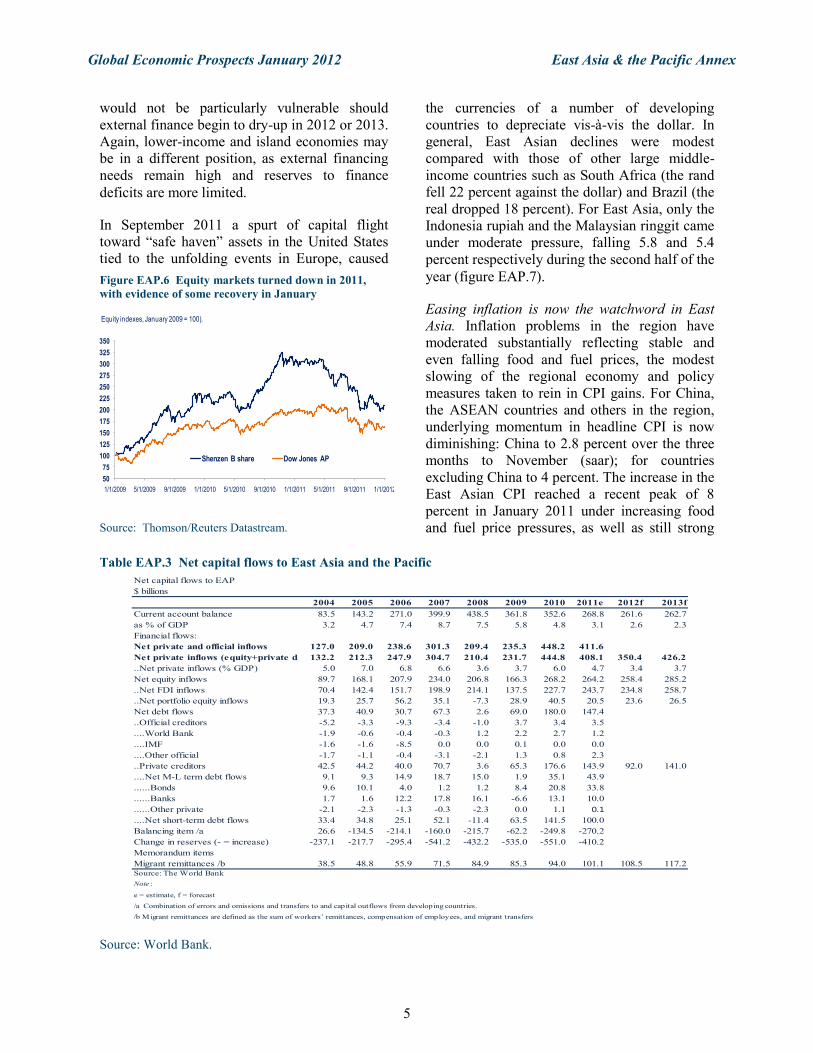
sustainability. Chinese equity markets―after
modest gains from the start of the year through
May ― plummeted 25 percent from July to
December, before recouping 5 percent into the
New Year on somewhat more muted pessimism
on European developments (figure EAP.6).
Fortunately, most countries in the region do not
have significant external financing needs for
2012 (mainly due to current account surpluses or
relatively small deficits). The sum of short- and
long-term debt coming due plus expected current
account deficits represent a relatively modest 3.4
percent of regional GDP in 2012, with a high of
4.2 percent for Malaysia (where reserves would
be more-than sufficient to cover financing
requirements). Reserve levels are exceptionally
high across East Asian middle income countries,
ranging from 8.2 months of imports in Indonesia
to 23 months in China. As a result, the region
Figure EAP.5 East Asia & Pacific export markets
show declining trends, auguring poorly for rapid trade
recovery
Source: National Agencies through Thomson/Reuters
Datastream.
-25
0
25
50
75
100
1/1/2010 5/1/2010 9/1/2010 1/1/2011 5/1/2011 9/1/2011
US imports Mfgrs EA imports Mfgrs China imports Mfgrs
imports of manufactured goods, nominal (ch$, 3m/3m saar)
Figure EAP.4 Exposures in manufactures exports are
high
Source: World Bank WITS- Comtrade Database.
0
10
20
30
40
50
China Indonesia Malaysia Philippines Thailand
Mfgr shr in U.S. Mfgr shr in EU25
Mfgr shr in China Total "exposure"
Share (%) of mfgr exports to indicated markets from exporterslisted below. (data is average 2008-2009)
4
Global Economic Prospects January 2012 East Asia & the Pacific Annex
would not be particularly vulnerable should
external finance begin to dry-up in 2012 or 2013.
Again, lower-income and island economies may
be in a different position, as external financing
needs remain high and reserves to finance
deficits are more limited.
In September 2011 a spurt of capital flight
toward ―safe haven‖ assets in the United States
tied to the unfolding events in Europe, caused
the currencies of a number of developing
countries to depreciate vis-à-vis the dollar. In
general, East Asian declines were modest
compared with those of other large middle-
income countries such as South Africa (the rand
fell 22 percent against the dollar) and Brazil (the
real dropped 18 percent). For East Asia, only the
Indonesia rupiah and the Malaysian ringgit came
under moderate pressure, falling 5.8 and 5.4
percent respectively during the second half of the
year (figure EAP.7).
Easing inflation is now the watchword in East
Asia. Inflation problems in the region have
moderated substantially reflecting stable and
even falling food and fuel prices, the modest
slowing of the regional economy and policy
measures taken to rein in CPI gains. For China,
the ASEAN countries and others in the region,
underlying momentum in headline CPI is now
diminishing: China to 2.8 percent over the three
months to November (saar); for countries
excluding China to 4 percent. The increase in the
East Asian CPI reached a recent peak of 8
percent in January 2011 under increasing food
and fuel price pressures, as well as still strong
Figure EAP.6 Equity markets turned down in 2011,
with evidence of some recovery in January
Source: Thomson/Reuters Datastream.
50
75
100
125
150
175
200
225
250
275
300
325
350
1/1/2009 5/1/2009 9/1/2009 1/1/2010 5/1/2010 9/1/2010 1/1/2011 5/1/2011 9/1/2011 1/1/2012
Shenzen B share Dow Jones AP
Equity indexes, January 2009 = 100).
Table EAP.3 Net capital flows to East Asia and the Pacific
Source: World Bank.
Net capital flows to EAP
$ billions
2004 2005 2006 2007 2008 2009 2010 2011e 2012f 2013f
Current account balance 83.5 143.2 271.0 399.9 438.5 361.8 352.6 268.8 261.6 262.7
as % of GDP 3.2 4.7 7.4 8.7 7.5 5.8 4.8 3.1 2.6 2.3
Financial flows:
Net private and official inflows 127.0 209.0 238.6 301.3 209.4 235.3 448.2 411.6
Net private inflows (equity+private debt)132.2 212.3 247.9 304.7 210.4 231.7 444.8 408.1 350.4 426.2
..Net private inflows (% GDP) 5.0 7.0 6.8 6.6 3.6 3.7 6.0 4.7 3.4 3.7
Net equity inflows 89.7 168.1 207.9 234.0 206.8 166.3 268.2 264.2 258.4 285.2
..Net FDI inflows 70.4 142.4 151.7 198.9 214.1 137.5 227.7 243.7 234.8 258.7
..Net portfolio equity inflows 19.3 25.7 56.2 35.1 -7.3 28.9 40.5 20.5 23.6 26.5
Net debt flows 37.3 40.9 30.7 67.3 2.6 69.0 180.0 147.4
..Official creditors -5.2 -3.3 -9.3 -3.4 -1.0 3.7 3.4 3.5
....World Bank -1.9 -0.6 -0.4 -0.3 1.2 2.2 2.7 1.2
....IMF -1.6 -1.6 -8.5 0.0 0.0 0.1 0.0 0.0
....Other official -1.7 -1.1 -0.4 -3.1 -2.1 1.3 0.8 2.3
..Private creditors 42.5 44.2 40.0 70.7 3.6 65.3 176.6 143.9 92.0 141.0
....Net M-L term debt flows 9.1 9.3 14.9 18.7 15.0 1.9 35.1 43.9
......Bonds 9.6 10.1 4.0 1.2 1.2 8.4 20.8 33.8
......Banks 1.7 1.6 12.2 17.8 16.1 -6.6 13.1 10.0
......Other private -2.1 -2.3 -1.3 -0.3 -2.3 0.0 1.1 0.1
....Net short-term debt flows 33.4 34.8 25.1 52.1 -11.4 63.5 141.5 100.0
Balancing item /a 26.6 -134.5 -214.1 -160.0 -215.7 -62.2 -249.8 -270.2
Change in reserves (- = increase) -237.1 -217.7 -295.4 -541.2 -432.2 -535.0 -551.0 -410.2
Memorandum items
Migrant remittances /b 38.5 48.8 55.9 71.5 84.9 85.3 94.0 101.1 108.5 117.2Source: The World Bank
Note :
e = estimate, f = forecast
/a Combination of errors and omissions and transfers to and capital outflows from developing countries.
/b Migrant remittances are defined as the sum of workers’ remittances, compensation of employees, and migrant transfers
5

Global Economic Prospects January 2012 East Asia & the Pacific Annex
domestic demand, and is now running at a rate
below 3 percent thanks to developments in
China. With economic activity now anticipated
to continue fairly strong, accompanied by lower
commodity prices, we may expect a continuing
softening trend in inflation through 2012 at a
minimum.
Partly reflecting diminished inflationary
pressures, but also slowing growth–notably in
China―monetary policy in the region has begun
to ease. Since August 2011, policy rates have
been cut 75 basis points in Indonesia; they had
been raised 25 basis points in Thailand prior to
the flooding, then reduced once more2, while
Malaysia and the Philippines have kept policy
rates stable since a second-quarter increase. In
China, the PBOC reduced the reserve
requirement ratio by 50 basis points on
November 30, the first time the central bank has
moved to ease credit supply since 2009. But
overall policy remains fairly tight, mainly
because inflation rates have declined by more
than policy interest rates – implying rising real
interest rates— and the potential for additional
rate reductions if desired.
Fiscal policy in the region loosened significantly
with the global recession of 2008/9. The region’s
overall government deficit widened by 3.6
percent of GDP between 2007 and 2009 for both
cyclical and policy reasons. The Institute of
International Finance estimates that fiscal
measures in China could have amounted to as
much as 12.5 percent of that country’s GDP over
two years, though its recorded deficit increased
by only 3 percentage points from a surplus of 0.9
percent of GDP in 2007 to deficit of 2.1 percent
in 2009.3 Since then a combination of stronger
growth and normalization of fiscal policy has
seen China’s deficit decline to an estimated 1.7
percent of GDP in 2011, with most of that
improvement (1.5 percentage points according to
World Bank estimates) the result of better
cyclical conditions.
For the remainder of the region the decline and
subsequent rebound in public deficits was less
pronounced, with the government balance
deteriorating 2.6 percentage points of GDP
between 2007 and 2009 and recovering 0.8
percentage points since, to come to a deficit of
2.6 percent in 2011. Fiscal shortfalls differ
substantially across countries across the year,
from 5.5 percent of GDP in Malaysia to 1.6
percent in Indonesia. Most middle income
countries carry some fiscal space for a relaxation
of policy (assuming financing is forthcoming—
or sufficient international reserves are available
for backup), though on average they have 1.5
percentage points less available compared with
2007.
Medium-term outlook
Despite the increasingly cloudy global
environment, growth in the East Asia and Pacific
region is projected to slow by only 0.4
percentage points to 7.8 percent in 2012 (under
base case assumptions) and stabilizes at 7.8
percent for 2013 as well, as the effects of a
modest easing in China’s growth is
counterbalanced by a pickup in GDP gains in the
remainder of the region, to yield 7.8 percent
growth for 2013 (figure EAP.8). The slowdown
of 2012 reflects an expected continuation of
strong domestic demand (already in some
evidence in third-quarter 2011 GDP data and
high-frequency indicators), as export growth is
anticipated to slow by almost 2 percentage
points due to turmoil in Europe and sluggish
Figure EAP.7 Capital outflows are affecting several
Brics fex-rates and reserves-- EAP largely spared
Source: World Bank.
-20 -15 -10 -5 0 5 10 15
Indo R
Thai B
PHL P
MYS R
CHN R
BRA rei
ZAF R
Euro/dollar
ch% Mid-year 2011 to December 7 ch% 1st Half 2011 2010
percentage change in currency units against the dollar: 2010, first-half 2011 and mid-2011 to end-December
note: in this presentatin, stronger LCU is a positive percentage change
6

Global Economic Prospects January 2012 East Asia & the Pacific Annex
OECD demand, contributing nil to overall
regional growth (see table EAP.1, earlier).4
In China, the lagged effects of monetary policy
tightening (both in terms of interest rates and
regulatory adjustment) are expected to combine
with weak external demand to slow GDP growth
from 9.1 percent in 2011 to 8.3 percent by 2013.
The bulk of activity is expected to come from
domestic demand―with private consumption
and fixed investment contributing 3-and-4
percentage points to GDP in 2012―while net
exports afford only a modest 0.2 point addition
to growth. Inflation is anticipated to decline; and
monetary policy relaxation could be in the cards
during 2012. Key domestic risks for China are
the property sector, local government borrowing,
and bank balance sheets; but the baseline
scenario envisages that policy will focus closely
on these aspects, with efforts sufficient to stem
systemic effects on the economy.
Prospects for the ASEAN-4 countries are
mixed, but in a ―baseline view‖ are likely to
achieve a pick-up in growth despite the 2012
global slowdown. Following a sharp deceleration
from 6.9 percent to 4.6 percent gains for the
group in 2011, softening export volumes and
mixed terms-of-trade movements are anticipated
to be offset by the strong momentum of domestic
demand for a number of countries, to produce a
fillip to GDP gains in 2012. Growth in Malaysia
is likely to sustain rates near 5 percent over the
coming two years, as recent upward revisions to
GDP complement a view for strong domestic
demand grounded in government consumption
and a substantial pickup in public investment.
Indonesia is expected to see growth ease from
6.4 percent in 2011- to a still very strong 6.2
percent in 2012- before picking up to 6.5 percent
by 2013, with domestic demand the prime mover
for GDP.
Both Thailand and the Philippines may be able
to avert a slowing of GDP in 2012. In the
former, reconstruction spending to repair the
extensive damage from flooding may provide a
boost to output growth in 2012; while in the
latter economy the continued strength of
remittance inflows and renewed public spending
is projected to boost growth to 4.2 percent from
3.7 percent in 2011. That the tenor of domestic
demand in most countries will remain resilient
may be attributable to policy decisions regarding
monetary accommodation (now coming on
stream) and fiscal support (potentially
forthcoming). On balance, GDP gains of 4.6
percent registered in 2011 for the ASEAN-4 are
anticipated to be followed by advances of 5.2
and 5.7 percent through 2013.
Growth in low-income Cambodia together with
lower-middle income Vietnam and Laos PDR,
slowed from 6.8 percent in 2010 to 5.9 percent
in 2011. Looking forward, growth in Vietnam
and Cambodia is projected to strengthen
somewhat further during 2012 and 2013 due to
the ability to utilize hydrocarbon windfalls to
sustain spending in the former, and improved
macroeconomic stability in the latter, while a
lack of strong financial linkages should mute
that transmission channel from the disturbance
among high-income countries for both.
Vietnam’s fiscal stance remains accommodative,
though tightening of monetary policy to stem
high inflation is helping to reduce the country’s
macroeconomic instability gradually. Vietnam’s
exports have expanded at double digit rates for
some time, though this is likely to give way for
all economies in the group over 2012-13. GDP
for the group is anticipated to achieve a robust
Figure EAP.8 Baseline view for moderate decline
Source: World Bank.
0
2
4
6
8
10
12
DEV East Asia China ASEAN-4 Vietnam & LICs Islands
2010 2011 2012 2013
growth of real GDP, percent
7

Global Economic Prospects January 2012 East Asia & the Pacific Annex
6.8 percent pace in 2012 (in part due to new
large-scale mining and hydropower operations
coming on stream in Lao PDR), before easing to
6.5 percent in 2013. Current account deficits
remain at high levels, however, given the heavy
import content of manufactures exports, while
fiscal deficits are a continuing concern.
Risks and vulnerabilities
For the majority of middle income countries in
East Asia, the health of the global economy and
high-income Europe in particular, represents the
key risk at this time. An acute financial crisis in
Europe could reduce East Asian GDP gains in
2012 substantially compared to 7.8 percent
growth in the baseline depending on the severity
of the crisis – reflecting trade effects, potential
terms of trade changes, a drying up of
international capital and increases in regional
precautionary saving by firms and households
(see main text for description of a potential low
case scenario).
Trade. Despite global recession in 2009, exports
of developing East Asia to the world amounted
to $1.8 trillion, representing 30 percent of
regional GDP. Of that total, trade within the
geographic region has advanced to $840 billion
on growth of almost 50 percent over the last
decade. Just as international and intra-region
trade has proved a powerful engine of growth for
a good number of East Asian countries, so can
the intricate trade links among economies in the
region, and generalized exposures to conditions
in final destination markets serve as fairly
powerful means of transmission of adverse trade
effects to- and within East Asia (see figures
EAP.4 and EAP.5, earlier, and table EAP.4).
Model simulations5 for the base case scenario
suggest that a fall of GDP growth in the euro-
zone from 0.5 percent postulated for 2012 to
zero would be sufficient to reduce East Asia’s
export volume growth by 2-tenths of a
percentage point in the year—and broadly
(dependent on export shares in GDP), cut
economic growth by 1-to-2 tenths of a
percentage point. Slower OECD demand echoes
quickly through East Asian production and trade
networks, such that a larger number of middle
income countries are affected. And under an
assumption of an acute European crisis, ―second-
round‖ trade effects could take an additional toll
on trade growth as more countries globally
experience depressed growth and dampened
imports.
Terms of trade developments can have a
powerful influence on trade positions, on the
purchasing power of export revenues (income
gains/losses for the population) and on fiscal
balances. East Asia represents a highly mixed set
of countries in terms of oil and natural gas
exporters (Indonesia, Malaysia and Vietnam), oil
importers, and countries whose export baskets
reflect a complex mix of commodities and
manufactures (electronic components, auto parts
and finished goods of all kinds) which include
China, Indonesia, Malaysia, Indonesia and
Thailand. Other countries are more dependent on
a single commodity (e.g. Papua New Guinea,
copper).
For the developing region as a whole, the food
and energy price spikes of 2010-2011 carried
negative terms of trade effects on balance, with
the index dropping 1.9-and-0.6 percent
respectively. Under baseline conditions, terms of
trade should be moving positively for the region
over 2012-2013 (plus 2.2 and 0.5 percent
respectively), notably for China, the low income
countries, as well as several middle income
ASEAN-4 economies (figure EAP.9).
East Asia is well prepared for yet another
potential bought of strong capital inflows,
should international investors in search of yield
(returns in the high single digits in local currency
vis-à-vis low single digits in the high-income
financial markets) turn once more to emerging
markets. Reserve levels are high, interest rates
are starting to be reduced; growth is likely to
slow moderately and fiscal space is abundant in
the middle income countries of the region.
Exchange rates have—on average—weakened
slightly against the greenback, but strengthened
appreciably versus the euro, which may create a
―win-win‖ situation for equity and bond flows
toward East Asia, with expectations of returns
8

Global Economic Prospects January 2012 East Asia & the Pacific Annex
plus capital gains on the exchange rate
transaction to boost overall income receipts.
The potential for a ramp-up in capital flows
under emerging global conditions has increased,
exposing those East Asian countries, notably,
China, Indonesia, Malaysia and Thailand to the
possibility of market disruption and exchange
rate volatility. Reserves will serve to provide
some underpinning to economies, but under
worse-case scenarios, those countries which
experience large amounts of capital inflow will
be more vulnerable to these ―stop-go‖ effects.
These could occur under the base case, as
financial workouts in Europe and the United
States get underway; but could be much
amplified under a low case scenario.
Consumer and business confidence appears to be
holding up well, suggesting that a spate of
precautionary savings behavior on the part of
households and firms may not characterize
conditions in East Asia in the current world
conjuncture. Only under a serious crisis scenario
might these effects take a meaningful toll on
economic activity.
Finally, the region itself is exposed to the sort of
economic landing that will characterize China’s
future in its efforts to quell growth in select
segments of its economy- and to follow-on
effects passing to the remainder of the region.
Expansionary policies that supported strong
growth during the ―great recession‖ also fed a
real estate boom in China. And rapid credit
growth may have weakened the portfolio quality
of the banking system. Attempts to cool parts of
the economy were successful; monetary policy
and regulations were notched up earlier, and
growth in formal bank lending was tightened.
However, because real estate is often used as
collateral or as an investment, it is a growing risk
for the banking system and for informal
creditors. Should conditions worsen, the
government has ample policy space, especially
now that inflation appears to be on the wane.
While further adjustments in property markets
present a downside risk, the prospects for a soft
landing for China remain high.
Policy. Although government deficits in the
region have deteriorated relative to their pre-
crisis levels of 2007, there remains scope for a
pro-active policy response in a number of middle
income countries–assuming financing is
forthcoming, an important element in defining
the range of operations feasible. Monetary policy
may have some leeway as well to become more
accommodative as inflation eases and real
interest rates rise, opening the potential for lower
policy interest rates—already in train in several
countries.
To the extent that external finance becomes very
tight, countries would have to rely on domestic
sources – which are less likely to be available in
the low-income and island nation groups where
domestic capital markets remain underdeveloped
and reserve levels may be inadequate to cover
additional financing requirements.
For the longer term, however, under the premise
that growth in the OECD economies slips from
average rates of 2.7 percent of the last decade to
2-2.25 percent (particularly given the need to
improve fiscal sustainability), there may be a set
of policies worthwhile for authorities in East
Asia to consider. These might include means to
keep domestic demand advancing at a
sustainable, non-inflationary pace, to replace
some of the impetus to growth lost to weaker
Figure EAP.9 Terms of trade move with East Asia
in 2012 before relapse
Source: World Bank.
-8
-6
-4
-2
0
2
4
6
8
10
01/01/08 01/01/09 01/01/10 01/01/11 01/01/12 01/01/13
China ASEAN-4 Low income
terms of trade (merchandise), ch%
9
Global Economic Prospects January 2012 East Asia & the Pacific Annex
OECD demand. And here lies longer-term
efforts at improving education and human
capital, and the productivity of investment.
Moreover, a strengthening of social welfare nets
and reforms of their distributional characteristics
could help to support domestic demand more
fully during times of economic downturn.
Though such policies have been in progress for
many years, in several some cases, the current
episode of slower growth may provide an
auspicious time to implement these with more
vigor.
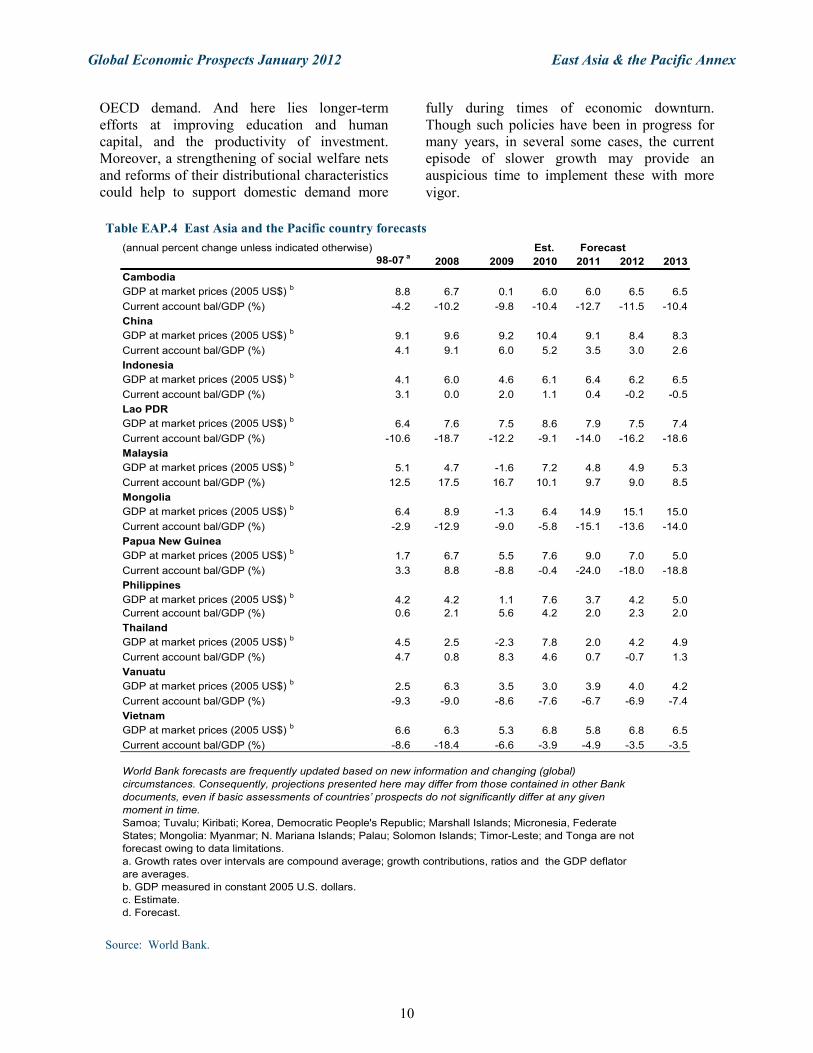
Table EAP.4 East Asia and the Pacific country forecasts
Source: World Bank.
Est.
98-07 a
2008 2009 2010 2011 2012 2013
Cambodia
GDP at market prices (2005 US$) b
8.8 6.7 0.1 6.0 6.0 6.5 6.5
Current account bal/GDP (%) -4.2 -10.2 -9.8 -10.4 -12.7 -11.5 -10.4
China
GDP at market prices (2005 US$) b
9.1 9.6 9.2 10.4 9.1 8.4 8.3
Current account bal/GDP (%) 4.1 9.1 6.0 5.2 3.5 3.0 2.6
Indonesia
GDP at market prices (2005 US$) b
4.1 6.0 4.6 6.1 6.4 6.2 6.5
Current account bal/GDP (%) 3.1 0.0 2.0 1.1 0.4 -0.2 -0.5
Lao PDR
GDP at market prices (2005 US$) b
6.4 7.6 7.5 8.6 7.9 7.5 7.4
Current account bal/GDP (%) -10.6 -18.7 -12.2 -9.1 -14.0 -16.2 -18.6
Malaysia
GDP at market prices (2005 US$) b
5.1 4.7 -1.6 7.2 4.8 4.9 5.3
Current account bal/GDP (%) 12.5 17.5 16.7 10.1 9.7 9.0 8.5
Mongolia
GDP at market prices (2005 US$) b
6.4 8.9 -1.3 6.4 14.9 15.1 15.0
Current account bal/GDP (%) -2.9 -12.9 -9.0 -5.8 -15.1 -13.6 -14.0
Papua New Guinea
GDP at market prices (2005 US$) b
1.7 6.7 5.5 7.6 9.0 7.0 5.0
Current account bal/GDP (%) 3.3 8.8 -8.8 -0.4 -24.0 -18.0 -18.8
Philippines
GDP at market prices (2005 US$) b
4.2 4.2 1.1 7.6 3.7 4.2 5.0
Current account bal/GDP (%) 0.6 2.1 5.6 4.2 2.0 2.3 2.0
Thailand
GDP at market prices (2005 US$) b
4.5 2.5 -2.3 7.8 2.0 4.2 4.9
Current account bal/GDP (%) 4.7 0.8 8.3 4.6 0.7 -0.7 1.3
Vanuatu
GDP at market prices (2005 US$) b
2.5 6.3 3.5 3.0 3.9 4.0 4.2
Current account bal/GDP (%) -9.3 -9.0 -8.6 -7.6 -6.7 -6.9 -7.4
Vietnam
GDP at market prices (2005 US$) b
6.6 6.3 5.3 6.8 5.8 6.8 6.5
Current account bal/GDP (%) -8.6 -18.4 -6.6 -3.9 -4.9 -3.5 -3.5
(annual percent change unless indicated otherwise)
World Bank forecasts are frequently updated based on new information and changing (global)
circumstances. Consequently, projections presented here may differ from those contained in other Bank
documents, even if basic assessments of countries’ prospects do not significantly differ at any given
moment in time.
Samoa; Tuvalu; Kiribati; Korea, Democratic People's Republic; Marshall Islands; Micronesia, Federate
States; Mongolia: Myanmar; N. Mariana Islands; Palau; Solomon Islands; Timor-Leste; and Tonga are not
forecast owing to data limitations.
a. Growth rates over intervals are compound average; growth contributions, ratios and the GDP deflator
are averages.
b. GDP measured in constant 2005 U.S. dollars.
c. Estimate.
d. Forecast.
Forecast
10

Global Economic Prospects January 2012 East Asia & the Pacific Annex
Notes:
1. The developing East Asia region presented
in the projections (countries with sufficient
economic data for compilation of a small
econometric model) include: China
(mainland); the larger ASEAN members:
Indonesia, Malaysia, Philippines and
Thailand; Cambodia (low-income country),
and lower middle income economies
Vietnam and Lao PDR; and a subset of
smaller island economies: Fiji and Papua
New Guinea are also part of the model
system. Several high-income countries are
projected as part of the ―geographic region‖,
(not the headline ―developing East Asia‖
region) including Hong Kong SAR, China;
the Republic of Korea, Singapore and
Taiwan, China.
2. Thailand’s policy rate was raised by 25 basis
points on August 24—but in the wake of the
serious flooding throughout most of the
country, the rate hike was rescinded on
October 24 in a move to stimulate the
economy and lower costs for construction
financing.
3. ―Global Economic Monitor‖. November 22,
2011. The Institute of International Finance
Inc. Washington DC.
4. For the developing region, the contribution
of net exports continues to be a drag on
growth from 2011 through 2012, before
reviving to a 0.6 point fillip to GDP.
5. World Bank, Development Economics,
Prospects Group, iSIM modeling system,
December 2011.
11