nom entier (si sigle) - agrogeneration.com243 275 biological assets 12 197 228 deferred tax assets -...
TRANSCRIPT
FINEXSI AUDIT ERNST & YOUNG et Autres
This is a free translation into English of the statutory auditors’ review report on the consolidated financial statements issued in French and it is provided solely for the convenience of English-speaking users. This report should be read in conjunction with and construed in accordance with French law and professional auditing standards applicable in France.
AgroGeneration Period from January 1 to June 30, 2015
Statutory auditors’ review report on the interim condensed consolidated financial statements

FINEXSI AUDIT 14, rue de Bassano
75116 Paris S.A. au capital de € 57.803
Commissaire aux Comptes Membre de la compagnie
régionale de Paris
ERNST & YOUNG et Autres 1/2, place des Saisons
92400 Courbevoie - Paris-La Défense 1 S.A.S. à capital variable
Commissaire aux Comptes Membre de la compagnie
régionale de Versailles
AgroGeneration Period from January 1 to June 30, 2015
Statutory auditors’ review report on the interim condensed consolidated financial statements
To the Executive Director,
In our capacity as statutory auditors of AgroGeneration and in accordance with your request, we have performed a review of the accompanying interim condensed consolidated financial statements for the period from January 1 to June 30, 2015.
The preparation of these interim condensed consolidated financial statements is the responsibility of your board of directors. Our role is to express a conclusion on the interim condensed consolidated financial statements based on our review.
We conducted our review in accordance with professional standards applicable in France. A review consists of making inquiries, primarily of persons responsible for financial and accounting matters and applying analytical and other review procedures. A review is substantially less in scope than an audit conducted in accordance with professional standards applicable in France and consequently does not enable us to obtain assurance that we would become aware of all significant matters that might be identified in an audit. Accordingly, we do not express an audit opinion.
Based on our review, nothing has come to our attention that causes us to believe that these interim condensed consolidated financial statements are not prepared, in all material respects, in accordance with IAS 34 – IFRS as adopted by the European Union applicable to interim financial information.
Without modifying the conclusion expressed above, we draw your attention to the following points disclosed in the notes to the financial statements:
• The macroeconomic environment in Ukraine and its potential evolutions that could negatively affect the operating results, as well as the financial situation of the group (note 3.1 Political risks in Ukraine).
• The sensitivity of income statement to management assumptions related to biological assets valuation according to IAS 41 (note 4.2 Fair value of biological assets and net realizable value of agricultural produce).
• The revaluation of the fixed assets situated in Ukraine (note 2.4 Revaluation of the fixed assets).

AgroGeneration 2
This report is governed by French law. The courts of France shall have exclusive jurisdiction over any claim, dispute or difference resulting from our engagement letter or the present report, or any related matters. Each party irrevocably waives its right to oppose any action brought before French courts, to claim that the action is being brought before an illegitimate court or that the courts have no jurisdiction.
Paris and Paris-La Défense, October 30, 2015
The statutory auditors
FINEXSI AUDIT ERNST & YOUNG et Autres
Olivier Péronnet Jean-Christophe Goudard

AgroGeneration Group - Consolidated Financial Statements first half 2015 Page 1
Interim Condensed ConsolidatedFinancial Statements as of 30 June, 2015

AgroGeneration Group - Consolidated Financial Statements first half 2015 Page 2
TABLE OF CONTENTS
CONSOLIDATED STATEMENT OF FINANCIAL POSITION 4
CONSOLIDATED INCOME STATEMENT 5
CONSOLIDATED STATEMENT OF COMPREHENSIVE INCOME 6
CONSOLIDATED STATEMENT OF CHANGES IN EQUITY 7
CONSOLIDATED CASH FLOW STATEMENT 9
NOTES TO THE CONSOLIDATED FINANCIAL STATEMENTS 11
1. SCOPE OF CONSOLIDATION 11General information and background 11
2. MAJOR EVENTS OF THE PERIOD 122.1. Debt restructuring by issuing Subordinated Bonds Redeemable into New or Existing Shares (OSRANE) 122.2. Amendment of EBRD loan 132.3. Purchase of the new subsidiary in February 2015 132.4. Revaluation of the fixed assets 14
3. FINANCIAL RISK MANAGEMENT 143.1. Political risks in Ukraine 143.2. Risks related to changes in exchange rates 153.3. Risks related to commodities price changes 163.4. Liquidity risks on crop financing 173.5. Counterparty risks 173.6. Capital repatriation risks 17
4. CRITICAL ACCOUNTING JUDGMENTS AND ESTIMATES 184.1. Impairment test on intangible assets 184.2. Fair value of biological assets and net realisable value of agricultural produce 184.3. Equity-settled share-based transactions 184.4. Pre-emptive rights on land leases 194.5. Fair value of fixed assets 19
5. EVENTS AFTER THE BALANCE SHEET DATE 195.1. Early redemption of OSRANE bonds into shares 195.2. Share warrants issuance 19
6. SUMMARY OF SIGNIFICANT ACCOUNTING POLICIES 206.1. Basis of preparation 206.2. Consolidation 216.3. Foreign currency translation 226.4. Intangible assets and leasehold rights 236.5. Property, plant and equipment 236.6. Agriculture 246.7. Current and deferred income tax 256.8. Leases – The Group as a lessee 266.9. Share-based payment 27
7. SEGMENT REPORTING 288. INTANGIBLE FIXED ASSETS AND LAND LEASES 299. PROPERTY, PLANT AND EQUIPMENT 3010. FINANCIAL ASSETS 31

AgroGeneration Group - Consolidated Financial Statements first half 2015 Page 3
11. INVENTORIES 3212. BIOLOGICAL ASSETS 3313. TRADE AND OTHER RECEIVABLES 3514. CASH AND CASH EQUIVALENTS 3615. BORROWINGS 3616. SHARE CAPITAL 3817. PROVISIONS 3918. TRADE AND OTHER PAYABLES 3919. FINANCIAL ASSETS AND LIABILITIES 4020. REVENUES FROM OPERATING ACTIVITIES 4121. FUNCTIONAL COSTS / COSTS BY NATURE 4222. OTHER INCOME AND EXPENSE 4223. NET FINANCIAL INCOME / (EXPENSES) 4324. EARNINGS PER SHARE 4425. COMMITMENTS 45
25.1. Financing-related commitments 4525.2. Commitments related to operating activities 45
26. TRANSACTIONS WITH RELATED PARTIES 4627. LIST OF CONSOLIDATED COMPANIES 47

AgroGeneration Group - Consolidated Financial Statements first half 2015 Page 4
Consolidated statement of financial position
(in thousands of Euros)
Assets Note June 30, 2015 December 31, 2014
Non-current assets 79 662 63 560Intangible assets and leasehold rights 8 42 771 40 876Property, plant and equipment 9 36 451 22 181Financial assets 10 243 275Biological assets 12 197 228Deferred tax assets - -
Current Assets 61 699 35 323Inventories 11 4 672 10 916Financial assets 10 3 878 1 798Biological assets 12 46 738 12 093Trade and other receivables 13 4 802 5 101Cash and cash equivalents 14 1 609 5 415
Total assets 141 361 98 883
Equity and Liabilities Note June 30, 2015 December 31, 2014
Equity 59 778 6 569Share capital 16 4 618 4 618Share premium 16 166 468 166 468Other reserves (33 756) (101 199)Retained earnings (39 940) (18 275)Currency translation differences (32 202) (23 378)Net Income (5 410) (21 665)Non-controlling interests - -
Non-current liabilities 13 449 58 362Provisions 17 - -Non current borrowings 15 11 955 58 362Non current payables 18 1 494Deferred tax liabilities - -
Current liabilities 68 134 33 952Provisions 17 - -Current borrowings 15 39 846 24 241Trade and other payables 18 27 240 8 894Current income tax liability 1 048 817
Total equity and liabilities 141 361 98 883

AgroGeneration Group - Consolidated Financial Statements first half 2015 Page 5
Consolidated income statement
(in thousands of Euros) Note first-half 2015 first-half 2014
Revenue 20 3 082 4 940Change in fair value of biological assets and finishedgoods 12 10 769 8 258Cost of sales 21 (2 003) (5 239)Gross profit / (loss) 11 848 7 959
Selling, general and administrative expenses 21 (5 000) (6 669)Other income and expenses 22 (700) 2 079Profit before interest and tax 6 148 3 369
Financial net expenses 23 (11 838) (16 751)Income tax expense 280 25Profit / (loss) from continued operations (5 410) (13 357)
Profit after tax from discontinued operations(attributable to the Group) - 1 429
Profit / (loss) for the period (5 410) (11 928)
Non-controlling interests - -
Profit / (loss) from continued and discontinued operationsattributable to the Group
(5 410) (11 928)
Profit / (Loss) attributable to equity holders of thecompany (€, 000) (5 410) (11 928)
Weighted average number of ordinary shares 91 868 083 91 948 633Basic earnings / (loss) per share (in Euros per share) 24 (0,06) (0,13)
Profit / (loss) attributable to equity holders of thecompany after dilution (€, 000)
(4 975) (11 928)
Weighted average number of ordinary and potentialshares 190 616 183 91 948 633
Diluted earnings / (loss) per share (in Euros per share) 24 (0,03) (0,13)

AgroGeneration Group - Consolidated Financial Statements first half 2015 Page 6
Consolidated statement of comprehensive income
(in thousands of Euros)first-half 2015 first-half 2014
Profit / (loss) for the period (5 410) (11 928)
Items non-recyclable in income, net of tax 25 146 -
Gains on Property, plant and equipment revaluation 25 146 -
Items recyclable in income, net of tax (8 824) (17 549)
Currency translation differences (8 824) (17 549)
Total comprehensive income of the period 10 912 (29 477)

AgroGeneration Group - Consolidated Financial Statements first half 2015 Page 7
Consolidated statement of changes in equity
(in thousands of euros) Sharecapital
Sharepremium
Otherreserves
Retainedearnings
Othercompre-hensiveincome
(expense)
Total,Groupshare
Non-control-
linginterest
Totalequity
Balance as of December 31, 2013 4 618 166 468 (101 169) (18 275) (587) 51 055 - 51 055Issue of new shares - - - - - - - -Change in scope - - - - - - - -Currency translationdifferences* - - - - (17 549) (17 549) - (17 549)Shared-based payments - - (4) - - (4) - (4)Own shares - - 27 - - 27 - 27Net Income / (loss) for the year - - - (11 928) - (11 928) - (11 928)
Balance as of June 30, 2014 4 618 166 468 (101 146) (30 203) (18 136) 21 601 - 21 601Issue of new shares - - - - - - - -Change in scope - - 12 - - 12 - 12Currency translationdifferences* - - - - (5 242) (5 242) - (5 242)Shared-based payments - - - - - - - -Own shares - - (65) - - (65) - (65)Net Income / (loss) for the year - - - (9 737) - (9 737) - (9 737)
Balance as of December 31, 2014 4 618 166 468 (101 199) (39 940) (23 378) 6 569 - 6 569Issue of new shares - - - - - - - -Issue of OSRANE** - - 42 290 - - 42 290 - 42 290Change in scope - - (3) - - (3) - (3)Currency translationdifferences* - - - - (8 824) (8 824) - (8 824)Fixed assets revaluation *** - - - - 25 146 25 146 - 25 146Own shares - - 10 - - 10 - 10Net Income / (loss) for the year - - - (5 410) - (5 410) - (5 410)
Balance as of June 30, 2015 4 618 166 468 (58 902) (45 350) (7 056) 59 778 - 59 778
(*) Currency translation differences
Significant devaluation of Ukrainian hryvnia in 2014 had significant impact on assets and liabilities of theConsolidated Financial Statements (cf. Consolidated statement of changes in equity of ConsolidatedFinancial Statements as of December 31, 2014).
The negative impact of currency translation differences for 6 months 2015 amounts to €8 824 and iscomposed of:
€ 15 101k loss related to inter-company loans of Ukrainian entities denominated in USD andtranslated into the functional currency, Ukrainian hryvnia, at the closing rate. These loans weretreated as net investment (cf. Note 23).
€ 2k gain due to translation difference on current year income arising from the difference betweenaverage and closing rate (23,74 UAH/ EURO and 23,54 UAH/EURO respectively).

AgroGeneration Group - Consolidated Financial Statements first half 2015 Page 8
€ 6 275 K gain due to translating the opening net assets at a closing rate (23,54 UAH/EURO) thatdiffers from the previous closing rate (19,23 UAH/EURO): the gain is due to the fact that retainedearnings of Ukrainian entities are negative.
(**) OSRANE issue
On 31th March 2015 the Group issued OSRANE for a total amount of €57,4 m (net of issuance costs) whichresult in the increase of equity by €42.3 m (cf. Note 2.1).
(***) Fixed assets revaluation
The impact of revaluation of fixed assets recognised in other comprehensive income amounts to €25.1 m(cf. Note 2.4).

AgroGeneration Group - Consolidated Financial Statements first half 2015 Page 9
Consolidated cash flow statement
(in thousands of Euros) Note June 30, 2015 June 30, 2014
Profit / (loss) for the period (5 410) (11 928)
Depreciation on fixed assets 1 107 1 769Provisions* - (3 052)Capital (gains) / losses from disposals* (4) 1 627Net financial (income) / loss 23 11 838 16 755Deferred and income taxes (income) / expense (280) 218Impairment of finished goods inventory - (73)Biological assets and finished goods fair value decrease / (increase) (10 822) (9 515)Impairment of fixed assets 22 1 113 -Other (income) / expense with no cash impact 2 121
Cash flow from operating activities (2 456) (4 078)
Trade and other payables (decrease) / increase** 12 011 7 433Inventories decrease / (increase) (823) 3 497Biological assets cost decrease / (increase) (17 842) (17 344)Trade and other receivables decrease / (increase) *** 5 667 (1 131)Income tax paid - (37)
Working capital variation (987) (7 852)
Net operating cash flow (3 443) (11 660)
Cah flow from investing activities
Acquisition of subsidiaries 2.3 (413) -Purchase of property, plant and equipment (810) (926)Purchase of intangible assets (29) (131)Purchase of financial assets (23) (28)Disposal of subsidiaries - 1 284Disposal of property, plant and equipment 48 63Disposal of intangible assets - -Disposal of financial assets 37 -Net investing cash flow (1 190) 262
Cash flow from financing activities
Amounts received from shareholders following a capital increase - -Purchase/sale of treasury shares 273 27Pledged term deposits decrease / (increase) 10 (2 462) -Proceeds from borrowings 9 102 17 129Repayment of borrowings (1 917) (5 027)Gain / (losses) from realised foreign exchange 23 (231) (652)Paid interests (3 062) (3 255)Costs of capital increase - -Net cash generated from financing activities 1 703 8 222
Effects of exchange rate changes on cash and cash equivalents (876) (1 430)Net movement in cash and cash equivalents (3 806) (4 606)
Cash and cash equivalents at beginning of period 14 5 415 7 225
Cash and cash equivalents at end of period 14 1 609 2 619

AgroGeneration Group - Consolidated Financial Statements first half 2015 Page 10
* The operating cash flows for 6 months 2014 included the impact of disposal of operations in Argentina of €1 018k, represented byprovision write back of € 2 500k and € 1 482k of actual loss from the deal.
** In the consolidated balance sheet, the accounts receivable as of June 30, 2015 include prepayments made to suppliers of the Groupin connection with inputs for the 2015 harvest. In the consolidated cash flow statement, the variation in prepayments to suppliers(negative cash flow / increase in receivable), which stands at € 6k, not inclusive of exchange rate effects, is presented as a change inaccounts payable.
*** In the consolidated balance sheet, the accounts payable as of June 30, 2015 include prepayments received from Group customers inrespect of upcoming deliveries in the end of financial year 2015. In the consolidated cash flow statement, the change in customerprepayments (positive cash flow / increase in debt), which amounts to € 6 080k, not inclusive of exchange rate effects, is presented asa change in accounts receivable.

AgroGeneration Group - Consolidated Financial Statements first half 2015 Page 11
Notes to the Consolidated Financial Statements
The Interim Condensed Consolidated Financial Statements of the AgroGeneration Group(“AgroGeneration”, “the Group” or “the Company”) for the six months ended June 30, 2015 wereauthorized for issue by the Board of Directors on October 22, 2015. These Financial Statements arepresented in thousands of euro for all financial years, except for the per-share information.
1. Scope of consolidation
The Group’s Interim Condensed Consolidated Financial Statements for the six months ended June 30, 2015include the accounts of AgroGeneration SA and of all companies controlled by the Group, as well as thoseof jointly controlled companies and companies over which the Group exercises significant influence. Pleaserefer to the Note 27 for the List of consolidated entities.
General information and background
AgroGeneration was created in March 2007. The parent company is a Joint Stock Company(AgroGeneration SA) recorded on the Paris Trade and Companies Register with number 494 765 951,whose shares have been listed on the Alternext market of NYSE-Euronext Paris since March 1, 2010.
The registered office address is 18 rue Pasquier, 75008 Paris.

AgroGeneration Group - Consolidated Financial Statements first half 2015 Page 12
2. Major events of the period
2.1. Debt restructuring by issuing Subordinated Bonds Redeemable into New or ExistingShares (OSRANE)
AgroGeneration announced on 30 December 2014 its plan on debt restructuring which consisted in:
• redemption of the listed and non-listed bonds of the Company into Subordinated BondsRedeemable into New or Existing Shares (OSRANE); and
• amendment of the loan granted by the European Bank for Reconstruction andDevelopment (“EBRD”) mainly consisting in waiving the ongoing breaches of financial ratios, anextension of the maturity of the loan granted and a reset of the financial ratios for the future (c.f.Note 2.2)
Being unable to obtain the unanimous consent of the holders of listed bonds, AgroGeneration filed for anAccelerated Financial Safeguard Procedure with the Paris Commercial Court on 15 January 2015. The courtannounced the procedure opened on 22 January 2015 and issued the decision approving the FinancialSafeguard Plan on 27 February 2015.
On 31 March 2015, the Group issued 595 753 OSRANE (“Obligations Subordonnées Remboursables enActions Nouvelles ou Existantes”) with a nominal value of €100 per OSRANE and a coupon interest of 8%payable semi-annually (on the 1st of April and 1st of October).
The issuance was settled partly in cash, € 1 878 200, and partly, €57 697 100, against existing receivablesincluding those of listed bondholders (€ 21,1 m), Konkur Investments Limited (€ 36 m), and other currentliabilities (€ 0,6 m).
The OSRANE will be redeemed at maturity, on 1 April 2019, into 192 new or existing shares per OSRANE. Ateach coupon payment date, the bondholders might opt for early redemption and will be entitled to bonusshares (additional four shares per OSRANE and per each remaining half year). The maximum number ofshares at early redemption is limited to 220 shares per OSRANE, as of September 30, 2015.
The OSRANE bonds are traded on the regulated market of Alternext Paris under the ISIN code:FR0012600872.
Recognition of OSRANE in the Consolidated Financial Statements as of 30 June 2015
OSRANE are recognised as compound financial instruments according to IFRS 32.28 “Financialinstruments” comprising a debt component (repayment of coupon interest over 4 years) and an equitycomponent for the remaining balance.

AgroGeneration Group - Consolidated Financial Statements first half 2015 Page 13
Nominalamount
Carrying amountat recognition date
31 March 2015
Carrying amountat closing date
30 June 2015
(in thousands of Euros)
OSRANE (nominal amount) 59 575
Issuance costs (2 193)
Fair value of debt component 15 092
Amortised cost of debt component 14 338
Equity component 42 290 42 290
TOTAL 57 382 57 382 56 628
The present value of the debt component is calculated using a discount rate of 15%. The debt is amortisedover 4 years using the effective interest rate of 11,6% (this effective interest rate takes into account theissuance costs allocated to the debt and actual cash flow).
As of 30 June, 2015 the debt of OSRANE within 1 year amounts to € 3 254k.
2.2. Amendment of EBRD loan
On 15 January 2015, the Group signed an amendment to the loan agreement with effective date on31 March 2015 which included the following major changes:
· Postponing loan repayment schedule for a year (new terms: ten equal semi-annual instalmentsstarting on the 1st March 2016 with the final repayment on 3 September 2020);
· Updating definitions and ratio calculations for covenants;· Increasing of fixed part of interest rate from 8% to 8.5%.
2.3. Purchase of the new subsidiary in February 2015
In February 2015 the Group acquired 100%shares of « Agroholding Tornado”. The acquisition is financed byoperating cash flow and the consideration is payable in installments till December 2016. As of June 30, 2015the settlement made under this acquisition amounts to € 413 k.
The “Agroholding Tornado” owns a grain elevator with the storage capacity of 39,100 tons and providesfull range of grain-storage related services. The acquisition will allow the company to increase its storagecapacities.
The purchase price allocation is in progress as of June 30, 2015 and must be completed within a maximumperiod of 12 months following the effective date of the business combination.

AgroGeneration Group - Consolidated Financial Statements first half 2015 Page 14
2.4.Revaluation of the fixed assets
The Group performed revaluation of all classes of tangible assets situated in Ukraine. The revaluation wasperformed by independent appraiser as of 1 January 2015. The fair value was determined in Ukrainianhryvnia and American dollar and accounted by the Ukrainian entities in their functional currency.
At revaluation date, the total net impact on the revaluation reserve (before tax) amounted to € 24,4mwhich included the increase of fair value for some assets by € 25,8m, recognised directly in othercomprehensive income, and decrease for the other assets by €1,4m, recognised in the income statement.The details by class of asset are presented below:
(in thousands of Euros) Increase in value Decrease invalue
Net impacton revaluation surplus
Buildings 9 933 (614) 9 319Machinery and equipment 13 266 (443) 12 823Machinery and equipment under leasing 2 004 (58) 1 946Other tangible assets 606 (160) 446Tangible assets in progress 20 (99) (79)Impact of revaluation as of 1 January 2015 25 829 (1 374) 24 455
Deferred tax on revaluation (683) - (683)Net impact of revaluation as of 1 January 2015 25 146 (1 374) 23 772
Tax impact of revaluation resulted in the initial recognition of the Deferred Tax Liability amounting to €683k. These liabilities were recognised by the Ukrainian entities which are subject to the income tax. Thesecompanies having accumulated tax losses which can be off-set against future taxable profits, a DeferredTax Asset has also been recognized for the amount equivalent to the Deferred Tax Liability.
3. Financial risk management
3.1. Political risks in Ukraine
The Group conducts most of its operations in Ukraine. The Ukrainian economy while deemed to be ofmarket status continues to display certain characteristics consistent with that of an economy in transition.These characteristics include, but are not limited to, low levels of liquidity in the capital markets, highinflation, and significant imbalances in the public finance and foreign trade.
In 2014, Ukrainian political and economic situation deteriorated significantly. The political and social unrestcombined with the illegal Russian annexation of the Autonomous Republic of Crimea, full-fledged armedconfrontations with Russian-backed separatists in certain parts of the Donetsk and Lugansk regions, led tothe significant deterioration of the political and economic relations of Ukraine with the Russian Federation.These factors have contributed to the decline of key economic indices, increase of the state budget deficit,depletion of the NBU’s foreign currency reserves and, as a result, further downgrading of the Ukrainiansovereign debt credit ratings.

AgroGeneration Group - Consolidated Financial Statements first half 2015 Page 15
To date, the country’s political and economic situation is slowly improving. The conflict zone seems to befrozen with no notable military activity. As well, following an agreement with its principal creditors,Ukraine obtained a USD 17 billion loan from the IMF this summer, an encouraging sign for the country’srecovery. More recently, the Standard & Poors rating agency upgrade its rating from CCC+ to B-.
From 1 January 2015 till 30th September 2015, the Ukrainian Hryvnia (the “UAH”) depreciated against majorforeign currencies by approximately 30% calculated based on the National Bank of Ukraine (the “NBU”)exchange rate of UAH to US Dollar and EURO. The NBU imposed certain restrictions on purchase of foreigncurrencies, cross border settlements, and also strengthened requirements on obligatory conversion offoreign currency proceeds into UAH. To date the hryvnia is stable.
The known and estimable effects of the above events on the financial position and performance ofthe Group in the reporting period have been taken into account in preparing these interim condensedconsolidated financial statements.
The Government has committed to direct its policy towards the association with the European Union, toimplement a set of reforms aiming at the removal of the existing imbalances in the economy, publicfinance and public governance, and the improvement of the investment climate.
Stabilisation of the Ukrainian economy in the foreseeable future depends on the success of the actionsundertaken by the Government and securing continued financial support of Ukraine by internationaldonors and international financial institutions.
The Group has a number of farming subsidiaries in the Kharkiv oblast of Ukraine, where there is a limitedrisk in the escalation of protests and possible military conflicts as the situation has stabilized significantly.As of 30 June 2015, the carrying value of the Group’s assets located in the Kharkiv oblast is EUR 52,702thousand. Sowings of the Group in 2015 in Kharkiv oblast represents 64 267 ha.
Management is monitoring the developments in the current environment and taking actions, whereappropriate, to minimize any negative effects to the extent possible. Further adverse developments in thepolitical, macroeconomic and/or international trade conditions may further adversely affect the Group’sfinancial position and performance in a manner not currently determinable.
3.2. Risks related to changes in exchange rates
Incomes and expenses of the Group are partly exposed to changes in exchange rates, particularly the euro,the USD and the hryvnia.
Ukraine operations
Starting 9 July 2012 the National Bank of Ukraine (NBU) fixed the exchange rate for USD / hryvnia at therate of 7,993 hryvnia per 1 USD. On 6 February 2014 this measure was released and NBU stoppedsupporting the exchange rate of hryvnia. This measure together with the economic situation resulted in asharp decline of hryvnia foreign exchange rate which reached 15,77 UAH/USD as of the end of 2014. Duringthe first 6 months 2015 hryvnia continued its decline and stabilized at 21,02 UAH/USD.
The devaluation of hryvnia against the euro was in line with EURO/USD exchange rate.

AgroGeneration Group - Consolidated Financial Statements first half 2015 Page 16
Ukrainian legislation concerning the hryvnia prohibits the use of most of the exchange rate hedginginstruments that are available in other countries. Options, futures, forwards, and swaps are not available inhryvnia. Therefore, AgroGeneration does not actively cover its exposure to fluctuations in the hryvnia onfinancial markets.
The Group is partially naturally hedged against a risk of change in exchange rate of the hryvnia against theUSD. Indeed, in the scope of its operations in Ukraine, crop revenues and some of the Group’s costs(seeds, chemicals, pesticides, etc.) are influenced by worldwide commodity market in USD even ifdenominated in UAH. In case the local price is not automatically adjusted to the international market, theGroup has sufficient storage capacity to postpone its sales.
At last, the currency risk in relation to USD denominated liabilities for crop financing is partially mitigatedby the existence of USD export sales.
Financial debt
Interest rate risk sensitivity analysis
At 30 June 2015, if interest rates (for both variable-rate and fixed-rate borrowings) at that date had been 10basis points higher/lower with all other variables held constant, interest expense for the half year wouldhave been € 496k (2014 — € 792k) higher/lower.
Foreign currency exchange rate sensitivity analysis
The Group's foreign currency denominated monetary assets and liabilities as of 30 June 2015 consist ofUS dollar denominated loans and other debts. Other monetary assets and liabilities are not significant.
At 30 June 2015, if the USD had weakened/increased by 10 per cent with all other variables held constant,pre-tax profit for the year would have been € 3 640k lower/higher.
3.3. Risks related to commodities price changes
Due to the size of its grain production, the Group is exposed to fluctuations of crop prices.
For a few years now, agricultural markets have been characterized by high volatility of prices, whichdepend on world prices which are mainly formed on the stock exchanges of agricultural products. Themain factors affecting prices are the climatic factors, the level of energy and inputs prices, and theseasonality of demand.
The market for agricultural commodities in Ukraine is subject to fluctuations in agricultural commodityprices on international markets. It is also subject to conditions of Ukraine’s local demand and exportcapacity, especially when export quota policies are set up, as was the case in 2010. Since Ukraine is amember of the WTO, these quotas are intended to be exceptional and of limited duration, justified only bya significant reduction in production on a country-wide scale. To limit this risk, the Group has developed itsown storage capacity enabling it to better manage the pace of commercialization of its production.

AgroGeneration Group - Consolidated Financial Statements first half 2015 Page 17
The Group hedges against the pricing risk, making forward sales in Ukraine (sales at a fixed price withforward delivery, denominated in U.S. dollars) in the months prior to the harvest, so as to lock in its margin.The Group’s goal is to be hedged at the rate of around 30% to 40% of its production prior to the harvest.
3.4. Liquidity risks on crop financing
The main liquidity risk arises from the seasonality of agricultural production. Costs and required workingcapital reach their peak in spring ahead of the harvest. The cash inflows are concentrated in the secondhalf of the year after harvest. The Group has remedied this seasonality by acquiring its own storagecapacity which allows it to sell its production throughout the year. In addition, the management teamcontrols the liquidity risk by monitoring key performance indicators, including those regarding cash flow.
Companies face significant liquidity problems due to poor sources of foreign investment and low lendingcapacity by the domestic banking system.
The Group continues collaboration with Ukrainian private bank, Alfa-Bank, which granted a crop financing“revolver” credit line of $35m until 2019 subject to annual review, releasable in several instalments. Fromthe period between October 2014 and July 2015, Alfa-Bank provided 24,4m US dollars for the financing of2014/2015 campaign. In October 2015 the Group renewed its crop financing with Alfa-Bank for a maximumamount of €35 m. This financing will be released in successive instalments, out of which the first instalmentamounting to $6,2 m was already received and $12,8 m are rolled-over till the end of December 2016.
In addition to the above elements, the Group is putting in place alternative sources of financing, such asprepayments of forward contracts and the use of guaranteed promissory notes to pay some of the inputsuppliers. These additional sources of financing give additional comfort to continue normal operationsthrough the harvest season.
3.5. Counterparty risks
The Group is exposed to credit risks through its cash and cash equivalents, which are kept in currentaccounts and with financial institutions (local banks), its supplier credit and customer credit, which includesdelinquencies and commitments towards third parties. Credit risks are not concentrated in a particularcounterpart. Although the company receives lines of credit from many input suppliers during the season,there is no line of credit secured in advance by the company because the Group manages its positions on acase by case basis. The Group tends to work with banks and financial institutions owned by leadinginternational groups.
3.6. Capital repatriation risks
Risks related to repatriation of capital come from the investments in its Ukrainian subsidiaries. To date,foreign groups are able to repatriate their capital through dividend payments or the repayment ofshareholder loans without tax implications. AgroGeneration finances most of its investments in Ukraine viashareholder loans, normally through its Cypriot entities. The capital repatriation risks are linked to theseinvestments. Possible changes in the political environment in Ukraine or in Cyprus could lead to restrictionson repatriation of capital invested in this country.

AgroGeneration Group - Consolidated Financial Statements first half 2015 Page 18
4. Critical accounting judgments and estimates
The preparation of Financial Statements in conformity with IFRS requires the use of certain criticalaccounting estimates. It also requires management to exercise its judgment in the process of applying theGroup’s accounting policies. The areas involving a higher degree of judgment or complexity, or areaswhere assumptions and estimates are significant to the Consolidated Financial Statements are thefollowing.
Estimates and judgments are continually evaluated on the basis of historical experience and other factors,including expectations of future events that are believed to be reasonable under the circumstances.
4.1. Impairment test on intangible assets
Intangible assets are tested for impairment at each balance sheet date and whenever there are indicationsof impairment. The outcome of this exercise is highly sensitive to certain assumptions (weighted averagecost of capital, fluctuation of the commodities price (cf. Note 8 of Consolidated Financial Statements as ofDecember 31, 2014)).
4.2.Fair value of biological assets and net realisable value of agriculturalproduce
The Group’s biological assets are measured at fair value less point-of-sale costs at each balance sheet date.The fair value of biological assets varies according to climatic conditions during growth and harvest, yieldpotential and price development. A change in any of these estimates could lead to a material change in theincome statement. If the management team’s assumptions as of June 30, 2015, would have been differentby 10% better/lower, then the fair value of the biological assets and gross margin would increase/decreaseby around € 5 601 k.
The agricultural produce harvested by the Group is first fair valued at the harvest date when accounted forin inventory in the “Agricultural produce”. They are later re-valued at the lower of that fair value and thenet realizable value at the balance sheet date. The value used for agricultural produce in the assessment offair value at harvest time and subsequently for the net realizable value at the balance sheet date isdetermined based on the actual prices on the principle market and contract prices on the presold crops.
4.3. Equity-settled share-based transactions
The Group measures the cost of equity-settled transactions with employees by reference to the fair valueof the equity instruments at the date at which they are granted. Estimating fair value requires determiningthe most appropriate valuation model for a grant of equity instruments, which is dependent on the termsand conditions of the grant. This also requires determining the most appropriate inputs to the valuationmodel including the expected life of the option, volatility and dividend yield and making assumptions aboutthem. The assumptions and model used for payments made through shares within the Group are disclosedin note 26 “Share-based compensation” of Consolidated Financial Statements as of December 31, 2014.

AgroGeneration Group - Consolidated Financial Statements first half 2015 Page 19
4.4.Pre-emptive rights on land leases
Due to the existence of a moratorium on any sale of arable land in Ukraine, either to nationals orforeigners, it has been decided to recognise land leases as operational leases, and not to take into accountthe pre-emptive rights to buy the land at the term of the lease in the assessment of the qualification of thelease. The moratorium will be lifted after the laws on the State land registry and the real estate market arepassed. The deadline to pass these laws has already been pushed forward several times, and the Group isretaining this accounting method in the absence of any information concerning the actual lifting of themoratorium.
4.5. Fair value of fixed assets
Starting from 1 January 2015 the Group applies revaluation model to its tangible assets situated in Ukraine.The carrying amount of these fixed assets amounts to its fair value on 1 January 2015 (c.f. Note 2.4) lesssubsequent accumulated depreciation.
At each reporting date, the Group carries out a review of the carrying amount of these assets todetermine whether the carrying amount differs materially from fair value. The Group carries out suchreview by preparing a discounted cash flow analysis involving assumptions on projected revenues andcosts, and a discount rate. Additionally, the Group considers economic stability and the availability oftransactions with similar assets in the market when determining whether to perform a fair valueassessment in a given period.
An asset’s carrying amount is written down immediately to its recoverable amount if the asset’s carryingamount is greater than its estimated recoverable amount. An impairment loss is recognized in the incomestatement, unless the relevant asset is carried at a revalued amount, in which case the impairment loss istreated as a revaluation decrease.
5. Events after the balance sheet date
5.1. Early redemption of OSRANE bonds into shares
On 30 September 2015 some bondholders of OSRANE opted for early redemption. As a result 27 943OSRANE subordinated bonds were exchanged for 6 147 460 shares. AgroGeneration’s share capital is madeup of 98,509,388 shares.
5.2. Share warrants issuance
The 57 264 394 warrants issued to Konkur according to the terms of the agreement of merger with Harmelia(cf. Note 16 of Consolidated Financial Statements as of December 31, 2014) will not be exercisable andhenceforth they were cancelled.
Furthermore, on 25 June 2015 the Company held the Ordinary and Extraordinary General ShareholdersMeeting which authorised the Board of directors to issue subscription warrants with cancellation of the

AgroGeneration Group - Consolidated Financial Statements first half 2015 Page 20
preferential subscription rights in favour of Konkur Investments Limited. The Board of directors held on 30September issued 1 379 487 warrants for prices ranging from € 1,79 up to € 2,5.
6. Summary of significant accounting policies
The principal accounting policies applied are summarized below.
6.1. Basis of preparation
The Interim Condensed Consolidated Financial Statements for the six months ended June 30, 2015 areprepared in accordance with IAS 34 “Interim Financial Reporting”, as adopted by the European Union.They do not include all the information required for complete annual financial statements and should beread in conjunction with the Group’s Consolidated Financial Statements for the year ended December 31,2014.
Pursuant to IAS 34, the Notes to these Interim Condensed Consolidated Financial Statements are designedto:
• update the accounting and financial information contained in the last published ConsolidatedFinancial Statements at December 31, 2014;
• include new accounting and financial information about significant events and transactions thatoccurred during the period.
Except for the application of standards, interpretation and amendments being mandatory as of January 1,2015, the accounting principles used for the preparation of the Interim Condensed Consolidated FinancialStatements are identical to those used for the preparation of the Consolidated Financial Statements forthe year ended December 31, 2014. They were drawn up in accordance with IFRS, as adopted by theEuropean Union as of June 30, 2015.
(a) Standards and amendments for mandatory application in the European Union for financial years ended30 June 2015 and that may have an effect on the Group’s Financial Statements
· IFRIC Interpretation 21 Levies· Annual Improvements to IFRSs 2011–2013 Cycle
The application of these standards and amendments has had no significant impact on the Group’saccounts as of 30 June 2015.
(b) Standards and Interpretations published by IASB and approved by the EU (application of the followingtexts published by the IASB is not yet mandatory for financial periods ended 30 June 2015):
· Amendments to IAS 19 “Defined Benefit Plans”: Employee contributions

AgroGeneration Group - Consolidated Financial Statements first half 2015 Page 21
· Annual Improvements to IFRSs 2010–2012 Cycle
The potential impact of the above standards is currently under examination.
(c) Standards and Interpretations published by the IASB but not yet endorsed by the EU
· IFRS 14 Regulatory Deferral Accounts· IFRS 15 Revenue from Contracts with Customers· Amendments to IAS 16 and IAS 41: Bearer Plants (issued on 30 June 2014)· Amendments to IAS 16 and IAS 38: Clarification of Acceptable Methods of Depreciation and
Amortisation (issued on 12 May 2014)· Amendments to IFRS 11: Accounting for Acquisitions of Interests in Joint Operations· IFRS 9 Financial Instruments· Amendments to IAS 27: Equity Method in Separate Financial Statements· Annual Improvements to IFRSs 2012–2014 Cycle· Amendments to IFRS 10, IFRS 12 and IAS 28: Investment Entities: Applying the Consolidation
Exception· Amendments to IAS 1: Disclosure Initiative· Amendments to IFRS 10 and IAS 28: Sale or Contribution of Assets between an Investor and its
Associate or Joint Venture
The potential impact of the above standards are currently under examination.
6.2. Consolidation
All intercompany balances and transactions as well as income, expenses and unrealised gain/losses, whichare included in the net book value of assets, which derive from intercompany transactions, are fullyeliminated. Subsidiaries are consolidated with effect from the date of acquisition, which corresponds tothe date on which the Group obtained control, and they continue to be consolidated until the date whenthe Group loses control. The entities over which the Group does exert sole control are consolidatedaccording to the full consolidation method. The Group does not exert joint control over any of the entitieswithin its scope of consolidation as at 30 June 2015.
(a) Subsidiaries
The Consolidated Financial Statements include all subsidiaries of AgroGeneration. Subsidiaries are thoseentities controlled by the Group, in other words, whose financial and operating policies it is able to control.An entity is presumed to be controlled by AgroGeneration when the latter holds more than 50% of itsvoting rights. Potential voting rights that may be exercised or converted immediately are also taken intoaccount in assessing control of an entity.
Business combinations are accounted for under the purchase method of business, all identifiable assetsacquired, liabilities and contingent liabilities incurred or assumed are recorded at fair value at the date oftransfer of control in favour of AgroGeneration (acquisition date). The price of a business combination isassessed based on the fair value of assets given to the seller, equity instruments issued and liabilities

AgroGeneration Group - Consolidated Financial Statements first half 2015 Page 22
incurred or assumed at the date of the exchange. Any excess of the price of the business combination onthe fair value of identifiable net assets acquired, liabilities or contingent liabilities is recognised in the assetsas goodwill. If the cost of an acquisition is less than the fair value of net assets of the subsidiary acquired,the remaining difference is immediately recognised in the consolidated income statement.
(b) Non-controlling interests (NCI)
In accordance with IAS 27, acquisitions of NCI from outside the period of takeover do not generategoodwill and are charged directly to the reserves of the Group and of the NCI.
6.3. Foreign currency translation
(a) Functional and presentation currency
Items included in the Financial Statements of each Group entity are measured using the currency ofprimary economic environment in which the entity operates (“the functional currency”).
The functional currency of the parent and Cypriote subsidiaries is the euro (EUR) and the functionalcurrency of Ukrainian subsidiaries is the hryvnia (UAH).
The presentation currency of the Consolidated Financial Statements is the euro (EUR).
(b) Foreign transactions
Foreign currency transactions are translated into the respective functional currencies using the exchangerates prevailing at the dates of the transactions. Foreign exchange gains and losses resulting from thesettlement of such transactions and from the translation at year-end exchange rates of monetary assetsand liabilities denominated in foreign currencies are recognised as financial income and expense in theincome statement, except when deferred in other comprehensive income as qualifying cash flow hedgesand qualifying net investment hedges.
(c) Translation of Financial Statements expressed in foreign currencies
The income statements and balance sheets of all Group entities that have a functional currency differentfrom the presentation currency (none having a currency of a hyperinflationary economy as of30 June 2015) are translated into the presentation currency as follows:
· Assets and liabilities of the balance sheet are translated at the exchange rate of closing date,· Revenues and charges in the income statement are translated at average exchange rate for the
year,· Residual foreign exchange differences are recognised in a separate component of equity.
The exchange rates used for translating Financial Statements of subsidiaries in Ukraine are the following:

AgroGeneration Group - Consolidated Financial Statements first half 2015 Page 23
June 30, 2015 December 31, 2014 June 30, 2014
Monetary unit per € 1 Average Closing Average Closing Average Closing
Ukrainian Hryvnia (UAH) 23,7448 23,5414 15,6833 19,2329 13,9529 16,0868American Dollar (USD) 1,1193 1,1202 1,3287 1,2197 1,3709 1,3606
The rates used for the hryvnia and the U.S. dollar are those of the National Bank of Ukraine (“NBU”) inforce.
Exchange rate differences on a monetary item forming part of the net investment of the entity presentingthe Financial Statements in a foreign operation are recognised in other comprehensive income andreclassified from equity to profit or loss upon partial or total disposal of this net investment.
Goodwill and fair value adjustments recognised in the acquisition of a foreign entity are recognised asassets and liabilities of the foreign entity and translated at closing exchange rate.
6.4.Intangible assets and leasehold rights
The main intangible assets recognised are goodwill and leasehold rights. These have been recognised aspart of the business combination process. Depreciation of the leasehold rights is calculated on a linearbasis using average residual useful lives until the term of the lease contract.
The average residual term of depreciation of the leasehold rights is 7 years as of 30 June 2015.
6.5.Property, plant and equipment
Fixed assets are stated at their acquisition cost or fair value, net of depreciation and impairment losses.The fair value is estimated for the assets acquired in business combinations or for the assets situated inUkraine and applying revaluation model starting from 1 January 2015. Revaluations shall be made withsufficient regularity to ensure that the carrying amount does not differ materially from that which wouldbe determined using fair value at the end of the reporting period.
The acquisition cost of the tangible fixed assets includes all the expenses directly attributable to theacquisition of the fixed assets.
The carrying amount of the replaced limited-life component is derecognised. All other repairs andmaintenance costs are charged to the income statement during the financial period in which they areincurred.
Fixed assets are depreciated over their estimated useful lives:
· Buildings 10 – 40 years· Machinery and equipment 5 – 20 years· Other tangible assets 3 - 20 years

AgroGeneration Group - Consolidated Financial Statements first half 2015 Page 24
Production facilities represent immobile agricultural production equipment, mainly dryers and cleaners.Machinery and vehicles include other mobile agricultural equipment (tractors, combines, harvesters, seedplanters, trucks etc.).
The assets’ residual values and useful lives are reviewed, and adjusted if appropriate, at each balance sheetdate.
An asset’s carrying amount is written down immediately to its recoverable amount if the asset’s carryingamount is greater than its estimated recoverable amount.
6.6.Agriculture
(a) Definitions
The Group accounting policies for agricultural activities are based on IAS 41 "Agriculture".
Agricultural activity is defined as an activity to transform biological assets into agricultural products or intoother biological assets.
Biological assets are plants grown for a future sale which are plants in the ground, as well as livestock.
Agricultural produce are the products of the harvest of biological assets of the Group and produce receivedfrom cattle breeding, i.e. harvested grain that is stored, milk, meat and other livestock produce.
(b) Biological assets
Biological assets are measured at initial recognition and at each balance sheet date at their fair value lesspoint-of-sale cost at harvest date, except where fair value cannot be measured reliably.
The fair value of livestock is based on expected volume of milk produced during the productive lives of thedairy cattle and expected volume of meat at the date of slaughter, respective anticipated prices, averageexpected productive lives of the livestock and future production costs.
The fair value of plant-growing Biological assets is determined based on, among other estimates, weatherconditions, quality of soils, growth potential, yields, harvest conditions and price development.
As of 30 June 2015, the Group had identified for each type of plant growing biological asset their respectiveprinciple market, and measures their fair value based on the following:
(i) in determining prices
· Management assessment of future prices at the date of harvest reconciled to the UkrainianFOB prices or Western markets offset prices on the balance sheet date. These prices havebeen reduced by fobbing and transport costs.
(ii) in determining yields
· Management assessment of future yields for crop based on the most relevant recent datafrom the crop surveys carried out in the fields.

AgroGeneration Group - Consolidated Financial Statements first half 2015 Page 25
Given the nature of these input parameters, the fair value of the biological assets is categorised as Level 3as defined by IFRS 13. Change in any estimates could lead to recognition of significant fair values changes inincome statement.
Biological assets are recorded as current or non-current assets based on the operational cycle of theGroup’s biological assets.
(c) Agricultural produce
Agricultural produce harvested by the Group is initially measured at the time of harvest at its fair value lessestimated point-of-sale costs. It is subsequently recorded as inventory in “Finished Goods” and stated atthe lower of fair value at the time of harvest and net realizable value. This valuation at net realizable valueis presented in the form of inventory depreciation ("Change in fair value of finished goods", cf. Note 13).
The value of agricultural produce used for the assessment of fair value at the time of harvest andsubsequent net realizable value is determined based on the actual prices on the principle market andcontract prices on the presold crops.
(d) Work in progress (inventory of work in progress)
Work in progress is represented by the costs of preparing the land which has not been sown at balancesheet date (case of spring plants in Ukraine – corn, soybean, sunflower, etc. – when valued as of December31). The soil preparation costs are appraised on the basis of the historical costs incurred by the Group.
6.7. Current and deferred income tax
(a) General tax treatment
The current income tax charge is calculated on the basis of the tax laws enacted or substantively enactedat the balance sheet date in the countries where the Group’s subsidiaries operate and generate taxableincome. Management periodically evaluates positions taken in tax returns with respect to situations inwhich applicable tax regulations is subject to interpretation and establishes provisions where appropriateon the basis of amounts expected to be paid to the tax authorities.
The tax rates applicable on 30 June 2015 are 33,33% in France, 18% in Ukraine (see (b) Agricultural taxschemes for agricultural concerns in Ukraine) and 12,5% in Cyprus.
The deferred tax is determined using the tax rate and the tax regulations in effect or in effect in essence atthe balance sheet date and which are likely to be applied when the deferred tax assets will be used orwhen the deferred tax liability will be paid.
Deferred income tax assets are recognised to the extent that it is probable that future taxable profit will beavailable against which the temporary differences can be utilized.
However, the deferred tax is not accounted for if, at initial recognition of an asset or a liability at the timeof a transaction other than a combination of companies, the transaction has no implications for theaccounting income or the taxable income.

AgroGeneration Group - Consolidated Financial Statements first half 2015 Page 26
(b) Agricultural tax scheme for agricultural companies in Ukraine
In Ukraine, a company is considered to be a farming company if at least 75% of its revenues from theprevious fiscal year arise from the sale of agricultural products. In this case, a farming company enjoysspecial regime on corporate income tax and privileged VAT regime as described below.
· Corporate income tax: agricultural companies are not subject to corporate income tax but to thetax on land which is calculated on the basis of a percentage of the value of the land used foragricultural production. The related corresponding costs are classified in “Cost of sales”.
· Privileged VAT regime:- Revenues expenses and assets are recognized net of VAT, except where the VAT incurred on
purchase of assets or services is not recoverable from tax authorities, in which case the VAT isrecognized as part of the acquisition cost of the assets or as part of the expense item asapplicable. Receivables, payables, prepayments made and advances received are stated withthe VAT amounts included.
- The net amount of VAT recoverable from or payable to the tax authorities is recorded in aspecific account as part of other current assets or liabilities in the statement of financialposition.
- The entities eligible to the privileged VAT regime transfer net VAT payable to special restrictedaccounts and are allowed to use the funds accumulated on these accounts for the purchase ofgoods and services related to their agricultural activities, rather than remitting such amounts tothe state budget, as other taxpayers are required to do. At the same time, such entities are notallowed to claim net VAT credit for refund from the state budget. The net amount of VATpayable, established at the entity level, is recorded as deferred income on government grantsin the statement of financial position until the moment the respective entity incurred qualifyingexpenses, upon which the related amount was recognized in profit and loss as income fromgovernment grants.
Among the 26 legal entities that the Group controls in Ukraine in as of 30 June 2015, 15 are involved inagricultural production and are eligible for the special tax arrangements for agricultural companies inUkraine in 2015.
6.8.Leases – The Group as a lessee
Leases in which a significant portion of the risks and rewards of ownership are retained by the lessor areclassified as operating leases. Payments made under operating leases (net of any incentives received fromthe lessor) are charged to the income statement on a straight-line basis over the period of the lease.
Leases in which the risks and rewards incidental to the ownership of an asset are transferred substantiallyto the lessee are classified as finance leases. At the commencement of the lease, the Group recognises theasset purchased on finance lease term (cf. note 9) and the relative debt (cf. note 15) on its balance sheet atthe amount equal to the fair value of the leased asset or, if it is lower, at the present value of the minimumrent payments of the deal.

AgroGeneration Group - Consolidated Financial Statements first half 2015 Page 27
Each lease payment is allocated between the liability and finance charges and amortization of the balanceof the debt so as to achieve a constant periodic rate on the finance balance outstanding.
The assets acquired under finance leases are depreciated over the shorter of their useful life or lease termif it is lower and if the Group is not reasonably certain that it will obtain ownership by the end of the leaseterm.
6.9. Share-based payment
The fair value of services assumed to have been received in exchange for the equity instruments (warrants)issued is recognised as an expense in the income statement and in other reserves in equity during thevesting period (from the grant date of warrants until the vesting date). The fair value of the servicesreceived is determined by reference to the fair value (market value) of equity instruments granted at thegrant date.

AgroGeneration Group - Consolidated Financial Statements first half 2015 Page 28
7. Segment reporting
After the disposal of operations in Argentina occurred in 2014 (cf. Note 2.1 in Consolidated Financialstatements as of 31 December 2014), the Group has one operating segment in Ukraine, which is composedof 26 agricultural legal entities operating around 120,000 hectares of farmland.
Furthermore, all operating and financing decisions are taken on the basis of agricultural seasonperformances. Therefore, the Group presents gross margin by harvest.
(in thousands of Euros) Financial year 6 months 2015
Crops Totalcropsresult
Livestock Services& Other Total resultHarvest
2013Harvest
2014Harvest
2015
Revenue - 2 067 30 2 097 174 811 3 082
Cost of sale - (1 085) (42) (1 127) (248) (628) (2 003)Fair value of BiologicalAssets variation - - 10 797 10 797 (28) - 10 769
Gross Margin - 982 10 785 11 767 (102) 183 11 848
(in thousands of Euros) Financial year 6 months 2014
Crops Totalcropsresult
Livestock Services& Other Total resultHarvest
2013Harvest
2014Harvest
2015
Revenue 4 232 18 - 4 250 262 428 4 940
Cost of sale (4 285) (69) - (4 354) (418) (467) (5 239)Fair value of BiologicalAssets variation - 8 354 - 8 354 (96) - 8 258
Gross Margin (53) 8 303 - 8 250 (252) (39) 7 959

AgroGeneration Group - Consolidated Financial Statements first half 2015 Page 29
8. Intangible fixed assets and land leases
(in thousands ofEuros)
Gross value Depreciation Net value
Good-will
Lease-hold
rightsOthers Total
Good-will
Leaseholdrights Others Total
Good-will
Leaseholdrights Others Total
December 31, 2013 34 350 15 072 816 50 238 - (1 358) (257) (1 615) 34 350 13 714 559 48 623
Change in scope - - 4 4 - - - - - - 4 4Purchases ofassets - - 64 64 - - - - - - 64 64
Depreciation - - - - - (1 694) (99) (1 793) - (1 694) (99) (1 793)Exchange ratedifferences
(285) (6 472) (246) (7 003) - 892 90 982 (285) (5 580) (156) (6 021)
Disposals of assets - - (19) (19) - - 18 18 - - (1) (1)Other transactions - 124 (149) (25) - - 25 25 - 124 (124) -
December 31, 2014 34 065 8 724 470 43 259 - (2 160) (223) (2 383) 34 065 6 564 247 40 876
Change in scope * 2 954 - - 2 954 - - - - 2 954 - - 2 954Purchases ofassets - - 29 29 - - - - - - 29 29
Depreciation - - - - - (560) (36) (596) - (560) (36) (596)Exchange ratedifferences 749 (1 597) (55) (903) - 391 20 411 749 (1 206) (35) (492)
Disposals of assets - - - - - - - - - - - -Other transactions - - - - - - - - - - - -
June 30, 2015 37 768 7 127 444 45 339 - (2 329) (239) (2 568) 37 768 4 798 205 42 771
(*) The goodwill arising from the acquisition of Tornado (cf. Note 2.3)
As of June 30, 2015, the Group did not identify any indicator of impairment.

AgroGeneration Group - Consolidated Financial Statements first half 2015 Page 30
9. Property, plant and equipment
(in thousands ofEuros)
Gross value Depreciation Net Book Value
Build-ings
Agricultu-ral
machineryand others
Constructionin progress
andprepayments
Total Build-ings
Agricultu-ral
machinery and
others
Total Build-ings
Agricultu-ral
machinery and
others
Construction in
progressand
prepayments
Total
December 31, 2013 17 286 40 886 878 59 050 (2 070) (12 027) (14 097) 15 216 28 859 878 44 953
Change in scope - 37 (10) 27 - (21) (21) - 16 (10) 6
Purchases of assets 248 1 884 131 2 263 - - - 248 1 884 131 2 263
Depreciation - - - - (1 135) (5 047) (6 182) (1 135) (5 047) - (6 182)
Exchange ratedifferences (7 546) (18 587) (285) (26 418) 1 239 6 920 8 159 (6 307) (11 667) (285) (18 259)
Disposals of assets (176) (456) (12) (644) 21 197 218 (155) (259) (12) (426)
Other movements 51 59 (319) (209) 21 14 35 72 73 (319) (174)
December 31, 2014 9 863 23 823 383 34 069 (1 924) (9 964) (11 888) 7 939 13 859 383 22 181
Change in scope 659 49 - 708 - - - 659 49 - 708Revaluation to fairvalue
9 319 15 215 (79) 24 455 - - - 9 319 15 215 (79) 24 455
Impact ofrevaluation ondepreciation
(1 924) (9 914) - (11 838) 1 924 9 914 11 838 - - - -
Purchases of assets 85 763 32 880 - - - 85 763 32 880Depreciation - - - - (666) (2 702) (3 368) (666) (2 702) - (3 368)Exchange ratedifferences
(2 975) (5 301) (55) (8 331) (6) (23) (29) (2 981) (5 324) (55) (8 360)
Disposals of assets - (47) (1) (48) - 6 6 - (41) (1) (42)
Other movements - 2 (6) (4) - 1 1 - 3 (6) (3)
June 30, 2015 15 027 24 590 274 39 891 (672) (2 768) (3 440) 14 355 21 822 274 36 451
At June 30, 2015, total net value of property, plant and equipment acquired under finance leases amountedto €4,5 million (December 31, 2014: €4,3 million).
The total net carrying amount of tangible assets pledged as of 30 June, 2015 amounts to €11 015k (€ 4 719kpledge on buildings, and € 6 296k pledge on agricultural machinery and other tangible fixed assets).
In 2015 the Group performed revaluation of the tangible assets by independent appraiser (c.f. Note 2.4).

AgroGeneration Group - Consolidated Financial Statements first half 2015 Page 31
10. Financial assets
Non-current Current
(in thousands of Euros) Non-consolidated
subsidiaries (1)
Otherfinancialassets (2)
Termdeposit (3) Total
December 31, 2013 192 202 - 394
Change in scope - - - -Acquisition of subsidiaries - - - -Purchases of financial assets - 29 2 001 2030Disposals of financial assets - (73) - (73)Other transactions - (5) - (5)Exchange rate difference (70) - (203) (273)Depreciation - - - -December 31, 2014 122 153 1 798 2073
Change in scope - - - -Acquisition of subsidiaries - - - -Purchases of financial assets - 22 3 818 3 840Disposals of financial assets - (37) (1 356) (1 393)Other transactions - - - -Exchange rate difference (17) - (382) (399)Depreciation - - - -June 30, 2015 105 138 3 878 4 121
(1) Non-consolidated subsidiaries include 8,96% shares of Agro-Farme, acquired in March 2013, and 10%shares of Agropervomaisk, acquired in 2008.
(2) The “Other financial assets” are mainly a deposit made with a specialized financial intermediary in thescope of liquidity contract concerning transactions on the AgroGeneration share on the NYSE EuronextAlternext market. This contract has been in place since March 1, 2010, the date that the AgroGenerationsecurity was admitted to Alternext. It is in line with the code of ethics of the AFEI approved by the AMF bydecision of September 11, 2006.
The amount allocated to this liquidity contract is € 800k as of 30 June, 2015. Over the financial year 2015,and in the application of the liquidity contract, 174 000 securities were purchased at the average price of €0,44 and 183 000 securities were sold at the average price of € 0,47.
As of 30 June 2015, the situation of the contract was as follows:
· 488 515 shares valued at € 210k (€ 0,43 / share) were owned by the Group under its liquiditycontract (cf. Statement of change in consolidated shareholders’ equity on page 7),
AgroGeneration Group - Consolidated Financial Statements first half 2015 Page 32
· The cash position available under this contract came to € 125k which was shown in “Other financialassets” in the above statement.
(3) These term deposits of the Ukrainian subsidiaries are pledged as security for liabilities under the loancontracts with Alfa-Bank (cf. Note 15). These deposits may be withdrawn after the repayment of therelated loan tranches and are classified as “Financial assets (current)” (cf. Note 19).
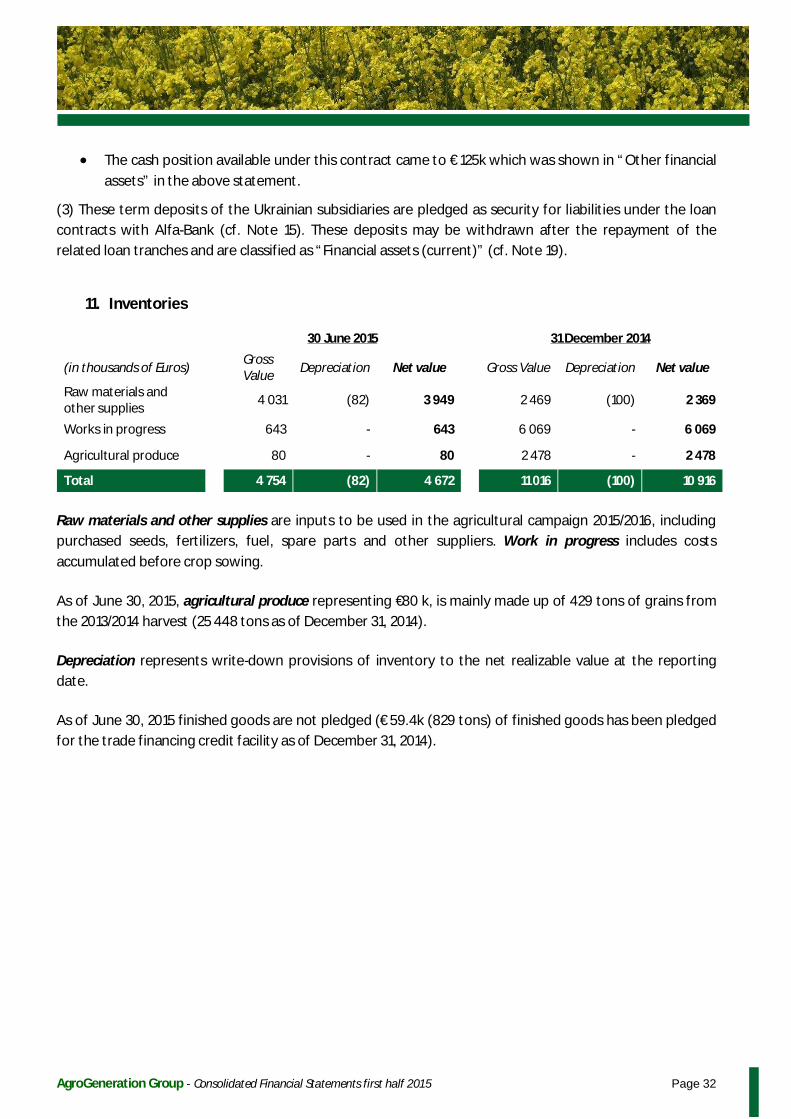
11. Inventories
30 June 2015 31 December 2014
(in thousands of Euros)GrossValue Depreciation Net value Gross Value Depreciation Net value
Raw materials andother supplies
4 031 (82) 3 949 2 469 (100) 2 369
Works in progress 643 - 643 6 069 - 6 069
Agricultural produce 80 - 80 2 478 - 2 478
Total 4 754 (82) 4 672 11 016 (100) 10 916
Raw materials and other supplies are inputs to be used in the agricultural campaign 2015/2016, includingpurchased seeds, fertilizers, fuel, spare parts and other suppliers. Work in progress includes costsaccumulated before crop sowing.
As of June 30, 2015, agricultural produce representing €80 k, is mainly made up of 429 tons of grains fromthe 2013/2014 harvest (25 448 tons as of December 31, 2014).
Depreciation represents write-down provisions of inventory to the net realizable value at the reportingdate.
As of June 30, 2015 finished goods are not pledged (€ 59.4k (829 tons) of finished goods has been pledgedfor the trade financing credit facility as of December 31, 2014).
AgroGeneration Group - Consolidated Financial Statements first half 2015 Page 33
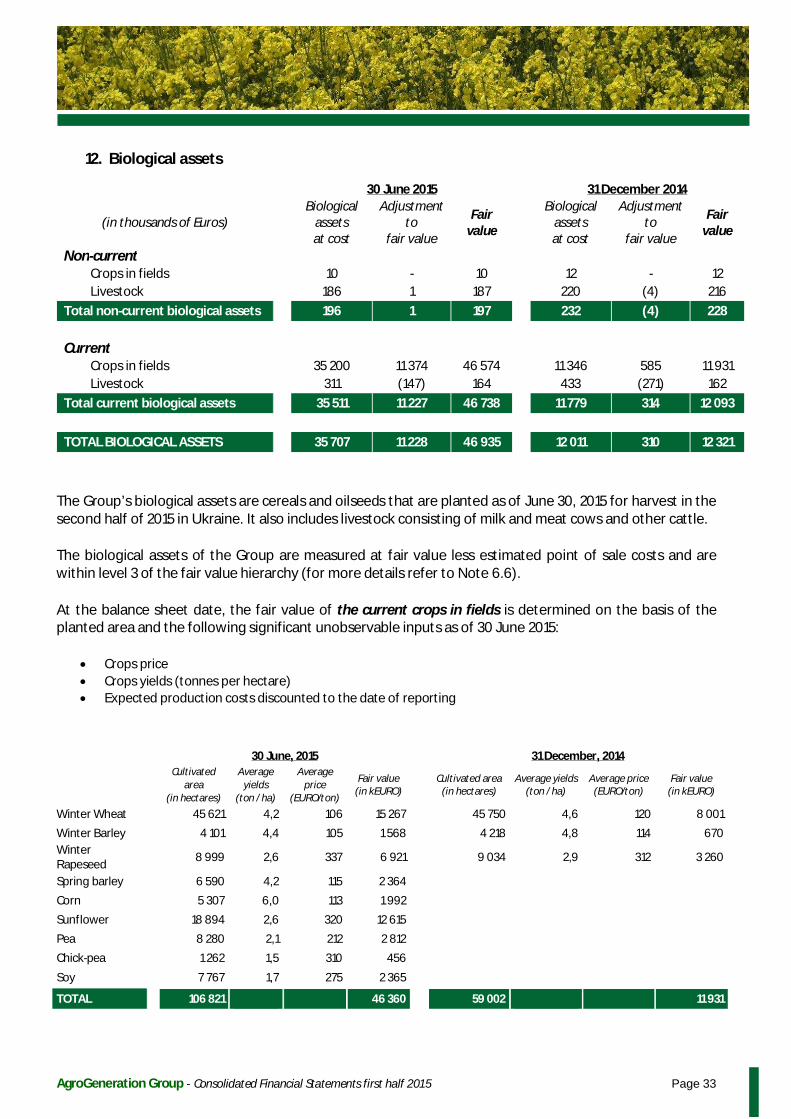
12. Biological assets
30 June 2015 31 December 2014
(in thousands of Euros)Biological
assetsat cost
Adjustmentto
fair value
Fairvalue
Biologicalassetsat cost
Adjustmentto
fair value
Fairvalue
Non-currentCrops in fields 10 - 10 12 - 12Livestock 186 1 187 220 (4) 216
Total non-current biological assets 196 1 197 232 (4) 228
CurrentCrops in fields 35 200 11 374 46 574 11 346 585 11 931Livestock 311 (147) 164 433 (271) 162
Total current biological assets 35 511 11 227 46 738 11 779 314 12 093
TOTAL BIOLOGICAL ASSETS 35 707 11 228 46 935 12 011 310 12 321
The Group’s biological assets are cereals and oilseeds that are planted as of June 30, 2015 for harvest in thesecond half of 2015 in Ukraine. It also includes livestock consisting of milk and meat cows and other cattle.
The biological assets of the Group are measured at fair value less estimated point of sale costs and arewithin level 3 of the fair value hierarchy (for more details refer to Note 6.6).
At the balance sheet date, the fair value of the current crops in fields is determined on the basis of theplanted area and the following significant unobservable inputs as of 30 June 2015:
· Crops price· Crops yields (tonnes per hectare)· Expected production costs discounted to the date of reporting
30 June, 2015 31 December, 2014Cultivated
area(in hectares)
Averageyields
(ton / ha)
Averageprice
(EURO/ton)
Fair value(in kEURO)
Cultivated area(in hectares)
Average yields(ton / ha)
Average price(EURO/ton)
Fair value(in kEURO)
Winter Wheat 45 621 4,2 106 15 267 45 750 4,6 120 8 001
Winter Barley 4 101 4,4 105 1 568 4 218 4,8 114 670WinterRapeseed 8 999 2,6 337 6 921 9 034 2,9 312 3 260
Spring barley 6 590 4,2 115 2 364
Corn 5 307 6,0 113 1 992
Sunflower 18 894 2,6 320 12 615
Pea 8 280 2,1 212 2 812
Chick-pea 1 262 1,5 310 456
Soy 7 767 1,7 275 2 365
TOTAL 106 821 46 360 59 002 11 931

AgroGeneration Group - Consolidated Financial Statements first half 2015 Page 34
If the management team’s assumptions as of June 30, 2015, would have been different by 10% better/lower,then the fair value of the biological assets and gross margin would increase/decrease by around € 5 601k.
The significant unobservable inputs used in the fair value measurement of the livestock are as follows:
· Average number of heads and its weight· Expected future inflows from livestock
The following table represents movements in biological assets for the year ended 31 December 2014 andthe first-half 2015:
(in thousands of Euros) Crops Livestock TOTAL
Book value as of December 31, 2013 10 094 609 10 703
Current Biological Assets 10 073 325 10 398Non-current Biological Assets 21 284 305
Acquisition of subsidiaries - - -Acquisition of non-current biological assets - - -Reclassification of work in progress to biologicalassets 7 667 - 7 667
Costs incurred over the period 41 633 826 42 459Biological assets decrease due to harvest (54 643) (642) (55 285)Gain/loss due to change in fair value 12 881 (149) 12 732Impairment of biological assets - - -Exchange rate differences (15 127) (266) (15 393)Other movements - - -Book value as of December 31, 2014 11 943 378 12 321
Current Biological Assets 11 931 162 12 093Non-current Biological Assets 12 216 228
Reclassification of work in progress to biologicalassets
4 655 - 4 655
Costs incurred over the period 21 237 318 21 555Biological assets decrease due to harvest (62) (248) (310)Gain/loss due to change in fair value 10 797 (28) 10 769Impairment of biological assets (116) - (116)Exchange rate differences (1 870) (69) (1 939)Other movements - - -Book value as of June 30, 2015 46 584 351 46 935
Current Biological Assets 46 574 164 46 738Non-current Biological Assets 10 187 197
As of 30 June, 2015 € 24 962k (58 990 ha) of biological assets have been pledged for the trade financingcredit facility (cf. Notes 15).

AgroGeneration Group - Consolidated Financial Statements first half 2015 Page 35
13. Trade and other receivables
(in thousands of Euros) June 30, 2015 December 31, 2014
Trade receivables 332 993Prepayments to suppliers (1) 219 287Other receivables 315 1 325Social and tax receivables (excl. VAT receivables) 129 169VAT receivables (2) 3 736 1 417Prepaid expenses 71 910Trade and other receivables 4 802 5 101
(in thousands of Euros) June 30, 2015 December 31, 2014
Currency:Denominated in EUR 529 236Denominated in USD 41 1 227Denominated in UAH 4 232 3 638Trade and other receivables 4 802 5 101
The maximum exposure to credit risk as at the balance sheet date amounts to the fair value of each classof receivables mentioned above. The Group has no collateral for hedging.
(1) The advances paid correspond to prepayments to suppliers of inputs for the 2015 harvest.
(2) The VAT receivable of €3 736k includes:
€1 569k related to the Ukrainian entities enjoying special agricultural regime (Note 6.7 (b)).
€1 705k related to the Ukrainian entities that did not opt for the special tax scheme for agriculturalproducers. It represents input VAT received at purchases that has been declared and is to decrease futureVAT obligations.
€462k related to the input VAT of AgroGeneration SA.

AgroGeneration Group - Consolidated Financial Statements first half 2015 Page 36
14. Cash and cash equivalents
(in thousands of euros) June 30, 2015 December 31, 2014
Cash at bank and in hand 1 609 5 415Investment securities - -
Cash and cash equivalents 1 609 5 415
Bank overdraft - -Net cash & cash equivalent 1 609 5 415
The Cash and cash equivalents are denominated in the following currencies as of June 30th, 2015:
June 30, 2015 December 31, 2014
(in thousands of euros) Cash and cash equivalents Cash and cash equivalentsCurrency :
Denominated in EUR 43 48
Denominated in USD 1 011 2 602
Denominated in UAH 555 2 765
Total 1 609 5 415
15. Borrowings
June 30, 2015 December 31, 2014
(in thousands ofeuros)
Non-current
Current TOTALNon-
currentCurrent TOTAL
Borrow-ings
Borrow-ings Interest Total
Borrow-ings
Borrow-ings Interest Total
OSRANE (1) 11 084 3 254 1 188 4 442 15 526 - - - - -
Listed bonds - - - - - 19 784 411 411 20 195
Konkur bonds - - 527 527 527 32 795 2 564 2 564 35 359
Financial lease (2) 871 1 558 39 1 597 2 468 1 191 1 824 56 1 880 3 071
Bank borrowings (3) - 29 767 499 30 266 30 266 4 592 18 831 377 19 208 23 800Other financialdebt
(4) - 3 002 12 3 014 3 014 159 19 178 178
Totalborrowings 11 955 37 581 2 265 39 846 51 801 58 362 20 814 3 427 24 241 82 603
(1) The liability component of OSRANE (c.f. Note 2.1) was initially recognised at its fair value net oftransaction costs and amounted to €15,1 m. As of 30 June 2015, the amortised cost amounts to €14,3 m andaccrued interest to €1,2 m.

AgroGeneration Group - Consolidated Financial Statements first half 2015 Page 37
(2) Current and non-current lease payments are presented at the present value of the future minimumlease payments (cf. Note 25).
(3) Bank borrowings include borrowing from Alfa-Bank (€23,6 m), and EBRD (€6,2 m).
In the scope of the borrowings with Alfa-Bank, the Group has pledged part of its current and non-currentassets including:
· Some of the Fixed assets (Buildings and Agricultural machinery; cf. Note 9),· Short-term deposits (cf. Note 10),· Some of the biological assets (cf. Notes 12),· Shares in Ukrainian and Cyprus subsidiaries
The shares in the subsidiaries Marrimore, AJU, AFU and UCD are pledged to the benefit of the EuropeanBank of Reconstruction and Development (EBRD) in the scope of the financing agreement signed in 2011.In accordance with the agreement signed on September 29, 2011, EBRD obtained 850 000 warrants whichentitle EBRD for additional 850 000 shares with exercise price of €2,05, these warrants have been classifiedas equity instruments.
The loans granted by the Alfa-Bank and the EBRD are subject to covenants. The Group is not compliantwith some of these covenants. Thus the EBRD loan is classified as of 30 June 2015 as short-term debt. TheGroup is currently in the process of obtaining the waivers relating to the breach of these covenants.
(4) Other financial debt relate to the borrowings from a private investor (€2,1 m) and related party SBTInvestment (€0,9 m).
The maturity of the current and non-current borrowings is as follows:
(in thousands of euros) 2 016 2 017 2 018 2019 and after Total
OSRANE 4 442 3 638 4 078 3 368 15 526Listed bonds - - - - -Konkur bonds 527 - - - 527Financial lease 1 597 401 375 95 2 468Bank borrowings 30 266 - - - 30 266Other financial debt 3 014 - - - 3 014Total borrowings 39 846 4 039 4 453 3 463 51 801
Details of the variable-rate and fixed-rate borrowings:
June 30, 2015 December 31, 2014(in thousands of euros) Variable Fixed Variable Fixed
OSRANE - 14 338 - -Bonds - - - 55 554Bank borrowings 6 200 23 567 5 849 17 951Financial lease 1 150 1 279 1 343 1 728Other financial debt - 3 002 - 178Total borrowings 7 350 42 186 7 192 75 411

AgroGeneration Group - Consolidated Financial Statements first half 2015 Page 38
The carrying amounts of the Group’s borrowings are denominated in the following currencies:
(in thousands of euros) June 30, 2015 December 31, 2014Currency:EUR 16 160 21 117USD 31 211 61 484UAH 4 430 2Total borrowings 51 801 82 603
The average interest rates of the Group by currency are:
Currency June 30, 2015 December 31, 2014
EUR 8,6% 8,4%
USD 13,6% 10,6%
UAH 19% -
16. Share Capital
Share capital in euros Number of shares Share premium ineuros
December 31, 2013 4 618 096 92 361 928 166 467 669
Additional shares issued - - -
December 31, 2014 4 618 096 92 361 928 166 467 669
Additional shares issued - - -
June 30, 2015 4 618 096 92 361 928 166 467 669
Instruments in circulation as of 30 June, 2015
As of June 30, 2015, the financial instruments in circulation and the respective numbers of shares that couldbe issued by exercise of these instruments are presented below:
Note Number of instruments Potential additional sharesBSPCE 5 327 106 540Stock-options 1 317 833 1 317 833EBRD warrants 850 000 850 000
OSRANE (1) 595 753 131 065 660
Total number of potential additional shares 133 340 033
(1)The number of OSRANE potential additional shares is calculated considering 220 shares per OSRANE (thenumber maximum which could be redeemed).

AgroGeneration Group - Consolidated Financial Statements first half 2015 Page 39
17. Provisions
(in thousands of euros)Provisions for
litigation
Provisions forliabilities and
expenses
Provisions forrestructuring Total
December 31, 2013 559 4 100 663
Additionnal - - - -Reversal (used) (163) - (100) (263)Reversal (unused) (279) (4) - (283)Change in perimeter - - - -Other variations - - - -Exchange rate differences (117) - - (117)December 31, 2014 - - - -
Additionnal - - - -Reversal (used) - - - -Reversal (unused) - - - -Change in perimeter - - - -Other variations - - - -Exchange rate differences - - - -June 30, 2015 - - - -
In 2013 the Group accrued the provision for litigation relating to the usage of land rights. The appeal courtwas lost by AgroGeneration in April 2014. The amount provided (€412 k) includes missed profit of thirdparty and court expenses. In May 2014 Supreme Court of Appeal cancelled the decision of appeal court infavour of AgroGeneration, therefore, the provision was reversed in 2014.
The management closely monitors legal and tax litigations and assesses the relating risks. As of30 June, 2015, the Group is not exposed to any other significant legal or tax litigation.
18. Trade and other payables
(in thousands of Euros) June 30, 2015 December 31, 2014
Trade payables 14 073 5 029
Advance payments received 6 984 1 049
Social & tax payables 1 295 1 302
VAT payables (1) 24 468
Deffered income 125 281
Other payables 3 381 765
Payables on subsidiary's purchase 2 852 -
Trade and other payables 28 734 8 894
(1) VAT payables represents the amount paid to the special restricted account and can be used to fund thepurchase of goods and services for agricultural activities. Once it is used, it will be reclassified to governmentgrant in P&L (Note 6.7 (b)).

AgroGeneration Group - Consolidated Financial Statements first half 2015 Page 40
The Trade and other payables are denominated in the following currencies :
(in thousands of Euros) June 30, 2015 December 31, 2014
Currency:
Denominated in EUR 2 041 1 290
Denominated in USD 6 242 2 421
Denominated in UAH 20 451 5 183
Trade and other payables 28 734 8 894
19. Financial assets and liabilities
Financial assets and liabilities are classified as follows in accordance with IFRS 7:
Financial assets and liabilities by category and fair value as of 30 June 2015
(in thousands of Euros)
Measuredat
amortisedcost
Measured at fairvalue
Totalcarryingamount30 June
2015
Valuedat cost
Financial instrument at fair valuehierarchy under IFRS 7
Note
throughprofit or
loss
throughshare-
holders'equity
Level 1:quotedprices
andcash
Level 2:valuationbased on
obser-vable
marketdata
Level 3:valuationbased onunobser-
vablemarket
data
Assets
Financial assets (non-current) 10
Shares in non-consolidatedsubsidiaries
105 105 105
Other financial assets 1 137 138 1 137
Financial assets (current) 10Term deposits 3 878 3 878 3 878
Trade and otherreceivables 13
4 802 4 802 4 802
Cash and cash equivalents 14 1 609 1 609 1 609
Liabilities
OSRANE 15 (15 526) (15 526) (15 526)
Bonds 15 (527) (527) (527)Non-current and currentbank borrowings 15
(30 266) (30 266) (30 266)
Non-current and currentfinancial lease 15 (2 468) (2 468) (2 468)
Other financial debt 15 (3 014) (3 014) (3 014)
Trade and other payables 18 (28 734) (28 734) (28 734)

AgroGeneration Group - Consolidated Financial Statements first half 2015 Page 41
Financial assets and liabilities by category and fair value as of 31 December 2014
(in thousands of Euros)
Measuredat
amortisedcost
Measured at fairvalue
Totalcarryingamount
31December 2014
Valuedat cost
Financial instrument at fair valuehierarchy under IFRS 7
Note
throughprofit or
loss
throughshare-
holders'equity
Level 1:quotedprices
and cash
Level 2:valuation based
onobser-vable
marketdata
Level 3:valuationbased onunobser-
vablemarket
data
Assets
Financial assets (non-current) 10
Shares in non-consolidatedsubsidiaries 122 122 122
Other financial assets 1 152 153 1 152
Financial assets (current) 10Term deposits
1 798 1 798 1 798Trade and otherreceivables 13 5 101 5 101 5 101
Cash and cash equivalents 14 5 415 5 415 5 415
Liabilities
Bonds 15 (55 554) (55 554) (55 554)Non-current and currentbank borrowings 15 (23 800) (23 800) (23 800)Non-current and currentfinancial lease 15 (3 071) (3 071) (3 071)
Other financial debt 15 (178) (178) (178)
Trade and other payables 18 (8 894) (8 894) (8 894)
20. Revenues from operating activities
(in thousands of euros) first-half 2015 first-half 2014
Sales of agricultural produce (1) 2 271 4 501Services and others (2) 811 439
Total revenue from operating activities 3 082 4 940
(1) In first-half 2015, AgroGeneration sold 15 011 tons of cereals and oilseeds
(2) The services are mainly composed of activities of drying, storage or loading grain for third parties.

AgroGeneration Group - Consolidated Financial Statements first half 2015 Page 42
21. Functional costs / costs by nature
(in thousands of euros) first-half 2015 first-half 2014
Cost of sales (2 003) (5 239)
Administrative & Selling expenses (5 000) (6 669)
Costs by function (7 003) (11 908)
Raw materials, purchases services and leasing (3 545) (7 676)
Personnel costs (1 711) (2 684)
Depreciation (1 107) (1 736)
Fair value adjustment at the harvest date (for goods sold) 53 952
Other expenses (693) (764)
Costs by nature (7 003) (11 908)
On average, in first-half 2015 the Group had 1 471 employees.
22. Other income and expense
(in thousands of euros) first-half 2015 first-half 2014
Proceeds from fixed assets sold 48 63Revers of litigation provision - 313Government grant 378 1 718Other income 245 458Other operating Income 671 2 552
Net book value of fixed assets sold (46) (209)Impairment of fixed assets (1) (1 113) -Other expenses (212) (264)
Other operating expenses (1 371) (473)
Other operating income and expenses (700) 2 079
(1) Decrease in value of fixed assets consequent to the revaluation (cf Note 2.4). The difference betweenvalues of impairment of fixed assets recognized in the income statement and presented in Note 2.4 isattributed to the different exchange rates applied. In the Note 2.4 decrease in value of fixed assets wastranslated at the spot rate at the date of revaluation, whereas impairment of fixed assets recognized in theincome statement was translated at the average exchange rate for the period of 6 months ended 30 June2015.

AgroGeneration Group - Consolidated Financial Statements first half 2015 Page 43
23. Net financial income / (expenses)
(in thousands of euros) first-half 2015 first-half 2014
Cost of debt (1) (4 140) (4 087)Foreign exchange gains and losses (8 330) (12 607)
realised foreign exchange gains/losses (2) (231) (643)
unrealised foreign exchange gains/losses (3) (8 099) (11 964)
Other (4) 632 9Net financial expense (11 838) (16 751)
Interest expense
(1) Cost of debt is mostly composed of:
€435 k interest on OSRANE bonds;€1 523 k interest on listed and Konkur bonds;€2 292 k interest on bank loans.
Foreign exchange gains and losses
The Group's foreign currency denominated monetary assets and liabilities as of 30 June 2015 consist of USDand EURO denominated loans and other debts. Other monetary assets and liabilities are not significant.
Due to the impact of the current political situation on the volatility of Ukrainian hryvnia (cf. Note 3.2), theexchange rate Ukrainian hryvnia/USD fluctuated during the year and as of reporting date decrease from15,77 UAH/USD on 31 December 2014 to 21,02 UAH/USD on 30 June 2015.
(2) Realised Foreign exchange gains and losses (net amount €231 k loss) generated by the Group in the first-half 2015 due to the change in foreign exchange rate between the dates when the invoice was received /issued and when the liability/asset was settled.
(3) Unrealised Foreign exchange gains and losses generated by the Group in the first half of 2015 due to thetranslation of all monetary items of Ukrainian entities (mostly bank loans and intercompany loans) fromforeign currency (mostly USD) into functional currency (UAH). Unrealised foreign exchange loss generatedincluded:
· €3 768 k loss related to the bank loans and other debt;· €2 690 k loss related to the inter-company loans, interest on loans and other ICO debt between
Ukrainian, Cyprus and French entities.· €1 641 k loss related to the redemption of Konkur bonds with OSRANE bonds.
Note that certain intercompany loans are classified as net investments (cf Note 6.3), therefore,corresponding unrealised foreign exchange loss (€ 15 101 K) is recognised directly in equity.

AgroGeneration Group - Consolidated Financial Statements first half 2015 Page 44
Other financial income and expenses
(4) The net amount of other financial income includes the income for amount of €487 k related to therecognition of payables at amortized costs.
24. Earnings per share
The basic earnings per share are calculated by dividing:
· The net earnings (group share)· By the weighted average number of ordinary shares in circulation during the financial year.
The diluted earnings per share are calculated by dividing:
· The net earnings (group share) taking into account the instruments that cause dilution,· By the weighted average number of ordinary shares in circulation during the financial year plus the
weighted average number of ordinary shares that would have been issued following theconversion of all the potential ordinary shares that cause dilution into ordinary shares.
(in thousands of euros) first-half 2015 first-half 2014
Net consolidated income / (loss) - group from continued activity (K€) (5 410) (13 357)Net consolidated income / (loss) - group from discontinued activity (K€) - 1 429
Net consolidated income / (loss) - group share (K€) (4 410) (11 928)
Dilution impact (K€) 435 -
Net consolidated income / (loss) after dilution impact (4 975) (11 928)
Weighted average number of ordinary shares 91 868 083 91 948 633
Potential dilution 98 748 100 -
Weighted average number of shares after dilution impact 190 616 183 91 948 633
Net income / (loss) per share (Euros) - group share (0,06) (0,13)
Net income / (loss) per share (Euros) after dilution - group share (0,03) (0,13)
Net income / (loss) per share (Euro) - from continued operations (0,06) (0,15)
Net income / (loss) per share (Euro) after dilution - from continued operations (0,03) (0,15)
Net income / (loss) per share (Euros) - from discontinued operations - 0,02
Net income / (loss) per share (Euros) after dilution - from discontinued operations - 0,02
As of June 30th, 2015, the weighted average number of shares after dilution includes the maximum numberof potential shares from OSRANE early redemption.

AgroGeneration Group - Consolidated Financial Statements first half 2015 Page 45
However, the potential ordinary shares that would have been issued after the conversion of the stock-options and warrants are not included in the measurement, since they have an anti-dilutive effect.
25. Commitments
25.1. Financing-related commitments
The Group’s commitments related to debt and financial instruments are discussed in Note 15.
25.2. Commitments related to operating activities
Non-current assets acquired under finance leases are recognized as an asset and a liability in theconsolidated balance sheet.
At June 30, 2015, €2 429 thousands of future minimum lease payments due under finance leases concernedagricultural machinery and vehicles. Total assets under finance leases recognized in consolidated assetsamounted to €4,5 million at June 30, 2015 (December 31, 2014: €4,3 million).
(in thousands of Euros) June 30, 2015 31 December 2014
Future minimum lease paymentsDue within 1 year 1 918 2 307Due in 1 to 5 years 1 084 1 506Due beyond 5 years - -
Total minimum lease payments 3 002 3 813
Less finance cost (573) (798)
Present value of future minimum lease payments 2 429 3 015

AgroGeneration Group - Consolidated Financial Statements first half 2015 Page 46
26. Transactions with related parties
Material transactions entered into over the period and remaining balances as at 30 June 2015 with partiesthat have significant influence over the Group are as follows:
30 June 2015 first-half 2015 31 December 2014 2014
kEURO ASSETSLIABILITI
ES INCOME EXPENSE ASSETSLIABILITIE
S INCOME EXPENSE
SigmaBleyzer group : various entities under common control
Management Fees (108) (130) - (318)
Bonds issued to Konkur (32 795)Interest on bonds(Konkur) (527) (575) (2 564) (2 408)
Consulting services (270) (66) (5) (273)
Rent of premises - (6)
Loans (893) 315 (83) (1)
Gravitation SAS : shareholderRe-invoicing of rent andoffice expenses 16 10 28 88 (3)
Consulting services (108) (29) (151)
Group Vivescia shareholder
Interest on debt (15)
Other debt payable (69)
Safari Arms : controlled by a member of the Board of Directors
Security services (168) (876) (166) (1 643)Raw materials and othersupplies 2 (17)
John Shmorhun Key management
Consulting services (7) (261) (82) (412)
Cordial Consulting : Controlled by a member of the Board of Directors
Consulting services (77) (193)
TOTAL 18 (2 081) 10 (1 954) 343 (35 841) 88 (5 423)

AgroGeneration Group - Consolidated Financial Statements first half 2015 Page 47
27. List of consolidated companies
All companies are fully consolidated.
Name Conso name Registered office30 June 2015 31 December 2014
Activity
% of interest % of interest
1 AgroGeneration AgroGeneration Paris - France Group Holding Consolidating entityConsolidating
entity2 Marrimore Holdings Ltd Marrimore Nicosia - Cyprus Holding company 100% 100%3 Haberly Properties Ltd Haberly Nicosia - Cyprus Holding company 100% 100%
4Harmelia InvestmentsLimited Harmelia Nicosia - Cyprus Holding company 100% 100%
5 Zeanovi Limited Zeanovi Nicosia - Cyprus Holding company 100% 100%
6Wellaxo InvestmentsLimited Wellaxo Nicosia - Cyprus Holding company 100% 100%
7 Azent Limited Company Azent Nicosia - Cyprus Holding company 100% 100%8 Zito Investments Limited Zito Nicosia - Cyprus Holding company 100% 100%
9 UCD Ukraine UCD UA Kiev - Ukraine Service operatingcompany
100% 100%
10 LLC Agro NovaNyva ANN Kiev - UkraineService operating
company 100% 100%
11 Agrofuel Ukraine Agrofuel Kiev - Ukraine Trading company 100% 100%
12 AFT-Agro AFT Kiev - Ukraine Service operatingcompany 100% 100%
13 Agroziom AGZ Sumy - Ukraine Agricultural producer 100% 100%14 Vinal Agro VKD Lviv - Ukraine Agricultural producer 100% 100%15 Knyazhi Lany (VKL) VZL Lviv - Ukraine Agricultural producer 100% 100%16 Zborivski Lany (VZB) VZL Ternopol - Ukraine Agricultural producer 100% 100%
17 Agrodruzstvo JevisoviceUkraine AJU Ternopol - Ukraine Agricultural producer 100% 100%
18 Lishchynske* VLY Zhitomir - Ukraine Agricultural producer 100% 100%
19 Vidrodzhennya* VZH Zhitomir - Ukraine Service operatingcompany - 100%
20 Agro Fund Terestchenko AFT Zhitomir - Ukraine Agricultural producer 100% 100%
21 APK Novy Stil LLC NST Kharkiv - Ukraine Service operatingcompany 100% 100%
22 APK Donets LLC DON Kharkiv - Ukraine Agricultural producer 100% 100%23 Burlukskoje PC BUR Kharkiv - Ukraine Agricultural producer 100% 100%24 Zachepilovskoje LLC ZACH Kharkiv - Ukraine Agricultural producer 100% 100%25 AF Barvenkovskaya LLC BAR Kharkiv - Ukraine Agricultural producer 100% 100%
26 APK Ukraina Nova LLC APK Kharkiv - Ukraine Service operatingcompany
100% 100%
27 AF Podoljevskaja LLC POD Kharkiv - Ukraine Agricultural producer 100% 100%
28 FG Podoljevskaja POD Kharkiv - Ukraine Service operatingcompany
100% 100%
29 AF Ukraina Nova LLC UNA Kharkiv - Ukraine Agricultural producer 100% 100%30 Lan LLC LAN Kharkiv - Ukraine Agricultural producer 100% 100%31 Vybor LLC VYB Kharkiv - Ukraine Agricultural producer 100% 100%32 Harmelia Trading LLC HAR Kharkiv - Ukraine Trading company 100% 100%
33 Agro Dom Plus AgroDom Kharkiv - Ukraine Service operatingcompany
100% 100%
34 Register LLC Register Kharkiv - Ukraine Service operatingcompany 100% 100%
35 Tornado Agro-holding PC ** Tornado Kharkiv - Ukraine Service operatingcompany
100% -
* Vidrodzhennya was merged with another subsidiary of the Group, Lishchynske, in February 2015 and ceased to exist as a separatelegal entity.
** Tornado Agro-holding PC was acquired by the Group on 17 February 2015.