nn - cds.cern.ch
TRANSCRIPT
Effect of limited statistics on higher order cumulants measurementin heavy-ion collision experiments.
Ashish Pandav,1, ∗ Debasish Mallick,1, † and Bedangadas Mohanty1, ‡
1School of Physical Sciences, National Institute of Science Education and Research, HBNI, Jatni 752050, India
We have studied the effect of limited statistics of data on measurement of the different order of cumulantsof net-proton distribution assuming that the proton and antiproton distributions follow Possionian and Binomialdistributions with initial parameters determined from experimental results for two top center of mass energies(√sNN= 200 and 62.4 GeV) in most central (0 − 5%) Au+Au collisions at Relativistic Heavy Ion Collider(RHIC). In this simulation, we observe that the central values for higher order cumulants have a strong depen-dence on event sample size and due to statistical randomness the central values of higher order cumulants couldbecome negative. We also present a study on the determination of the statistical error on cumulants using deltatheorem, bootstrap and sub-group methods and verified their suitability by employing a Monte Carlo procedure.Based on our study we find that the bootstrap method provides a robust way for statistical error estimation onhigh order cumulants. We also present the exclusion limits on the minimum event statistics needed for determi-nation of cumulants if the signal strength (phase transition or critical point) is at a level of 5% and 10% abovethe statistical level. This study will help the experiments to arrive at the minimum required event statistics andchoice of proper method for statistical error estimation for high order cumulant measurements.
PACS numbers: 25.75.-q, 25.75.Gz; 12.38.-t
I. INTRODUCTION
Relativistic collision of heavy nuclei, by varying center ofmass collision energy (√s
NN), allows us to map the quantum
chromodynamics (QCD) phase diagram characterized by tem-perature T and baryonic chemical potential µB [1–8]. LatticeQCD calculations suggest a smooth crossover transition fromhadronic matter (a state of confined quarks and gluons) to adeconfined state of quarks and gluons for µB = 0 at certain fi-nite T [9]. Also at larger value of µB , theoretical QCD modelpredictions of a first-order phase boundary [10, 11] and exis-tence of the QCD critical point [12, 13] are the motivationsfor carrying out high energy heavy-ion collision with varyingbeam energies. Higher order cumulants of conserved quan-tities such as the net-baryon, net-charge, and net-strangenessnumbers, as a function of beam energy, are expected to shownon-monotonic behaviour near the critical point [14, 15]. Nearthe QCD critical point, the third order cumulant (or skewness)and fourth order cumulant (or kurtosis) of net-baryon are ex-pected to be negative valued [16, 17] while the sixth ordercumulant of both net-baryon and net-charge distribution is ex-pected to be negative near a crossover phase transition [18].Using heavy-ion collider facility at RHIC, STAR experimenthas performed measurements on higher order moments of net-proton [4, 5], net-charge [6] and net-kaon [7] multiplicity dis-tributions. PHENIX experiment at RHIC also has carried outmeasurements of moments of net-charge distributions [19]. Atthe Large Hadron Collider (LHC), ALICE experiment is alsostudying higher order moments to characterize the nature andorder of the QCD phase transition [20–22].
Higher order cumulants of net-baryon and net-charge
∗Electronic address: [email protected]†Electronic address: [email protected]‡Electronic address: [email protected]
fluctuations are predicted to be sensitive to the nature of theQCD transition (crossover and chiral). In particular, ratios ofthe sixth to second and eighth to second order cumulants ofthe net-baryon number fluctuations change rapidly and thesixth order cumulants of both net-baryon and net-charge arepredicted to remain negative if the system formed in suchcollisions freeze-out in the proximity of crossover region ofthe QCD phase diagram [18, 23]. The STAR experimentreported a preliminary result on centrality dependence ofC6/C2 of net-proton and net-charge distribution in Au+Aucollisions at √sNN= 200 GeV [24]. C6/C2 of net-protondistribution exhibits −ve values systematically across pe-ripheral (70 − 80%) to most central (0 − 5%) collisions andnet-charge results shows −ve values only for most central(0 − 5%) collisions. Further STAR experiment has reportedpreliminary results that reveal a non-monotonic variationof ratio of fourth order cumulant to second order cumulantof net-proton distributions (C4/C2) with beam energy [25].This trend in measurement is similar to as expected, if thesystem traverses in the vicinity of a critical point in the QCDphase diagram. However due to finite size and time effectsthe signals corresponding to phase transition and critical pointas discussed above are expected to be small. A high statisticsrun as part of the second phase of the Beam Energy Scanprogram at RHIC is envisaged to make a statistically moreaccurate measurement of C4/C2 [2, 3].
In this work, via Monte Carlo simulation, we investigatedthe effect of limited statistics on the values of higher ordercumulants up to C7 within two statistical distribution models.In the first model, net-proton distribution is taken as a Skel-lam distribution (assuming proton and antiproton distributionsare Poissonian) where the input parameters are mean (C1) ofexperimentally measured proton and antiproton distributionsfrom STAR experiment. In the second model, net-proton isobtained from the difference of binomially distributed protonsand antiprotons, where the experimental value of mean (C1)
arX
iv:1
809.
0889
2v1
[nu
cl-e
x] 2
4 Se
p 20
18
2
and variance (C2) of proton and antiproton are used to char-acterize the input binomial distributions. We have performedthis study for two top energies (√s
NN= 200 and 62.4 GeV)
of heavy-ion (Au) collision at RHIC, the energy region wheresignals of crossover transition are predicted to manifest. How-ever the conclusions of the work remain valid for both higherand lower beam energies. In this study, we see that the esti-mated higher order cumulants, especially in the case of rel-atively small event sample size, randomly fluctuate aroundtheir true values, saturate and approach their true values withlarger event sample size (quantitative description of smallerand larger sample size varies with different aspects of simula-tion such as input models, input parameters etc. and dependson order of cumulants, hence the discussions are left to thelater sections). The value of C6 of net-proton as a function ofsample size in certain cases is observed to be −ve in both thecollision energies due to limited statistics of sample used andapproaches the +ve true value as the sample size is increased.The statistical errors which should reflect the consistency ofestimated results with their true values, are also studied. Weinvestigate the robustness of commonly followed methods forstatistical error estimation such as delta theorem [26], boot-strap method [27, 28], and sub-group method (used in someexperiments) [29, 30]. Finally we obtain the exclusion curvesfor minimum statistics required to estimate the cumulants ofnet-proton distribution with a precision of 5% and 10% (rela-tive to their true values) for various scenarios within the ambitof the models studied here.
We organize the content of this work as follows. In thefollowing section, we describe mathematical prescription ofrelationships between moments and cumulants of various or-ders, along with discussions on models, input parameters, andcumulants calculation. A brief discussion on error estimationmethods is also included in this section. In section-III, theresults on sample size dependence of various order net-protoncumulants and studies on statistical error estimation using var-ious methods are presented. Interpretation and discussion onthe significance of these results in the context of precisionmeasurement of higher order cumulants for the experimentalsearch of phase transition and critical point signals are carriedout in the Section-IV. Finally, in Section-V we summarize thefindings of this study.
II. METHODOLOGY
We have performed Monte Carlo simulations to study theeffect of limited statistics on higher order cumulants. In thesimulation, two statistical models are used to generate net-proton distributions with experimental inputs from two colli-sion energies. In the first case, net-proton distribution is gen-erated from the difference of binomially distributed protonsand antiprotons characterized by mean (1st order cumulant)and variance (2nd order cumulant) of proton and antiprotonmeasured in STAR experiment [5]. The proton and antiprotondistributions are independently (no correlations) generated. Inthe second case, net-proton follows a Skellam distribution andexperimental values of mean of proton and antiproton are used
as input parameters for the simulation.
A. Cumulants Calculation
The higher order fluctuations are often expressed in termsof cumulants or moments. Cumulants and central momentsare related to each other in the following way. Let the devia-tion of N (any entry in the data sample) from its mean value(µ =< N >, referred as 1st raw moment) be defined by
δN = N− < N > . (1)
Any rth order central moment is defined as:
µr =< (δN)r >, (2)
i.e. 1st order central moment turns out to be zero. µ1 =<(δN) >= 0. The Cumulants of a given data sample could bewritten in terms of moments as follows.
C1 = µ (3)C2 = µ2 (4)C3 = µ3 (5)
Cn(n > 3) = µn −n−2∑m=2
(n− 1m− 1
)Cmµn−m (6)
For two independent variables X and Y , the cumulants ofprobability distribution of their sum (X + Y ), are just addi-tion of cumulants of individual distributions for X and Y , i.e.Cn,X+Y = Cn,X + Cn,Y for nth order cumulant. For distri-bution of difference inX and Y , even order cumulants are ad-dition of the individual cumulants, while odd order cumulantsare obtained by subtracting the individual cumulants. Explicitexpressions for cumulants in terms of central moments arementioned in Appendix A.
Binomial and Poissonian Model
In heavy-ion collisions, several physics processes couldlead to the correlated production of protons and antiprotons.For simplicity, we do not include any physics motivated cor-relations between proton and antiproton multiplicity distribu-tions. In the first case, we take protons and antiprotons gener-ated independently each following a Poisson distribution. Theprobability distribution of a Poisson distributed discrete ran-dom variable X is given as follows.
p(k;λ) = Pr(X = k) =λke−λ
k!, (7)
where λ is the mean, e is the Euler’s number. The resultantdistribution of difference in two Poisson distributed variablesis a Skellam distribution. The probability mass function forthe Skellam distribution is given by,
p(k;µ1, µ2) = e−(µ1+µ2)( µ1
µ2
) k/2Ik(2√µ1µ2), (8)
3
where µ1 and µ2 are the mean of Poisson distributions andIk(z) is the modified Bessel function of the first kind. Thisrepresentation with above-specified inputs is referred toPoissonian model in the text that follows. For simulation,experimental values of C1 for proton and antiproton distribu-tions are taken as the input parameters µ1 and µ2 respectively.
Similarly, in the Binomial model, we consider protons andantiprotons are independently generated each following a bi-nomial distribution. The probability mass function of a bino-mially distributed random variable k is given as follows.
B(k;n, p) =n!
k! (n− k)!pk (1− p)k, (9)
where n is the number of trials, p is probability of success andk is the number of sucesses. Two parameters that characterizethe binomial distribution are determined from relations suchas µ = np, σ2 = np(1− p) where µ and σ2 are the 1st order(C1) and 2nd order cumulant (C2) of proton or antiprotondistributions measured in the experiment. Mathematicalexpressions for cumulants of Binomial and Skellam distribu-tions are mentioned in Appendix B.
In this study experimental data used as inputs for simu-lation are (anti) proton cumulants in a kinematic region of|y| < 0.5 and 0.4 < pT (GeV/c) < 0.8 for most central(0-5%) collisions measured by STAR collaboration [5]. Inputparameters set from two energies
√sNN(GeV) = 62.4, 200
are considered for both the models. In all the cases studied,the maximum statistics is 1010 events. We study the effect ofthe size of an event sample on net-proton cumulants up to 7th
order for both the Binomial and Poisson models. The resultsand detailed discussion occur in the later sections.
B. Error Estimation
The higher order cumulants are sensitive to the shape ofthe distribution specially the tails, hence estimating the sta-tistical uncertainties correctly is crucial. Further, in higherorder cumulants analysis, the concern in the context of sta-tistical error estimation has gone beyond the basic necessityof constraining an experimentally observed parameter in cer-tain numerical range, to the affair of finding and testing of anaccurate and reliable method for error estimation itself. Wediscuss here three such methods to estimate the statistical er-rors on cumulants: Delta theorem method [26, 31], Bootstrapmethod [27, 28] and Sub-group method [29, 30]. Errors ob-tained are further subjected to a Monte Carlo verification pro-cedure to test the reliability of the methods.
Delta theorem method
Using delta theorem, a concise form of standard errorpropagation method, analytical formulae for statistical errorson cumulants and moments exist in the literature [31, 32].
Delta theorem method has been quite extensively used inestimating statistical errors in the analysis of higher ordercumulants in heavy-ion collision experiments [4–7, 19]. Theerror estimation method uses the Central Limit Theorem(CLT) - an important theorem on convergence of probability.One of the most common statements of the CLT is as follows.
Central Limit Theorem: Suppose X1, X2, .., Xn isa collection of random variables that are independentand identically distributed with mean E[Xi] = µ andVar[Xi] = σ2 < ∞, then as n approaches infinity, the ran-dom variable
√n(Sn − µ) converges to a normal distribution
N(0, σ2), where Sn = (X1 + X2 + .. + Xn)/n. In otherwords, for large value of n, Sn approximately follows anormal distribution N(µ, σ2/n).
Given the knowledge of the approximate distribution ofa statistic itself, delta theorem gives a prescription to ap-proximate the distribution of a transformation of the statisticin large samples [26]. The statement of delta theorem ismentioned below.
Delta theorem : Let Tn be a sequence of statisticssuch that
√n(Tn − θ) lim
→N(0, σ2(θ)), σ(θ) > 0. (10)
Let g be a real function which atleast is differentiable at θwith g
′(θ) 6= 0. Then
√n(g(Tn)− g(θ)) lim
→N(0, [g
′(θ)]2σ2(θ)). (11)
Error on cumulants upto 8th order expressed in terms of cen-tral moments are mentioned in Sec. C of Appendix C. Here, itis important to note that, the estimation of error on momentscalculated from a sample requires the knowledge of corre-sponding parameters (e.g. σ in the statement of CLT and θin the definition of delta theorem) of the population, which isnever within the scope of comprehension in the experiments.Hence the moments calculated from the sample, are used asestimators for corresponding parameters of the population.
Bootstrap Method
The bootstrap method finds the error on the estimators inan efficient Monte Carlo way by forming bootstrap sampleswithout involving the complexities of standard error propa-gation method. It makes use of random selection of elementswith replacement from the original sample, to constructbootstrap samples over which the sampling variance of anestimator is calculated [27, 28].
To start with, let X be a random sample representingthe experimental dataset drawn randomly from an unknownparent distribution. Let e be the estimator of a statistic
4
(such as mean or variance), on which we intend to findthe standard error. The sequence of steps followed to es-timate standard error using the bootstrap method is as follows.
1. Given a parent sample of size n, construct B num-ber of independent bootstrap samples X∗1 , X∗2 , X∗3 , ...,X∗B , each consisting of n data points randomly drawn withreplacement from the parent sample.2. Evaluate the estimator in each bootstrap sample,
e∗b = e(X∗b ) b = 1, 2, 3, ..., B. (12)
3. The sampling variance of the estimator is given as follows.
V ar(e) =1
B − 1
B∑b=1
(e∗b − ¯e
)2, (13)
where ¯e∗ = 1B
∑Bb=1(e∗b)
The sufficient enough value of B for an accurate estimationof error within the bootstrap method varies from case to casedepending upon the initial sample size. However, in general,the larger value ofB estimates the error better. We find the er-ror on cumulants using the bootstrap method and the methodis subjected to verification procedure to test the robustness.To determine the value of B and maximize stability of esti-mated error with respect to the number of bootstrap samples,we further employ a qualitative test as discussed in results sec-tion III.
Sub-group Method
Random replication of samples could also be done bydividing the initial data sample into many groups. To be moreprecise, without replacement of entries, subgroup methoddivides the data sample into sub-samples, evaluates theestimator over each sub-sample and estimates the samplingvariance on the estimator. We mention the steps involved inthe sub-group method as follows.
Given the data sample X and estimator of interest bedenoted by e,
1. Construct S number of sub-samples X∗1 , X∗2 , X∗3 ,..., X∗S , each consisting of n = N
S number of data pointsrandomly drawn from the parent sample without replacement,where N is the size of parent sample.
2. Calculate the value of estimator for each sub-sample,
e∗s = e(X∗s ) s = 1, 2, 3, ..., S. (14)
3. Variance on the estimator is calculated as follows.
V ar(e) =1
S(S − 1)
S∑s=1
(e∗s − ¯e
)2, (15)
where ¯e∗ = 1S
∑Ss=1(e∗s). The extra factor of 1/S in Eq.15 is
used to scale back the variance on estimator from sub-sample
level to original data sample level to account for the statisticsmismatch.We obtain the error on cumulants using the sub-group methodfor different sub-sample sizes and compared to the corre-sponding results from bootstrap and delta-theorem method.Gaussian behaviour of estimators from the sub-samples insub-group method is tested by subjecting to a verification pro-cedure.
III. RESULTS
To find the effect of limited statistics in the measurementof higher order cumulants, we calculate cumulants of variousorder of simulated net-proton distributions within two mod-els namely, Poissonian model and Binomial model. Statisti-cal errors are estimated using delta theorem method, bootstrapmethod and sub-group method. We present the results on cal-culating back the cumulants values viz-a-viz the true valuesas a function of event statistics in the first part of this sectionand results on error estimation methods are investigated in thelater part.
1. Dependence of cumulants on sample size
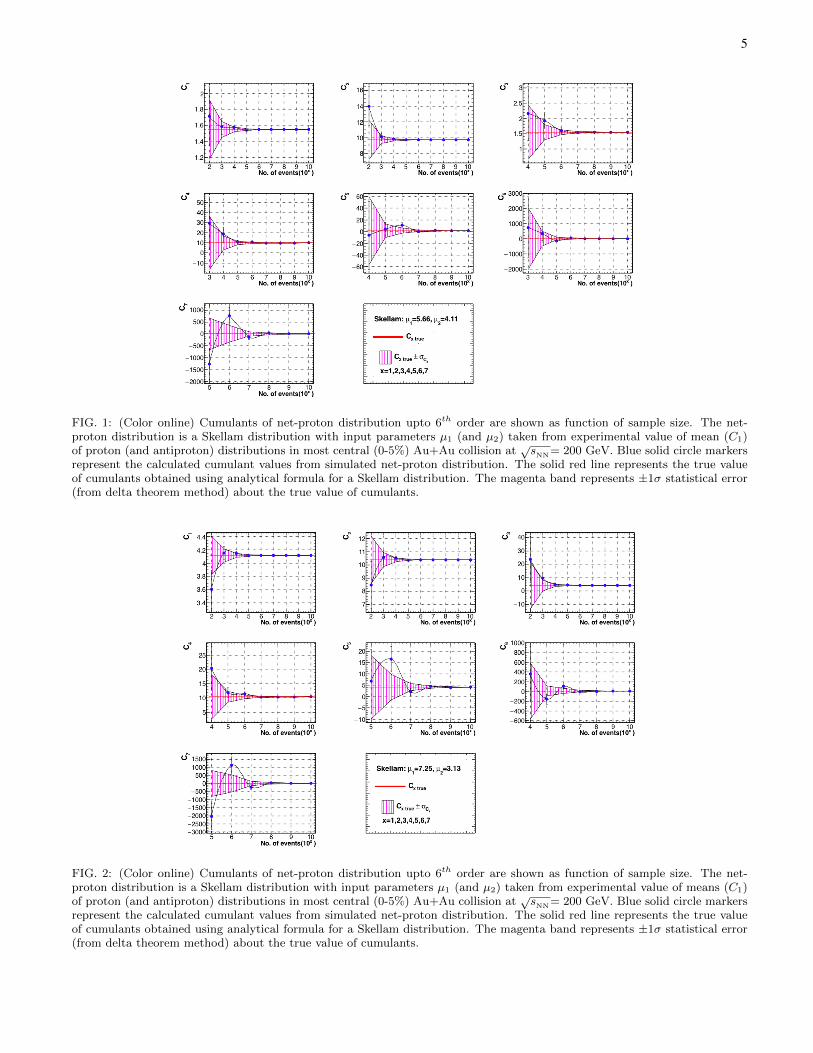
Net-proton following a Skellam distribution is generatedwith input parameters µ1 = 5.66 and µ2 = 4.11 which areefficiency corrected mean of proton and antiproton distribu-tions respectively, in most central (0-5%) Au+Au collisionat √s
NN= 200 GeV in STAR experiment [5]. As shown
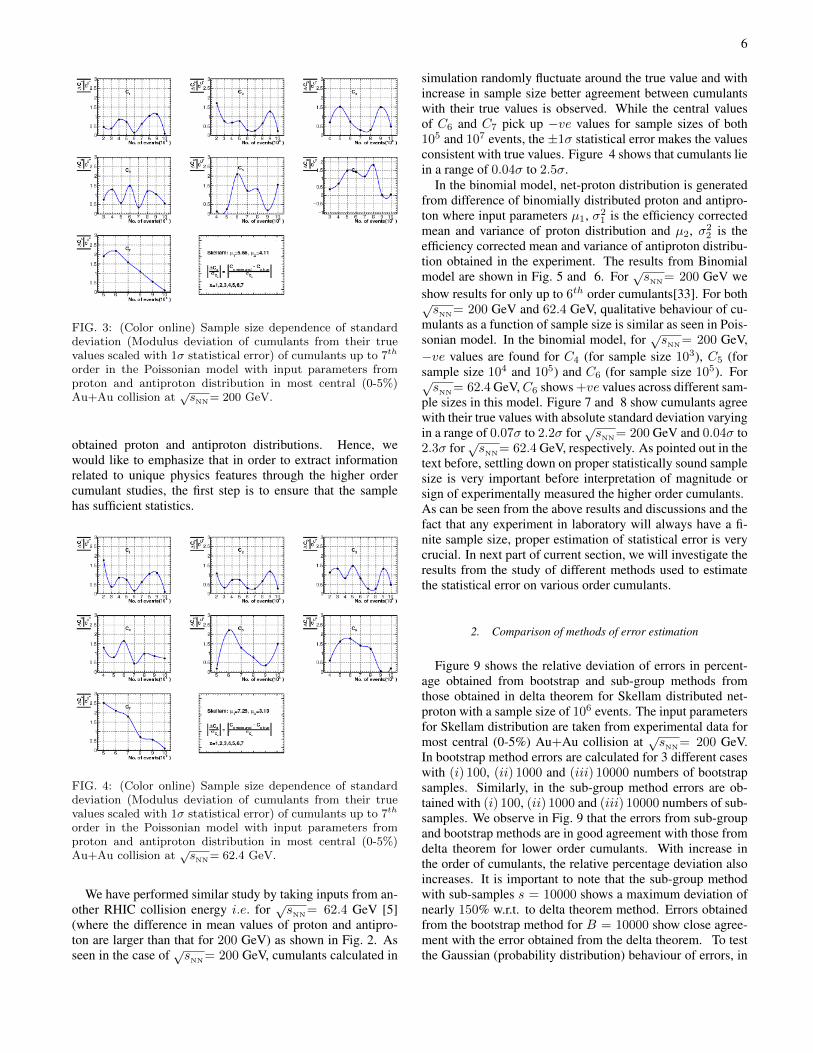
in Fig. 1, values of cumulants (upto 7th order) randomlyfluctuate for the smaller value of sample statistics and qualityof agreement with true values improves by increasing numberof events in a sample. However, in most of the cases, asshown in Fig. 3 the cumulants agree with their true valueswithin±1σ statistical error while in very few cases cumulantsfluctuate beyond±1σ error. To be precise, value of cumulantsdeviate in a range of 0.005σ to 2.1σ. The fact that cumulantsin some cases lie beyond ±1σ error could be accounted tothe small yet significant probability outside ±1σ region ofa Gaussian distribution. In few cases, C5, C6 and C7 shownegative values. Note that, sign of cumulants have physicalsignificance in the field of studying QCD phase diagram.The statistical error is estimated using the delta theoremmethod. The true values of cumulants are calculated usingthe analytical formula for Skellam distribution.
The central values of C6 for sample size 105 eventsand 107 events are found to be −116.656 and −2.201,which is interesting due to their −ve signs. Though thetheoretical prediction for a crossover/chiral phase transitionsuggests a −ve value of C6 to be a possible hint for such atransition [18], we find that the−ve sign of C6 (also−ve signof C5 and C7) in our simulation results is due to insufficientstatistics of the sample set used. In some cases large values ofC4 are also observed. In the simulation, Skellam distributionof net-proton is generated using mean (C1) of experimentally
5
FIG. 1: (Color online) Cumulants of net-proton distribution upto 6th order are shown as function of sample size. The net-proton distribution is a Skellam distribution with input parameters µ1 (and µ2) taken from experimental value of mean (C1)of proton (and antiproton) distributions in most central (0-5%) Au+Au collision at
√sNN= 200 GeV. Blue solid circle markers
represent the calculated cumulant values from simulated net-proton distribution. The solid red line represents the true valueof cumulants obtained using analytical formula for a Skellam distribution. The magenta band represents ±1σ statistical error(from delta theorem method) about the true value of cumulants.
FIG. 2: (Color online) Cumulants of net-proton distribution upto 6th order are shown as function of sample size. The net-proton distribution is a Skellam distribution with input parameters µ1 (and µ2) taken from experimental value of means (C1)of proton (and antiproton) distributions in most central (0-5%) Au+Au collision at
√sNN= 200 GeV. Blue solid circle markers
represent the calculated cumulant values from simulated net-proton distribution. The solid red line represents the true valueof cumulants obtained using analytical formula for a Skellam distribution. The magenta band represents ±1σ statistical error(from delta theorem method) about the true value of cumulants.
6
FIG. 3: (Color online) Sample size dependence of standarddeviation (Modulus deviation of cumulants from their truevalues scaled with 1σ statistical error) of cumulants up to 7th
order in the Poissonian model with input parameters fromproton and antiproton distribution in most central (0-5%)Au+Au collision at
√sNN= 200 GeV.
obtained proton and antiproton distributions. Hence, wewould like to emphasize that in order to extract informationrelated to unique physics features through the higher ordercumulant studies, the first step is to ensure that the samplehas sufficient statistics.
FIG. 4: (Color online) Sample size dependence of standarddeviation (Modulus deviation of cumulants from their truevalues scaled with 1σ statistical error) of cumulants up to 7th
order in the Poissonian model with input parameters fromproton and antiproton distribution in most central (0-5%)Au+Au collision at
√sNN= 62.4 GeV.
We have performed similar study by taking inputs from an-other RHIC collision energy i.e. for √s
NN= 62.4 GeV [5]
(where the difference in mean values of proton and antipro-ton are larger than that for 200 GeV) as shown in Fig. 2. Asseen in the case of √s
NN= 200 GeV, cumulants calculated in
simulation randomly fluctuate around the true value and withincrease in sample size better agreement between cumulantswith their true values is observed. While the central valuesof C6 and C7 pick up −ve values for sample sizes of both105 and 107 events, the ±1σ statistical error makes the valuesconsistent with true values. Figure 4 shows that cumulants liein a range of 0.04σ to 2.5σ.
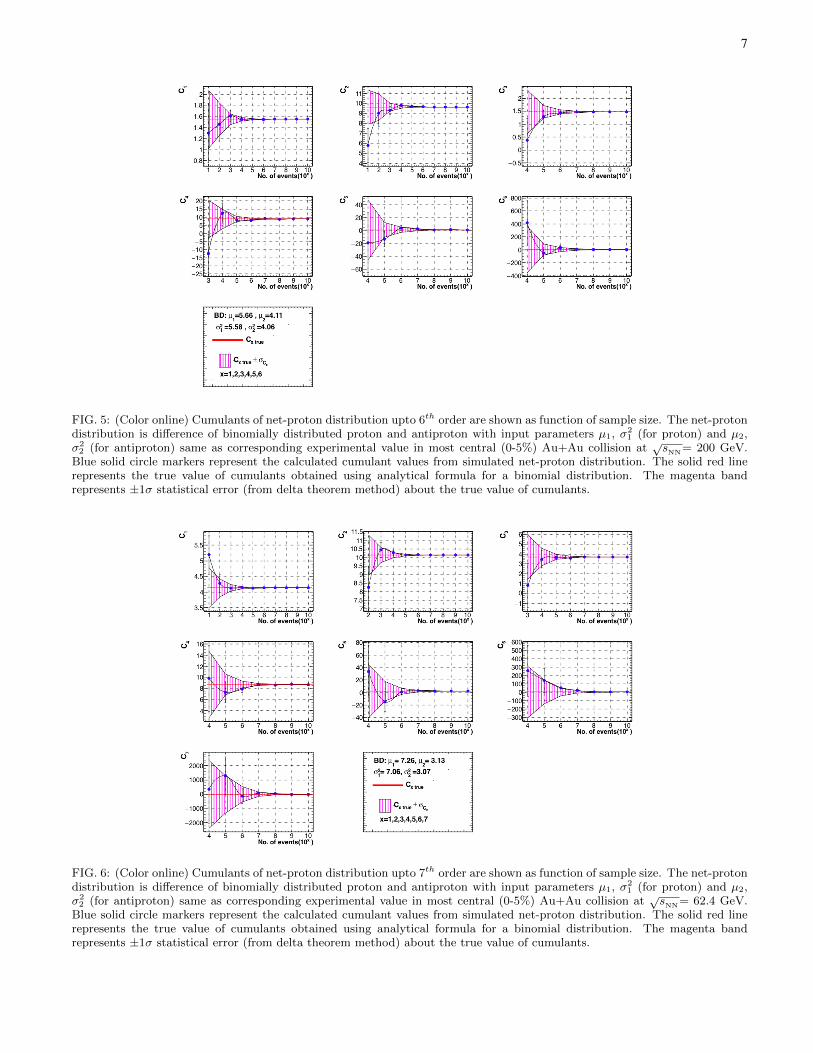
In the binomial model, net-proton distribution is generatedfrom difference of binomially distributed proton and antipro-ton where input parameters µ1, σ2
1 is the efficiency correctedmean and variance of proton distribution and µ2, σ2
2 is theefficiency corrected mean and variance of antiproton distribu-tion obtained in the experiment. The results from Binomialmodel are shown in Fig. 5 and 6. For √s
NN= 200 GeV we
show results for only up to 6th order cumulants[33]. For both√sNN
= 200 GeV and 62.4 GeV, qualitative behaviour of cu-mulants as a function of sample size is similar as seen in Pois-sonian model. In the binomial model, for √s
NN= 200 GeV,
−ve values are found for C4 (for sample size 103), C5 (forsample size 104 and 105) and C6 (for sample size 105). For√sNN
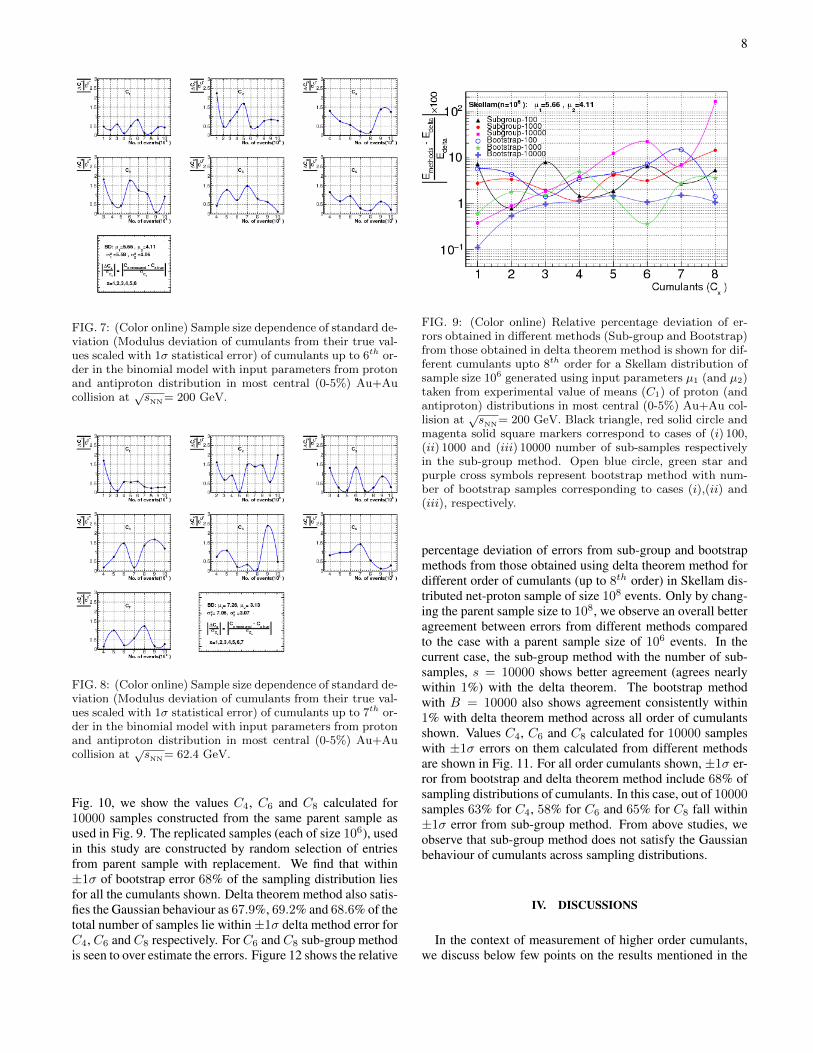
= 62.4 GeV,C6 shows +ve values across different sam-ple sizes in this model. Figure 7 and 8 show cumulants agreewith their true values with absolute standard deviation varyingin a range of 0.07σ to 2.2σ for√s
NN= 200 GeV and 0.04σ to
2.3σ for√sNN
= 62.4 GeV, respectively. As pointed out in thetext before, settling down on proper statistically sound samplesize is very important before interpretation of magnitude orsign of experimentally measured the higher order cumulants.As can be seen from the above results and discussions and thefact that any experiment in laboratory will always have a fi-nite sample size, proper estimation of statistical error is verycrucial. In next part of current section, we will investigate theresults from the study of different methods used to estimatethe statistical error on various order cumulants.
2. Comparison of methods of error estimation
Figure 9 shows the relative deviation of errors in percent-age obtained from bootstrap and sub-group methods fromthose obtained in delta theorem for Skellam distributed net-proton with a sample size of 106 events. The input parametersfor Skellam distribution are taken from experimental data formost central (0-5%) Au+Au collision at √sNN= 200 GeV.In bootstrap method errors are calculated for 3 different caseswith (i) 100, (ii) 1000 and (iii) 10000 numbers of bootstrapsamples. Similarly, in the sub-group method errors are ob-tained with (i) 100, (ii) 1000 and (iii) 10000 numbers of sub-samples. We observe in Fig. 9 that the errors from sub-groupand bootstrap methods are in good agreement with those fromdelta theorem for lower order cumulants. With increase inthe order of cumulants, the relative percentage deviation alsoincreases. It is important to note that the sub-group methodwith sub-samples s = 10000 shows a maximum deviation ofnearly 150% w.r.t. to delta theorem method. Errors obtainedfrom the bootstrap method for B = 10000 show close agree-ment with the error obtained from the delta theorem. To testthe Gaussian (probability distribution) behaviour of errors, in
7
FIG. 5: (Color online) Cumulants of net-proton distribution upto 6th order are shown as function of sample size. The net-protondistribution is difference of binomially distributed proton and antiproton with input parameters µ1, σ2
1 (for proton) and µ2,σ22 (for antiproton) same as corresponding experimental value in most central (0-5%) Au+Au collision at
√sNN= 200 GeV.
Blue solid circle markers represent the calculated cumulant values from simulated net-proton distribution. The solid red linerepresents the true value of cumulants obtained using analytical formula for a binomial distribution. The magenta bandrepresents ±1σ statistical error (from delta theorem method) about the true value of cumulants.
FIG. 6: (Color online) Cumulants of net-proton distribution upto 7th order are shown as function of sample size. The net-protondistribution is difference of binomially distributed proton and antiproton with input parameters µ1, σ2
1 (for proton) and µ2,σ22 (for antiproton) same as corresponding experimental value in most central (0-5%) Au+Au collision at
√sNN= 62.4 GeV.
Blue solid circle markers represent the calculated cumulant values from simulated net-proton distribution. The solid red linerepresents the true value of cumulants obtained using analytical formula for a binomial distribution. The magenta bandrepresents ±1σ statistical error (from delta theorem method) about the true value of cumulants.
8
FIG. 7: (Color online) Sample size dependence of standard de-viation (Modulus deviation of cumulants from their true val-ues scaled with 1σ statistical error) of cumulants up to 6th or-der in the binomial model with input parameters from protonand antiproton distribution in most central (0-5%) Au+Aucollision at
√sNN= 200 GeV.
FIG. 8: (Color online) Sample size dependence of standard de-viation (Modulus deviation of cumulants from their true val-ues scaled with 1σ statistical error) of cumulants up to 7th or-der in the binomial model with input parameters from protonand antiproton distribution in most central (0-5%) Au+Aucollision at
√sNN= 62.4 GeV.
Fig. 10, we show the values C4, C6 and C8 calculated for10000 samples constructed from the same parent sample asused in Fig. 9. The replicated samples (each of size 106), usedin this study are constructed by random selection of entriesfrom parent sample with replacement. We find that within±1σ of bootstrap error 68% of the sampling distribution liesfor all the cumulants shown. Delta theorem method also satis-fies the Gaussian behaviour as 67.9%, 69.2% and 68.6% of thetotal number of samples lie within±1σ delta method error forC4, C6 and C8 respectively. For C6 and C8 sub-group methodis seen to over estimate the errors. Figure 12 shows the relative
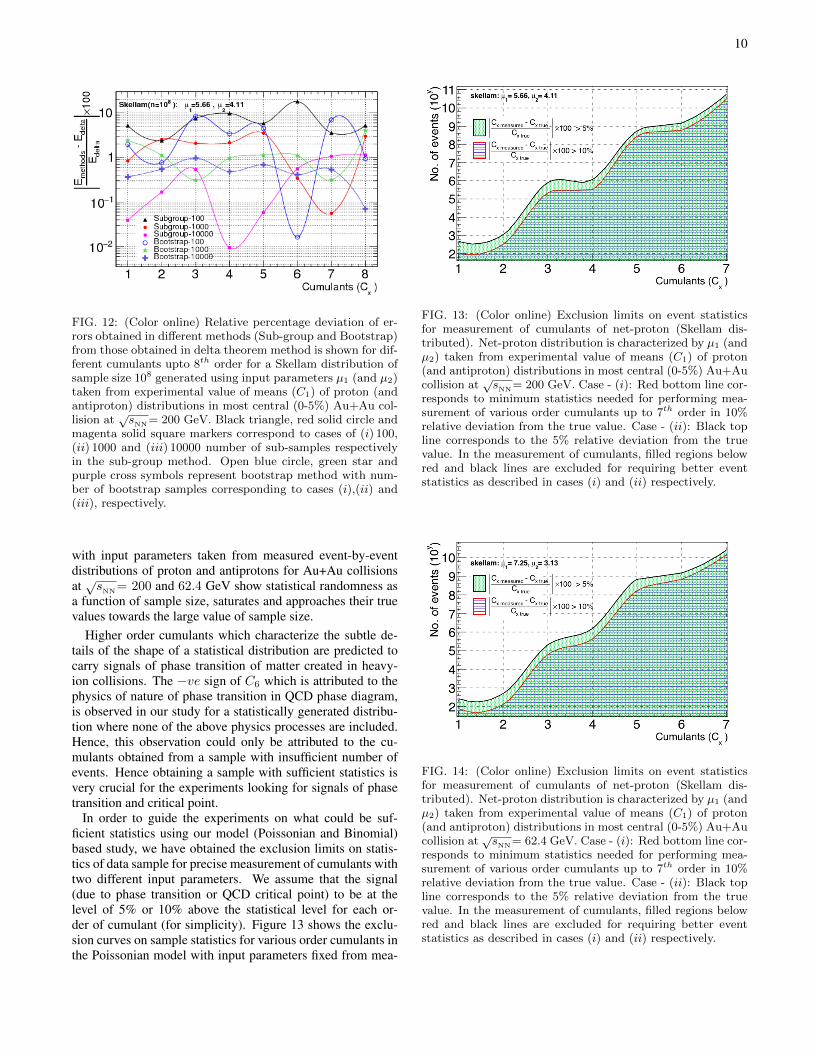
FIG. 9: (Color online) Relative percentage deviation of er-rors obtained in different methods (Sub-group and Bootstrap)from those obtained in delta theorem method is shown for dif-ferent cumulants upto 8th order for a Skellam distribution ofsample size 106 generated using input parameters µ1 (and µ2)taken from experimental value of means (C1) of proton (andantiproton) distributions in most central (0-5%) Au+Au col-lision at
√sNN= 200 GeV. Black triangle, red solid circle and
magenta solid square markers correspond to cases of (i) 100,(ii) 1000 and (iii) 10000 number of sub-samples respectivelyin the sub-group method. Open blue circle, green star andpurple cross symbols represent bootstrap method with num-ber of bootstrap samples corresponding to cases (i),(ii) and(iii), respectively.
percentage deviation of errors from sub-group and bootstrapmethods from those obtained using delta theorem method fordifferent order of cumulants (up to 8th order) in Skellam dis-tributed net-proton sample of size 108 events. Only by chang-ing the parent sample size to 108, we observe an overall betteragreement between errors from different methods comparedto the case with a parent sample size of 106 events. In thecurrent case, the sub-group method with the number of sub-samples, s = 10000 shows better agreement (agrees nearlywithin 1%) with the delta theorem. The bootstrap methodwith B = 10000 also shows agreement consistently within1% with delta theorem method across all order of cumulantsshown. Values C4, C6 and C8 calculated for 10000 sampleswith ±1σ errors on them calculated from different methodsare shown in Fig. 11. For all order cumulants shown, ±1σ er-ror from bootstrap and delta theorem method include 68% ofsampling distributions of cumulants. In this case, out of 10000samples 63% for C4, 58% for C6 and 65% for C8 fall within±1σ error from sub-group method. From above studies, weobserve that sub-group method does not satisfy the Gaussianbehaviour of cumulants across sampling distributions.
IV. DISCUSSIONS
In the context of measurement of higher order cumulants,we discuss below few points on the results mentioned in the
9
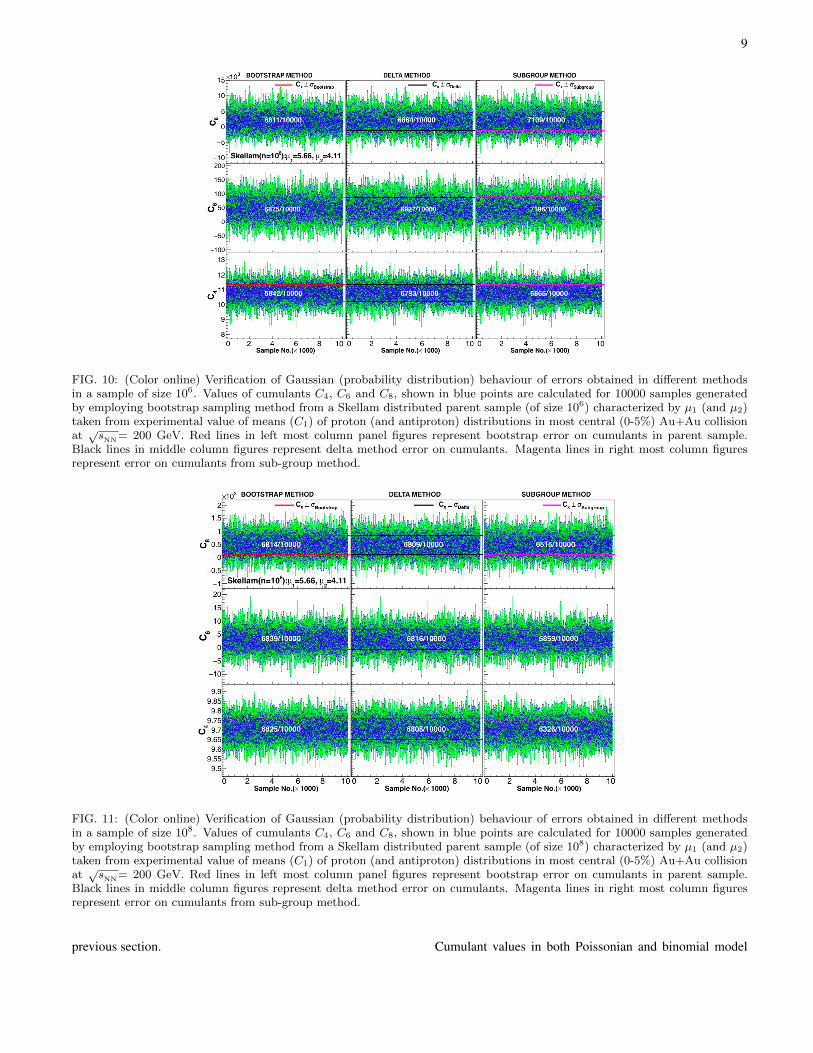
FIG. 10: (Color online) Verification of Gaussian (probability distribution) behaviour of errors obtained in different methodsin a sample of size 106. Values of cumulants C4, C6 and C8, shown in blue points are calculated for 10000 samples generatedby employing bootstrap sampling method from a Skellam distributed parent sample (of size 106) characterized by µ1 (and µ2)taken from experimental value of means (C1) of proton (and antiproton) distributions in most central (0-5%) Au+Au collisionat√sNN= 200 GeV. Red lines in left most column panel figures represent bootstrap error on cumulants in parent sample.
Black lines in middle column figures represent delta method error on cumulants. Magenta lines in right most column figuresrepresent error on cumulants from sub-group method.
FIG. 11: (Color online) Verification of Gaussian (probability distribution) behaviour of errors obtained in different methodsin a sample of size 108. Values of cumulants C4, C6 and C8, shown in blue points are calculated for 10000 samples generatedby employing bootstrap sampling method from a Skellam distributed parent sample (of size 108) characterized by µ1 (and µ2)taken from experimental value of means (C1) of proton (and antiproton) distributions in most central (0-5%) Au+Au collisionat√sNN= 200 GeV. Red lines in left most column panel figures represent bootstrap error on cumulants in parent sample.
Black lines in middle column figures represent delta method error on cumulants. Magenta lines in right most column figuresrepresent error on cumulants from sub-group method.
previous section. Cumulant values in both Poissonian and binomial model
10
FIG. 12: (Color online) Relative percentage deviation of er-rors obtained in different methods (Sub-group and Bootstrap)from those obtained in delta theorem method is shown for dif-ferent cumulants upto 8th order for a Skellam distribution ofsample size 108 generated using input parameters µ1 (and µ2)taken from experimental value of means (C1) of proton (andantiproton) distributions in most central (0-5%) Au+Au col-lision at
√sNN= 200 GeV. Black triangle, red solid circle and
magenta solid square markers correspond to cases of (i) 100,(ii) 1000 and (iii) 10000 number of sub-samples respectivelyin the sub-group method. Open blue circle, green star andpurple cross symbols represent bootstrap method with num-ber of bootstrap samples corresponding to cases (i),(ii) and(iii), respectively.
with input parameters taken from measured event-by-eventdistributions of proton and antiprotons for Au+Au collisionsat √sNN= 200 and 62.4 GeV show statistical randomness asa function of sample size, saturates and approaches their truevalues towards the large value of sample size.
Higher order cumulants which characterize the subtle de-tails of the shape of a statistical distribution are predicted tocarry signals of phase transition of matter created in heavy-ion collisions. The −ve sign of C6 which is attributed to thephysics of nature of phase transition in QCD phase diagram,is observed in our study for a statistically generated distribu-tion where none of the above physics processes are included.Hence, this observation could only be attributed to the cu-mulants obtained from a sample with insufficient number ofevents. Hence obtaining a sample with sufficient statistics isvery crucial for the experiments looking for signals of phasetransition and critical point.
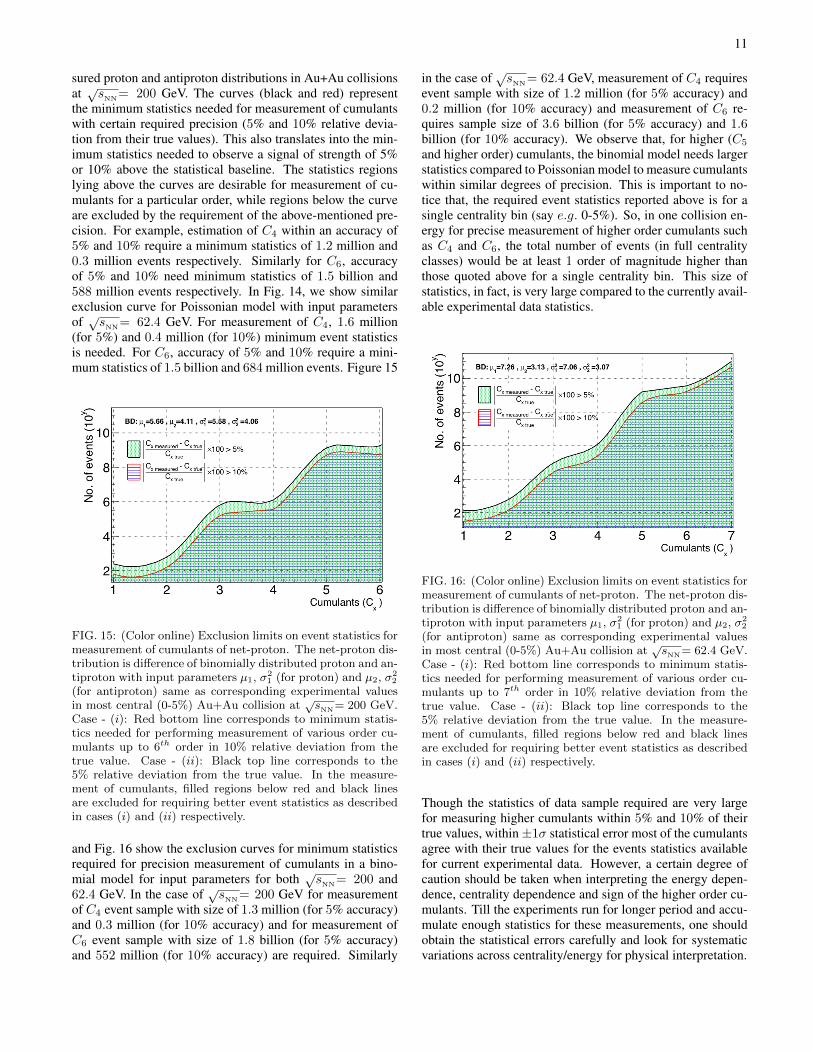
In order to guide the experiments on what could be suf-ficient statistics using our model (Poissonian and Binomial)based study, we have obtained the exclusion limits on statis-tics of data sample for precise measurement of cumulants withtwo different input parameters. We assume that the signal(due to phase transition or QCD critical point) to be at thelevel of 5% or 10% above the statistical level for each or-der of cumulant (for simplicity). Figure 13 shows the exclu-sion curves on sample statistics for various order cumulants inthe Poissonian model with input parameters fixed from mea-
FIG. 13: (Color online) Exclusion limits on event statisticsfor measurement of cumulants of net-proton (Skellam dis-tributed). Net-proton distribution is characterized by µ1 (andµ2) taken from experimental value of means (C1) of proton(and antiproton) distributions in most central (0-5%) Au+Aucollision at
√sNN= 200 GeV. Case - (i): Red bottom line cor-
responds to minimum statistics needed for performing mea-surement of various order cumulants up to 7th order in 10%relative deviation from the true value. Case - (ii): Black topline corresponds to the 5% relative deviation from the truevalue. In the measurement of cumulants, filled regions belowred and black lines are excluded for requiring better eventstatistics as described in cases (i) and (ii) respectively.
FIG. 14: (Color online) Exclusion limits on event statisticsfor measurement of cumulants of net-proton (Skellam dis-tributed). Net-proton distribution is characterized by µ1 (andµ2) taken from experimental value of means (C1) of proton(and antiproton) distributions in most central (0-5%) Au+Aucollision at
√sNN= 62.4 GeV. Case - (i): Red bottom line cor-
responds to minimum statistics needed for performing mea-surement of various order cumulants up to 7th order in 10%relative deviation from the true value. Case - (ii): Black topline corresponds to the 5% relative deviation from the truevalue. In the measurement of cumulants, filled regions belowred and black lines are excluded for requiring better eventstatistics as described in cases (i) and (ii) respectively.
11
sured proton and antiproton distributions in Au+Au collisionsat √s
NN= 200 GeV. The curves (black and red) represent
the minimum statistics needed for measurement of cumulantswith certain required precision (5% and 10% relative devia-tion from their true values). This also translates into the min-imum statistics needed to observe a signal of strength of 5%or 10% above the statistical baseline. The statistics regionslying above the curves are desirable for measurement of cu-mulants for a particular order, while regions below the curveare excluded by the requirement of the above-mentioned pre-cision. For example, estimation of C4 within an accuracy of5% and 10% require a minimum statistics of 1.2 million and0.3 million events respectively. Similarly for C6, accuracyof 5% and 10% need minimum statistics of 1.5 billion and588 million events respectively. In Fig. 14, we show similarexclusion curve for Poissonian model with input parametersof √s
NN= 62.4 GeV. For measurement of C4, 1.6 million
(for 5%) and 0.4 million (for 10%) minimum event statisticsis needed. For C6, accuracy of 5% and 10% require a mini-mum statistics of 1.5 billion and 684 million events. Figure 15
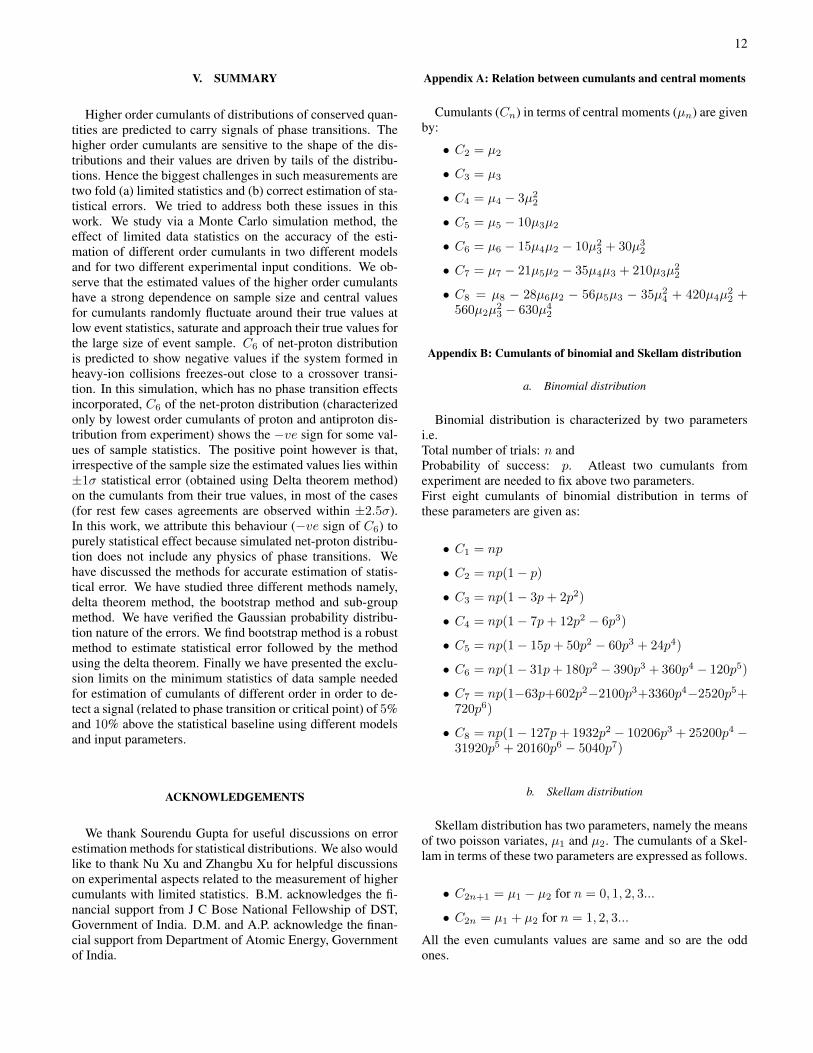
FIG. 15: (Color online) Exclusion limits on event statistics formeasurement of cumulants of net-proton. The net-proton dis-tribution is difference of binomially distributed proton and an-tiproton with input parameters µ1, σ2
1 (for proton) and µ2, σ22
(for antiproton) same as corresponding experimental valuesin most central (0-5%) Au+Au collision at
√sNN= 200 GeV.
Case - (i): Red bottom line corresponds to minimum statis-tics needed for performing measurement of various order cu-mulants up to 6th order in 10% relative deviation from thetrue value. Case - (ii): Black top line corresponds to the5% relative deviation from the true value. In the measure-ment of cumulants, filled regions below red and black linesare excluded for requiring better event statistics as describedin cases (i) and (ii) respectively.
and Fig. 16 show the exclusion curves for minimum statisticsrequired for precision measurement of cumulants in a bino-mial model for input parameters for both √s
NN= 200 and
62.4 GeV. In the case of √sNN
= 200 GeV for measurementof C4 event sample with size of 1.3 million (for 5% accuracy)and 0.3 million (for 10% accuracy) and for measurement ofC6 event sample with size of 1.8 billion (for 5% accuracy)and 552 million (for 10% accuracy) are required. Similarly
in the case of √sNN
= 62.4 GeV, measurement of C4 requiresevent sample with size of 1.2 million (for 5% accuracy) and0.2 million (for 10% accuracy) and measurement of C6 re-quires sample size of 3.6 billion (for 5% accuracy) and 1.6billion (for 10% accuracy). We observe that, for higher (C5
and higher order) cumulants, the binomial model needs largerstatistics compared to Poissonian model to measure cumulantswithin similar degrees of precision. This is important to no-tice that, the required event statistics reported above is for asingle centrality bin (say e.g. 0-5%). So, in one collision en-ergy for precise measurement of higher order cumulants suchas C4 and C6, the total number of events (in full centralityclasses) would be at least 1 order of magnitude higher thanthose quoted above for a single centrality bin. This size ofstatistics, in fact, is very large compared to the currently avail-able experimental data statistics.
FIG. 16: (Color online) Exclusion limits on event statistics formeasurement of cumulants of net-proton. The net-proton dis-tribution is difference of binomially distributed proton and an-tiproton with input parameters µ1, σ2
1 (for proton) and µ2, σ22
(for antiproton) same as corresponding experimental valuesin most central (0-5%) Au+Au collision at
√sNN= 62.4 GeV.
Case - (i): Red bottom line corresponds to minimum statis-tics needed for performing measurement of various order cu-mulants up to 7th order in 10% relative deviation from thetrue value. Case - (ii): Black top line corresponds to the5% relative deviation from the true value. In the measure-ment of cumulants, filled regions below red and black linesare excluded for requiring better event statistics as describedin cases (i) and (ii) respectively.
Though the statistics of data sample required are very largefor measuring higher cumulants within 5% and 10% of theirtrue values, within±1σ statistical error most of the cumulantsagree with their true values for the events statistics availablefor current experimental data. However, a certain degree ofcaution should be taken when interpreting the energy depen-dence, centrality dependence and sign of the higher order cu-mulants. Till the experiments run for longer period and accu-mulate enough statistics for these measurements, one shouldobtain the statistical errors carefully and look for systematicvariations across centrality/energy for physical interpretation.
12
V. SUMMARY
Higher order cumulants of distributions of conserved quan-tities are predicted to carry signals of phase transitions. Thehigher order cumulants are sensitive to the shape of the dis-tributions and their values are driven by tails of the distribu-tions. Hence the biggest challenges in such measurements aretwo fold (a) limited statistics and (b) correct estimation of sta-tistical errors. We tried to address both these issues in thiswork. We study via a Monte Carlo simulation method, theeffect of limited data statistics on the accuracy of the esti-mation of different order cumulants in two different modelsand for two different experimental input conditions. We ob-serve that the estimated values of the higher order cumulantshave a strong dependence on sample size and central valuesfor cumulants randomly fluctuate around their true values atlow event statistics, saturate and approach their true values forthe large size of event sample. C6 of net-proton distributionis predicted to show negative values if the system formed inheavy-ion collisions freezes-out close to a crossover transi-tion. In this simulation, which has no phase transition effectsincorporated, C6 of the net-proton distribution (characterizedonly by lowest order cumulants of proton and antiproton dis-tribution from experiment) shows the −ve sign for some val-ues of sample statistics. The positive point however is that,irrespective of the sample size the estimated values lies within±1σ statistical error (obtained using Delta theorem method)on the cumulants from their true values, in most of the cases(for rest few cases agreements are observed within ±2.5σ).In this work, we attribute this behaviour (−ve sign of C6) topurely statistical effect because simulated net-proton distribu-tion does not include any physics of phase transitions. Wehave discussed the methods for accurate estimation of statis-tical error. We have studied three different methods namely,delta theorem method, the bootstrap method and sub-groupmethod. We have verified the Gaussian probability distribu-tion nature of the errors. We find bootstrap method is a robustmethod to estimate statistical error followed by the methodusing the delta theorem. Finally we have presented the exclu-sion limits on the minimum statistics of data sample neededfor estimation of cumulants of different order in order to de-tect a signal (related to phase transition or critical point) of 5%and 10% above the statistical baseline using different modelsand input parameters.
ACKNOWLEDGEMENTS
We thank Sourendu Gupta for useful discussions on errorestimation methods for statistical distributions. We also wouldlike to thank Nu Xu and Zhangbu Xu for helpful discussionson experimental aspects related to the measurement of highercumulants with limited statistics. B.M. acknowledges the fi-nancial support from J C Bose National Fellowship of DST,Government of India. D.M. and A.P. acknowledge the finan-cial support from Department of Atomic Energy, Governmentof India.
Appendix A: Relation between cumulants and central moments
Cumulants (Cn) in terms of central moments (µn) are givenby:
• C2 = µ2
• C3 = µ3
• C4 = µ4 − 3µ22
• C5 = µ5 − 10µ3µ2
• C6 = µ6 − 15µ4µ2 − 10µ23 + 30µ3
2
• C7 = µ7 − 21µ5µ2 − 35µ4µ3 + 210µ3µ22
• C8 = µ8 − 28µ6µ2 − 56µ5µ3 − 35µ24 + 420µ4µ
22 +
560µ2µ23 − 630µ4
2
Appendix B: Cumulants of binomial and Skellam distribution
a. Binomial distribution
Binomial distribution is characterized by two parametersi.e.Total number of trials: n andProbability of success: p. Atleast two cumulants fromexperiment are needed to fix above two parameters.First eight cumulants of binomial distribution in terms ofthese parameters are given as:
• C1 = np
• C2 = np(1− p)
• C3 = np(1− 3p+ 2p2)
• C4 = np(1− 7p+ 12p2 − 6p3)
• C5 = np(1− 15p+ 50p2 − 60p3 + 24p4)
• C6 = np(1− 31p+ 180p2 − 390p3 + 360p4 − 120p5)
• C7 = np(1−63p+602p2−2100p3+3360p4−2520p5+720p6)
• C8 = np(1− 127p+ 1932p2 − 10206p3 + 25200p4 −31920p5 + 20160p6 − 5040p7)
b. Skellam distribution
Skellam distribution has two parameters, namely the meansof two poisson variates, µ1 and µ2. The cumulants of a Skel-lam in terms of these two parameters are expressed as follows.
• C2n+1 = µ1 − µ2 for n = 0, 1, 2, 3...
• C2n = µ1 + µ2 for n = 1, 2, 3...
All the even cumulants values are same and so are the oddones.
13
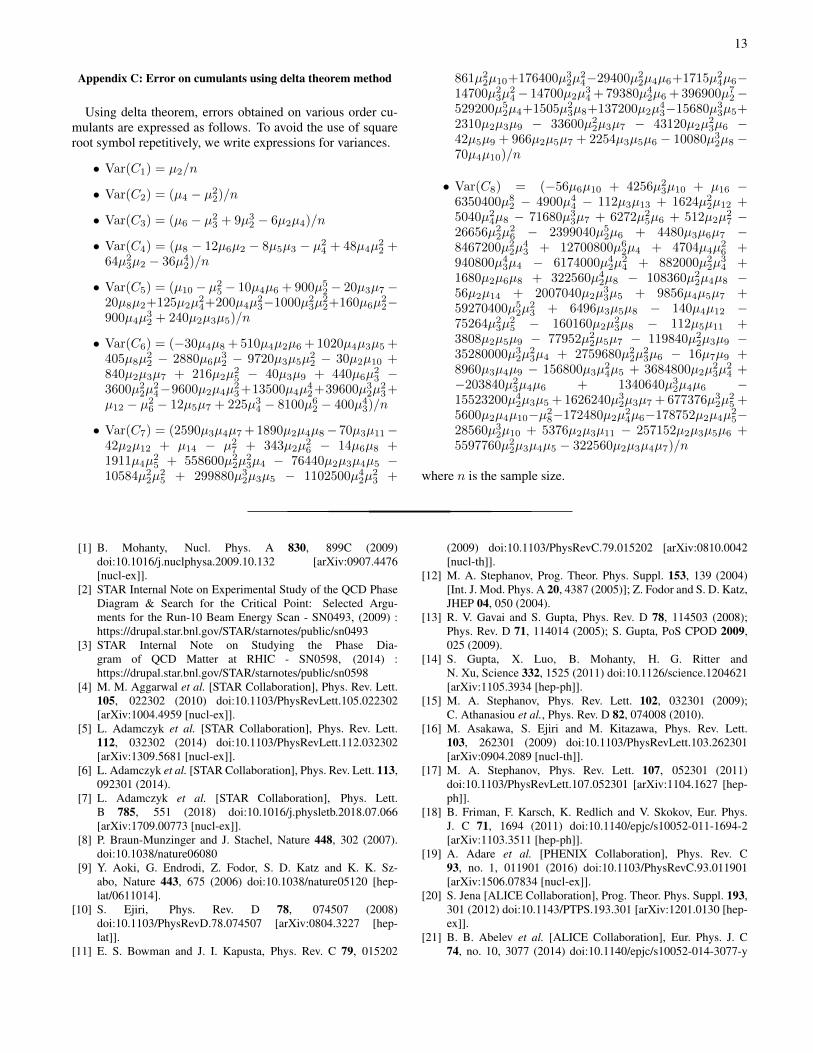
Appendix C: Error on cumulants using delta theorem method
Using delta theorem, errors obtained on various order cu-mulants are expressed as follows. To avoid the use of squareroot symbol repetitively, we write expressions for variances.
• Var(C1) = µ2/n
• Var(C2) = (µ4 − µ22)/n
• Var(C3) = (µ6 − µ23 + 9µ3
2 − 6µ2µ4)/n
• Var(C4) = (µ8 − 12µ6µ2 − 8µ5µ3 − µ24 + 48µ4µ
22 +
64µ23µ2 − 36µ4
2)/n
• Var(C5) = (µ10 − µ25 − 10µ4µ6 + 900µ5
2 − 20µ3µ7 −20µ8µ2+125µ2µ
24+200µ4µ
23−1000µ2
3µ22+160µ6µ
22−
900µ4µ32 + 240µ2µ3µ5)/n
• Var(C6) = (−30µ4µ8 + 510µ4µ2µ6 + 1020µ4µ3µ5 +405µ8µ
22 − 2880µ6µ
32 − 9720µ3µ5µ
22 − 30µ2µ10 +
840µ2µ3µ7 + 216µ2µ25 − 40µ3µ9 + 440µ6µ
23 −
3600µ22µ
24−9600µ2µ4µ
23+13500µ4µ
42+39600µ3
2µ23+
µ12 − µ26 − 12µ5µ7 + 225µ3
4 − 8100µ62 − 400µ4
3)/n
• Var(C7) = (2590µ3µ4µ7 + 1890µ2µ4µ8−70µ3µ11−42µ2µ12 + µ14 − µ2
7 + 343µ2µ26 − 14µ6µ8 +
1911µ4µ25 + 558600µ2
2µ23µ4 − 76440µ2µ3µ4µ5 −
10584µ22µ
25 + 299880µ3
2µ3µ5 − 1102500µ42µ
23 +
861µ22µ10+176400µ3
2µ24−29400µ2
2µ4µ6+1715µ24µ6−
14700µ23µ
24− 14700µ2µ
34 + 79380µ4
2µ6 + 396900µ72−
529200µ52µ4+1505µ2
3µ8+137200µ2µ43−15680µ3
3µ5+2310µ2µ3µ9 − 33600µ2
2µ3µ7 − 43120µ2µ23µ6 −
42µ5µ9 + 966µ2µ5µ7 + 2254µ3µ5µ6 − 10080µ32µ8 −
70µ4µ10)/n
• Var(C8) = (−56µ6µ10 + 4256µ23µ10 + µ16 −
6350400µ82 − 4900µ4
4 − 112µ3µ13 + 1624µ22µ12 +
5040µ24µ8 − 71680µ3
3µ7 + 6272µ25µ6 + 512µ2µ
27 −
26656µ22µ
26 − 2399040µ5
2µ6 + 4480µ3µ6µ7 −8467200µ2
2µ43 + 12700800µ6
2µ4 + 4704µ4µ26 +
940800µ43µ4 − 6174000µ4
2µ24 + 882000µ2
2µ34 +
1680µ2µ6µ8 + 322560µ42µ8 − 108360µ2
2µ4µ8 −56µ2µ14 + 2007040µ2µ
33µ5 + 9856µ4µ5µ7 +
59270400µ52µ
23 + 6496µ3µ5µ8 − 140µ4µ12 −
75264µ23µ
25 − 160160µ2µ
23µ8 − 112µ5µ11 +
3808µ2µ5µ9 − 77952µ22µ5µ7 − 119840µ2
2µ3µ9 −35280000µ3
2µ23µ4 + 2759680µ2
2µ23µ6 − 16µ7µ9 +
8960µ3µ4µ9 − 156800µ3µ24µ5 + 3684800µ2µ
23µ
24 +
−203840µ23µ4µ6 + 1340640µ3
2µ4µ6 −15523200µ4
2µ3µ5 + 1626240µ32µ3µ7 + 677376µ3
2µ25 +
5600µ2µ4µ10−µ28−172480µ2µ
24µ6−178752µ2µ4µ
25−
28560µ32µ10 + 5376µ2µ3µ11 − 257152µ2µ3µ5µ6 +
5597760µ22µ3µ4µ5 − 322560µ2µ3µ4µ7)/n
where n is the sample size.
[1] B. Mohanty, Nucl. Phys. A 830, 899C (2009)doi:10.1016/j.nuclphysa.2009.10.132 [arXiv:0907.4476[nucl-ex]].
[2] STAR Internal Note on Experimental Study of the QCD PhaseDiagram & Search for the Critical Point: Selected Argu-ments for the Run-10 Beam Energy Scan - SN0493, (2009) :https://drupal.star.bnl.gov/STAR/starnotes/public/sn0493
[3] STAR Internal Note on Studying the Phase Dia-gram of QCD Matter at RHIC - SN0598, (2014) :https://drupal.star.bnl.gov/STAR/starnotes/public/sn0598
[4] M. M. Aggarwal et al. [STAR Collaboration], Phys. Rev. Lett.105, 022302 (2010) doi:10.1103/PhysRevLett.105.022302[arXiv:1004.4959 [nucl-ex]].
[5] L. Adamczyk et al. [STAR Collaboration], Phys. Rev. Lett.112, 032302 (2014) doi:10.1103/PhysRevLett.112.032302[arXiv:1309.5681 [nucl-ex]].
[6] L. Adamczyk et al. [STAR Collaboration], Phys. Rev. Lett. 113,092301 (2014).
[7] L. Adamczyk et al. [STAR Collaboration], Phys. Lett.B 785, 551 (2018) doi:10.1016/j.physletb.2018.07.066[arXiv:1709.00773 [nucl-ex]].
[8] P. Braun-Munzinger and J. Stachel, Nature 448, 302 (2007).doi:10.1038/nature06080
[9] Y. Aoki, G. Endrodi, Z. Fodor, S. D. Katz and K. K. Sz-abo, Nature 443, 675 (2006) doi:10.1038/nature05120 [hep-lat/0611014].
[10] S. Ejiri, Phys. Rev. D 78, 074507 (2008)doi:10.1103/PhysRevD.78.074507 [arXiv:0804.3227 [hep-lat]].
[11] E. S. Bowman and J. I. Kapusta, Phys. Rev. C 79, 015202
(2009) doi:10.1103/PhysRevC.79.015202 [arXiv:0810.0042[nucl-th]].
[12] M. A. Stephanov, Prog. Theor. Phys. Suppl. 153, 139 (2004)[Int. J. Mod. Phys. A 20, 4387 (2005)]; Z. Fodor and S. D. Katz,JHEP 04, 050 (2004).
[13] R. V. Gavai and S. Gupta, Phys. Rev. D 78, 114503 (2008);Phys. Rev. D 71, 114014 (2005); S. Gupta, PoS CPOD 2009,025 (2009).
[14] S. Gupta, X. Luo, B. Mohanty, H. G. Ritter andN. Xu, Science 332, 1525 (2011) doi:10.1126/science.1204621[arXiv:1105.3934 [hep-ph]].
[15] M. A. Stephanov, Phys. Rev. Lett. 102, 032301 (2009);C. Athanasiou et al., Phys. Rev. D 82, 074008 (2010).
[16] M. Asakawa, S. Ejiri and M. Kitazawa, Phys. Rev. Lett.103, 262301 (2009) doi:10.1103/PhysRevLett.103.262301[arXiv:0904.2089 [nucl-th]].
[17] M. A. Stephanov, Phys. Rev. Lett. 107, 052301 (2011)doi:10.1103/PhysRevLett.107.052301 [arXiv:1104.1627 [hep-ph]].
[18] B. Friman, F. Karsch, K. Redlich and V. Skokov, Eur. Phys.J. C 71, 1694 (2011) doi:10.1140/epjc/s10052-011-1694-2[arXiv:1103.3511 [hep-ph]].
[19] A. Adare et al. [PHENIX Collaboration], Phys. Rev. C93, no. 1, 011901 (2016) doi:10.1103/PhysRevC.93.011901[arXiv:1506.07834 [nucl-ex]].
[20] S. Jena [ALICE Collaboration], Prog. Theor. Phys. Suppl. 193,301 (2012) doi:10.1143/PTPS.193.301 [arXiv:1201.0130 [hep-ex]].
[21] B. B. Abelev et al. [ALICE Collaboration], Eur. Phys. J. C74, no. 10, 3077 (2014) doi:10.1140/epjc/s10052-014-3077-y

14
[arXiv:1407.5530 [nucl-ex]].[22] A. Rustamov [ALICE Collaboration], Nucl. Phys. A
967, 453 (2017) doi:10.1016/j.nuclphysa.2017.05.111[arXiv:1704.05329 [nucl-ex]].
[23] M. Cheng, P. Hegde, C. Jung, F. Karsch, O. Kaczmarek,E. Laermann, R. D. Mawhinney and C. Miao et al., Phys. Rev.D 79, 074505 (2009).
[24] R. Esha [STAR Collaboration], PoS CPOD 2017, 003 (2018).doi:10.22323/1.311.0003
[25] X. Luo [STAR Collaboration], PoS CPOD 2014, 019 (2015)doi:10.22323/1.217.0019 [arXiv:1503.02558 [nucl-ex]].
[26] A. DasGupta, Asymptotic Theory of Statistics and Probabil-ity, Published by Springer-Verlag New York. doi:10.1007/978-0-387-75971-5
[27] B. Efron, The Annals of Statistics 7 p1-26(1979)[28] B. Efron, Computers and the Theory of Statistics:
Thinking the Unthinkable; SIAM Review, Publishedby Society for Industrial and Applied Mathematics (url:
http://www.jstor.org/stable/2030104.)[29] N. M. Abdelwahab et al. [STAR Collaboration], Phys. Rev.
C 92, no. 2, 021901 (2015) doi:10.1103/PhysRevC.92.021901[arXiv:1410.5375 [nucl-ex]].
[30] S. Acharya et al. [ALICE Collaboration], [arXiv:1712.07929[nucl-ex]].
[31] X. Luo, J. Phys. G 39, 025008 (2012) doi:10.1088/0954-3899/39/2/025008 [arXiv:1109.0593 [physics.data-an]].
[32] X. Luo, Phys. Rev. C 91, no. 3, 034907 (2015) Er-ratum: [Phys. Rev. C 94, no. 5, 059901 (2016)]doi:10.1103/PhysRevC.91.034907, 10.1103/Phys-RevC.94.059901 [arXiv:1410.3914 [physics.data-an]].
[33] True value of 7th order cumulant for √sNN= 200 GeV in Bi-nomial model is 0.14. The relative error (|Cmeas.−Ctrue
Ctrue|) takes
up large value because of vanishingly small value of the denom-inator.