nitrogen mineralization and nitrification in a mixed ...(miller and mcbride 1999). fertilizer was...
TRANSCRIPT

Nitrogen mineralization and nitrification in amixed-conifer forest in southern California:controlling factors, fluxes, and nitrogenfertilization response at a high and low nitrogendeposition site
Mark E. Fenn, Mark A. Poth, Joseph D. Terry, and Timothy J. Blubaugh
Abstract: Net fluxes of nitrogen (N) mineralization and nitrification were measured in situ on a monthly basis for3 years at a high (HN) and low (LN) N deposition site in the San Bernardino Mountains, California. Mean N mineral-ization fluxes in the forest floor and top 10 cm of mineral soil were 19.0 and 59.8 kg N·ha–1·year–1 at LN and HN,respectively. Mean net nitrification fluxes were 11.2 and 55.9 kg N·ha–1·year–1 at LN and HN, respectively. Relativenitrification (the percent N mineralized that was nitrified) was generally lower under Pinus ponderosa Dougl. ex P. &C. Laws. (or Pinus jeffreyi Grev. & Balf.) canopies than under Quercus kelloggii Newb. or open canopies. The rate ofnet N mineralization was the key factor for predicting the rate of net nitrification. Fertilization with 50 and 150 kgN·ha–1 at LN significantly increased the rates of net mineralization and net nitrification. At HN fertilization had nosignificant effect on net nitrification. We conclude that at low-deposition sites increased nitrification occurs in the shortterm in response to added N, but that sustained elevated net nitrification is driven by the accumulation of N-enrichedlitter and soil organic matter in conjunction with chronic throughfall N deposition inputs.
Résumé : Les flux nets de minéralisation de l’azote (N) et de nitrification ont été mesurés in situ sur une base men-suelle, pendant 3 ans, dans des stations avec un niveau élevé (NE) ou faible (NF) de dépôts de N dans les montagnesde San Bernardino, en Californie. Les flux moyens de minéralisation de N dans la couverture morte et dans les premiers10 cm du sol minéral ont atteint respectivement 19,0 et 59,8 kg N·ha–1·an–1 pour NF et NE. Les flux moyens nets denitrification ont atteint respectivement 11,2 et 55,9 kg N·ha–1·an–1 pour NF et NE. La nitrification relative (le pourcentagede N minéralisé qui a été nitrifié) était généralement plus faible sous les canopées de Pinus ponderosa Dougl. ex P. &C. Laws. (ou Pinus jeffreyi Grev. & Balf.) que sous canopées de Quercus kelloggii Newb. ou sous des canopées ouvertes.Le taux de minéralisation nette de N était le facteur clé pour prédire le taux de nitrification nette. La fertilisation avec50 et 150 kg N·ha–1 a significativement accru les taux de minéralisation nette et de nitrification nette dans le cas deNF. Dans le cas de NE, la fertilisation n’a pas eu d’effet significatif sur la nitrification nette. Nous concluons que dansles sites où les dépôts sont faibles, l’accroissement de la nitrification apparaît à court terme en réponse à l’ajout de Nmais qu’un niveau élevé et soutenu de nitrification nette est sous le contrôle d’une litière et d’une matière organique dusol enrichies en N en conjonction avec les apports chroniques associés aux dépôts de N dans la précipitation au sol.
[Traduit par la Rédaction] Fenn et al. 1486
Introduction
The global nitrogen (N) cycle has been perturbed by humanactivities and anthropogenic emissions, and atmospheric de-position of inorganic N has risen about threefold above pre-industrial levels (Smil 2001). Increased inputs of N fromanthropogenic activities cause excessive N enrichment ofaquatic and terrestrial systems in many parts of the world.Nitrogen deposition also stimulates N mineralization and nitri-fication, thus further contributing to mobilization of N andN-saturation conditions (Aber et al. 1989). Nitrification isthe key process that mobilizes N from accumulated organicN in N-saturated ecosystems. The principal pathways by whichN is lost from the system is as leachable nitrate (NO3
–) and asnitrogenous trace gas emissions from soil. More information onthe ecological effects of reactive N inputs can be found in Aberet al. (2003), Fenn et al. (2003a), and Galloway et al. (2003).
Can. J. For. Res. 35: 1464–1486 (2005) doi: 10.1139/X05-068 © 2005 NRC Canada
1464
Received 29 June 2004. Accepted 4 May 2005. Published onthe NRC Research Press Web site at http://cjfr.nrc.ca on29 July 2005.
M.E. Fenn,1 M.A. Poth,2 J.D. Terry,3 and T.J. Blubaugh.USDA Forest Service, Pacific Southwest Research Station,Forest Fire Laboratory, 4955 Canyon Crest Drive, Riverside,CA 92507, USA.
1Corresponding author (e-mail: [email protected]).2Present address: USDA - Cooperative State, Research,Education, and Extension Service, National ResearchInitiative Competitive Grants Program, Stop 2241, 1400Independence Avenue SW, Washington, DC 20250, USA.
3Present address: Everglades National Park, South FloridaEcosystem Office, 950 North Krome Avenue, Third Floor,Homestead, FL 33030, USA.

Montane forests and watersheds exposed to air pollutionin the San Gabriel and San Bernardino Mountains (SBM) insouthern California are N saturated, as indicated by stream-water NO3
– export patterns, elevated nitric oxide emissionsfrom soil, and other edaphic and vegetative indicators of Nenrichment (Fenn et al. 1996, 1998). Nitrogen deposition inthe western end of the SBM is unusually high as a result ofemissions from fossil fuels in the greater Los Angeles areaand from dairy farms in the Chino–Norco area 34 km to thesouthwest. Nitrogen deposition is also elevated in the SBMbecause of high levels of occult deposition during periodicfog episodes (Fenn et al. 2000; Fenn and Poth 2004). Nitro-gen deposition in the SBM declines sharply with distancefrom the source areas, presumably because of the high depo-sition velocities of nitric acid vapor and ammonia, and vary-ing N-deposition inputs in fog.
The ratio of mineral N that is nitrified has been referred toas “relative nitrification” (Robertson 1982) and has frequentlybeen used as an indicator of the nitrification activity in soils(Aber et al. 2003; Gilliam et al. 2001; Lavoie and Bradley2003; Williard et al. 1997). Relative nitrification is high inmineral soil from the SBM, with little ammonium (NH4
+)present (Fenn et al. 1996; Fenn and Poth 2001). However,relative nitrification is lower in the litter layer than in themineral soil (Fenn et al. 1996). Relative nitrification is highin soils throughout the SBM and in the southern Sierra Nevada,and values increase with N deposition (Fenn et al. 1996,2003b), but this has not been tested in situ.
The primary objectives of this study were (i) to quantifyrates of net N mineralization and nitrification in the humuslayer and mineral soil under field conditions in fertilized andunfertilized plots at a high N deposition forest site that isseverely N saturated and at a low N deposition site, (ii) todetermine whether relative nitrification patterns in field assaysare similar to the results of laboratory studies, (iii) to deter-mine the main factors affecting N cycling rates in the mineral
soil and in the forest floor, and (iv) to test the hypothesisthat after 2 to 3 years of N fertilization with a slow-releaseurea formulation, net nitrification rates at the low-N sitewould approach those of the high-N site.
Materials and methods
Study sitesThese N cycling measurements were carried out from
March 1997 to January 2000 at a high and a low N deposi-tion research site in the SBM. The SBM are located ca.70 km east of Los Angeles, California. Camp Paivika (HN)is a high-pollution site on the western end of the air pollu-tion gradient in the SBM, and Camp Osceola (LN) is a rela-tively low N deposition site 46 km to the east of HN (Fennet al. 2000). Throughfall N inputs are 10-fold greater at HNthan at LN (Table 1). Forests at the study sites are classifiedas mixed-conifer forest. Because of the prevalent Mediterra-nean climate, moisture stress is common, although plantgrowth often responds to N fertilization (Fenn and Poth 2001).Annual precipitation at HN and LN was 25% and 34% be-low normal in 1997, 80% and 15% above normal in 1998,and 42% and 69% below normal in 1999. The primary useof these forests is recreational. Logging has not occurred formany years, and forest fires have been suppressed since theearly 1900s, leading to stand densification and allowing greaterforest floor and N accumulation; N deposition is believed tocontribute further to these stand effects (Fenn et al. 2003b).Data are not available on the effects of chronic N depositionon vegetation community changes, but bracken fern (Pteridiumaquilinum var. pubescens Underw.), an N-loving species, domi-nates the understory at HN. The sparse understory at LN iscomposed of a few shrubs and assorted herbaceous species.The parent material of the soils at both sites is partiallyweathered or decomposed granite. Foliar ozone injury isnegligible in pine at LN, but at HN this pollutant causes pre-
© 2005 NRC Canada
Fenn et al. 1465
Characteristic Camp Paivika Camp Osceola
Elevation (m) 1580 2135Average annual precipitation (mm) 987 608Average annual temperature (°C) 12.9 10.6
Nitrogen deposition as throughfall (kg N·ha–1·year–1)Under tree canopy 193.9 18Integrated stand total 81.6 8.3
Ozone (ppb)Summertime 24-h hourly average 67.5 60.9Summertime average peak values 101.6 91.3
Annual precipitation (mm)1997 742 4011998 1772 6991999 415 187
Soil type Coarse-loamy, mixed mesic Ultic Haploxerollsof the Shaver series
Coarse-loamy, mixed, frigidXerumbrepts and Xerochrepts
Dominant overstory species Pinus ponderosa Dougl. ex P. & C. Laws.,Quercus kelloggi Newb., Calocedrus decurrens (Torr.)Florin., Pinus lambertiana Dougl.
Pinus jeffreyi Grev. & Balf.,Abies concolor Gord. & Glend.
Table 1. Description of the two mixed-conifer forest sites used in this study.

mature abscission of luxurious foliar growth in pine (as a re-mature abscission of luxurious foliar growth in pine (as a re-sult of N deposition; Grulke and Balduman 1999). The endresult is a high rate of N-enriched litter production and accu-mulation (Arbaugh et al. 1999; Fenn et al. 2003b). Addi-tional site information is presented in Tables 1 and 2.
Experimental designAt both study sites, the experimental plots were estab-
lished in a randomized complete-block design with threeblocks. Each block included three plots: an unfertilized con-trol and a low (50 kg N·ha–1·year–1) and a high (150 kgN·ha–1·year–1) N fertilization plot. Each plot included at least20 ponderosa pine (Pinus ponderosa Dougl. ex P. & C. Laws.)or Jeffrey pine (Pinus jeffreyi Grev. & Balf.) trees, 20 Californiablack oak (Quercus kelloggii Newb.) trees, and a large, openarea with no canopy cover. Only trees without mistletoe orother pest damage were chosen. Selected trees were perma-nently tagged for long-term studies. At both HN and LN,one of the unfertilized plots was located within long-termozone injury study plots established in the early 1970s(Miller and McBride 1999). Fertilizer was applied annuallybeginning in 1997 on an individual-tree basis to an area cir-cumscribed by the drip line and a 4-m diameter zone beyondthe drip zone. Fertilizer was applied in winter or early springas a slow-release granular ureaformaldehyde formulation.
Net N mineralization and nitrification measurementsAnnual net N mineralization and net nitrification rates
were determined monthly for the forest floor (L, F, and Hhorizons combined) and the upper 10 cm of mineral soilusing the soil tube method of in situ incubation (Raison et
al. 1987). Tubes were inserted through the forest floor andinto the underlying mineral soil with a rubber mallet. Inser-tion of the soil tubes (i.d. = 3.3 cm) caused minor soil com-paction. Only the organic horizon and the top 10 cm of themineral soil core were used for these assays. However, becauseof soil compaction caused by insertion, we actually sampledthe mineral soil to a depth slightly greater than 10 cm. Afterinsertion, a PVC cap was placed on the tube to exclude pre-cipitation and soil disturbance. Holes were drilled into thesides of the caps for aeration. Subsamples of the initial (day0) and incubated forest floor and mineral soil samples (afterca. day 30) were extracted with 2 mol/L KCl and analyzedfor NH4
+ and NO3– with a Technicon TRAACS 800
Autoanalyzer4 (Tarrytown, N.Y.), and net monthly NH4+ and
NO3– production were calculated (day 30 – day 0). Annual
rates of net N mineralization and net nitrification were cal-culated as the sum of the monthly means under each canopytype for each calendar year. The net rates for months withmissing data were estimated as the average of the two near-est months. The moisture contents of soil and the forest floorwere also determined in subsamples from each soil core col-lected throughout the study.
Soil cores were incubated under three different canopycover types — mature ponderosa pine or Jeffrey pine, Californiablack oak, and canopy-free open areas — to test the effect ofcanopy cover or plant species on N cycling. However, be-cause of the mixed-species nature of these forest stands, theforest floor includes litter from a mix of tree species. Foreach 30-day incubation period, soil tubes were installed un-der randomly selected oak and pine trees or in the open areaof each of the long-term plots. Random sampling locations
© 2005 NRC Canada
1466 Can. J. For. Res. Vol. 35, 2005
Site andcanopy type pH
pH pvalue*
Forest floormass (kg·m–2)
Forest floormass p value* % C % N
%N pvalue* C/N
C/N pvalue*
Forest floorLN
Oak 5.15 (0.15)a 0.0001 9.13 (0.62)b 0.0001 26.61 (2.16)a 0.76 (0.06)a 0.005 36.86 (3.71)a 0.03Open 4.09 (0.11)b 7.24 (0.80)c 0.0001 22.01 (4.82)a 0.62 (0.19)a 37.15 (3.71)a 0.05Pine 4.17 (0.10)b 9.34 (0.66)a 0.0001 27.63 (2.85)a 0.67 (0.06)a 0.001 40.70 (3.11)a 0.004
HNOak 4.20 (0.06)a 13.48 (0.78)b 30.18 (2.06)a 1.07 (0.08)a 28.57 (1.19)abOpen 4.34 (0.18)a 17.13 (1.23)a 15.00 (1.70)b 0.57 (0.07)b 26.25 (1.52)bPine 4.09 (0.06)a 16.16 (0.28)a 30.30 (2.27)a 1.00 (0.07)a 29.91 (0.79)a
Mineral soil
LNOak 5.56 (0.13)a 0.0001 3.33 (0.30)a 0.13 (0.01)a 0.03 25.75 (0.96)a 0.0001Open 4.97 (0.07)b 0.05 2.63 (0.58)a 0.10 (0.03)a 25.61 (1.88)a 0.05Pine 5.13 (0.08)b 0.0001 2.92 (0.26)a 0.11 (0.009)a 0.05 25.53 (0.69)a 0.0001
HNOak 4.21 (0.09)ab 3.12 (0.18)a 0.16 (0.008)a 19.81 (0.32)aOpen 4.55 (0.13)a 2.50 (0.25)a 0.13 (0.01)a 19.94 (0.08)aPine 4.10 (0.09)b 3.02 (0.29)a 0.15 (0.01)a 19.66 (0.27)a
Note: LN, low N deposition site; HN, high N deposition site. Across canopy cover types, means with different letters are significantly different (p ≤0.05) within a given site and soil horizon (e.g., LN oak, open, and pine forest floor).
*The p values for each variable are for site to site comparisons for a given canopy cover type and soil horizon (e.g., LN oak forest floor versus HNoak forest floor). Only significant p values are given.
Table 2. Mean values for pH, forest floor mass, percent C, percent N, and C/N in mineral soil and forest floor at the two study sites(unfertilized plots).
4 Mention of trade names or products is for information only and does not imply endorsement by the USDA.

were relocated every 6 months to avoid excessive soil dis-turbance. Soil tubes were installed in each of three replicateplots per fertilization level each month. Thus, n = 3 for netN mineralization and nitrification measurements in the forestfloor and mineral soil of each of the canopy cover types(open, pine, or oak) for each fertilization level. In spring2003, forest floor and mineral soil (0–10 cm depth) sampleswere collected near the study trees and open areas for mea-surement of pH and total carbon (C) and N in the forestfloor and mineral soil. Mineral soil and forest floor pH val-ues were determined in 0.01 CaCl2 (soil–solution mixtures of1:2 in mineral soil and 1:4 in forest floor, m/m) and total Cand N were determined by combustion analysis (Carlo ErbaInstruments, Milan, Italy; Model NA 1500, series 2).
Statistical analysesStatistical comparisons were made using the nonparametric
Kruskal–Wallis rank-sum test in S-PLUS 2000 (Venables andRipley 2002) because data were not normally distributed anddid not have similar variances. Differences between treat-ments with p value of ≤0.10 were considered to be statisticallysignificant. Both median and mean rates of net mineraliza-tion and nitrification better define the distribution of the dataat the two sites. Median values demonstrate the general dis-tribution of the data over the 3-year period, while mean valuesreflect the importance of spikes in microbial activity duringthe growing season. Box and whiskers plots were used todemonstrate the distribution of the data over the 3-year pe-riod. Relative nitrification (Robertson 1982) was calculatedas the percentage of the N mineralized that was nitrified.When average net values for net N mineralization or nitrifica-tion were negative, these values were excluded from calculationsof relative nitrification.
A general additive regression model (Hastie and Tibshirani1990) was used to study the type and significance of rela-tionships between various explanatory variables and theresponse variable of interest. The following model was usedfor studying the effects of covariates on the rates of net min-eralization and net nitrification:
(N transformation) = µ + f(x1) + f(x2) + … + ε
where the rate of N transformation was either net mineral-ization or net nitrification (mg N·m–2·d–1) at a given site andsoil horizon and for given environmental conditions, µ is theoverall mean rate of N transformation (mg N·m–2·d–1) for thegiven site and soil horizon over varying environmental con-ditions, f is the nonparametric transformation of the explana-tory variables (x1, x2, etc.), and ε is an estimate of randomerror. Explanatory variables that were significant in the modelare given in Table 3.
The general additive model technique, GAM in S-PLUS2000 (Venables and Ripley 2002), uses a locally weightedsmoothing routine (Cleveland and Devlin 1988) to estimatethe nonparametric transformations simultaneously with theother terms in the model. The model lets the data suggest theshape of the relationship between the explanatory variablesand the response of interest within the context of holdingvariables in the model constant. The following factors wereincluded in the statistical model testing for the main factorsaffecting N mineralization and nitrification rates: inorganicN at time 0, net mineralization (in the case of net nitrifica-tion), soil moisture content, soil temperature, mineral soil orforest floor pH, topographic slope and position, Julian date,canopy type, total precipitation (30 days prior to time 0), Cand N content, C/N ratio, woody debris cover, and amountof litter in the forest floor. The least significant variableswere removed one by one from the model based on thestrength of their individual significance (p > 0.05 in the lin-ear summary.lm and the nonparametric summary S-PLUSfunctions), the effect of their removal on the overall modelfit (multiple r2 reduced by less than 0.02), and to alleviatecorrelations among the independent variables creating falselevels of significance. Square-root transformations of someof the variables were used, as they improved the overallmodel fit better than did log transformations.
Results
Low-N versus high-N sites: unfertilized plotsNet nitrification rates in the forest floor and mineral soil
were significantly higher at HN than at LN in all threecanopy cover types. Nitrogen mineralization rates were alsosignificantly greater at HN than at LN in every instance
© 2005 NRC Canada
Fenn et al. 1467
Variable name Description of variable
Canopy type Oak, open, or pineSqrt moisture Square root of average of day 0 and day 30 (mineral soil or forest floor) moisture content (%)Soil temperature Average of day 0 and day 30 soil temperature (°C)Sqrt initial NH4+ Square root of day 0 NH4
+ (mg NH4+-N·(kg forest floor or mineral soil)–1)
Sqrt initial NO3– Square root of day 0 NO3
– (mg NO3–-N·(kg forest floor or mineral soil)–1)
Net mineralization Simultaneous measured rate of net mineralization (mg N·m–2·d–1)Sqrt precipitation Square root of total precipitation (mm) in the 30 days preceding day 0 of the soil core incubationPercent C Carbon content (%) of forest floor or mineral soil horizonPercent N Nitrogen content (%) of forest floor or mineral soil horizonC/N ratio (% C / % N)Julian date Day 0 sampling date relative to 1 January 1900Slope % Topographic slope (%)pH Mineral soil or forest floor pH in 0.01 mol/L CaCl2
Wood cover Amount of surface covered by woody debris (%)
Table 3. Significant variables in the general additive regression model used to determine the type and significance of therelationships between the explanatory variables and net N mineralization and nitrification rates.

except in forest floor under oak canopies (Table 4). Medianvalues of net N mineralization (mg N·m–2·d–1) in forest floorwere 7–12 times higher at HN than at LN, and values of netnitrification were 18- to 45-fold greater at HN than at LNunder the three canopy cover types. Nitrogen fluxes in forestfloor on an area basis were much greater at HN because ofgreater fluxes per litter mass and the high litter accumulationat HN. Median rates of net N mineralization and nitrification(mg N·m–2·d–1) in mineral soil were 4–8 times greater at HNthan at LN (Table 4).
Net N mineralization rates in the forest floor from thethree canopy cover types, on a per-mass basis (mg N·kg–1·d–1),were 5–7 times higher at HN than at LN, while net nitrifica-tion rates were 14–18 times higher at HN (Table 4). Therewas much greater variability in net N mineralization and netnitrification at HN, as expected because of the much higheractivity levels in mineral soil and forest floor at HN (Table 4).Net mineralization and nitrification rates with negative valueswere found in some instances, indicating net immobilizationof NH4
+ and NO3– during some of the 30-day field incuba-
tions. Greater negative values or higher net inorganic N im-mobilization rates were measured at HN compared with LN.
Total fluxes and forest floor versus mineral soil:unfertilized plots
The mean annual rate of net N mineralization and themean annual rate of nitrification in the soil column (theforest floor plus top 10 cm of mineral soil) for the threecanopy cover types combined over the 3 years of the studywere 19.0 and 11.2 kg N·ha–1·year–1 at LN compared with59.8 and 55.9 kg N·ha–1·year–1 at HN, respectively. Netnitrification in the soil column ranged from 4.8 to 19.0 kg
N·ha–1·year–1 at LN and from 26.0 to 82.8 kg N·ha–1·year–1
at HN among the three canopy types and the 3 years of thestudy (Table 5).
Under open and pine canopies at LN, the forest flooraccounted for only 5%–16% of net N mineralization and10%–15% of net nitrification. Under oak at LN, the forestfloor accounted for 48% of net N mineralization and 39% ofnet nitrification (Table 5). Under oak and open canopies atHN the forest floor accounted for 55%–56% of net N miner-alization and 38% of net nitrification. Under pine at HN, theforest floor accounted for 48% of net N mineralization and26% of net nitrification.
Relative nitrification index in unfertilized plotsRelative nitrification is a potential indicator of N satura-
tion. In mineral soil and forest floor, relative nitrificationwas higher at HN than at LN, except for pine forest floor(Table 5). Relative nitrification in mineral soil under oak andopen canopies was >100% at HN compared with ~75% atLN. Relative nitrification in forest floor under oak and opencanopies was 92% and 78% at HN compared with 53% and43% at LN, respectively. Relative nitrification in pine forestfloor was only 21% and 40% at HN and LN compared with80% and 36% in mineral soil under pine at HN and LN, re-spectively (Table 5).
Effect of canopy cover type: unfertilized plotsThere were no significant differences in net mineralization
in the forest floor among the three canopy types at eithersite. However, net nitrification rates in forest floor under oakcanopies were generally higher than rates under pine at LNand HN (Table 4). Relative nitrification was lower under
© 2005 NRC Canada
1468 Can. J. For. Res. Vol. 35, 2005
N mineralization Nitrification
Site andcanopy type mg N·m–2·d–1
pvalue* mg N·kg–1·d–1
pvalue* mg N·m–2·d–1
pvalue* mg N·kg–1·d–1
pvalue*
Forest floor
LNOak 0.76, 3.42 (1.51)a 0.08, 0.28 (0.12)a 0.04 0.52, 1.97 (0.64)a 0.0001 0.04, 0.16 (0.05)a 0.0002Open 0.97, 1.28 (0.35)a 0.009 0.11, 0.17 (0.04)a 0.002 0.20, 0.52 (0.13)ab 0.0001 0.03, 0.08 (0.02)ab 0.0001Pine 1.49, 0.34 (1.33)a 0.0007 0.10, 0.0004 (0.09)a 0.18, 0.39 0.27)b 0.0003 0.02, 0.03 (0.02)b 0.0006
HNOak 5.20, 9.21 (6.34)a 0.37, 0.62 (0.36)a 9.13, 11.75 (2.49)a 0.55, 0.68 (0.13)aOpen 11.48, 9.87 (4.53)a 0.60, 0.50 (0.23)a 8.94, 10.45 (2.43)a 0.41, 0.54 (0.12)ab
Pine 13.34, 16.99 (9.02)a 0.67, 0.84 (0.38)a 6.82, 4.03 (3.17)a 0.36, 0.30 (0.11)b
Mineral soil
LNOak 1.05, 2.40 (0.76)a 0.017 0.01, 0.02 (0.01)a 0.017 1.05, 1.88 (0.37)b 0.0002 0.01, 0.02 (0.004)b 0.0002Open 3.16, 4.70 (1.13)a 0.001 0.03, 0.04 (0.01)a 0.001 2.11, 3.52 (0.57)a 0.0001 0.02, 0.03 (0.01)a 0.0001Pine 2.11, 4.00 (0.87)a 0.005 0.02, 0.04 (0.01)a 0.005 1.05, 1.55 (0.29)b 0.0001 0.01, 0.01 (0.003)b 0.0001
HNOak 7.38, 5.22 (2.23)b 0.07, 0.05 (0.02)b 7.38, 6.30 (1.93)b 0.07, 0.06 (0.02)bOpen 11.07, 10.38 (2.92)a 0.11, 0.10 (0.03)a 10.02, 11.97 (2.00)a 0.10, 0.11 (0.02)aPine 8.96, 10.99 (2.40)a 0.09, 0.10 (0.02)a 8.43, 9.20 (1.98)ab 0.08, 0.09 (0.02)ab
Note: The first value is the median, the second value is the mean, and the standard error is in parentheses. LN, low N deposition site; HN, high Ndeposition site. Across canopy cover types, means with different letters are significantly different (p ≤ 0.10) within a given site and soil horizon (e.g., LNoak, open, and pine forest floor).
*The p values for each variable are for site to site comparisons for a given canopy cover type and soil horizon (e.g., LN oak forest floor versus HNoak forest floor). Only significant p values are given.
Table 4. Three-year median, mean, and standard error of the mean values for net N mineralization and nitrification.

© 2005 NRC Canada
Fenn et al. 1469
Site and canopy typeSoilhorizon
N mineralization(kg N·ha–1·year–1)
Nitrification(kg N·ha–1·year–1)
Relativenitrification (%) Reference*
LNOak FF 12.4, 5.7, 8.3 4.5, 5.7, 3.9 52.9 This studyOpen FF 2.4, 4.2, 3.6 2.2, 1.1, 1.1 42.9Pine FF –5.7, 6.9, 1.4 –0.3, 2.3, 1.0 39.9Mean relative nitrification (all cover types) FF 45.2
HNOak FF 42.3, 35.8, –0.8 24.7, 47.2, 25.9 92.0 This studyOpen FF –12.3, 38.5, 43.3 14.3, 31.9, 31.8 77.8Pine FF –48.3, 86.6, 62.9 –0.7, 13.0, 19.0 21.4Mean relative nitrification (all cover types) FF 63.7
LNOak MS 11.2, 7.3 10.2 7.7, 8.2, 5.9 75.7 This studyOpen MS 15.8, 19.0, 19.2 16.8, 11.4, 11.8 74.2Pine MS 18.3, 15.1, 15.4 6.3, 7.5, 3.8 35.9Mean relative nitrification (all cover types) MS 61.9
HNOak MS 30.4, 35.8, –1.7 36.8, 35.6, 5.7 109.6 This studyOpen MS 55.3, 28.6, 31.2 51.4, 32.7, 45.0 112.2Pine MS 43.8, 55.5, 11.7 29.3, 52.1, 7.0 79.6Mean relative nitrification (all cover types) MS 100.5
Additional data from the SBM and Sierra Nevada mixed-conifer sites (8-week laboratory incubations)
HN (SBM) FF 40.0 Average value from Fennet al. 1996, 2003b
HN (SBM) MS 98.3 Average value from Fennet al. 1996, 2003b
Dogwood (SBM, high-pollution site) FF 94.5 Fenn et al. 1996Dogwood (SBM, high-pollution site) MS 78.2 Fenn et al. 1996LN (SBM) FF 47.1 Average value from Fenn
et al. 1996, 2003bLN (SBM) MS 82.3 Average value from Fenn et
al. 1996, 2003bHeart Bar (SBM, low-pollution site) FF 82.5 Fenn et al. 1996Heart Bar (SBM, low-pollution site) MS 80.1 Fenn et al. 1996Mountain Home (southern Sierra, moderate-
pollution site)FF 87.7 Fenn et al. 2003b
Mountain Home (southern Sierra, moderate-pollution site)
MS 93.9 Fenn et al. 2003b
Sites from western North America
Northern California, Cascade Range, mixed-conifer forest
FF 18.1 10.7 59.1 Powers 1990
Northern California, Cascade Range, mixed-conifer forest upper 15 cm
MS 40.4 28.8 71.3 Powers 1990
Northern Arizona, ponderosa pine – bunchgrass FF 2.0 0.5 25.0 Kaye and Hart 1998Northern Arizona, ponderosa pine – bunchgrass,
upper 15 cmMS 7.5 3.6 48.0 Kaye and Hart 1998
New Mexico, ponderosa pine FF 0.4 Gosz and White 1986New Mexico, ponderosa pine, upper 10 cm MS 36.2 Gosz and White 1986Old-growth Douglas-fir and western hemlock,
central Oregon, upper 15 cmMS 18.6 4.5 24.2 Hart and Perry 1999
British Columbia, old-growth coastal coniferousforest
FF 5.9 Prescott 1997
British Columbia, old-growth coastal coniferousforest, upper 20 cm
MS 40.6 Prescott 1997
Sites from eastern North America
Harvard Forest, central Massachusetts, red pineforest (average of 4 years)
FF 46.5 2.2 4.7 Magill et al. 1997
Harvard Forest, central Massachusetts, red pineforest (average of 4 years)
MS 50.4 16.7 33.0 Magill et al. 1997
Table 5. Net N mineralization, net nitrification, and relative nitrification (%) by species and soil horizon (FF, forest floor; MS, mineralsoil) and comparison with values from the literature.

pine than under oak and open canopies in mineral soil atboth sites and in forest floor at HN (Table 5). At LN net Nmineralization in soil did not differ significantly among thethree cover types, but at HN the median N mineralizationvalue for mineral soil was significantly lower under oak (p =0.09) than under pine or in open areas (Table 4). At LN netnitrification rates in mineral soil were low, but they weregreater in open areas than in oak (p = 0.05) and pine (p =0.02). At HN there were no significant differences in nitrifi-cation in mineral soil among the three canopy types (mgN·m–2·d–1) except that rates in open mineral soil were higherthan those in oak mineral soil (p = 0.09).
General additive modelsThe general additive models display the nonlinear rela-
tionships between the explanatory variables — soil chemicaland physical conditions and environmental parameters —and the rates of net mineralization and net nitrification. Themodels for net mineralization show that the most importantterms are the initial NH4
+ and NO3– concentrations. Soil
moisture and temperature combined explained only 1% to6% of the variability of net mineralization at each site, whilethe initial NH4
+ and NO3– concentrations combined explained
from 3% to 25% of the variability. The model for net miner-alization in the forest floor shows a threshold initial NH4
+
concentration of 14 mg NH4+-N·(kg forest floor)–1 at LN
(Fig. 1c) and of 47.3 mg NH4+-N·(kg forest floor)–1 at HN
(Fig. 2b) above which net mineralization significantlydecreased (or net immobilization increased). Only at HNwas there a threshold initial NO3
– concentration (27.0 mgNO3
–-N·(kg forest floor)–1; Fig. 2c) above which net miner-alization in the forest floor significantly decreased. Thethreshold NH4
+ concentration in the mineral soil above whichnet mineralization in the mineral soil significantly decreasedwas 1.7 mg NH4
+-N·(kg soil)–1 at LN (Fig. 1g) and 2.0 mgNH4
+-N·(kg soil)–1 at HN (Fig. 2j). Only HN has a thresholdNO3
– concentration (7.0 mg NO3–-N·(kg soil)–1) above which
net mineralization in the mineral soil significantly decreased.Net mineralization was the best predictor of net nitrifica-
tion rates at both sites, explaining from 29% to 88% of thevariability. Net mineralization was positively related to netnitrification (Figs. 3a, 3g, 4b, 4e) with a slope of the linearportion of the relationship of 0.25 and 0.42 in the forestfloor at LN and HN and 0.39 and 0.89 in the mineral soil atLN and HN, respectively. The higher slopes in mineral soilrelative to the forest floor and at HN relative to LN reflectthe higher relative nitrification in soil and at HN. The satura-tion point above which further increases in the rate of netmineralization led to no change or a decrease in net nitrifica-tion was higher at HN than at LN. The addition of initialNH4
+ concentrations to the model for net nitrification increasedthe multiple r2 by 0.01–0.18. Initial NH4
+ concentrations inthe models show threshold values above which the rates ofnet nitrification increase. The threshold NH4
+ concentrations
© 2005 NRC Canada
1470 Can. J. For. Res. Vol. 35, 2005
Site and canopy typeSoilhorizon
N mineralization(kg N·ha–1·year–1)
Nitrification(kg N·ha–1·year–1)
Relativenitrification (%) Reference*
Harvard Forest, central Massachusetts, hard-wood forest (average of 4 years)
FF 48.8 0.0 0.0 Magill et al. 1997
Harvard Forest, central Massachusetts, hard-wood forest (average of 4 years)
MS 27.3 0.5 1.8 Magill et al. 1997
Northwestern Pennsylvania, hardwood forest,upper 15 cm, includes shallow forest floor
MS + FF 121.0 85.8 70.9 Bowden et al. 2000
Fernow, West Virginia, N-saturated matureforest, upper 5 cm
MS 123.8 114.3 92.3 Gilliam et al. 2001
Six mid-Appalachian watersheds with NO3–-N
export of 1–5 kg·ha–1·year–1, primarily hard-wood forests, upper 10 cm
MS 83.8 Williard et al. 1997
Adirondack mountains, New York; 0–15 cm depthconsisting mainly of forest floor, conifer forest
FF 82.4 2.4 2.9 Ohrui et al. 1999
Adirondack mountains, New York; 0–15 cm depthincluding forest floor in upper 5 cm and mostlymineral soil at 5–15 cm, hardwood forest
MS + FF 106.9 29.0 27.1 Ohrui et al. 1999
Mount Ascutney, Vermont, predominantly redspruce (data are average of 3 years)
FF 15.1 0.03 0.20 McNulty and Aber 1993
Summary results from literature surveys
Hardwood forests 87.4 39.4 40.3 Gilliam et al. 2001Hardwood forests 87.0 64.0 73.6 Bonilla and Rodà 1992Conifer forests 67.0 22.7 23.4 Gilliam et al. 2001Conifer forests 43.0 14.0 32.6 Bonilla and Rodà 1992
Note: LN, low N deposition site; HN, high N deposition site. Nitrogen mineralization and nitrification values given from this study are for 1997, 1998,and 1999, while the relative nitrification values were calculated from average values for the 3 years. Data for net mineralization and nitrification for thosetreatment combinations (site – canopy cover – soil horizon – year) in this study when annual net N mineralization was negative (5 of 36 instances) werenot included in the data summarized in this table and when calculating relative nitrification.
*For Prescott (1997) no annual rate data for N mineralization or nitrification are available, and the field assay was a 63-day incubation. In Williard etal. (1997), the field incubation time was 5 weeks. For Gosz and White (1986) relative nitrification values were calculated from five 10-week incubations.Data from the literature surveys of Gilliam et al. (2001) and Bonilla and Rodà (1992) are presumably mainly mineral soil data, but may also includeforest floor horizons in some cases.
Table 5. (concluded).

© 2005 NRC Canada
Fenn et al. 1471
2 4 6 8 10 12 14
sqrt Moisture (%)
-60
-40
-20
020
LN Forest Floor
Netm
inera
lization
(mg
N·m
·d)
–2
–1
Netm
inera
lization
(mg
N·m
·d)
–2
–1
(a)
0 10 20 30
Soil Temperature ( oC)
-60
-40
-20
020
(b)
0 2 4 6 8 10 12
sqrt Initial NH4+
-60
-40
-20
020
(c)
0 1 2 3 4 5 6
sqrt Initial NO3-
-60
-40
-20
020
r 2= 0.19
(d)
1 2 3 4 5 6
sqrt
-15
-10
-50
510
15
r2 = 0.15
LN Mineral Soil
(e)
0 10 20 30
Soil Temperature ( oC)
-15
-10
-50
510
15
(g)
0 10 20 30 40 50
-15
-10
-50
510
15
(h)
1 2 3 4 5 6
sqrt Moisture
-15
-10
-50
510
15
1 2 3 4 5 6
sqrt Moisture (%)
-15
-10
-50
510
15
(e)
0 10 20 30
Soil Temperature ( oC)
-15
-10
-50
510
15
(f)(f)
0 10 20 30 40 50
-15
-10
-50
510
15
0.5 1.0 1.5 2.0 2.5
sqrt Initial NH4+
-15
-10
-50
510
15
0.5 1.0 1.5 2.0 2.5
sqrt Initial NH4+
-15
-10
-50
510
15
(g)(g)
0 10 20 30 40 50
Wood Cover (%)
-15
-10
-50
510
15
(h)
Fig. 1. General additive model output showing the nonlinear relationships of soil chemical, soil physical, and environmental parametersin predicting the rate of net N mineralization in forest floor (a–d; r2 = 0.19) and mineral soil (e–h; r2 = 0.15) at Camp Osceola (lowN deposition site). The y axis in each of the plots represents the individual effect (mg N·m–2·d–1) of each dependent variable on pre-dicting net mineralization. The broken lines in each plot represent the standard error, while the tick marks along the x axis representindividual sample values. In the case of nonnumeric independent variables (e.g., canopy cover type), the plots show the effect of agiven discrete nonnumeric value of x (e.g., pine canopy) on the predicted rate of N transformation.

© 2005 NRC Canada
1472 Can. J. For. Res. Vol. 35, 2005
-60
-40
-20
020
Canopy Type
(g)
2 3 4 5 6 7
sqrt Moisture (%)
-60
-40
-20
020
(h)
5 10 15 20 25 30
Soil Temperature (oC)
-60
-40
-20
020
(i)
0.5 1.0 1.5 2.0 2.5 3.0
sqrt Initial NH
-60
-40
-20
020
(j)
1 2 3 4 5 6
sqrt
-60
-40
-20
020
r2 = 0.35
(k)
3.6 3.8 4.0 4.2 4.4 4.6 4.8
pH
-60
-40
-20
020
(l)
--
--
--
(g)
sqrt
--
-
(g)
sqrt
--
-
HN Mineral Soil
(h)
o
--
-
(i)
--
-
(i)
4+
--
--
-
Initial NO
--
-
(k)
--
-
(k)
--
-
(l)
2 4 6 8 10 12 14
sqrt Moisture (%)
-20
0-1
50
-10
0-5
00
50
HN Forest FloorN
etm
inera
lization
(mg
N·m
·d)
–2
–1
Netm
inera
lization
(mg
N·m
·d)
–2
–1
(a)
5 10 15 20 25
sqrt Initial NH4+
-200
-15
0-1
00
-50
05
0
(b)
2 4 6 8 10 12 14
sqrt Initial NO3-
-200
-150
-100
-50
05
0
(c)
7/97 7/98 7/99
Julian Date
-20
0-1
50
-10
0-5
00
50
(d)
10 15 20 25 30
Slope (%)
-20
0-1
50
-10
0-5
00
50
r2 = 0.31
(e)
0.6 0.8 1.0 1.2 1.4
% N-2
00
-15
0-1
00
-50
050
(f)
Oak Open Pine
3-
Fig. 2. General additive model output showing the nonlinear relationships of soil chemical, soil physical, and environmental parametersin predicting the rate of net N mineralization in forest floor (a–f; r2 = 0.31) and mineral soil (g–l; r2 = 0.35) at Camp Paivika (high Ndeposition site). See caption of Fig. 1 for a detailed description of the figure.

© 2005 NRC Canada
Fenn et al. 1473
-10
-50
51
0
Canopy Type
(f)
-20 0 20 40 60
Net Mineralization
-10
-50
51
0
LN Mineral Soil
(g)
1 2 3 4 5 6
sqrt Moisture (%)
-10
-50
51
0
(h)
0 10 20 30
So
Ne
tn
itri
fica
tio
n(m
gN
·m·d
)–
2–
1N
etn
itri
fica
tio
n(m
gN
·m·d
)–
2–
1
il Temperature (oC)
-10
-50
51
0
(i)
0.5 1.0 1.5 2.0 2.5
sqrt Initial NH4+
-10
-50
51
0
r2 = 0.53
(j)
-10
-50
51
0-1
0-5
05
10
(f)
-20 0 20 40 60
-10
-50
51
0
(f)
-20 0 20 40 60
-10
-50
51
0
(g)
1 2 3 4 5 6
-10
-50
51
0
(h)
0 10 20 30o
-10
-50
51
0
(h)
0 10 20 30o
-10
-50
51
0
(i)(i)
0.5 1.0 1.5 2.0 2.5+
-10
-50
51
0
0.5 1.0 1.5 2.0 2.5
-10
-50
51
0
r2 = 0.53
(j)
-40 -20 0 20 40 60 80
Net Mineralization
-15
-10
-50
510
15
(a)
0 2 4 6 8 10 12
sqrt Initial NH4+
-15
-10
-50
510
15
LN Forest Floor
(b)
0 5 10 15
sqrt Precip (mm)
-15
-10
-50
510
15
(c)
0.4 0.6 0.8 1.0 1.2 1.4 1.6
% N
-15
-10
-50
510
15
(d)
20 40 60 80
C/N ratio
-15
-10
-50
510
15
r2 = 0.40(e)
Oak Open Pine
Fig. 3. General additive model output showing the nonlinear relationships of soil chemical, soil physical, and environmental parametersin predicting the rate of net nitrification in forest floor (a–e; r2 = 0.40) and mineral soil (f–j; r2 = 0.53) at Camp Osceola (low N de-position site). See caption of Fig. 1 for a detailed description of the figure.

© 2005 NRC Canada
1474 Can. J. For. Res. Vol. 35, 2005
-100
- 50
050
100
150
r2
= 0.59
(a)
-200 0 200 400
Net Mineralization
-100
-50
050
100
150
(b)
-100
-50
050
100
150
Canopy Type
-100
-50
050
100
150
(a)
-200 0 200 400
n
-100
-50
050
100
150
(a)
-200 0 200 400
n
-100
-50
050
100
150
HN Forest Floor
(b)
Oak PineOpen
5 10 15 20 25
sqrt Initial NH4+
-100
-50
050
100
150
(c)
2 4 6 8 10 12 14
sqrt Initial NO
-100
-50
050
100
150
(d)
5 10 15 20 25
4+
-100
-50
050
100
150
-100
-50
050
100
150
(c)
2 4 6 8 10 12 14
-100
- 50
050
100
150
(c)
2 4 6 8 10 12 14
3
-100
- 50
050
100
150
(d)
-
-50 0 50
Net Mineralization
-80
-60
-40
-20
02
04
0
-
Net Minerali
Ne
tn
itri
fica
tio
n(m
gN
·m·d
)–
2–
1N
et
nitri
fica
tio
n(m
gN
·m·d
)–
2–
1
zation
-80
-60
-40
-20
02
04
0
r2
= 0.90
(e)
0.5 1.0 1.5 2.0 2.5 3.0
sqrt Initial NH4+
-80
-60
-40
-20
02
04
0
(e)
-80
-60
-40
-20
02
04
0
(f)
2 3 4 5 6
% C
-80
-60
-40
-20
02
04
0
(f)
% C
-80
-60
-40
-20
02
04
0
(g)
HN Mineral Soil
Fig. 4. General additive model output showing the nonlinear relationships of soil chemical, soil physical, and environmental parametersin predicting the rate of net nitrification in forest floor (a–d; r2 = 0.59) and mineral soil (e–g; r2 = 0.90) at Camp Paivika (high N de-position site). See caption of Fig. 1 for a detailed description of the figure.
were 26.7 and 36.8 mg NH4+-N·(kg litter)–1 in the forest
floor at LN and HN and 1.6 and 2.7 mg NH4+-N·(kg soil)–1
in the mineral soil at LN and HN, respectively. The additionof initial NO3
– concentrations to the model for net nitrifica-tion in HN forest floor increased the multiple r2 by 0.10.The model for net nitrification of the forest floor at HNshows a threshold NO3
– concentration (36.0 mg NO3–-N·(kg
soil)–1) above which net nitrification decreased (or the netimmobilization of NO3
– increased).General additive models of soil temperature and moisture
content combined explained only 3% to 16% (highest inmineral soil at LN) of the variability in net nitrification. Themodels (not shown here) show threshold soil temperatures(4–8 °C) and soil moisture contents (9%–15% ovendry mass)above and below which net nitrification at each site increasedor decreased, respectively, with optimal rates reached at soiltemperatures of 10 to 12 °C. However, positive values of netnitrification were also found under snowpack.
Forest floor and mineral soil pH and litter mass:unfertilized plots
The median forest floor pH values ranged from 4.09 to5.15 under the three canopy cover types at LN and from 4.09to 4.34 at HN (Table 2). Only the pH of forest floor underoak was significantly higher at LN than at HN. At LN thepH of oak forest floor (5.15) was significantly greater thanthat of pine (4.17) and open (4.09) forest floor (Table 2).The pH of mineral soil was significantly higher at LN thanat HN for all three cover types (Table 2). Median mineralsoil pH values ranged from 4.97 to 5.56 under the three can-opy cover types at LN and from 4.10 to 4.55 at HN. At LNthe pH of oak mineral soil was greater than that of open andpine mineral soils. At HN, the pH of the open mineral soilwas greater than that of pine mineral soil but not signifi-cantly different from that of the mineral soil under oak.
The average forest floor mass was significantly greater atHN than at LN for all three canopy cover types (Table 2).Median values ranged from 4.6 to 9.4 kg·m–2 at LN andfrom 11.3 to 12.2 kg·m–2 at HN. At LN forest floor masswas greater under pine than in open and oak sites, and forestfloor mass was greater under oak than in open areas. At HNforest floor mass under pine and the forest floor mass in theopen area were both significantly greater than that under oak.
Carbon and N content of forest floor and mineral soil:unfertilized plots
There were no significant differences in the percent C offorest floor or mineral soil between the two sites (Table 2).The median percent C of the forest floor at HN was signifi-cantly greater under oak and pine than in the open. Nosignificant differences existed in the percent C among thecanopy types in mineral soil at HN, nor among canopy typesin forest floor and mineral soil at LN. The median percent Nof forest floor and the median percent N of mineral soil un-der oak and pine canopy at HN were significantly greaterthan those at LN, but there were no significant differencesbetween both sites under open canopy (Table 2). At HN themedian percent N in the forest floor was greater under oakand pine than under open canopy. The median C/N ratios offorest floor and mineral soil at LN were significantly greater
than those at HN for all of the canopy types. At HN themedian C/N ratio was significantly greater under pine thanunder open canopy (Table 2).
Effects of fertilization on net N mineralization in forestfloor
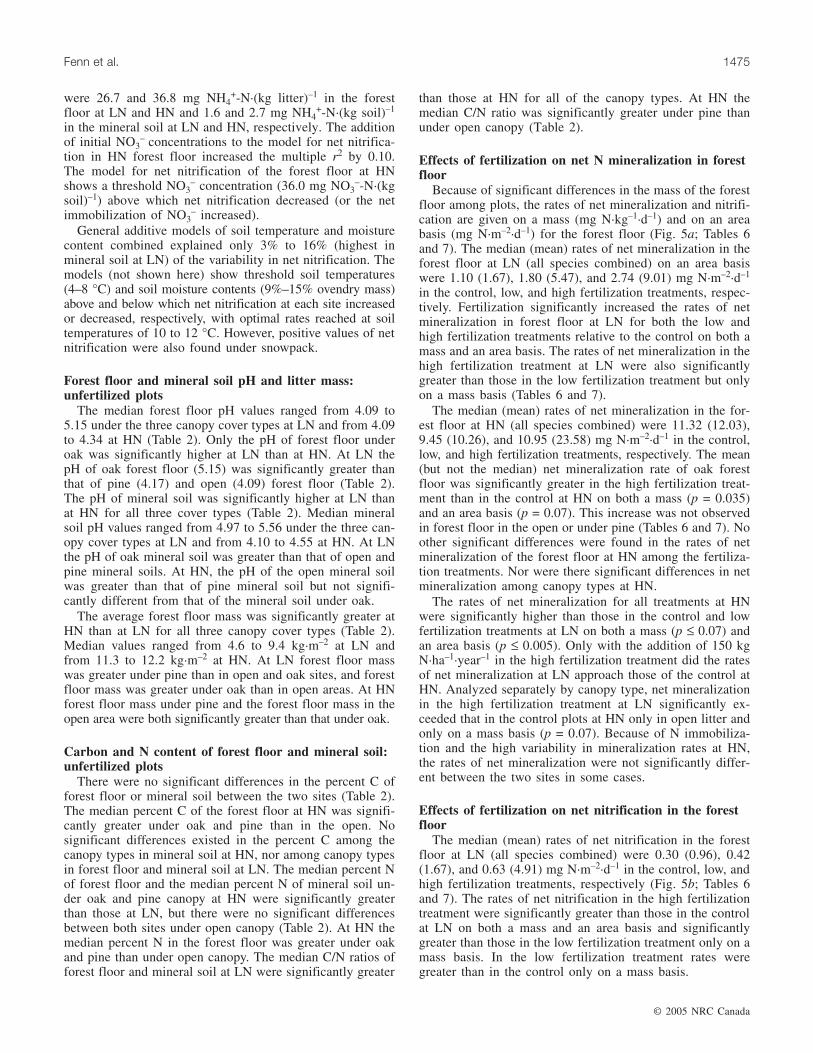
Because of significant differences in the mass of the forestfloor among plots, the rates of net mineralization and nitrifi-cation are given on a mass (mg N·kg–1·d–1) and on an areabasis (mg N·m–2·d–1) for the forest floor (Fig. 5a; Tables 6and 7). The median (mean) rates of net mineralization in theforest floor at LN (all species combined) on an area basiswere 1.10 (1.67), 1.80 (5.47), and 2.74 (9.01) mg N·m–2·d–1
in the control, low, and high fertilization treatments, respec-tively. Fertilization significantly increased the rates of netmineralization in forest floor at LN for both the low andhigh fertilization treatments relative to the control on both amass and an area basis. The rates of net mineralization in thehigh fertilization treatment at LN were also significantlygreater than those in the low fertilization treatment but onlyon a mass basis (Tables 6 and 7).
The median (mean) rates of net mineralization in the for-est floor at HN (all species combined) were 11.32 (12.03),9.45 (10.26), and 10.95 (23.58) mg N·m–2·d–1 in the control,low, and high fertilization treatments, respectively. The mean(but not the median) net mineralization rate of oak forestfloor was significantly greater in the high fertilization treat-ment than in the control at HN on both a mass (p = 0.035)and an area basis (p = 0.07). This increase was not observedin forest floor in the open or under pine (Tables 6 and 7). Noother significant differences were found in the rates of netmineralization of the forest floor at HN among the fertiliza-tion treatments. Nor were there significant differences in netmineralization among canopy types at HN.
The rates of net mineralization for all treatments at HNwere significantly higher than those in the control and lowfertilization treatments at LN on both a mass (p ≤ 0.07) andan area basis (p ≤ 0.005). Only with the addition of 150 kgN·ha–1·year–1 in the high fertilization treatment did the ratesof net mineralization at LN approach those of the control atHN. Analyzed separately by canopy type, net mineralizationin the high fertilization treatment at LN significantly ex-ceeded that in the control plots at HN only in open litter andonly on a mass basis (p = 0.07). Because of N immobiliza-tion and the high variability in mineralization rates at HN,the rates of net mineralization were not significantly differ-ent between the two sites in some cases.
Effects of fertilization on net nitrification in the forestfloor
The median (mean) rates of net nitrification in the forestfloor at LN (all species combined) were 0.30 (0.96), 0.42(1.67), and 0.63 (4.91) mg N·m–2·d–1 in the control, low, andhigh fertilization treatments, respectively (Fig. 5b; Tables 6and 7). The rates of net nitrification in the high fertilizationtreatment were significantly greater than those in the controlat LN on both a mass and an area basis and significantlygreater than those in the low fertilization treatment only on amass basis. In the low fertilization treatment rates weregreater than in the control only on a mass basis.
© 2005 NRC Canada
Fenn et al. 1475

© 2005 NRC Canada
1476 Can. J. For. Res. Vol. 35, 2005
LN HN LN HN LN HN
-50
0
50
100
0 50 150
(a)
LN HN LN HN LN HN
-40
-20
0
20
40
60
0 50 150
Forest Floor
(b)
LN HN LN HN LN HN
-20
0
20
40
60
0 50 150
(c)
LN HN LN HN LN HN
-20
0
20
40
60
0 50 150
Mineral Soil
(d)
Min
era
lS
oil
Net
Min
era
lizati
on
(mg
N·m
·d)
–2
–1
Min
era
lS
oil
Net
Min
era
lizati
on
(mg
N·m
·d)
–2
–1
Fo
rest
Flo
or
Net
Min
era
lizati
on
(mg
N·m
·d)
–2
–1
Fo
rest
Flo
or
Net
Min
era
lizati
on
(mg
N·m
·d)
–2
–1
Fig. 5. Box plots of median rates of net mineralization and net nitrification on an area basis (mg N·m–2·d–1) for forest floor (a–b) andmineral soil (c–d) for each of the fertilizer treatments (kg N·ha–1·year–1) at a high (HN) and a low (LN) N deposition site for the sam-pling period March 1997 – January 2000. Data for the three canopy types are combined. In the box plots the shaded area representsthe approximate 95% confidence interval of the median, the box represents the interquartile range (spread of 50% of the data), and thespan of the whiskers represent either 1.5 times the interquartile range or the extremes of the data, whichever is less. Horizontal linesoutside of the box and whiskers represent individual outliers whose values are greater or less than the 1.5 interquartile range.

The median (mean) rates of net nitrification in the forestfloor at HN (all species combined) were 7.71 (8.73), 6.59(11.25), and 6.34 (16.31) mg N·m–2·d–1 in the control, low,and high fertilization treatments, respectively. There were no
significant differences in the rates of net nitrification of theforest floor at HN among the fertilization treatments on amass or an area basis. Net nitrification (on a mass basisonly) was significantly greater under oak than under pine in
© 2005 NRC Canada
Fenn et al. 1477
Net mineralization (mg N·m–2·d–1) Net nitrification (mg N·m–2·d–1)
Fertilization rate(kg N·ha–1·year–1) LN
pvalue* HN
pvalue* LN
pvalue* HN
pvalue*
Oak forest floor 0 1.60 (0.70)a 0.06 4.30 (2.93)a 0.02 0.92 (0.29)a 0.07 5.49 (1.15)50 1.47 (0.90) 8.20 (2.73) 1.40 (0.43)b 6.50 (1.36)
150 3.49 (1.14)b 14.36 (3.36)b 1.40 (0.38) 9.38 (1.66)Open forest floor 0 0.60 (0.16)a 0.002 4.61 (2.09) 0.24 (0.06)a 0.02 4.88 (1.12)
50 1.55 (0.60)a 0.02 3.76 (2.59) 0.29 (0.08)a 0.03 5.41 (1.30)150 4.23 (1.12)b 8.63 (2.19) 1.80 (0.38)b 6.08 (1.19)
Pine forest floor 0 0.16 (0.62)a 0.05 7.94 (4.17) 0.18 (0.13) 1.88 (1.47)50 4.63 (1.79)b 2.34 (2.85) 0.65 (0.23) 3.86 (1.25)
150 4.88 (2.69) 10.10 (3.16) 3.61 (1.04) 7.43 (1.71)Oak mineral soil 0 1.56 (0.48)a 0.0001 3.40 (1.43)a 0.05 1.22 (0.24)a 0.01 4.11 (1.24)
50 3.33 (0.94)a 0.006 5.56 (1.61) 2.42 (0.49) 5.98 (1.42)150 8.76 (1.51)b 10.50 (2.34)b 5.03 (0.99)b 9.52 (2.01)
Open mineral soil 0 3.07 (0.71)a 0.009 6.77 (1.88) 2.30 (0.36)a 0.0001 7.81 (1.29)50 5.07 (1.80)a 0.03 7.18 (2.42) 3.27 (0.60)a 0.007 8.15 (1.63)
150 11.20 (3.47)b 10.70 (2.03) 8.03 (1.22)b 9.90 (1.70)Pine mineral soil 0 2.61 (0.57)a 0.05 7.17 (1.52)a 0.05 1.01 (0.19) 6.00 (1.26)a 0.05
50 3.57 (2.95) 14.71 (2.89)b 0.15 (2.01) 10.16 (1.55)b150 6.86 (2.42)b 8.88 (2.25)a 0.02 2.45 (0.80) 7.44 (1.55)a 0.05
Note: Standard errors of the mean are given in parentheses; n = 98–100. Values with the same lowercase letter are not significantly different based onleast significant difference comparisons for the three fertilization treatments within each site, canopy type, and soil horizon combination.
*The p values indicate the level of significance for the individual comparisons that were significantly different within each site, canopy type, and soilhorizon combination. Only significant p values are given.
Table 6. Mean rates of net N mineralization and net nitrification at a low N deposition site (LN) and high N deposition site (HN) onan area basis.
Net mineralization (mg N·kg–1·d–1) Net nitrification (mg N·kg–1·d–1)
Canopy type andsoil horizon
Fertilization rate(kg N·ha–1·year–1) LN
pvalue* HN
pvalue* LN
pvalue* HN
pvalue*
Oak forest floor 0 0.28 (0.12)a 0.06 0.62 (0.36)a 0.02 0.16 (0.05) 0.68 (0.13)50 0.22 (0.13) 0.90 (0.31) 0.23 (0.06) 0.81 (0.13)
150 0.74 (0.23)b 1.91 (0.42)b 0.30 (0.08) 1.25 (0.22)Open forest floor 0 0.17 (0.04)a 0.0001 0.60 (0.22) 0.08 (0.02)a 0.0008 0.54 (0.12)
50 0.41 (0.12)a 0.008 0.51 (0.34) 0.12 (0.02)a 0.01 0.72 (0.17)150 1.10 (0.27)b 1.08 (0.27) 0.41 (0.07)b 0.72 (0.13)
Pine forest floor 0 0.00 (0.09)a 0.06 0.84 (0.37) 0.03 (0.02) 0.30 (0.11)50 0.67 (0.25)b 0.34 (0.31) 0.09 (0.03) 0.47 (0.13)
150 0.46 (0.27) 0.94 (0.30) 0.47 (0.12) 0.67 (0.17)Oak mineral soil 0 0.02 (0.01)a 0.0001 0.05 (0.02)a 0.05 0.02 (0.00)a 0.01 0.06 (0.02)
50 0.05 (0.01)a 0.006 0.08 (0.02) 0.04 (0.01) 0.09 (0.02)150 0.13 (0.02)b 0.15 (0.03)b 0.07 (0.01)b 0.14 (0.03)
Open mineral soil 0 0.04 (0.01)a 0.009 0.10 (0.03) 0.03 (0.01)a 0.0001 0.11 (0.02)50 0.07 (0.03)a 0.03 0.10 (0.04) 0.05 (0.01)a 0.007 0.12 (0.02)
150 0.16 (0.05)b 0.16 (0.03) 0.12 (0.02)b 0.14 (0.02)Pine mineral soil 0 0.04 (0.01)a 0.05 0.10 (0.02)a 0.05 0.01 (0.00) 0.09 (0.02)a 0.05
50 0.05 (0.04) 0.21 (0.04)b 0.00 (0.03) 0.15 (0.02)b150 0.10 (0.04)b 0.13 (0.03)a 0.02 0.04 (0.01) 0.11 (0.02)a 0.05
Note: Standard errors of the mean are given in parentheses; n = 98–100. Values with the same lowercase letter are not significantly different based onleast significant difference comparisons for the three fertilization treatments within each site, canopy type, and soil horizon combination.
*The p values indicate the level of significance for the individual comparisons that were significantly different within each site, canopy type, and soilhorizon combination. Only significant p values are given.
Table 7. Mean rates of net N mineralization and net nitrification at a low N deposition site (LN) and high N deposition site (HN) on amass basis.

all treatments, and it was greater under oak than in the openonly in the high fertilization treatment. The rates of net nitri-fication at HN were consistently much greater than those atLN on both a mass (p ≤ 0.01) and an area basis (p ≤ 0.0001),even with the addition of 150 kg N·ha–1·year–1 in the highfertilization treatment at LN. However, when analyzed sepa-
rately by canopy type, net nitrification under pine in the highfertilization treatment at LN approached that of the controland low fertilization treatments at HN on both a mass and anarea basis (Tables 6 and 7). Under open canopy, net nitrifi-cation in the high fertilization treatment at LN approachedthat of the control at HN but only on a mass basis. In oak lit-
© 2005 NRC Canada
1478 Can. J. For. Res. Vol. 35, 2005
19971998
1999 19971998
1999
-40
-20
0
20
40
60
80
100
LN HN
Open Forest Floor
0
50
150
(b)
19971998
1999 19971998
1999
-40
-20
0
20
40
60
80
100
LN HN
Oak Forest Floor
(a)
19971998
1999 19971998
1999
-40
-20
0
20
40
60
80
100
LN HN
Pine Forest Floor
(c)
19971998
1999 19971998
1999
-40
-20
0
20
40
60
80
100
An
nu
al
Ne
tM
ine
rali
za
tio
n(k
gN
·ha
·ye
ar
)–
1–
1
LN HN
Oak Mineral Soil
(d)
19971998
1999 19971998
1999
-40
-20
0
20
40
60
80
100
LN HN
Open Mineral Soil
0
50
150
(e)
19971998
1999 19971998
1999
-40
-20
0
20
40
60
80
100
LN HN
Pine Mineral Soil
(f)
An
nu
al
Ne
tM
ine
rali
za
tio
n(k
gN
·ha
·ye
ar
)–
1–
1
Fig. 6. Annual rates of net mineralization for forest floor (a–c) and mineral soil (d–f) for the calendar years 1997–1999. LN, low Ndeposition site; HN, high N deposition site.

ter, however, net nitrification was significantly greater atHN than at LN for all treatment comparisons on both a massand an area basis (p ≤ 0.02).
Temporal trends of fertilization effects in the forest floorPlots of annual rates of net mineralization in the forest
floor (Figs. 6a–6c) show a steady increase over the 3-year
period in the high fertilization treatment under pine at LNfrom 6.06 to 34.59 kg N·ha–1·year–1. Open forest floor atLN, however, shows a decrease in net mineralization in thehigh fertilization treatment through the 3-year period from27.00 to 11.32 kg N·ha–1·year–1. At HN an increase in netmineralization through the 3-year period can be seen in thehigh fertilization treatment in open forest floor (from 33.06
© 2005 NRC Canada
Fenn et al. 1479
19971998
1999 19971998
1999
-40
-20
0
20
40
60
80
100
LN HN
Oak Forest Floor
(a)
19971998
1999 19971998
1999
-40
-20
0
20
40
60
80
100
LN HN
Open Forest Floor
0
50
150
(b)
19971998
1999 19971998
1999
-40
-20
0
20
40
60
80
100
LN HN
Pine Forest Floor
(c)
19971998
1999 19971998
1999
-40
-20
0
20
40
60
80
100
LN HN
Open Mineral Soil
0
50
150
(e)
19971998
1999 19971998
1999
-40
-20
0
20
40
60
80
100
An
nu
alN
et
Nit
rifi
ca
tio
n(k
gN
·ha
·ye
ar
)–
1–
1A
nn
ua
lN
et
Nit
rifi
ca
tio
n(k
gN
·ha
·ye
ar
)–
1–
1
LN HN
Oak Mineral Soil
(d)
19971998
1999 19971998
1999
-40
-20
0
20
40
60
80
100
LN HN
Pine Mineral Soil
(f)
Fig. 7. Annual rates of net nitrification for forest floor (a–c) and mineral soil (d–f) for the calendar years 1997–1999. LN, low N de-position site; HN, high N deposition site.

to 50.89 kg N·ha–1·year–1) and in the low fertilization treatmentin pine forest floor (from 4.02 to 23.58 kg N·ha–1·year–1).
Net nitrification rates in open and pine forest floor at LN(Figs. 7a–7c) show an immediate increase in response to thehigh fertilization treatment relative to the control, and thenthey level off through the 3-year period (5.69 to 10.01 and16.71 to 19.76 kg N·ha–1·year–1 in open and pine forest floorhigh fertilization treatments, respectively). No increase is ob-served in oak forest floor at LN (3.89 to 8.35 kg N·ha–1·year–1
in the high fertilization treatments). At HN the only signifi-cant fertilization effect on net nitrification in the forest flooris a spike in the high fertilization treatment in oak forestfloor (83.13 kg N·ha–1·year–1) in the final year of the study.There was also a trend of higher net nitrification in pine for-est floor at the high fertilization level at HN, but differenceswere not significant (Tables 1 and 2; Figs. 7a–7c). Othertrends in net mineralization and net nitrification were ob-scured at both sites by the large differences in annual precip-itation among the 3 years of the study.
Effects of fertilization on net N mineralization inmineral soil
As was the case for the forest floor, fertilization caused asignificant increase in the rate of net mineralization of themineral soil at LN in each of the treatments and canopytypes (Fig. 5c; Table 6). The median (mean) rates of netmineralization in the mineral soil at LN were 2.11 (3.70),4.22 (6.11), and 9.49 (13.61) mg N·m–2·d–1 in the control,low, and high fertilization treatments, respectively. Contraryto LN, there were no significant differences in the rates ofnet mineralization in the mineral soil among the fertilizationtreatments at HN (Fig. 5c). The median (mean) rates of netmineralization in the mineral soil at HN were 8.43 (8.84),9.49 (14.13), and 9.49 (15.37) mg N·m–2·d–1 in the control,low, and high fertilization treatments, respectively. However,when analyzed separately by canopy type, net mineralizationincreased in the high fertilization treatment relative to thecontrol under oak and in the low fertilization treatment rela-tive to both the control and the high fertilization treatmentunder pine (Table 6). A comparison of the two sites showsthat net mineralization in all three treatments at HN was sig-nificantly greater than net mineralization in the control andlow fertilization treatments at LN (p ≤0.003) but not greaterthan net mineralization in the high fertilization treatment.However, when analyzed separately by canopy type, net min-eralization in the low fertilization treatment at LN approachedthat at HN in the control under oak, in the low fertilizationtreatment under open canopy, and in the high fertilizationtreatment under pine.
Effects of fertilization on net nitrification in mineralsoil
Fertilization at LN also increased the rates of net nitrifica-tion in the mineral soil, but the values still remained lowrelative to HN (Fig. 5). The median (mean) rates of net nitri-fication at LN were 1.05 (2.30), 1.05 (2.98), and 2.11(7.80) mg N·m–2·d–1 in the control, low, and high fertiliza-tion treatments, respectively. When analyzed separately bycanopy type (Table 6), net nitrification under oak increasedin the high fertilization treatment relative to the control, andnet nitrification under open canopy increased in the high
fertilization treatment relative to the control and low fertil-ization treatment. Net nitrification was consistently higherunder open canopy than under oak and pine.
At HN there were no significant differences in the rates ofnet nitrification in the mineral soil among the fertilizationtreatments (Fig. 5d). The median (mean) rates of net nitrifi-cation at HN were 8.43 (9.17), 9.49 (12.38), and 9.49(13.72) mg N·m–2·d–1 in the control, low, and high fertiliza-tion treatments, respectively. Nitrification rates at HN weremuch higher than those at LN for all treatment comparisons(p ≤ 0.009; Fig. 5d). However, when analyzed separately bycanopy type (Table 6), net nitrification in the high fertiliza-tion treatment at LN approached that of the control at HNunder oak and approached that of all treatments at HN underopen canopy. Net nitrification in pine mineral soil, however,was always significantly lower at LN than at HN.
Temporal trends of fertilization effects in mineral soilPlots of the annual rates of net mineralization in mineral
soil (Figs. 6d–6f) show an increase in mineralization ofabout 16–50 kg N·ha–1·year–1 in the wetter second year ofthe high fertilization treatment in each of the three canopytypes at LN. At HN net mineralization of the mineral soil in-creased by 44–49 kg N·ha–1·year–1 in the drier third year(compared with year 1 and 2) in the high fertilization treat-ment under oak. Under pine at HN, net mineralization of themineral soil in the high fertilization treatment steadily in-creased from 17.59 to 45.80 kg N·ha–1·year–1 over the 3-yearperiod but still remained lower than that in the low fertiliza-tion treatment (65.92–84.80 kg N·ha–1·year–1; Fig. 6f).
Annual rates of net nitrification (Figs. 7d–7f) in the highfertilization treatment in mineral soil at LN peaked in thewetter second year under oak (35.35 kg N·ha–1·year–1) andunder pine (18.40 kg N·ha–1·year–1) and in the drier thirdyear under open canopy (53.26 kg N·ha–1·year–1). Net nitrifi-cation in the high fertilization treatment at LN approachedthat in the control and low fertilization treatments at HNunder oak by the second year and approached that in alltreatments at HN under open canopy by the third year. Netnitrification, however, remained lower in the high fertiliza-tion treatment in pine mineral soil at LN (7.18–18.40 kgN·ha–1·year–1) than in all treatments at HN (26.03–67.90 kgN·ha–1·year–1) except for the control at HN during the 1999drought year (6.25 kg N·ha–1·year–1). At HN net nitrificationranged from 5.11 to 83.13, 21.48 to 51.79, and 6.25 to67.90 kg N·ha–1·year–1 in oak, open, and pine mineral soil,respectively, among the three fertilization treatments overthe 3-year period (Figs. 7d–7f).
Discussion
Nitrogen cycling in forest floor and mineral soil at ahigh- and a low-deposition site
Increased nitrification is a key characteristic of N-saturatedforests (Aber et al. 1989; Fenn et al. 1998). In this study,rates of net N mineralization, net nitrification, and relativenitrification were consistently higher at HN than at LN, withthe exception of net mineralization of the forest floor underoak. The concentration of N in forest floor and mineral soilwas significantly greater at HN than at LN for oak and pinecanopy types, while the C/N ratios of forest floor and min-
© 2005 NRC Canada
1480 Can. J. For. Res. Vol. 35, 2005

eral soil were significantly lower at HN than at LN for allthree canopy types. These findings concur with streamwaterNO3
– export profiles and with a number of other hydrologic,edaphic, and botanic indicators of N enrichment (Fenn andPoth 1999, 2001; Fenn et al. 1996), demonstrating that theforest at HN is in the later stages of N saturation, while LNstrongly conserves N.
Averaged over the three canopy types and 3 years of thestudy, net nitrification fluxes in forest floor and mineral soilwere 2.4 and 8.8 kg N·ha–1·year–1 at LN and 23.0 and32.9 kg N·ha–1·year–1 at HN, respectively. At LN approxi-mately 21% of the net nitrification occurred in the forestfloor (considering the forest floor and top 10 cm of mineralsoil), compared with 41% at HN. Two primary factors areresponsible for the greater proportion of nitrification takingplace in the forest floor at HN compared with LN. Net nitri-fication rates per kilogram forest floor were 5–7 times greaterat HN among the three canopy cover types, and forest flooraccumulation was also 1.3–2.7 times greater at HN. Forestfloor accumulation at HN is accelerated by the interactive ef-fects of ozone and N deposition (Arbaugh et al. 1999; Fennet al. 2003b; Grulke and Balduman 1999) and a decrease inthe later stages of decomposition of N-rich litter (Berg2000).
Nitrate dominance of the inorganic N cycleThe NO3
– dominance of the inorganic N cycle and themuch higher relative nitrification at HN demonstrate theelevated N status of the forest at HN. These findings alsosupport the use of relative nitrification as an index of N satu-ration. It may be that chronic atmospheric N inputs at HNlead to sustained high levels of nitrification, possibly bymaintaining a viable population of nitrifying organisms(Johnson 1992). Gross nitrification rates in pine forest floorand mineral soil at HN appear to be one to two orders ofmagnitude greater than those at LN (M.E. Fenn, unpublisheddata), supporting the conclusion that active nitrification isthe key process controlling N loss at HN. Venterea et al.(2004) concluded that enhanced gross nitrification is the keyprocess leading to N-saturation symptoms, and Tietema (1998)measured high gross nitrification rates in two N-saturatedsites but not in the two N-limited forests. Nitrification isthe presumed source for most of the NO3
– leached fromN-saturated watersheds in southern California and is alsobelieved to be the source of elevated nitric oxide emissionsfrom soil (Fenn et al. 1996; Fenn and Poth 2001). However,recent stable isotope studies from the San Bernardino andSan Gabriel Mountains show that a significant proportion (ashigh as 20%–40% during peak runoff in catchments, includ-ing HN) of the NO3
– exported in streamwater is directthroughput of atmospheric NO3
– that has not been biologi-cally assimilated (Michalski et al. 2004). Such movement ofNO3
– through the forest ecosystem without biological assim-ilation may partly explain why tree growth can still be Nlimited at HN (Fenn and Poth 2001), notwithstanding thehigh N deposition inputs and outputs.
Relative nitrification and nitrification rate comparisonswith other studies
Relative nitrification was significantly higher in the min-eral soil than in the forest floor at both sites, as commonly
reported in the literature (Table 5; Lavoie and Bradley 2003),possibly because of inhibitory organic compounds in the or-ganic horizon (White 1994) and greater competition forNH4
+ substrate in the forest floor. In two literature surveys(Bonilla and Rodà 1992; Gilliam et al. 2001), average netnitrification rates were 39 and 64 kg N·ha–1·year–1 in hard-wood forests and 23 and 14 kg N·ha–1·year–1 in coniferousforests, respectively. Nitrification rates in mineral soil at HNare higher than these rates reported for coniferous forestsand near the low end reported for hardwood forests (Ta-ble 5). Nitrification rates in mineral soil at LN are below theaverage for both types of forests. Nitrogen cycling rates insoil at HN and, particularly, at LN were generally lowerthan rates in mesic forests in the eastern United States withactively nitrifying soils or at N-saturated sites (Table 5;Bowden et al. 2000; Gilliam et al. 2001). However, some co-niferous forest types in the eastern United States have re-portedly low nitrification rates in the absence of disturbance(Table 5; McNulty and Aber 1993; Ohrui et al. 1999). Insummary, relative nitrification at HN is higher than that ofother western sites and is similar to that of N-saturated sitesin eastern North America, although total net nitrification ratesare higher in the more mesic eastern N-saturated forests (Ta-ble 5).
Factors controlling nitrification ratesAlthough soil moisture and temperature were greater at
HN than at LN, these did not seem to be major factors caus-ing higher N cycling rates at HN. Mineral soil and forestfloor moisture and temperature combined only explained1%–6% of the variation in net N mineralization and 3%–16% (highest in mineral soil at LN) of the variation in nitri-fication at each site despite fourfold differences in theamount of precipitation among the 3 years of the study. Fur-thermore, at similar moisture contents and temperatures, Ncycling rates were still generally greater at HN than at LN.Even in an unusually wet year (1998), nitrification rates atLN were still significantly lower than those observed at HNduring years of similar or lower precipitation.
The results from the general additive models demonstratethe dominance of initial NH4
+ concentrations (and initialNO3
– at HN) as controlling factors in the rates of net miner-alization. Net nitrification was overwhelmingly controlled bynet mineralization and the initial NH4
+ concentrations (andinitial NO3
– in HN litter). However, the models performedbetter in predicting net immobilization (negative values of netmineralization). Competition between heterotrophs andnitrifiers for NH4
+ substrate determines the degree of netimmobilization or net nitrification. High concentrations ofNH4
+ and NO3– resulted in net immobilization. The thresh-
old NH4+ concentrations resulting in net immobilization are
3.3 and 1.6 times higher in forest floor and mineral soil, re-spectively, at HN than at LN, indicating the more N-deficientcondition of the microbial community at LN with less NH4
+
available to be nitrified. Also the models for net nitrificationshow much steeper slopes in its relationship with net miner-alization at HN than at LN, further indicating the higher rel-ative nitrification at HN.
Mineral soil pH (all canopy cover types) and oak forestfloor pH values were lower at HN than at LN. Although his-torical soil pH data from the San Bernardino Mountains are
© 2005 NRC Canada
Fenn et al. 1481

limited, mineral soils have acidified at HN (from ca. pH 5.6in 1976 to 4.1 under pine currently; Table 2; Fenn and Poth1996), presumably from high levels of atmospheric deposi-tion and acidity produced from high rates of nitrification inthe past 50+ years. The low mineral soil pH values at HN(median values ranging from 4.0 to 4.6 in the three canopytypes) do not preclude the high relative nitrification we havemeasured in these field incubations and in laboratory assays.High nitrification rates have been reported in N-saturatedacidic soils (Martikainen and Deboer 1993; Ohrui et al. 1999).Results of recent experiments using acetylene as an inhibiterof autotrophic nitrification in laboratory soil slurry assayssuggest that heterotrophic nitrification is quantitatively im-portant for NO3
– production in mineral soil at HN (Jordan etal. 2005). Previous studies in mixed-conifer forests in Cali-fornia have similarly reported that heterotrophic nitrificationis an important process for NO3
– production (Pedersen et al.1999).
Effects of canopy cover typeThe principal findings on the effects of canopy cover in
our study were (i) low relative nitrification rates in mineralsoil under pine, (ii) a lower proportion of inorganic N in theNO3
– form in forest floor under pine at both sites (data notshown), and (iii) very low relative nitrification in forest floorunder pine at HN (21.4%). Net nitrification rates in forestfloor were significantly lower under pine than under oak atboth sites, but only on a mass basis (mg N·kg–1·d–1) at HNbecause of greater litter accumulation under pine than underoak at HN. Another finding on the effect of canopy cover inmineral soil at both HN and LN was greater net N mineral-ization and nitrification in open areas than under pine or oakcanopies. No significant differences were found between theoak and pine canopy cover types in the rates of net mineral-ization in forest floor and mineral soil or net nitrification inmineral soil. Greater species differences are likely obscuredby mixed-litter effects.
Plant species or forest type can have dramatic effects onnitrification in some cases, with little or no nitrificationoccurring under some species (Blew and Parkinson 1993;Lovett and Rueth 1999). Many studies have reported lowerrelative nitrification in conifer forests compared with hard-wood forests (Table 5; Bonilla and Rodà 1992; Gilliam et al.2001). Our field studies support the possibility that com-pounds from pine trees or pine litter may be inhibitory tonitrification or that N immobilization is higher under pine.Elevated gross nitrification rates (compared with those atLN) in mineral soil and forest floor collected under pinecanopies at HN indicate that gross nitrification at HN is notstrongly inhibited, suggesting that NO3
– immobilization maybe higher under pine canopies (M.E. Fenn, unpublished data).Monoterpenes emitted from pine forests have been shown toinhibit nitrification by direct inhibition (White 1994) and in-directly by providing a carbon-rich substrate for N immobili-zation (Paavolainen et al. 1998).
The greater N cycling rates in open areas may be due tomicroclimatic effects (Knoepp and Swank 2002), greater inputof compounds in throughfall under tree canopies that are in-hibitory to nitrifiers or that supply carbon for microbial Nimmobilization (Bradley et al. 2000; Knops et al. 2002), orhigher levels of NH4
+ for nitrification in open areas because
of lower competition with plants for NH4+ substrate (Priha et
al. 1999). Throughfall or litter percolates could include sec-ondary compounds with antimicrobial activity (White 1994),or the much greater N deposition under the canopy couldhave an inhibitory effect on litter decomposers (Berg 2000;Persson et al. 2000). Mladenoff (1987) reported that net nitri-fication rates in gaps in eastern hemlock (Tsuga canadensis(L.) Carrière) stands were more than double the rate underthe canopy. Increased N mineralization and N availability incanopy gaps is common (Prescott 2002).
Nitrogen input thresholds for stimulating netnitrification
With the addition of 150 kg N·ha–1·year–1 as slow-releaseureaformaldehyde, net nitrification rates at the low N deposi-tion site LN (ambient deposition of 4–13 kg N·ha–1·year–1)approached those at the high deposition site HN (ambientdeposition of 40–80 kg N·ha–1·year–1) in just 2 to 3 years inopen and pine forest floor and open and oak mineral soil,but not in oak forest floor or pine mineral soil. The applica-tion of 150 kg N·ha–1·year–1 in the high fertilization treat-ment is not unrealistic, since deposition as high as 100–200 kg N·ha–1·year–1 is commonly measured in throughfallunderneath mature ponderosa pine trees at HN (Fenn andPoth 2004; M.E. Fenn, unpublished data). Most likely, moretime is required for net nitrification rates in the low fertiliza-tion treatment (50 kg N·ha–1·year–1) at LN to approach thelevels observed at HN, a site that has received elevated Ndeposition for over 50 years.
Our results contradict other studies using ureaformaldehydefertilizer that report no enhanced nitrification or risk for NO3
–
leaching (e.g., Martikainen 1984; Aarnio and Martikainen 1995;Aarnio et al. 1996). The cause of the differences in nitrificationresponses to ureaformaldehyde between our study and thosecited above is likely a result of considerable differences insoil, vegetation, and climatic conditions between the studysites. The cited studies are mainly from podzolized borealsandy soils that are inherently highly acidic and have lownitrification activity. In contrast, our study sites are in aMediterranean climate with more moderate temperatures,high soil base saturation, and high nitrification activity, andthe soils in our study sites were only highly acidic at HN, asa result of long-term atmospheric deposition.
Limited response to N fertilization at HNAt HN, fertilization generally had no significant effect on
NH4+ levels and led to decreased NO3
– levels in forest floorand mineral soil. The fairly constant levels of NH4
+ in forestfloor and mineral soil even with fertilization at HN are notsurprising if we assume that a large percentage of the avail-able NH4
+ is nitrified, as suggested by the high relativenitrification values at HN. High rates of microbial immobili-zation of N may also explain the lack of an increase in inor-ganic N with fertilization at HN. The lack of an increase inNH4
+ levels with fertilization at HN (and decrease in NO3–
levels) may also be due to N uptake by trees and understoryvegetation (Olsson and Falkengren-Grerup 2003; Rodenkirchen1995), which is dominated by bracken fern at HN. Brackenfern is not found at LN, but at HN bracken has been shownto accumulate high levels of NO3
– in foliage, particularly inthe spring (Fenn et al. 1996). The fertilization treatments in
© 2005 NRC Canada
1482 Can. J. For. Res. Vol. 35, 2005

this study caused significant increases in bolewood growthof pine and oak trees compared with the unfertilized controltrees at HN but not at LN (Fenn and Poth 2001), demon-strating that the slow-release ureaformaldehyde fertilizer wasbeing mineralized.
The decrease in nitrate levels in mineral soil and forestfloor with fertilization at HN could also be explained by theincrease in percent total C in the fertilized soils (M.E. Fennand M.A. Poth, unpublished data). If labile C was also higherin fertilized soils, this would stimulate the activity of hetero-trophs that could out compete nitrifiers for NH4
+ substrate,resulting in lowered net nitrification (Riha et al. 1986). Thishypothesis could explain why net nitrification and net miner-alization rates in the mineral soil under pine at HN werehigher in the low fertilization treatment than in the high fer-tilization treatment. A number of studies have also reportedlimited or no increase in net nitrification with added N treat-ments (Bengtsson and Bergwall 2000; Magill et al. 1997). Inmany cases, most of the added N retained in soil is fixed viabiotic and abiotic mechanisms (Johnson et al. 2000), resultingin small amounts of added N being nitrified and denitrified(Bengtsson and Bergwall 2000; Hart et al. 1993; Nadelhofferet al. 1995).
Mechanisms of nitrification enhancement by Nenrichment
Increased nitrification at LN in the fertilization treatmentsis presumably the result of increases in NH4
+ substrate fromthe ureaformaldehyde fertilizer. It seems unlikely that inonly 1 to 3 years the N content of litter and soil organic mat-ter would increase sufficiently to cause the increased N min-eralization seen in all the fertilizer treatments and theincreased nitrification observed in some of the fertilizationtreatments at LN. Longer-term studies are needed to seewhen and if added N would lead to increased organic matterN content and sustained increases in nitrification at LN. AtHN, the evidence strongly suggests that 50 years of elevatedN deposition has resulted in increased nitrification rates.However, it is not clear to what degree this stimulation isdue to direct effects on nitrification of the atmospheric Ncurrently deposited in throughfall compared with long-termindirect stimulation via the production of N-rich foliage, lit-ter, and soil organic matter. Throughfall N may also indi-rectly contribute to elevated nitrification rates by supplyingavailable N in the soil solution for plant uptake, thus reduc-ing the competition for N between plants and heterotrophicmicroorganisms and nitrifiers.
Presumably, the production of N-enriched litter and soilorganic matter is an important mechanism of enhancing ni-trification. Evidence for this conclusion includes the resultsof the net nitrification field assays in this study, previouslaboratory assays of net N mineralization and nitrification(Fenn et al. 1996, 2003b), and gross N mineralization andnitrification assays (M.E. Fenn, unpublished data). In all ofthese studies N mineralization and nitrification rates weremeasured in the absence of plant uptake and N deposition,indicating that the inherent properties of the soils determinedN cycling rates. In every case, nitrification rates were muchgreater in unfertilized soils and litter from HN than in unfertil-ized soils and litter from LN. Probably the strongest evidencethat the major role of N deposition in increased nitrification
is mediated through enriched organic matter production isthe widely documented inverse relationship between forestfloor and mineral soil C/N ratio and nitrification rates andNO3
– leaching (see Aber et al. (2003) and references therein).Rueth et al. (2003) conducted N fertilization studies in high-elevation old-growth Englemann spruce (Picea engelmanniiParry ex Engelm.) in the Colorado Front Range and alsoconcluded that the size of the soil organic N pool and soilC/N ratios were key factors in controlling N cycling ratesand the responsiveness of soil N pools and fluxes to fertil-ization. Tietema et al. (1998) concluded that in the long runN deposition changes the N status of an ecosystem by chang-ing characteristics such as the C/N ratio of the forest floor.Thus, a major question remains as to how long elevatedNO3
– production in soil would persist at HN without thecontinual inputs of high levels of N in throughfall.
In a survey of 33 forested sites in Europe, Dise et al.(1998) reported that for any given C/N ratio, nitrate leachingwas higher at high N deposition sites than at intermediate Ndeposition sites, suggesting that N enrichment of soil organicmatter and current N deposition levels are both importantfactors affecting nitrification and NO3
– losses. In the Euro-pean NITREX studies it was found that in forests that do notexhibit N saturation symptoms, the response to increased Nwas small and delayed, whereas in the N saturated sites, de-creases in throughfall N deposition led to large and rapid de-creases in NO3
– leaching losses (Bredemeier et al. 1998;Gundersen et al. 1998), suggesting that chronic N depositionin throughfall is also an important source of NO3
– and adriver of NO3
– production in mineral soil and the forestfloor.
At HN the largest source of NH4+ for nitrifiers was N
mineralized from the large N-rich pool of organic matter, asevidenced by the fact that N mineralization was far andaway the primary factor correlated with high nitrificationrates at HN. Based on the data in Table 2 we calculate thatthe N pool in the forest floor and top 10 cm of mineral soilcontains 3620 and 1950 kg N·ha–1 at HN and the LN,respectively. The total amount of organic N at HN is probablymuch higher in many areas where forest floor accumulationis excessive. We conclude that without continual fertilizationtreatments, nitrification rates in the fertilization treatments atLN would rapidly decrease to the level of the unfertilizedcontrol. Alternatively, for N-saturated sites such as HN, itwould be useful from a resource management standpoint toknow by how much N deposition must be reduced, and forhow long, before excess NO3
– production and NO3– leaching
(over and above “normal” NO3– losses) will return to levels
observed in watersheds with low N deposition and a rela-tively closed N cycle (except following disturbance events,such as fire). Also of interest is whether reduced N capital inN-saturated watersheds, brought about by low-to-moderateintensity forest fires, will lead to lower NO3
– losses, particu-larly as vegetative regrowth and N demand gains momen-tum.
Summary
Nitrogen cycling rates in the forest floor and top 10 cm ofthe mineral soil were compared for 3 years at a low (LN)and high (HN) N deposition site. Mean net nitrification fluxes
© 2005 NRC Canada
Fenn et al. 1483

were 11.2 kg N·ha–1·year–1 at LN and 55.9 kg N·ha–1·year–1 atHN. Relative nitrification patterns in field assays con-firmed earlier laboratory studies showing virtually com-plete net nitrification of the N mineralized in the mineralsoil of N-saturated stands (except under pine canopies), andlower relative nitrification in the forest floor. The rate of netN mineralization was the primary factor affecting net nitrifi-cation rates, explaining 29% to 88% of the variability. Netnitrate production in the forest floor was lower under pon-derosa pine or Jeffrey pine canopies than under oak canopiesat both study sites, and relative nitrification in mineral soiland forest floor was lower under pine canopies in mostcases. Median mineral soil and forest floor pH at HN rangedfrom 4.0 to 4.6, indicating that nitrifying organisms areadapted to the highly acidic conditions at HN. After 2 to3 years of fertilization (150 kg N·ha–1·year–1), net nitrifica-tion rates at a low N deposition site approached those at ahigh deposition site in open and pine forest floor and inopen and oak mineral soil, but not in oak forest floor or pinemineral soil. The results in this study suggest that after only2 to 3 years of elevated N amendments, forests in southernCalifornia begin to develop the cardinal sign of N saturation:stimulation of nitrification. This process can lead to elevatedNO3
– in streamwater and groundwater, and to increased ni-trogenous trace gas emissions. However, it is concluded thatlonger periods of N inputs are required to reach a fullyN-saturated condition of elevated NO3
– production and Nlosses sustained by a large pool of N-rich organic matter.Continuing rapid population growth and urban sprawl insouthern California is expected to increase the geographicextent over which elevated N effects are occurring. EnhancedN mobilization, meditated by the process of nitrification, is akey indicator of such effects.
Acknowledgments
We thank Dave Jones, Tony Davila, and Tony Gomez forcollecting field core samples and processing soil cores in thelaboratory. We also acknowledge the assistance of Diane Al-exander, Enrique Jimenez, and Dave Hamilton in performingchemical analyses of the soil and litter extracts, andHaiganoush Preisler for help with statistical analyses. Wethank the USDA, NRI program for funding this work (agree-ment number 96-35101-3259).
References
Aarnio, T., and Martikainen, P.J. 1995. Mineralization of C and Nand nitrification in Scots pine forest soil treated with nitrogenfertilizers containing different proportions of urea and its slow-releasing derivative, ureaformaldehyde. Soil Biol. Biochem. 27:1325–1331.
Aarnio, T., McCullough, K., and Trofymow, J.A. 1996. Fate ofurea and ureaformaldehyde nitrogen in a one-year laboratory in-cubation with Douglas-fir forest floor. Soil Biol. Biochem. 28:1407–1415.
Aber, J.D., Nadelhoffer, K.J., Steudler, P., and Melillo, J.M. 1989.Nitrogen saturation in northern forest ecosystems. Bioscience,39: 378–386.
Aber, J.D., Goodale, C.L., Ollinger, S.V., Smith, M.-L., Magill,A.H., Martin, M.E., Hallett, R.A., and Stoddard, J.L. 2003. Is
nitrogen deposition altering the nitrogen status of northeasternforests? Bioscience, 53: 375–389.
Arbaugh, M.J., Johnson, D.W., and Pulliam, W.M. 1999. Simulatedeffects of N deposition, ozone injury and climate change on aforest stand in the San Bernardino Mountains. In Oxidant airpollution impacts in the montane forests of southern California:a case study of the San Bernardino Mountains. Edited by P.R.Miller and J.R. McBride. Springer-Verlag, New York. Ecol.Stud. 134. pp. 353–372.
Bengtsson, G., and Bergwall, C. 2000. Fate of 15N labelled nitrateand ammonium in a fertilized forest soil. Soil Biol. Biochem.32: 545–557.
Berg, B. 2000. Litter decomposition and organic matter turnover innorthern forest soils. For. Ecol. Manage. 133: 13–22.
Blew, R.D., and Parkinson, D. 1993. Nitrification and denitrificationin a white spruce forest in southwest Alberta, Canada. Can. J.For. Res. 23: 1715–1719.
Bonilla, D., and Rodà, F. 1992. Soil nitrogen dynamics in a holmoak forest. Vegetatio, 99–100: 247–257.
Bowden, R.D., Rullo, G., Stevens, G.R., and Steudler, P.A. 2000.Soil fluxes of carbon dioxide, nitrous oxide, and methane at aproductive temperate deciduous forest. J. Environ. Qual. 29:268–276.
Bradley, R.L., Titus, B.D., Hogg, K., Preston, C., Prescott, C.E.,and Kimmins, J.P. 2000. Assessing the controls on soil mineral-N cycling rates in managed coastal western hemlock ecosystemsof British Columbia. J. Sustain. For. 10: 213–219.
Bredemeier, M., Blanck, K., Xu, Y.J., Tietema, A., Boxman, A.W.,Emmett, B., Moldan, F., Gundersen, P., Schleppi, P., andWright, R.F. 1998. Input–output budgets at the NITREX sites.For. Ecol. Manage. 101: 57–64.
Cleveland, W.S., and Devlin, S.J. 1988. Locally weighted regres-sion: an approach to regression analysis by local fitting. J. Am.Stat. Assoc. 83: 596–610.
Dise, N.B., Matzner, E., and Forsius, M. 1998. Evaluation of or-ganic horizon C : N ratio as an indicator of nitrate leaching inconifer forests across Europe. Environ. Pollut. 102(Suppl. 1):453–456.
Fenn, M.E., and Poth, M.A. 1996. Preliminary evidence of nitro-gen saturation in the San Bernardino Mountains in SouthernCalifornia. In Proceedings of the IUFRO Air Pollution and Mul-tiple Stresses 16th International Meeting for Specialists in AirPollution Effects on Forest Ecosystems, 7–9 September 1994,Fredericton, N.B. Compiled by R. Cox, K. Percy, K. Jensen, andC. Simpson. Natural Resources Canada, Canadian Forest Ser-vice, Atlantic Forestry Centre, Fredericton, N.B. pp. 97–102.
Fenn, M.E., and Poth, M.A. 1999. Temporal and spatial trends instreamwater nitrate concentrations in the San Bernardino Moun-tains, southern California. J. Environ. Qual. 28: 822–836.
Fenn, M.E., and Poth, M.A. 2001. A case study of nitrogen saturationin western U.S. forests. In Optimizing Nitrogen Management inFood and Energy Production and Environmental Protection: Pro-ceedings of the 2nd International Nitrogen Conference, 14–18October 2001, Potomac, Md. Edited by J. Galloway, E. Cowling,J.W. Erisman, J. Wisniewski, and C. Jordan. A.A. Balkema Pub-lishers, Lisse, Netherlands, and TheScientificWorld [serial online],1(Suppl. s2): 433–439. Available from www.thescientificworld.com/.doi 10.1100/tsw.2001.280.
Fenn, M.E., and Poth, M.A. 2004. Monitoring nitrogen depositionin throughfall using ion exchange resin columns: A field test inthe San Bernardino Mountains. J. Environ. Qual. 33: 2007–2014.
Fenn, M.E., Poth, M.A., and Johnson, D.W. 1996. Evidence for ni-trogen saturation in the San Bernardino Mountains in southernCalifornia. For. Ecol. Manage. 82: 211–230.
© 2005 NRC Canada
1484 Can. J. For. Res. Vol. 35, 2005

Fenn, M.E., Poth, M.A., Aber, J.D., Baron, J.S., Bormann, B.T.,Johnson, D.W., Lemly, A.D., McNulty, S.G., Ryan, D.F., andStottlemyer, R. 1998. Nitrogen excess in North American eco-systems: predisposing factors, ecosystem responses, and man-agement strategies. Ecol. Appl. 8: 706–733.
Fenn, M.E., Poth, M.A., Schilling, S.L., and Grainger, D.B. 2000.Throughfall and fog deposition of nitrogen and sulfur at an N-limited and N-saturated site in the San Bernardino Mountains,southern California. Can. J. For. Res. 30: 1476–1488.
Fenn, M.E., Baron, J.S., Allen, E.B., Rueth, H.M., Nydick, K.R.,Geiser, L., Bowman, W.D., Sickman, J.O., Meixner, T., Johnson,D.W., and Neitlich, P. 2003a. Ecological effects of nitrogen de-position in the western United States. Bioscience, 53: 404–420.
Fenn, M.E., Poth, M.A., Bytnerowicz, A., Sickman, J.O., andTakemoto, B.K. 2003b. Effects of ozone, nitrogen deposition,and other stressors on montane ecosystems in the Sierra Nevada.In Developments in environmental science. Vol. 2. Ozone airpollution in the Sierra Nevada: distribution and effects on for-ests. Edited by A. Bytnerowicz, M.J. Arbaugh, and R. Alonso.Elsevier, Amsterdam. pp. 111–155.
Galloway, J.N., Aber, J.D., Erisman, J.W., Seitzinger, S.P.,Howarth, R.W., Cowling, E.B., and Cosby, B.J. 2003. The nitro-gen cascade. BioScience, 53: 341–356.
Gilliam, F.S., Yurish, B.M., and Adams, M.B. 2001. Temporal andspatial variation of nitrogen transformations in nitrogen-saturated soils of a central Appalachian hardwood forest. Can. J.For. Res. 31: 1768–1785.
Gosz, J.R., and White, C.S. 1986. Seasonal and annual variation innitrogen mineralization and nitrification along an elevationalgradient in New Mexico. Biogeochemistry, 2: 281–297.
Grulke, N.E., and Balduman, L. 1999. Deciduous conifers: high Ndeposition and O3 exposure effects on growth and biomass allo-cation in ponderosa pine. Water Air Soil Pollut. 116: 235–248.
Gundersen, P., Emmett, B.A., Kjønaas, O.J., Koopmans, C.J., andTietema, A. 1998. Impact of nitrogen deposition on nitrogen cy-cling in forests: a synthesis of NITREX data. For. Ecol. Manage.101: 37–55.
Hart, S.C., and Perry, D.A. 1999. Transferring soils from high- tolow-elevation forests increases nitrogen cycling rates: climatechange implications. Global Change Biol. 5: 23–32.
Hart, S.C., Firestone, M.K., Paul, E.A., and Smith, J.L. 1993. Flowand fate of soil nitrogen in an annual grassland and a youngmixed-conifer forest. Soil Biol. Biochem. 25: 431–442.
Hastie, T.J., and Tibshirani, R.J. 1990. Generalized additive mod-els. Chapman & Hall/CRC, Boca Raton, Fla.
Johnson, D.W. 1992. Nitrogen retention in forest soils. J. Environ.Qual. 21: 1–12.
Johnson, D.W., Cheng, W., and Burke, I.C. 2000. Biotic andabiotic nitrogen retention in a variety of forest soils. Soil Sci.Soc. Am. J. 64: 1503–1514.
Jordan, F.L., Cantera, J.J.L., Fenn, M.E., and Stein, L.Y. 2005.Autotrophic ammonia-oxidizing bacteria contribute minimallyto nitrification in a nitrogen-impacted forested ecosystem. Appl.Environ. Microbiol. 71: 197–206.
Kaye, J.P., and Hart, S.C. 1998. Ecological restoration alters nitro-gen transformations in a ponderosa pine bunchgrass ecosystem.Ecol. Appl. 8: 1052–1060.
Knoepp, J.D., and Swank, W.T. 2002. Using soil temperature andmoisture to predict forest soil nitrogen mineralization. Biol.Fertil. Soils, 36: 177–182.
Knops, J.M.H., Bradley, K.L., and Wedin, D.A. 2002. Mechanismsof plant species impacts on ecosystem nitrogen cycling. Ecol.Lett. 5: 454–466.
Lavoie, M., and Bradley, R.L. 2003. Short-term increases in rela-tive nitrification rates due to trenching in forest floor and min-eral soil horizons of different forest types. Plant Soil, 252: 367–384.
Lovett, G.M., and Rueth, H. 1999. Soil nitrogen transformations inbeech and maple stands along a nitrogen deposition gradient.Ecol. Appl. 9: 1330–1344.
Magill, A.H., Aber, J.D., Hendricks, J.J., Bowden, R.D., Melillo,J.M., and Steudler, P.A. 1997. Biogeochemical response of for-est ecosystems to simulated chronic nitrogen deposition. Ecol.Appl. 7: 402–415.
Martikainen, P.J. 1984. Nitrification in two coniferous forest soilsafter different fertilization treatments. Soil Biol. Biochem. 16:577–582.
Martikainen, P.J., and Deboer, W. 1993. Nitrous oxide productionand nitrification in acidic soil from a Dutch coniferous forest.Soil Biol. Biochem. 25: 343–347.
McNulty, S.G., and Aber, J.D. 1993. Effects of chronic nitrogenadditions on nitrogen cycling in a high-elevation spruce–firstand. Can. J. For. Res. 23: 1252–1263.
Michalski, G., Meixner, T., Fenn, M., Hernandez, L., Sirulnik, A.,Allen, E., and Thiemens, M. 2004. Tracing atmospheric nitratedeposition in a complex semiarid ecosystem using 17O. Environ.Sci. Technol. 38: 2175–2181.
Miller, P.R., and McBride, J.R. (Editors). 1999. Oxidant air pollu-tion impacts in the montane forests of southern California: acase study of the San Bernardino Mountains. Springer-Verlag,New York. Ecol. Stud. 134.
Mladenoff, D.J. 1987. Dynamics of nitrogen mineralization and ni-trification in hemlock and hardwood treefall gaps. Ecology, 68:1171–1180.
Nadelhoffer, K.J., Downs, M.R., Fry, B., Aber, J.D., Magill, A.H.,and Melillo, J.M. 1995. The fate of 15N-labelled nitrate addi-tions to a northern hardwood forest in eastern Maine, USA.Oecologia, 103: 292–301.
Ohrui, K., Mitchell, M.J., and Bischoff, J.M. 1999. Effect of land-scape position on N mineralization and nitrification in a forestedwatershed in the Adirondack Mountains of New York. Can. J.For. Res. 29: 497–508.
Olsson, M.O., and Falkengren-Grerup, U. 2003. Partitioning of ni-trate uptake between trees and understory in oak forests. For.Ecol. Manage. 179: 311–320.
Paavolainen, L., Kitunen, V., and Smolander, A. 1998. Inhibitionof nitrification in forest soil by monoterpenes. Plant Soil, 205:147–154.
Pedersen, H., Dunkin, K.A., and Firestone, M.K. 1999. The rela-tive importance of autotrophic and heterotrophic nitrification ina conifer forest soil as measured by 15N tracer and pool dilutiontechniques. Biogeochemistry, 44: 135–150.
Persson, T., Karlsson, P.S., Seyferth, U., Sjoberg, R.M., andRudebeck, A. 2000. Carbon mineralisation in European forestsoils. In Carbon and nitrogen cycling in European forest ecosys-tems. Edited by E.-D. Schulze. Springer-Verlag, Berlin. Ecol.Stud. 142. pp. 257–275.
Powers, R.F. 1990. Nitrogen mineralization along an altitudinalgradient: interactions of soil temperature, moisture, and sub-strate quality. For. Ecol. Manage. 30: 19–29.
Prescott, C.E. 1997. Effects of clearcutting and alternativesilvicultural systems on rates of decomposition and nitrogenmineralization in a coastal montane coniferous forest. For. Ecol.Manage. 95: 253–260.
Prescott, C.E. 2002. The influence of the forest canopy on nutrientcycling. Tree Physiol. 22: 1193–1200.
© 2005 NRC Canada
Fenn et al. 1485

Priha, O., Grayston, S.J., Pennanen, T., and Smolander, A. 1999.Microbial activities related to C and N cycling and microbialcommunity structure in the rhizospheres of Pinus sylvestris,Picea abies and Betula pendula seedlings in an organic andmineral soil. FEMS Microbiol. Ecol. 30: 187–199.
Raison, R.J., Connell, M.J., and Khanna, P.K. 1987. Methodologyfor studying fluxes of soil mineral-N in situ. Soil Biol. Biochem.19: 521–530.
Riha, S.J., Campbell, G.S., and Wolfe, J. 1986. A model for com-petition for ammonium among heterotrophs, nitrifiers, and roots.Soil Sci. Soc. Am. J. 50: 1463–1466.
Robertson, G.P. 1982 Nitrification in forested ecosystems. Philos.Trans. R. Soc. Lond. B Biol. Sci. 296: 445–457.
Rodenkirchen, H. 1995. Nutrient pools and fluxes of the groundvegetation in coniferous forests due to fertilizing, liming andamelioration. Plant Soil, 169: 383–390.
Rueth, H.M., Baron, J.S., and Allstott, E.J. 2003. Responses ofEngelmann spruce forests to nitrogen fertilization in the Colo-rado Rocky Mountains. Ecol. Appl. 13: 664–673.
Smil, V. 2001. Enriching the Earth: Fritz Haber, Carl Bosch, andthe transformation of World food production. The MIT Press,Cambridge, Mass.
Tietema, A. 1998. Microbial carbon and nitrogen dynamics in co-niferous forest floor material collected along a European nitro-gen deposition gradient. For. Ecol. Manage. 101: 29–36.
Venables, W.N., and Ripley, B.D. 2002. Modern applied statisticswith S. 4th ed. Springer-Verlag, New York.
Venterea, R.T., Groffman, P.M., Verchot, L.V., Magill, A.H., andAber, J. 2004. Gross nitrogen process rates in temperate forestsoils exhibiting symptoms of nitrogen saturation. For. Ecol.Manage. 196: 129–142.
White, C.S. 1994. Monoterpenes: their effects on ecosystem nutri-ent cycling. J. Chem. Ecol. 20: 1381–1406.
Williard, K.W.J., DeWalle, D.R., Edwards, P.J., and Schnabel, R.R.1997. Indicators of nitrate export from forested watersheds ofthe mid-Appalachians, United States of America. GlobalBiogeochem. Cycles, 11: 649–656.
© 2005 NRC Canada
1486 Can. J. For. Res. Vol. 35, 2005