nidec corporation july 23, 2014
TRANSCRIPT
1
(TSE: 6594 NYSE: NJ)http://www.nidec.com/
First Quarter Fiscal 2014 ResultsThree Months Ended June 30, 2014 < U.S. GAAP >
July 23, 2014Nidec Corporation
These presentation materials and the related discussions contain forward-looking statements including expectations, estimates, projections, plans, and strategies. Such forward-looking statements are based on management’s targets, assumptions and
Note Regarding Forward-looking Statements
g g g pbeliefs in light of the information currently available. Certain risks, uncertainties and other factors could cause actual results to differ materially from those discussed in the forward-looking statements. Such risks and uncertainties include, but are not limited to, changes in customer circumstances and demand, exchange rate fluctuations, and the Nidec Group’s ability to design, develop, mass produce and win acceptance of its products and to acquire and successfully integrate companies with complementary technologies and product lines. Please see other disclosure documents filed or published by the Nidec Group companies, including the latest Form 20-F and J iti t f dditi l i f ti di h i k d
2
Japanese securities report, for additional information regarding such risks and uncertainties. Nidec undertakes no obligation to update the forward-looking statements unless required by law.
The photograph on the first slide features the showroom of Nidec Research and Development Center, Japan that newly opened and started its operation in January 2014 in Kawasaki, Kanagawa, Japan to conduct basic technological research of motors.

2
Millions of Yen, except for percentages, EPS and
FX Rates1Q FY2013 1Q FY2014 Change
FY2014Forecast
Net Sales 211,276 240,188 +13.7% 960,000
Consolidated Profit/Loss
Operating Income(Operating Income Ratio)
18,047(8.5%)
25,552(10.6%)
+41.6%105,000(10.9%)
Income Before Tax 17,366 24,971 +43.8% 103,000
Net Income 13,346 17,917 +34.2% 69,000
EPS (Yen) * 49.73 64.96 +30.6% 250.18
3
( )
FX Rates (Yen/US$)Average:
Term end:98.7698.59
102.16101.36
+3.4%+2.8%
100.00(Assumed)
*The Company implemented a two-for-one stock split of our common stock effective April 1, 2014. The previously reported EPS amounts have been retroactively adjusted to reflect the stock split.
■ Record-high quarterly sales achieved.
■ Operating income increased 42% Y/Y, marking five consecutive f i i i Q/Q i
Summary of 1Q FY2014
quarters of increased operating income Q/Q since the structural reform in FY2012. A V-shaped recovery continued.
■ Record-high operating income for five quarters in a row from Automotive, Appliance, Commercial and Industrial Products, the key growth businesses under the new mid-term strategic targets, reaching 9 billion yen
4
reaching 9 billion yen.
■ Upward revision to FY2014 financial forecasts. Dividend projections raised.

3
Upward Revision to FY2014 Guidance <Initial Guidance (April 22, 2014)> <Revised Guidance>
Millions of Yen, except for percentages, EPS, dividends
and FX rates1H/FY2014 Full-Year
Net Sales 450,000 950,000
1H/FY2014 Full-Year
460,000 960,000
Operating Income 45,000 100,000
Operating Income Ratio 10.0% 10.5%
Income before Tax 44,000 98,000
Net Income 29,500 65,000
EPS (Yen) 106.96 235.67
50,000 105,000
10.9% 10.9%
49,000 103,000
33,500 69,000
121.46 250.18
5
FY2014 Foreign exchange sensitivity: *Every one-yen appreciation or deppreciation in the currency exchange rate against the U.S. Dollar and Euro is estimated to have an impact of 6.7 billion Yen and 0.76 billion Yen on net sales, respectively, and 0.88 billion Yen and 0.22 billion Yen on operating income, respectively, on a yearly basis. The revised 1H and full-year guidance has been prepared by applying the actual currency exchange rates to the 1Q FY2014 results and the assumed currency exchange rates to the remaining periods of FY2014.
Dividends (Yen) 27.5 55.0FX Rate (Yen/US$)* 100 100
FX Rate (Yen/€)* 135 135
30.0 60.0100 100135 135
250
300
25
30
Sales (LHS) Operating Income (RHS)
Consolidated Quarterly Sales and Operating Income
V-shaped recovery achieved
(All figures in Billions of Yen)
100
150
200
10
15
20
Sales
Operating Incom
eThaiFloods
JapanEarthquake
6-50
0
50
1Q 2Q 3Q 4Q 1Q 2Q 3Q 4Q 1Q 2Q 3Q 4Q 1Q 2Q 3Q 4Q 1Q 2Q 3Q 4Q 1Q 2Q 3Q 4Q 1Q
-5
0
5
Lehman Crisis
Structural Reform-25.4
FY2009 FY2010 FY2011 FY2012FY2008 FY2013
4
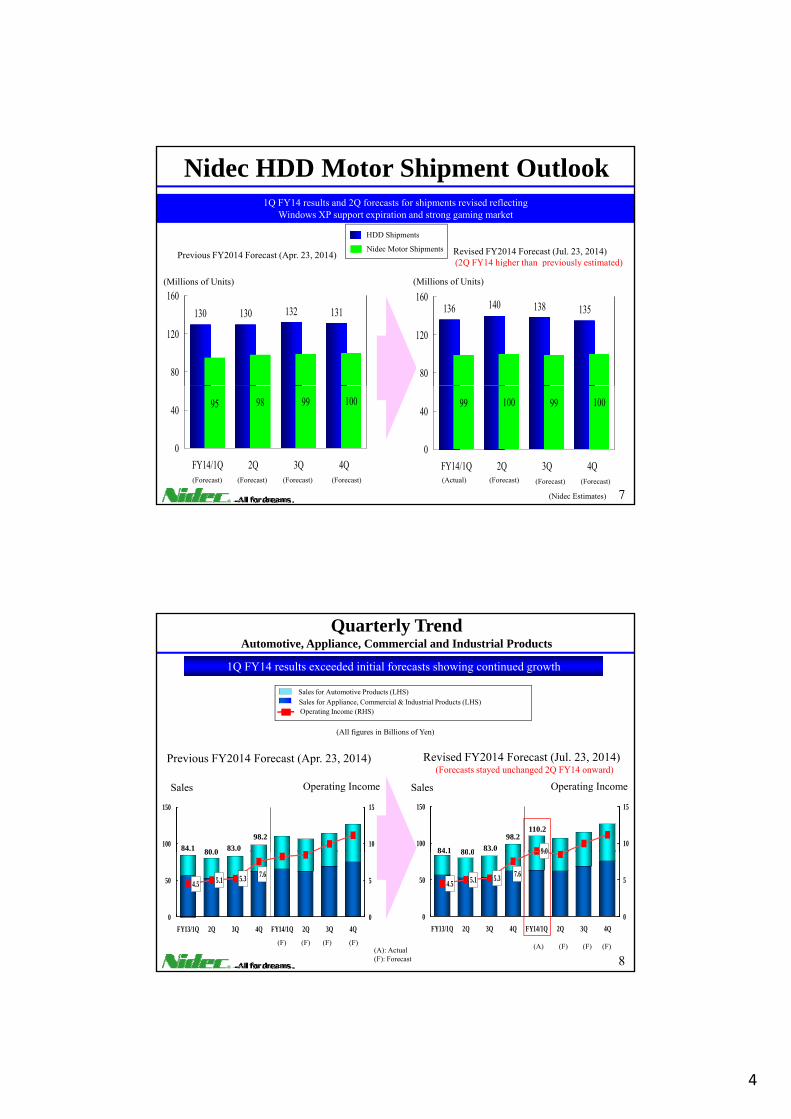
Nidec HDD Motor Shipment Outlook
Revised FY2014 Forecast (Jul. 23, 2014)(2Q FY14 higher than previously estimated)
HDD Shipments
Nidec Motor ShipmentsPrevious FY2014 Forecast (Apr. 23, 2014)
1Q FY14 results and 2Q forecasts for shipments revised reflecting Windows XP support expiration and strong gaming market
130 130 132 131
80
120
160
( Q g p y )
136 140 138 135
80
120
160(Millions of Units) (Millions of Units)
7
95 98 99 100
0
40
FY14/1Q 2Q 3Q 4Q
99 100 99 100
0
40
FY14/1Q 2Q 3Q 4Q
(Nidec Estimates)
(Actual) (Forecast) (Forecast) (Forecast)(Forecast)(Forecast)(Forecast) (Forecast)
Quarterly TrendAutomotive, Appliance, Commercial and Industrial Products
1Q FY14 results exceeded initial forecasts showing continued growth
Sales for Appliance, Commercial & Industrial Products (LHS)Operating Income (RHS)
Sales for Automotive Products (LHS)
(All figures in Billions of Yen)
9 0100
150
10
15
100
150
10
15
Revised FY2014 Forecast (Jul. 23, 2014)(Forecasts stayed unchanged 2Q FY14 onward)
Previous FY2014 Forecast (Apr. 23, 2014)
Sales Operating Income Sales Operating Income
(All figures in Billions of Yen)
84.1 80 0 83.098.2
84.1 80 0 83.098.2
110.2
8
4.5
9.0
7.65.35.1
0
50
FY13/1Q 2Q 3Q 4Q FY14/1Q 2Q 3Q 4Q0
54.57.65.35.1
0
50
FY13/1Q 2Q 3Q 4Q FY14/1Q 2Q 3Q 4Q0
5
80.0 84.1 80.0
(F)(F)(F)(A)(F)(F)(F)(F)(A): Actual(F): Forecast

5
1.5 1513.9%15%
13.7%
Mid-Term Strategic Goal- Laying the foundation for Sustainable Growth for the Next 100 Years -Aiming to achieve profitable growth by striking balance between expansion and financial soundness
(Sales in Trillions of Yen) (Operating Income Ratio, %)
1 10
Sales682.3B
Sales1.2T
Organic
M&A
Sales709.3B
9.7% *
Sales676.0BSales
571.6B
10.7%
9
0
0.5
FY2009 FY2010 FY2011 FY2012 FY2013 FY2014 FY20150
5
2.5%
(Forecast) (Target)
Sales875.1B
* Sales targets of Nidec Sankyo CMI and Nidec Elesys
Accelerating Business Portfolio Transformation and Expansion
FY2011Sales: 682.3 B Yen
FY2013Sales: 875.1 B Yen
FY2015Sales: 1.2 Trillion Yen (Target)
Our confidence to transform and expand our business
portfolio became stronger in FY2013
Single Pillar Four Pillars
331.4
84.3124.2
142.4
362.5
115.2
230
167.4
400
300 300
200Key Growth Areas
Key Growth Areas
Key GrowthAreas
FY2013(Sales in Billions of Yen) (Sales in Billions of Yen)
(Sales in Billions of Yen)
10
Small Precision M
otor
Autom
otive
Appliance, C
omm
ercialand Industrial
Other Products G
roup
Small Precision M
otor
Autom
otive
Appliance, C
omm
ercialand Industrial
Other Products G
roup
Small Precision M
otor
Autom
otive
Appliance, C
omm
ercialand Industrial
Other Products G
roup

6
Target Business Portfolio Transformation for FY2015
Increased contribution of Automotive, Appliance, Commercial & Industrial Products, resulting in improvements in portfolio composition compared to the desired portfolio balance
Current Target
8%
1%
HDD Motor(19%)
Other
7%
9%
37%Appliance
Commercial
1Q FY2014240.2 B in Sales
Small Precision Small Precision MotorsMotors
Small Precision Small Precision MotorsMotors
Others
Machinery
Electronic and Optical
Components
Machinery
FY20151.2 T in Sales
Other SmallMotors
OthersElectronic and
Optical Components
Small Precision Small Precision MotorsMotors
Small Precision Small Precision MotorsMotors
33%
8%
8% HDD Motors(15%)
1%
ApplianceImproved
11
SmallMotors(18%) Auto
(20%)46%
and Industrial(26%)
Commercial
Auto, Appliance, Auto, Appliance, Commercial and IndustrialCommercial and Industrial
Auto, Appliance, Auto, Appliance, Commercial and IndustrialCommercial and Industrial
(Current) (Target)Motors(18%)
Auto(25%)
50%
Auto, Appliance, Auto, Appliance, Commercial and IndustrialCommercial and Industrial
Auto, Appliance, Auto, Appliance, Commercial and IndustrialCommercial and Industrial
Appliance
and Industrial(25%)
Commercialbreakdown vs. Target
Sales and Profitability Targets by Product Category
25400 10300 % %
Small Precision MotorsSmall Precision Motors AutomotiveAutomotive
M&A
(Operating Income Ratio)(Sales in Billions of Yen) (Operating Income
Ratio)(Sales in Billions of Yen)
331.4 319.7 362.5 400.0 00
200
FY2011 FY2012 FY2013 FY2014 FY2015
84.3 86.7 115.2 300.0
-5
0
5
-150
0
150
FY2011 FY2012 FY2013 FY2014 FY2015
15300 15200
(Target)
(Target)
Appliance, Commercial & IndustrialAppliance, Commercial & Industrial Other Product GroupsOther Product Groups
StructuralReform
StructuralReform
(Operating Income Ratio)(Sales in Billions of Yen)
(Operating Income Ratio)(Sales in Billions of Yen)
(Forecast)
(Forecast)
12
124.2 161.8 230.0 300.0 0
15
0
150
300
FY2011 FY2012 FY2013 FY2014 FY2015
142.4 141.1 167.4 200.0 0
15
0
100
200
FY2011 FY2012 FY2013 FY2014 FY2015(Target)(Target)
%%
StructuralReform
StructuralReform
(Forecast) (Forecast)
7
300 30
33.0 Billion Yen
Automotive Products Mid-Term Business Plan
(Sales in Billions of Yen)
(Operating Income in Billions of Yen)
Target for FY2015Sales: 300 Billion Yen
(Including M&A 80 Billion Yen)Operating Income Ratio: 11%
100
200
300
10
20
30M&A (LHS)Nidec Elesys (LHS)Nidec Sankyo CMI (LHS)Nidec Tosok (LHS)Nidec, NMA and NAMA (LHS)Operating Income (RHS)
69.584.3 86.7
115.2
Forecast(28 B)
*
13-100
0FY2010 FY2011 FY2012 FY2013 FY2014 FY2015
-10
0
(Forecast) (Target)
* NMA: Nidec Motors & Actuators*NAMA: Nidec Automotive Motor Americas
Aiming to become a Global Mega Supplier in the Automotive Industry
Nidec Group’s Automotive Motors, etc. Nidec Elesys’s Electronic Technology
Pioneering electronics technology for future cars
Vehicle stability assist (VSA) unit
+Electric power steering motor
ABS motor
Engine cooling fan
motor
Dual clutch transmission
motor
Control valve for CVT
Sunroof motor
Seat adjustment
motorAutomotive
cameraElectric oil pump
Synergies
Antilock brake system unit
(VSA) unit
Electric power steering unit
Adaptive cruise control/collision mitigation brake system
Millimetric wave radar unit Lane keep
assist system
Occupant detection system
14
SafetyVehicle stability
Collision avoidance
Damage mitigation
Autonomous driving
Comfort EnvironmentFuel efficiency improvement
CO2 emission reduction
Maneuverability improvement
Information & communications technology

8
300 45
Nidec (LHS)Nidec Avtron Automation (LHS)Nidec Kinetek (LHS)Nidec ASI (LHS)Nid S l M (LHS)
Appliance, Commercial and Industrial Products Mid-Term Business Plan
FY15 TargetsSales: 300 billion Yen
Operating Income Ratio: 13%(Sales in Billions of Yen)
(Operating Income in Billions of Yen)
200 30
Nidec Sole Motor (LHS)Nidec Motor Corp. (LHS)Nidec Techno Motor (LHS)Operating Income (RHS)
124.2
161.8
230.0
39
Forecast (35 B)
15
0
100
FY2010 FY2011 FY2012 FY2013 FY2014 FY20150
1593.9
(Forecast) (Target)
Maximize Synergies in Appliance, Commercial & Industrial Motor Businesses
Synergies to be accelerated
Seeking to align businesses along markets, customers & product lines to enhance Seeking to align businesses along markets, customers & product lines to enhance growth opportunities and cost synergiesgrowth opportunities and cost synergies
ACIM (Overseas)Legacy approach:
ACIM (Overseas)ACIM (Overseas)New structure:New structure:
Nidec Motor
Nidec Sole Motor
Nidec Kinetek
・Appliance (Motor/Control)・Commercial (Air-conditioner/pump/general)・Industrial (Industrial pump /NEMA Premium efficiency products /SR drive)
・Motor for EU appliance・Universal motor
・Motor for elevator/Control device・Motor for battery operated vehicle・Geared motor
Immediately after M&A as post-merger integration proceeds
Commercial Commercial & Residential Solutions& Residential Solutions
Focus on China and other emerging
markets
Promote “3 New” project in North America in addition to existing
businesses
Legacy approach: Company-based
Global ApplianceGlobal ApplianceMotorsMotors
New structure: New structure: MarketMarket--basedbased
16
Nidec Avtron
Nidec ASI
Geared motor
・Encoder・Drive/System・Service
・Industrial Motor/Generator・Drive/System・Automation, Service
Aim to become a solution provider
Combine global product platform management with
strong local/regional leadership
Elevator Solutions Elevator Solutions & Drive Systems& Drive Systems
Industrial SolutionsIndustrial Solutions

9
400 100
Other Small Motors (LHS)
HDD Motors (LHS)
Operating Income (RHS) 362 5
(Sales in Billions of Yen)
(Operating Income in Billions of Yen)
Targets for FY2015Sales: 400 Billion Yen
Operating Income Ratio: 22%
Small Precision Motors Mid-Term Business Plan
200
300
40
60
80
p g ( )
88348.4331.4
319.7
362.5
Forecast(84 B)
17
0
100
FY2010 FY2011 FY2012 FY2013 FY2014 FY20150
20
(Forecast) (Target)
Sales Trend of Other Small Motors
<Sales* trend of Other Small Motors *Nidec-alone sales>
Aiming to improve product portfolio to reduce dependence on existing products such as ODD motors
(Sales in Billions of Yen) Seeking to expand new product portfolio25 product portfolio after 2H FY14
New businessExisting business
ODD motors
Existing businessNew business
10
15
20
Existing business
New business
18
OA equipment
motors
Fan motors
General motors
Existing businessExisting business
(F)(F)(F)(A)
0
5
1Q 2Q 3Q 4Q 1Q 2Q 3Q 4Q 1Q 2Q 3Q 4Q
FY12 FY13 FY14
Existing business
(A): Actual(F): Forecast
10
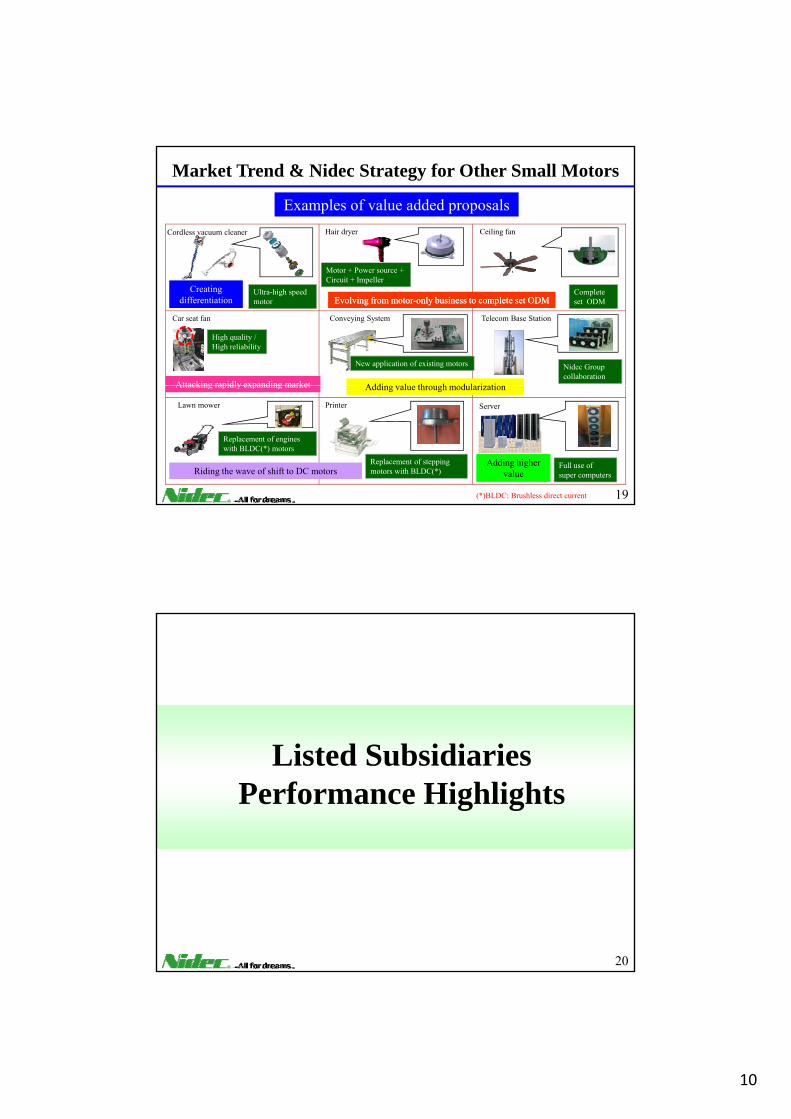
Examples of value added proposalsHair dryer Ceiling fanCordless vacuum cleaner
Market Trend & Nidec Strategy for Other Small Motors
Conveying System Telecom Base StationCar seat fan
Evolving from motorEvolving from motor--only business to complete set ODMonly business to complete set ODMEvolving from motorEvolving from motor--only business to complete set ODMonly business to complete set ODMCreating
differentiationCreating
differentiation
Attacking rapidly expanding marketAttacking rapidly expanding market Addi l th h d l i tiAddi l th h d l i ti
Ultra-high speed motor
Motor + Power source + Circuit + Impeller
Complete set ODM
High quality /High reliability
New application of existing motors Nidec Group collaboration
19
Printer ServerLawn mower
Attacking rapidly expanding marketAttacking rapidly expanding market Adding value through modularizationAdding value through modularization
Adding higher value
Adding higher valueRiding the wave of shift to DC motorsRiding the wave of shift to DC motors
Replacement of engines with BLDC(*) motors
Replacement of stepping motors with BLDC(*)
(*)BLDC: Brushless direct current
Full use ofsuper computers
Listed SubsidiariesPerformance Highlights
20
11
Millions of Yenexcept for
percentages & EPS
1H Forecast(A)
1Q Results(B)
Progress(B)/(A)
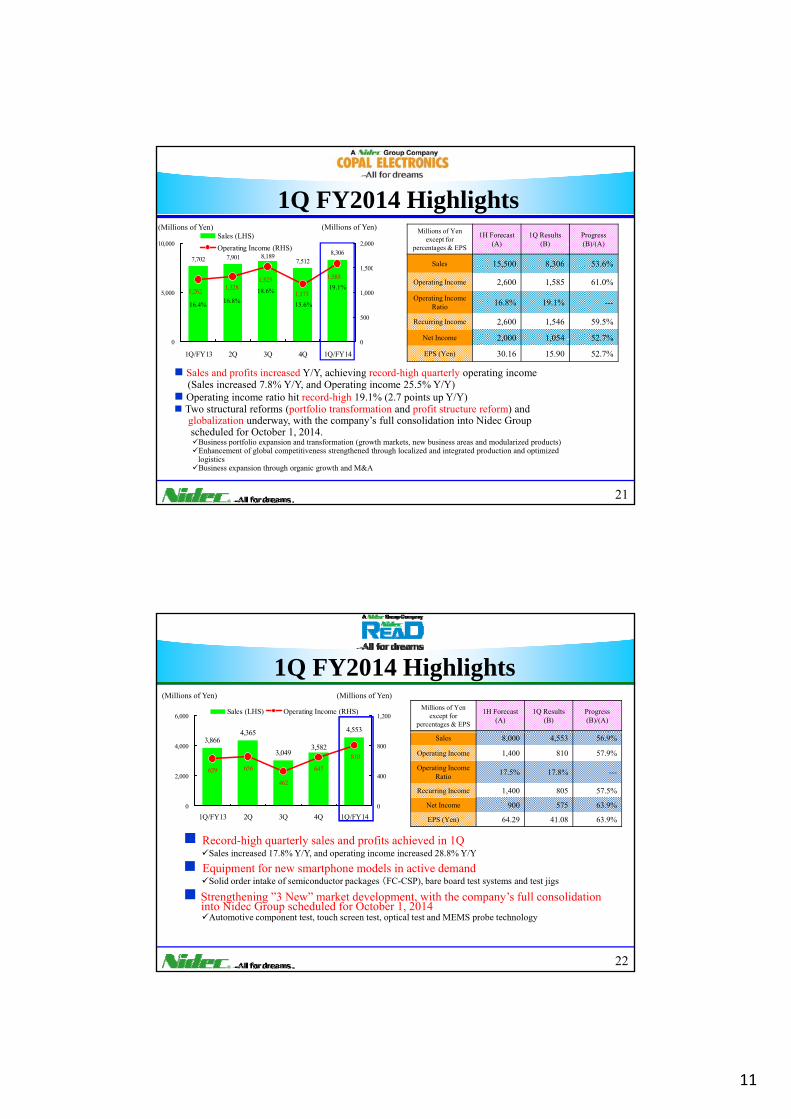
Sales 15,500 8,306 53.6%
(Millions of Yen)
7,7028,306
7,5128,1897,901
10,000
1 00
2,000Sales (LHS)Operating Income (RHS)
(Millions of Yen)
1Q FY2014 Highlights
Sales 15,500 8,306 53.6%
Operating Income 2,600 1,585 61.0%
Operating Income Ratio 16.8% 19.1% ---
Recurring Income 2,600 1,546 59.5%
Net Income 2,000 1,054 52.7%
EPS (Yen) 30.16 15.90 52.7%
1,1731,262 1,3281,523 1,585
0
5,000
1Q/FY13 2Q 3Q 4Q 1Q/FY14
0
500
1,000
1,500
Sales and profits increased Y/Y, achieving record-high quarterly operating income (Sales increased 7 8% Y/Y and Operating income 25 5% Y/Y)
16.4% 16.8%18.6%
15.6%
19.1%
21
(Sales increased 7.8% Y/Y, and Operating income 25.5% Y/Y)Operating income ratio hit record-high 19.1% (2.7 points up Y/Y)Two structural reforms (portfolio transformation and profit structure reform) and globalization underway, with the company’s full consolidation into Nidec Groupscheduled for October 1, 2014.
Business portfolio expansion and transformation (growth markets, new business areas and modularized products)Enhancement of global competitiveness strengthened through localized and integrated production and optimized logisticsBusiness expansion through organic growth and M&A
Millions of Yenexcept for
percentages & EPS
1H Forecast(A)
1Q Results(B)
Progress(B)/(A)
4,5534 365
6,000 1,200Sales (LHS) Operating Income (RHS)
(Millions of Yen)(Millions of Yen)
1Q FY2014 Highlights
Record-high quarterly sales and profits achieved in 1QSales increased 17 8% Y/Y and operating income increased 28 8% Y/Y
Sales 8,000 4,553 56.9%
Operating Income 1,400 810 57.9%
Operating Income Ratio 17.5% 17.8% ---
Recurring Income 1,400 805 57.5%
Net Income 900 575 63.9%
EPS (Yen) 64.29 41.08 63.9%
,
3,582
4,3653,866
3,049
656
462
629 647
810
0
2,000
4,000
1Q/FY13 2Q 3Q 4Q 1Q/FY140
400
800
22
Sales increased 17.8% Y/Y, and operating income increased 28.8% Y/Y
Equipment for new smartphone models in active demandSolid order intake of semiconductor packages (FC-CSP), bare board test systems and test jigs
Strengthening ”3 New” market development, with the company’s full consolidationinto Nidec Group scheduled for October 1, 2014
Automotive component test, touch screen test, optical test and MEMS probe technology

12
Nidec IR Contacts
Nidec logo is a registered trademark or a trademark of Nidec Corporation in Japan, the United States and/or certain other countries. “All for dreams” logo is a registered trademark of Nidec Corporation in Japan, and a trademark in the United States and/or certain other countries.
Japan Tel: +81-75-935-6140 E-mail: [email protected]. Tel: +44-870-351-7388 E-mail: [email protected]. Tel: +1-212-703-7988 E-mail: [email protected]
23
Appendix
P f T dPerformance Trend&
Product Group Overview
24
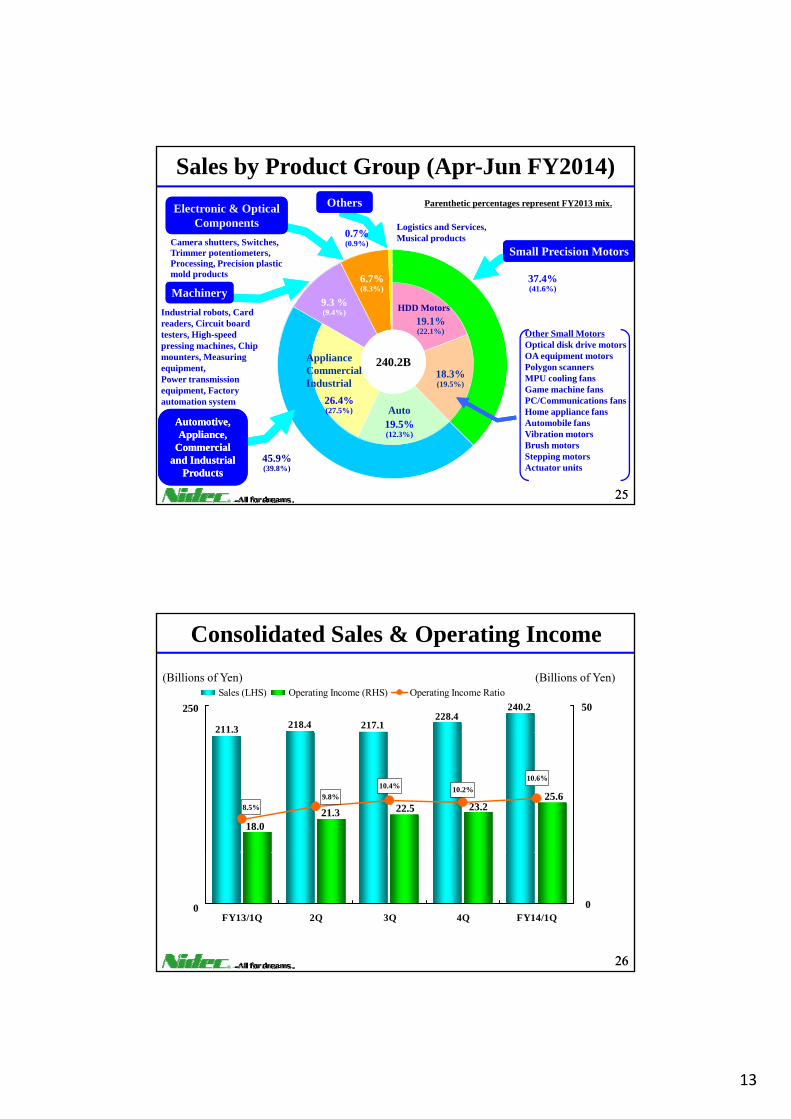
13
0.7%(0.9%)
Small Precision MotorsSmall Precision Motors
Electronic & Optical Components
Electronic & Optical Components
Camera shutters, Switches, Trimmer potentiometers, Processing, Precision plastic
OthersOthers
Logistics and Services, Musical products
Parenthetic percentages represent FY2013 mix.
Sales by Product Group (Apr-Jun FY2014)
240.2B
37.4%(41.6%)
Processing, Precision plastic mold products
Other Small MotorsOptical disk drive motorsOA equipment motorsPolygon scannersMPU cooling fans
19.1%(22.1%)
18.3%(19.5%)
9.3 %(9.4%)
6.7%(8.3%)
HDD Motors
Appliance Commercial Industrial
MachineryMachineryIndustrial robots, Card readers, Circuit board testers, High-speed pressing machines, Chip mounters, Measuring equipment, Power transmission
25
45.9%(39.8%)
Game machine fansPC/Communications fans Home appliance fansAutomobile fansVibration motorsBrush motorsStepping motorsActuator units
(19.5%)
Auto
Industrial
19.5%(12.3%)
26.4%(27.5%)
Automotive, Automotive, Appliance, Appliance,
Commercial Commercial and Industrial and Industrial
ProductsProducts
Automotive, Automotive, Appliance, Appliance,
Commercial Commercial and Industrial and Industrial
ProductsProducts
equipment, Factory automation system
25
228.4218.4211.3
240.2
217.1
Sales (LHS) Operating Income (RHS) Operating Income Ratio
Consolidated Sales & Operating Income
(Billions of Yen)
250 50
(Billions of Yen)
211.3
10.6%
8.5%9.8%
10.4% 10.2%
18.021.3 22.5 23.2
25.6
26
FY13/1Q 2Q 3Q 4Q FY14/1Q00
26

14
24 1 25.0
30
Consolidated Income Before Tax Consolidated Net Income
Consolidated Income Before Tax & Net Income
(Billions of Yen)
13.3
21.1
13.8
24.1
16.0
13.4
25.0
17.917.4
22.1
20
27
0
10
FY13/1Q 2Q 3Q 4Q FY14/1Q27
100 20
Small Precision Motors
87.8 92.8
(Billions of Yen)Operating incomeSales
92.6 89.3 89.9
50 1012.014.3
15.714.6 15.1
28
0FY13/1Q 2Q 3Q 4Q FY14/1Q
0
Sales for Other Small Precision Motors (LHS)Sales for HDD Motors (LHS)Operating Income (RHS)
28

15
150 15
Automotive, Appliance, Commercial and Industrial Products
110 2
Operating incomeSales(Billions of Yen)
4.5
9.07.6
5.35.150
100
5
1080.084.1 83.0
98.2110.2
29
0FY13/1Q 2Q 3Q 4Q FY14/1Q
0
Sales for Automotive (LHS)Sales for Appliance, Commercial, Industrial (LHS)Operating Income (RHS)
30 6
Machinery
23 8 23 5
(Billions of Yen)Operating incomeSales
2.92.8
3.1 2.83.3
10
20
2
419.923.8
19.723.5 22.3
30
0FY13/1Q 2Q 3Q 4Q FY14/1Q
0
Sales(LHS) Operating Income (RHS)

16
20 2
Electronic & Optical Components
17.519.9 19.8
15 6 16.2
(Billions of Yen)Operating incomeSales
1.7 1.10.8
-0.3
-0.8-10
0
10
FY13/1Q 2Q 3Q 4Q FY14/1Q
-1
0
1
15.6 16.2
31
0.8
-20 -2
Sales(LHS) Operating Income (RHS)
3 0 6
Others
(Billions of Yen)
Operating incomeSales
0.10.00.20.00.2
1
2
3
0.2
0.4
0.6
2.0 2.01.8 1.8 1.6
32
0FY13/1Q 2Q 3Q 4Q FY14/1Q
0
Sales(LHS) Operating Income (RHS)