nidec corporation fiscal 2011 financial results
TRANSCRIPT

1
OSE, TSE: 6594 NYSE: NJhttp://www.nidec.co.jp/english/
Nidec Corporation Fiscal 2011 Financial Results
Fiscal Year Ended March 31, 2012 < U.S. GAAP >
April 25, 2012
2
95+59085Dividends
80.00-7.7%-1.2%
79.0882.19
85.7283.15
FX Rate (¥/US$)Average:
Term-end:
416.56-21.2%296.25375.91EPS57,000-22.2%40,73152,333Net Income87,000-13.6%70,85681,966Income before Taxes12.2%10.7%13.7%Operating Income Ratio
95,000-21.3%73,07092,869Operating Income780,000+0.9%682,320675,988Net Sales
FY2012ForecastChangeFY2011FY2010Millions of Yen, except EPS,
dividends and FX rates
Consolidated Profit/Loss
The Japanese Yen and other Asian currencies appreciated against the U.S. Dollar for the year ended March 31, 2012, resulting in a negative effect on our net sales and operating income of approximately 33.2 billion Yen and 7.1 billion Yen, respectively, Y/Y.
See the accompanying notes on Page 31 regarding “Discontinued Operations” (ASC 205-20) .

2
3
808080FX Rates (¥/US$)105105105FX Rates (¥/€)
955045Dividends
12.2%12.4%11.9%Operating Income Ratio
190.01
26,000
40,000
43,000
360,000
1H/FY2012
57,00031,000Net Income87,00047,000Income before Tax
416.56226.55EPS
95,00052,000Operating Income780,000420,000Net Sales
FY2012Forecast2H/FY2012Millions of Yen, except EPS,
dividends and FX rates
FY2012 Forecast
Foreign exchange sensitivity: Every 1 Yen move against the U.S. Dollar and Euro is estimated to have an annualized impact of 5.4 billion Yen and0.5 billion Yen on sales, respectively, and 1.2 billion Yen and 0.3 billion Yen on operating income, respectively.
4
0
40
80
120
160
200
240
1Q 2Q 3Q 4Q 1Q 2Q 3Q 4Q 1Q 2Q 3Q 4Q0
5
10
15
20
25
30Sales (LHS)Operating Income (RHS)
FY2009 4
Consolidated Quarterly Results
(Billions of Yen)
FY2010 FY2011
Swinging back on growth path from flood-induced plunge
Sales
Operating Incom
e

3
5
55.0
41.434.2 32.6
38.0
27.7 30.136.0
65.0
0
40
80
FY2010 FY2011 FY2012 FY2010 FY2011 FY2012 FY2010 FY2011 FY2012
CAPEX, Depreciation, R&D
CAPEX Depreciation R&D(Billions of Yen)
(F) (F) (F)See the accompanying notes on Page 31 regarding “Discontinued Operations” (ASC 205-20) .
6
Net IncomeOperating IncomeSalesMillions of Yen
217,600
13,000
31,000
30,600
63,000
80,000
FY2012(Forecast)
210,481
9,813
29,118
33,508
56,116
81,926
FY2011
238,579
12,780
30,580
29,946
73,131
92,142
FY2010
15,9509,90916,35124,65020,13230,780Total
1,7009301,5532,5001,5402,436Nidec-Read
3,1002,7062,8874,7004,1944,969Nidec CopalElectronics
1,8501,8442,3663,1503,1404,009NidecTosok
3,8001,0682,0396,3005,0248,113NidecCopal
5,5003,3617,5068,0006,23411,253Nidec
Sankyo
FY2012(Forecast)FY2011FY2010FY2012
(Forecast)FY2011FY2010
Listed Subsidiaries -Results & Forecasts-
Numbers above are based on the generally accepted accounting standards in Japan.

4
Vision 2015
7
8
Business Environment and Strategy
■ HDD motors will remain on growth track as ZB (zettabyte) platform takes hold. Competition points toward a showdown amid drasticindustry consolidation, making technological strength the key forsurvival.
■ Automotive motor business has completed highly localized manufacturing and sales network to meet the requirements from therapidly globalized automobile industry. Growth is expected toaccelerate through further expansion in emerging markets.
■ Household and industrial motor sales are expected to expand throughorganic and M&A business growth, with strong focus on newapplications and markets.
■ M&A revolves around new technology acquisitions in developed countries and channel acquisitions in emerging countries.

5
9
HDD Market Long-Term Outlook
Perpendicular Magnetic Recording Heat-Assisted MR
Explosive growth in digital contents signals future “capacity crunch”
2020201520102005
Dig
itiza
tion
& H
DD
Cap
acity
Gro
wth
Smart phone
Tablet PC
Cloud computing
PC demand expansion
Digital images
Video contentHigh-definition/ 3D images
Data center
Global Digital Content Avg. Annual Growth:
40%
HDD Technology Roadmap
Time
Widening Gap
HDD Areal Density
Avg. Annual Growth: 20%
Digital data explosion outpacing HDD capacity increase
HDD Unit Growth
10
Digital Universe Mid-Term Landscape
Price/GB
Market size
Price/GB
Market size
$0.40/GB$1.60/GB
$55B$18BNand
$0.04/GB$0.10/GB
$47B$34B HDD 10-Fold
Cost Difference
CY2005CY2010 CY2015
445EB
2,450EB (2.45ZB)
1,100EB (1.10ZB)
337EB 137EB11EB
Digital universe HDDNand
Stored by Nand
Stored by HDDs
Digital universe(Total digital data volume
produced in 2015)
Digital data
volume
Time
HDD underpinning ZB (Zettabyte =1 trillion GB) platform
50EB
1ZB (Zettabyte) = 1,000EB1EB (Exabyte) = 1,000PB1PB (Petabyte) = 1,000TB1TB (Terabyte) =1,000GB
(Source: Nidec estimates)

6
11
HDD Market Mid-Term Outlook
1,295GB/unit517GB/unit20%Capacity per unit
850M units651M units5%Total unit shipments
1,100EB337EB27%Total storage capacity
CY2015 (F)CY2010CAGR(2010-15)Global HDD Market
Global SSD capacity expected to equal barely 1% of global HDD capacity in 2015. “Replacement by SSD” remains an unrealistic prospect.
CY2015 (F)CY2010CAGR (CY2010-15)Global Nand/SSD Market
105GB/unit67GB/unit10%(SSD) Capacity per unit
105M units8.9M units65%(SSD) Total unit shipments
11EB0.6EB80%(SSD) Total storage capacity
137EB11.2EB65%(Nand) Total storage capacity
1%
While SSD remains on fast track for unit growth, HDD continues to lead mainstream capacity growth
(Source: Nidec estimates)
12
HDD Demand Mid-Term Outlook
0
200
400
600
800
1000
FY2010 FY2011 FY2012 FY2013 FY2014 FY2015 FY2016
TabletsServers (enterprise and nearline) DesktopsNotebooksUltrabooks
HDD unit growth expected to continue in the server(e.g. cloud computing) and ultra-thin PC markets
(Millions of Units)
(Source: Nidec estimates)

7
13
HDD Industry Consolidation3 HDD makers forming stable industry environment
Product consolidation → driving up R&D efficiencyProduction line consolidation → improving capacity utilization and
reducing outsourcing costs Customer consolidation → enhancing closer relationship management
HGST Seagate
Western Digital
ToshibaMarket Shares by
Units Shipped
Three-fold benefit for Nidec:
Seagate
Western Digital
Toshiba
Samsung
(Source: Nidec estimates)*
* To be operated independentlyfor two years
*
*
14
HDD Motor Industry Consolidation3 motor suppliers competing for 3 customers
Technological strength → attracting customers ahead of the competitorsMerit of scale → meeting post-flooding pent-up demand
Company S
Company A
Company M
Nidec’s competitive advantages:
Company S
Company M
Market Shares by Units Shipped(Source: Nidec estimates)

8
15
Technological Advantages
Year 2000: Fluid Dynamic Bearing (FDB)
Advanced element technology generating competitive originality
2012: Ultra-thin PC Components
1. Nidec-ShimpoPrecision presstechnology
2.Nidec CopalPrecision molding technology
3. Nidec TosokPrecision measurement technology
*Formerly Nidec-Kyori
* 1. U.S. Minsterlarge-size press technology
2. Nidec FDB technology
FDB development
ahead of competitors
Ultra-thin pressed bases and UFF * fans brought to market
< Past example > < Ongoing example >
Market leadership
Used in ultra-thin HDDs and fans for Ultrabooksand tablets
*UFF: UltraFlo FDB
16
Shipments Outlook (HDD & Nidec Motors)
Nidec shipments pointing toward record volume after flood-induced output plunge
FY2011 FY2012
177
145160
180 190 180
136120
135 145155
145
0
50
100
150
200
Sep Q Mar Q Jun Q (F) Sep Q (F) Dec Q (F) Mar Q (F)
HDD shipments Nidec motor shipmentsPrevious High(Jul-Sep 2011)
(Millions of Units)
(Source: Nidec estimates)

9
17
0
200
400
600
800
1,000
FY2010 FY2011 FY2012 FY2013 FY2014 FY2015
M&A
Household & Industrial motors (Organic)Automotive motors (Organic)
(Sales in Billions of Yen)
Vision2015 Mid-Term Plan -Two Key Businesses-
Automotives 500B + Households & Industrials 500B = 1,000B Yen
18
Strategic M&A Management(Automotives, Households, Industrials)
Filling the missing pieces (Application-oriented approach for intra-regional market penetration)
South America
Industrials
Households
Automotives
Asia-PacificEurope
Middle East Africa
North America
Sole
ASI
Nidec
Nidec
Future M&A targets
NMC
NMANMA
Techno Motor

10
19
Electric Power Steering Motors
0
5,000
10,000
15,000
20,000
FY2010 FY2011 FY2012 FY2013 FY2014 FY2015
Adding customers and penetrating in emerging markets
4,3396,279
7,800(F)
[3] [4] [7] [9] [15] [15]
Figures enclosed by [ ] represent the number of EPS customers
< Nidec EPS Motor Shipments Outlook >(Thousands of Units)
20
0
1,000
2,000
3,000
4,000
5,000
Automotive Brushless Motor Sales Expansion
0
250
500
750
1,000
Increased order intake and active inquiries from potential customers
404
1,018
2,000(F)
Nidec Dual-Clutch Transmission Motors Nidec Electric Oil Pump Motors
(Thousands of Units)
FY10 FY11 FY12 FY13 FY14 FY15 FY10 FY11 FY12 FY13 FY14 FY15
Shipments Outlook
(Thousands of Units)

11
21
Japan China Germany U.S.A./U.K.
Automotive Motors -R&D Globalization-
●
●
●
●
●
●
●
●
●●Electronic Control Units (ECU)
●Traction Motors (SR Motors, etc.)
●●ABS Motors
●●Engine Cooling Motors
●●Sunroof/Window lift Motors
●●Seat Adjuster Motors
New LabsDCT Motors, etc. (Brushless)
New Labs EPS Motors (Brushless)
Blended expertise and low-cost development environment
Japan: Shiga Technical Center China: Nidec (Dalian) Limited Technical CenterGermany: Nidec Motors and Actuators ( NMA)U.S.A./U.K.: Nidec Motor Corporation (NMC)
Synergy (SR & ECU)
R&D in
Dalian
TechnicalTransfer
Brush motors geared toward emerging markets
22
Automotive Motors Expanding into Emerging Markets
Accelerating entry into Chinese, Indian and Brazilian markets
Chinese Market23M Units
IndianMarket
5M UnitsBrazilian
Market5M Units
Window lifts (WL)
Engine CoolingFans(EC)
Electric Power Steering
(EPS)
PowerSeats
ABS
Others
EPS
EC
WL
ABS
WL
EPS
EC
ABS
Number of units based on CY2015 automobile market forecast
(Source: Nidec estimates)

12
23
Ahmedabad
Mumbai
ChennaiPune
Bangalore
Neemrana Industrial Area(Planned factoryconstruction site)
Sales office
Distributors
Both manufacturing and selling done within the market
Neemrana factory to be launched in Dec. 2013
Automotive Motor Production in India
Automobiles
Home appliances & Automobiles
ITCommunications & Automobiles
Nidec at “Electronica India” Exhibition
Delhi
Home appliances & Automobiles
24
Automotive Motors Global Production Framework
Globalized manufacturing reach gearing up for market expansion
China(Dalian)
EPS motor production
(2012-)
SpainEngine cooling motor
Mass-production
EuropeAsia
Americas
Mexico (Reynosa)EPS motor production
(2013-)
Mexico(Juarez)
ABS motor mass-production
GermanyAutomated production
India Planning to manufacture automotive
and home appliance motors
China (Zhejiang)EPS motor
mother factory
PolandMass-
production
China (Zhejiang): Nidec Automobile Motor (Zhejiang) Corp.
China (Dalian): Nidec (Dalian) Ltd. Mexico (Reynosa): Nidec Motor Corp. (NMC)
Nidec Motors and Actuators(NMA)
GermanyPoland SpainMexico(Juarez)

13
25
Industrial Motors Global Market IHP Motors make up an estimated 1,700B Yen Market (IHP Motor: Integral Horsepower Motor operating at 1hp and above)
Europe Middle East
Africa
Asia-Pacific North America
Central and South America
Nidec’s current share position: approx. 2%
NEMA: National Electrical Manufacturers Association (U.S.)IEC: International Electrotechnical Commission
NEMA-compliant: 16BIEC-compliant: 295B
NEMA-compliant: 32BIEC-compliant: 1,042B
NEMA-compliant 29BIEC-compliant 82B
NEMA-compliant: 180BIEC-compliant: 15B
(Source: Nidec estimates)
26
Planned Acquisition of ASI, Italy Entering markets for industrial large-size motors/generators,
low/middle voltage drives, and automation systems
ASI zero-emission urban solutions Offshore wind power generation
Marine traction motors
Energy storage
Solar power generation
Hydropower generation
Electric load control
Electrification of cranes and material handling equipment
Name of acquiree: Ansaldo Sistemi Industriali S.p.A., Italy Year of establishment : 1853Key manufacturing locations: Italy (4 sites), France, RussiaNumber of employees: 1217Annual sales (unaudited): 292M Euro (for the fiscal year ended Dec 2011) Planned closing of acquisition: May 2012

14
27
Bolstering Industrial Product Portfolio
Power supplies
DrivesMotors & Generators
Electrification & Automatization
ASI Operations Overview
IEC LV
NEMA LV
Motors
NMC+ASI=ASI+NMC
Small size (300kw or below)
Generators
MV (5,000hp or above)
MV (5,000hp or below)
Services
Industrial Automation
MV
LV Drives
Middle and large size (5,000kw or above)
Moderate StrongNMC-ASI product presence
NMC-ASI Network Synergies
Cross-continent interaction between NMC and ASI
North America
South AmericaProductionR&DSales
NMC
ProductionR&DSales
ASI
Europe
Asia
Synergy
Moscow
ItalyMexico
NMC
ASI
EuropeRussiaMiddle EastIndiaChinaSouth
AmericaNorth
America
ModerateStrong< NMC-ASI market presence >
28

15
29
Breaking Ground Towards Global Leadership in Household Motor Market
Nidec Techno Motor setting stage for new sales growth
Planned construction of “Fukui Technical Center” in Obama City, Fukui, Japan
Operations: -Development of small and medium air-conditioning motors;
-Designing of mass-production lines and technicalassistance for manufacturing factories overseas
Lot area : 45,000 sq mEmployees: 250 (to be increased up to 500 by 2020)
Fukui Technical Center (to be launched in March 2013) FY2010 FY2011 FY2012 FY2013
<Nidec Techno Motor>Sales (Yen)
34.4B
40.0B
-Thai floods-European debt crisises
30
M&A Driven by SubsidiariesNidec-Shimpo completing acquisition of The Minster Machine Company, U.S.A.
Composite Press Machine (Press + Feeder)
High-speed Precision Press Machine (1,650 tons)
Acquiree: The Minster Machine CompanyYear of establishment: 1901Key manufacturing locations: U.S.A. (Minster), Germany, China Number of employees: Approx. 500Annual sales (unaudited): 120M US$ (for the fiscal year ended Dec 2011)
■100-year long business footprints in 80 countries■Proven technologies and knowhow acquired through
high-precision die casting and deep spinning
Pressed Bases
for Ultra-thin
HDD
Large Industrial Motors
AutomotiveMotors
Elemental technologies applied to

16
3131
Accounting Treatment of “Discontinued Operations”Pursuant to FASB Accounting Statements Codification (ASC) 205-20, "Presentation of Financial Statements-Discontinued Operations,” the results of discontinued operations have been reclassified and presented separately from those of continuing operations as “Loss from discontinued operations.” The relevant prior-period statements have beenretrospectively adjusted to reflect this reclassification.
Disclaimer Regarding Forward-Looking StatementsThese presentation materials and the subsequent discussions regarding the Nidec Groups’ financial results contain forward-looking statements including expectations, judgment, plans, and strategies. The forward-looking statements are based on management’s assumptions and belief in light of the information currently available. Certain risks, uncertainties and other factors could cause actual results to differ materially from those discussed in the forward-looking statements. Such factors include, but are not limited to: fluctuation of currency exchange rates, overall supply and customer demand in the motor industry, product development and production capabilities, performance of affiliated companies, and other risks and uncertainties. Nidec undertakes no obligation to update forward-looking statements to reflect events or circumstances that occur after the date the forward-looking statements are made.
32
70.9%(67.5%)
44.8%(47.2%)
26.0%(29.0%)
10.2%(10.4%)
4.1%
4.5%26.1%(20.3%)
9.5%(11.5%)
14.0%(15.9%)
5.6%(5.1%)
682.3BYen
Sales by Product Group (FY2011)
Auto parts, Logistics, Services Etc., Musical products
OthersOthers
Camera shutters, Switches, Trimmer potentiometers,Actuator units, Processing, Precision plastic mold products
Electronic & Optical Components
Electronic & Optical Components
Industrial Robots, Card Readers, Circuit board testers, High-speed pressing machines, Chip mounters, Measuring equipment, Power transmission equipment, Factory automation systems
MachineryMachinery
Motors for automobiles, home electronic appliances and industrial equipment
General MotorsGeneral MotorsMotorsMotors
Small Precision MotorsSmall Precision Motors
Other DC MotorsOptical disk drives,OA equipment motors,Polygon scanners,Other brushless DC motors
Fan MotorsGame machine consoles,MPU cooling fans,PC/communication devices,Home appliances,Automobiles
Other Small MotorsVibration motors,Brush motors,Stepping motors
Parenthetic percentages represent FY2010 mix.
HDD Motors
See the accompanying notes on Page 31 regarding “Discontinued Operations”(ASC 205-20) .

17
33
592.8 571.6
682.3676.0
780.0
95.0
73.1
92.979.3
52.8
10.7%
13.7%13.9%
8.9%
12.2%
FY08 FY09 FY10 FY11 FY12
Sales (LHS) Operating Income (RHS) Operating Income (RHS)
0 0
500 100
50
1,000
Consolidated Sales & Operating Income(Billions of Yen) (Billions of Yen)
(F)See the accompanying notes on Page 31 regarding “Discontinued Operations”(ASC 205-20) .
34
76.0
52.0
82.0
52.3
70.9
40.7
87.0
57.0
28.4
48.0
0
25
50
75
100
FY08 FY09 FY10 FY11 FY12
Consolidated Income Before Tax & Net Income(Billions of Yen) Income Before Tax Net Income
(F)See the accompanying notes on Page 31 regarding “Discontinued Operations”(ASC 205-20) .

18
35
60.0
95.085.0 90.0
65.0
417
296
197
376373
0
50
100
FY08 FY09 FY10 FY11 FY120
250
500
Annual Dividends (LHS) EPS (RHS)
Dividends and EPS(Yen/share) (Yen)
(F)
36
83.1
56.7
-106.9
-19.9
36.8
-23.9
-120
0
120
FY2010 FY2011
Operating ActivitiesInvestment ActivitiesFree Cash Flow (Operating CF + Investment CF)
Consolidated Cash Flow(Billions of Yen)

19
37
52.1
63.2 60.1
0
200
400
600
FY09 FY10 FY110
25
50
75
Other Small Motors (sales, LHS)Fan Motors (sales, LHS)Other DC Motors (sales, LHS)HDD Motors (sales, LHS)Operating Income (RHS)
178.2
137.3
73.4
-0.4
3.4
6.3
-50
0
50
100
150
200
FY09 FY10 FY11 -3
0
3
6
9
12
Sales (LHS)Operating Income (RHS)
326.9 319.1 305.2
Product Groups Overview -1<Small Precision Motors> <General Motors>
(Billions of Yen) (Billions of Yen)
See the accompanying notes on Page 31 regarding “Discontinued Operations”(ASC 205-20) .
38
64.977.3
48.0
6.6
12.6
5.9
0
45
90
135
180
FY09 FY10 FY110
3.5
7
10.5
14
Sales (LHS)Operating Income (RHS)
95.694.5107.7
9.411.1
17.4
0
50
100
150
200
250
FY09 FY10 FY110
4
8
12
16
20
Sales (LHS)Operating Income (RHS)
38.4
28.834.6
3.4
4.14.5
0
15
30
45
60
75
FY09 FY10 FY110
1
2
3
4
5
Sales (LHS)Operating Income (RHS)
Product Groups Overview -2<Machinery> <Electronic & Optical Components> <Others>
(Billions of Yen) (Billions of Yen)(Billions of Yen)
See the accompanying notes on Page 31 regarding “Discontinued Operations”(ASC 205-20) .

20
39
100105
101
0
80
160
240
FY2009 FY2010 FY201160
90
120
150
Sales (LHS) Shipment Index (RHS)
HDD Motors
(Billions of Yen) (Shipment Index: FY2009=100)
40
99104
100
0
25
50
75
100
FY2009 FY2010 FY201180
100
120
140
160
Sales (Parent, LHS) Sales (Subsidiaries, LHS)Shipment Index (Parent, RHS)
Other DC Motors
(Billions of Yen) (Shipment Index: FY2009=100)
See the accompanying notes on Page 31 regarding “Discontinued Operations”(ASC 205-20) .

21
41
108111
100
0
10
20
30
40
FY2009 FY2010 FY201180
90
100
110
120
Sales (Parent, LHS) Sales (Subsidiaries, LHS)Shipment Index (Parent, RHS)
Fan Motors
(Billions of Yen) (Shipment Index: FY2009=100)
42
6.3
3.4
-0.4-50
0
50
100
150
200
FY2009 FY2010 FY2011 -3
0
3
6
9
12
Nidec sales (LHS) NMA sales (LHS)Nidec Sole Motor sales (LHS) Nidec Techno Motor Holdings sales (LHS)Nidec Motor sales (LHS) Operating Income (RHS)
178.2
137.3
73.4
General Motors
Sales Operating Income
(Billions of Yen)

22
43
5.9
12.6
6.6
0
25
50
75
100
FY2009 FY2010 FY20110
5
10
15
20
Nidec Sankyo sales (LHS) Nidec-Shimpo & Read sales (LHS)Nidec-Kyori sales (LHS) Nidec Copal sales (LHS)Nidec Tosok sales (LHS) Other Subsidiaries sales (LHS)Operating Income (RHS)
48.0
77.3
64.9
Machinery(Billions of Yen)
Sales Operating Income
44
9.4
17.4
11.1
0
30
60
90
120
150
FY2009 FY2010 FY20110
5
10
15
20
25
Nidec Sankyo sales (LHS) Nidec Copal sales (LHS)Nide Copal Electronics (LHS) Operating Income (RHS)
94.5107.7
95.6
Electronic & Optical Components
Sales Operating Income
(Billions of Yen)
See the accompanying notes on Page 31 regarding “Discontinued Operations”(ASC 205-20) .
23
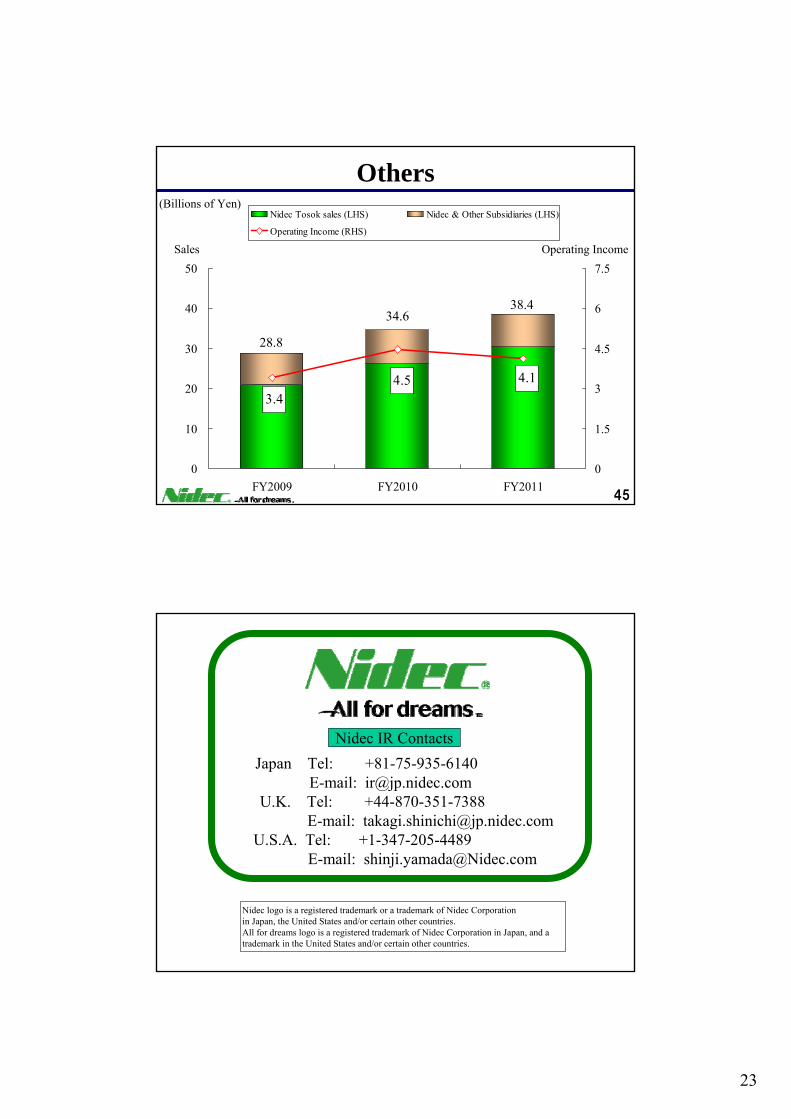
45
3.44.5 4.1
0
10
20
30
40
50
FY2009 FY2010 FY20110
1.5
3
4.5
6
7.5
Nidec Tosok sales (LHS) Nidec & Other Subsidiaries (LHS)
Operating Income (RHS)
28.8
34.638.4
Others
Sales Operating Income
(Billions of Yen)
46
Thank You!
Nidec IR ContactsJapan Tel: +81-75-935-6140
E-mail: [email protected]. Tel: +44-870-351-7388
E-mail: [email protected]. Tel: +1-347-205-4489
E-mail: [email protected]
Nidec logo is a registered trademark or a trademark of Nidec Corporationin Japan, the United States and/or certain other countries. All for dreams logo is a registered trademark of Nidec Corporation in Japan, and a trademark in the United States and/or certain other countries.