nexans group presentation oct 08 .ppt [mode de … presentation_oct20… · europe leader strategy...
TRANSCRIPT

Group presentation
October 2008

Safe Harbor
This presentation contains forward-looking statements relating to the Group’s expectations for futurefinancial performance including sales and profitabilityfinancial performance, including sales and profitability.
The forward looking statements contained in this presentation are dependent on known and unknownrisks, expectations and assumptions, uncertainties and other factors which may cause the Group’s actual
lt f d bj ti t b t i ll diff t f th i di t d b th f d l kiresults, performance and objectives to be materially different from those indicated by the forward lookingstatements.
These forward looking statements depend, amongst other things, on the following assumptions and risks :(1) the rates of economic growth in the areas where Nexans operates remaining at current levels until2009; (2) the continued strong demand of the energy infrastructure market, in particular in developingcountries, and in the Oil & Gas sector; (3) the possibility to pass on to final customers increases in thecosts of raw materials, energy and transport; (4) the management of risks associated with sales in turnkeycosts of raw materials, energy and transport; (4) the management of risks associated with sales in turnkeyprojects; (5) the effect of currency fluctuations being neutral; (6) the Company being able to modifycustomer and supplier payment terms relating to metals; (7) the Company being able to reduce its costbase through realization of restructuring actions in the anticipated time frame; (8) the Company being ablet hi d ti it i t (9) t ti f k t (10) th b f b t ti lto achieve productivity improvements; (9) retention of key customers, (10) the absence of substantialcapacity increases by competitors in Nexans’ key markets, (11) the Company successfully integratingacquisitions ; and (12) the Company being able to adapt its organization.
Investor relations :
Michel Gédé[email protected]
Angéline Afanoukoe [email protected]@nexans.com [email protected]
Tel: 33 1 56 69 84 81 - Fax: 33 1 56 69 86 40
AGENDA
I.I. Nexans in the Cable IndustryNexans in the Cable Industry
II.II. Financial performanceFinancial performance
III.III. Strategy & MT TargetsStrategy & MT Targets
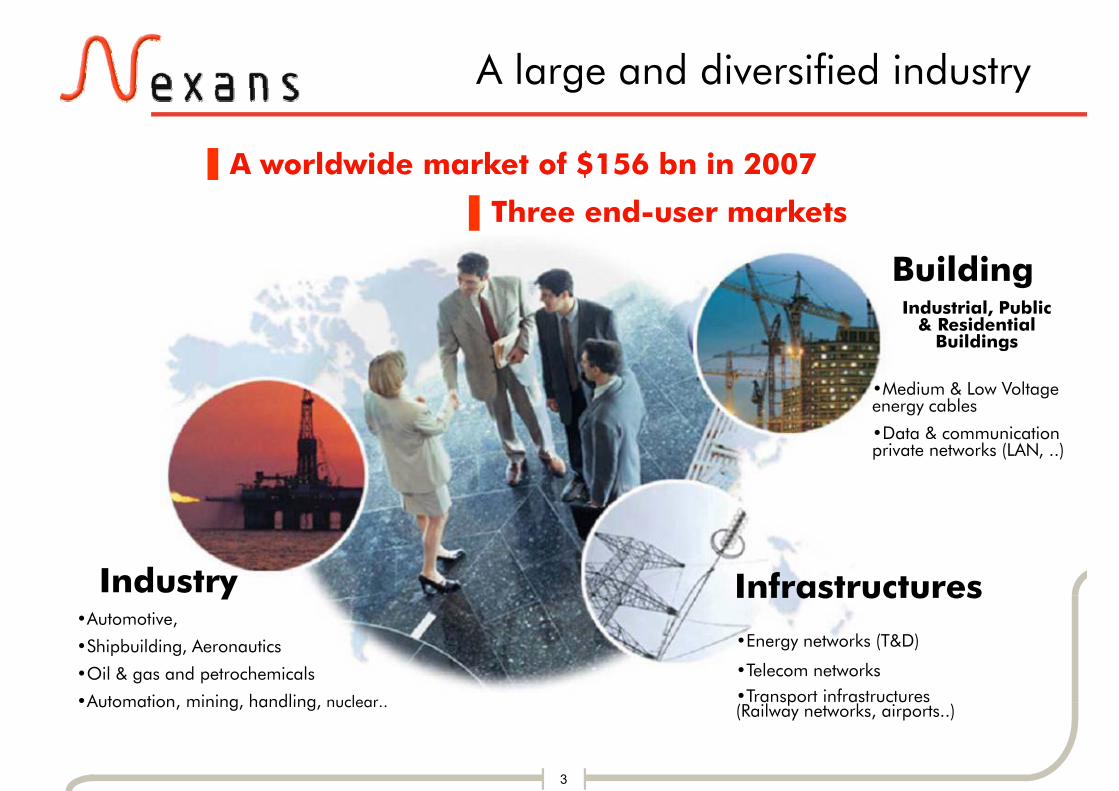
A large and diversified industryg y
▌A worldwide market of $156 bn in 2007
B ildi
▌ $
▌Three end-user markets
BuildingIndustrial, Public
& Residential Buildings
•Medium & Low Voltage energy cables
•Data & communication a a co u ca o private networks (LAN, ..)
Industry InfrastructuresA t ti
•Energy networks (T&D)
•Telecom networks•Transport infrastructures
•Automotive,
•Shipbuilding, Aeronautics
•Oil & gas and petrochemicals
•Automation mining handling nuclear
3
p(Railway networks, airports..)•Automation, mining, handling, nuclear..
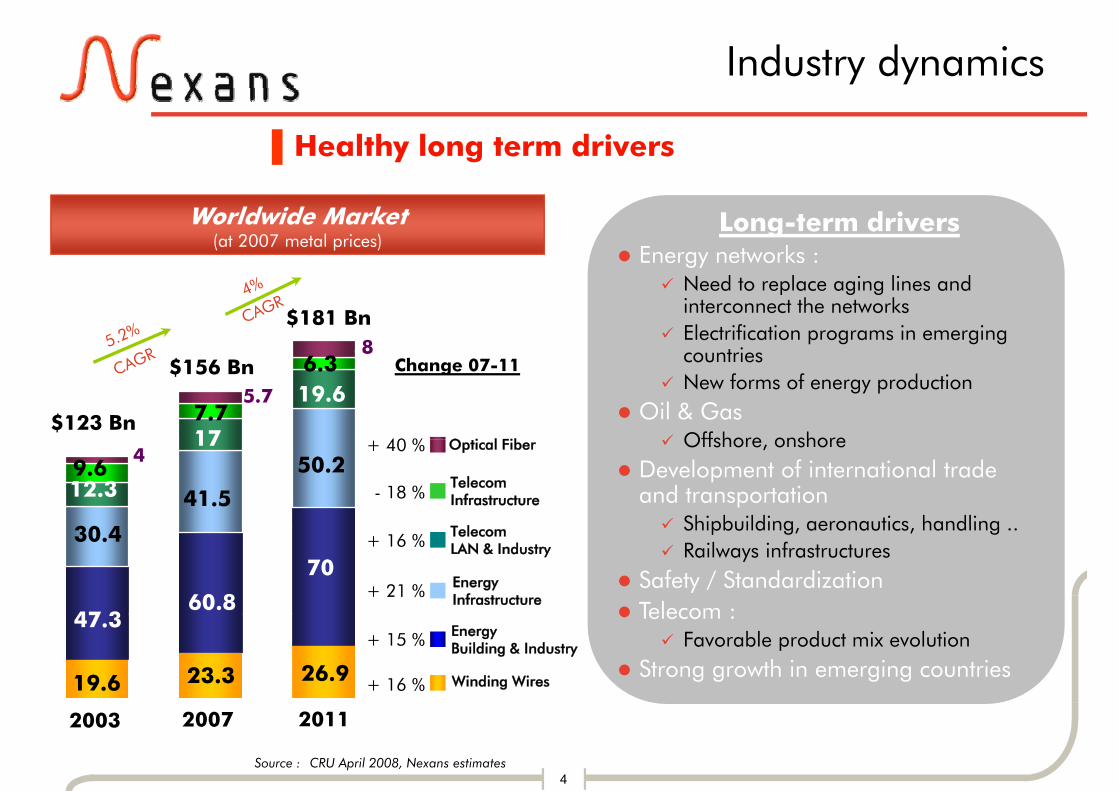
Industry dynamics
▌Healthy long term drivers
Worldwide Market(at 2007 metal prices)
Long-term driversEnergy networks :
$181 Bn8
gyNeed to replace aging lines and interconnect the networksElectrification programs in emerging
t i$156 Bn
7.7
6.3
17
19.65.7
8Change 07-11
40 % O i l Fib$123 Bn
countriesNew forms of energy production
Oil & GasOffshore onshore
41.5
50.217
- 18 %Telecom Infrastructure
T l
+ 40 % Optical Fiber
30 4
9.612.3
4Offshore, onshore
Development of international tradeand transportation
Shipbuilding aeronautics handling
+ 21 %60.8
70Energy Infrastructure
+ 16 % Telecom LAN & Industry
47 3
30.4 Shipbuilding, aeronautics, handling ..Railways infrastructures
Safety / StandardizationTelecom :
26.923.3
+ 15 %
Winding Wires+ 16 %
Energy Building & Industry
47.3
19.6
Telecom : Favorable product mix evolution
Strong growth in emerging countries
4Source : CRU April 2008, Nexans estimates
201120072003

Nexans:the world-wide market leaderthe world wide market leader
2007 Cable & Wire sales in M€main listed players
8,005(6,512 exc.
EW)Madeco W&C(proforma for Nexans, GC and LS)
4,300ePDIC
5,118
4,800eo/w SE~ 2,200e
PDIC
1,4841 409
2,816
2,367 ,
3,300e
2,300eCommscopeBelden
1,409
GC Prysmian Draka Leoni 2,300e2,000e
1,549
pGC y
El Sewedy
1,198
SEI TaihanFujikuraFurukawaLS
El Sewedy Cables
Automotive wiring systemsbreakdown non availableTelecom Cables
5
Sources : Financial communication of corresponding companies, Nexans estimates
Energy CablesElectrical Wires Note : 1 € = 1.37 USD
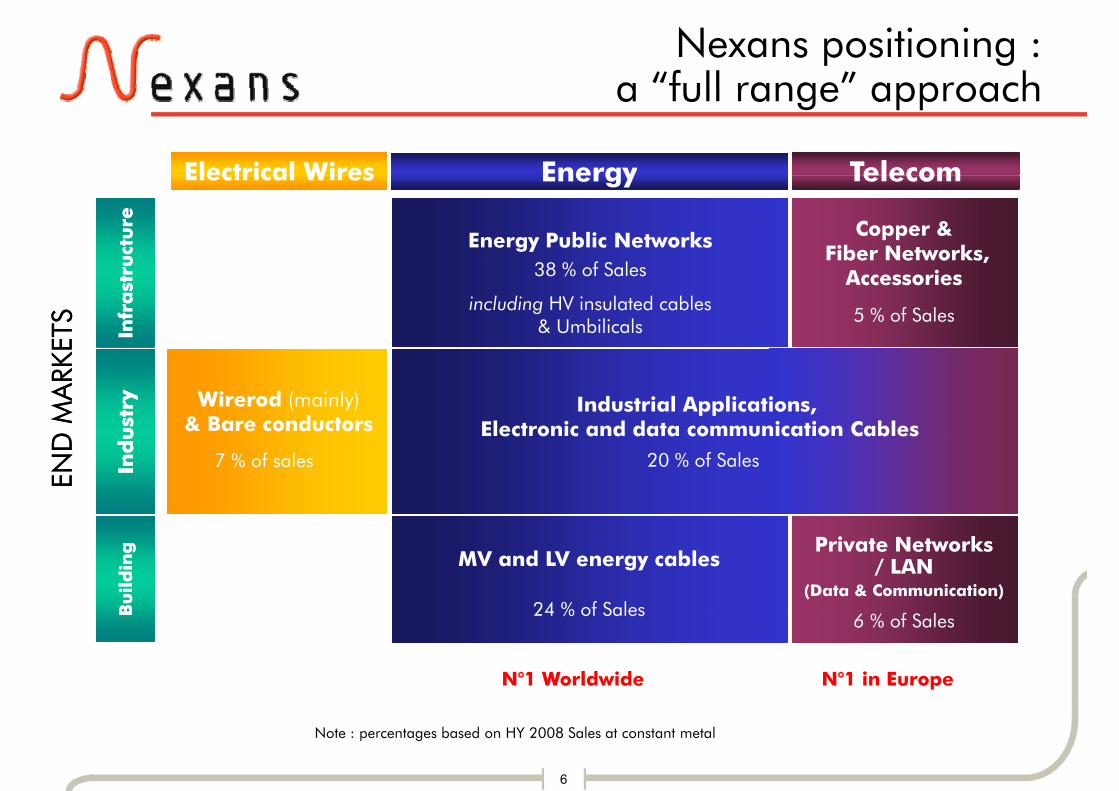
Nexans positioning : a “full range” approacha full range approach
Electrical Wires TelecomEnergyElectrical Wires
Energy Public Networks Copper &Fiber Networks, u
ctu
reu
ctu
re
38 % f S l
TelecomEnergy
ETS
ETS
Accessoriesincluding HV insulated cables
& UmbilicalsInfr
ast
ruIn
fra
stru 38 % of Sales
5 % of Sales
D M
ARK
D M
ARK
Wirerod (mainly)& Bare conductors
Industrial Applications,Electronic and data communication Cablesu
stry
ust
ry
END
END
7 % of sales Ind
Ind
20 % of Sales
MV and LV energy cablesPrivate Networks
/ LAN (Data & Communication)
Bu
ild
ing
Bu
ild
ing
24 % of Sales6 % f S l
N°1 Worldwide N°1 in Europe
24 % of Sales6 % of Sales
6
Note : percentages based on HY 2008 Sales at constant metal

A multi-regional strategy
Our markets are of multi-regional naturewith a need for local presence
Europe Leader strategy
with a need for local presence
p51 % of sales*
h ll l
gyAbove 10% market shares
Challenger position, present only in selected business segments :
Strong positions in Canada (Energy) 15% f LAN k t i th USA
North America17 % of sales*
15% of LAN market in the USA
Selective approach in North-East AsiaAsia-Pacific Profitable market shares on selected
business (HV, Shipyards, ..)Leading player in Australasia
Asia-Pacific12 % of sales*
Leading player on selected regionsMiddle East South America
ROW20 % of sales*
7
Middle East, South America20 % of sales
* based on 2007 Sales by destination, at actual metal prices – proforma with Madeco
AGENDA
I.I. Nexans in the Cable IndustryNexans in the Cable Industry
II.II. Financial performanceFinancial performance
III.III. Strategy & MT TargetsStrategy & MT Targets

Nexans is growing faster than its marketsthan its markets
organic growth of Cable activities +9 3% /yearorganic growth of Cable activities +9.3% /yearsince 2003 vs +5.2% market CAGR (*)
S l
I M€
Sales (at constant metal prices)
Organic growth by cable In M€ types
4,822
2003 2007
3,924
9
(*) Compounded Annual Growth rate
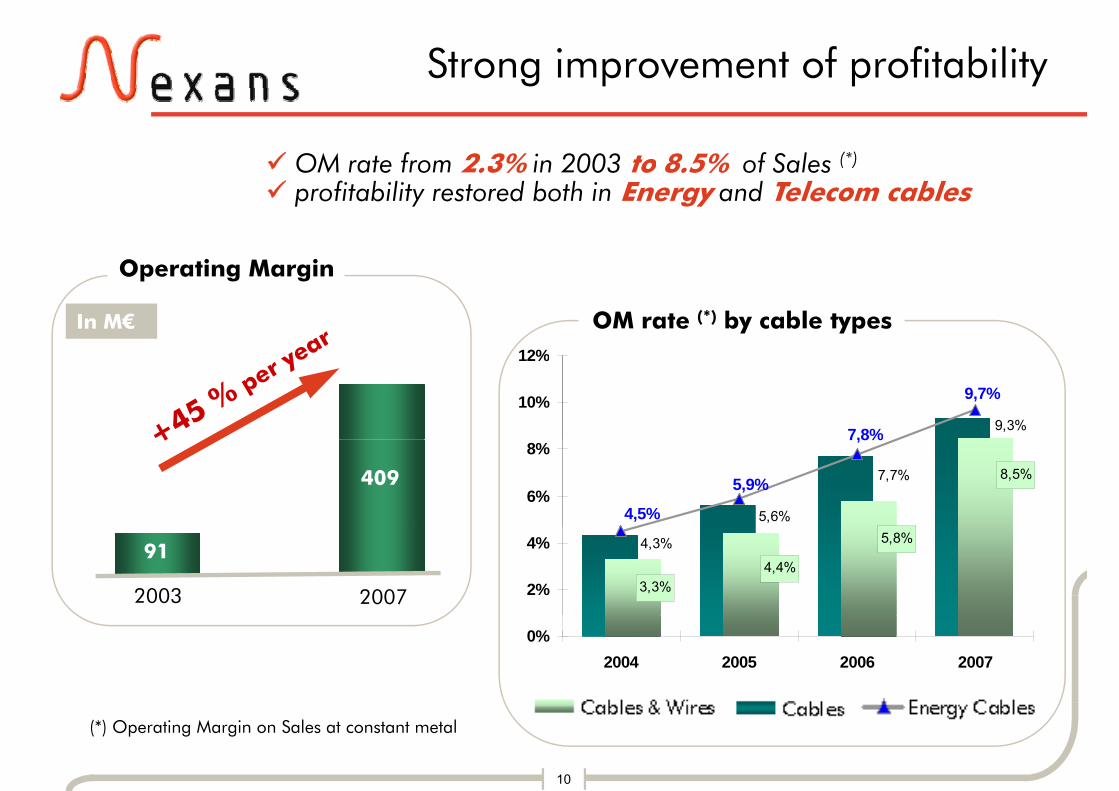
Strong improvement of profitability
OM rate from 2.3% in 2003 to 8.5% of Sales (*)
O ti M i
profitability restored both in Energy and Telecom cables
12%
Operating Margin
In M€ OM rate (*) by cable types
9,3%
9,7%
7,8%
10%
12%
5,6%
7,7% 8,5%
4,5%
5,9%
7,8%
6%
8%
409
4,3%
3,3%4,4%
5,8%
2%
4%
20072003
91
0%2004 2005 2006 2007
10
(*) Operating Margin on Sales at constant metal
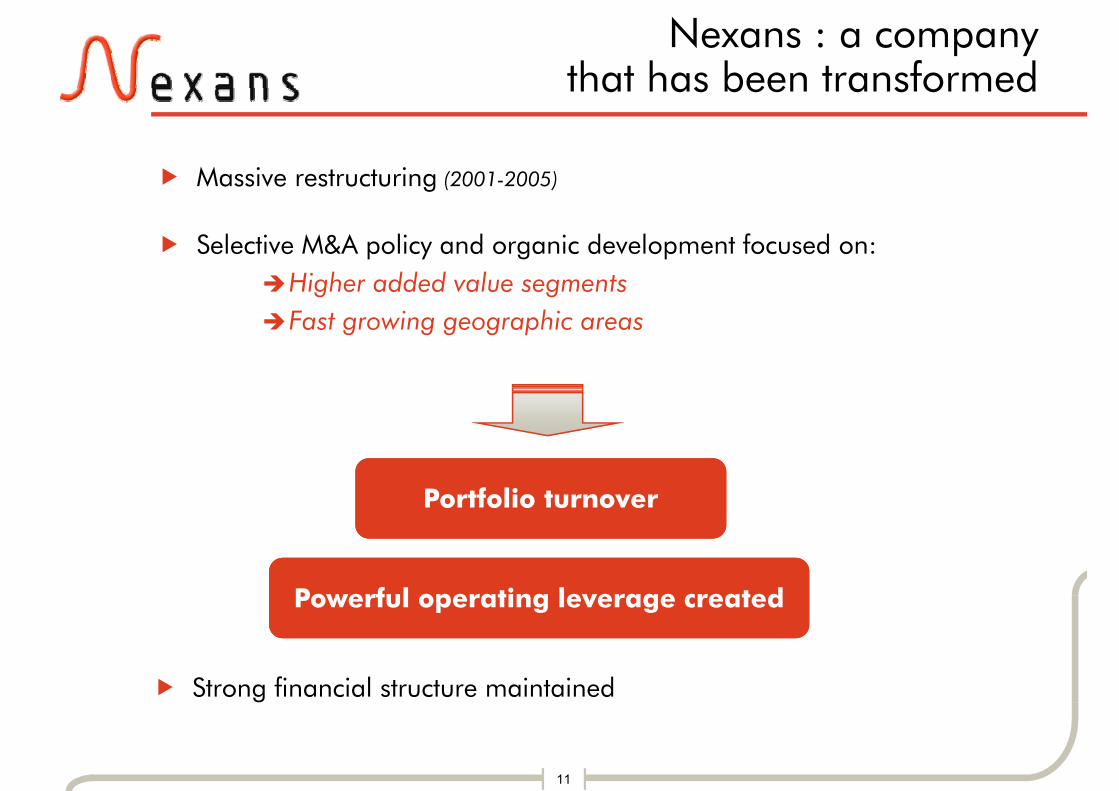
Nexans : a company that has been transformedthat has been transformed
Massive restructuring (2001 2005)Massive restructuring (2001-2005)
Selective M&A policy and organic development focused on:Higher added value segmentsFast growing geographic areas
Portfolio turnoverPortfolio turnover
Powerful operating leverage createdPowerful operating leverage created
Strong financial structure maintained
11

Geographic & business mix re-orientationDivestituresDivestitures
Distribution NorwayJune 2005Winding Wires USA
TianjinJuly 2007
August 2004
SimcoeApril 2007
Winding Wires EuropeFebruary 2005 February 2005 January 2007
AgroMay 2002
Distribution SwitzerlandFebruary 2006
Telecom CopperSantander
12
590 M€ yearly sales OUT590 M€ yearly sales OUTFebruary 2008Santander
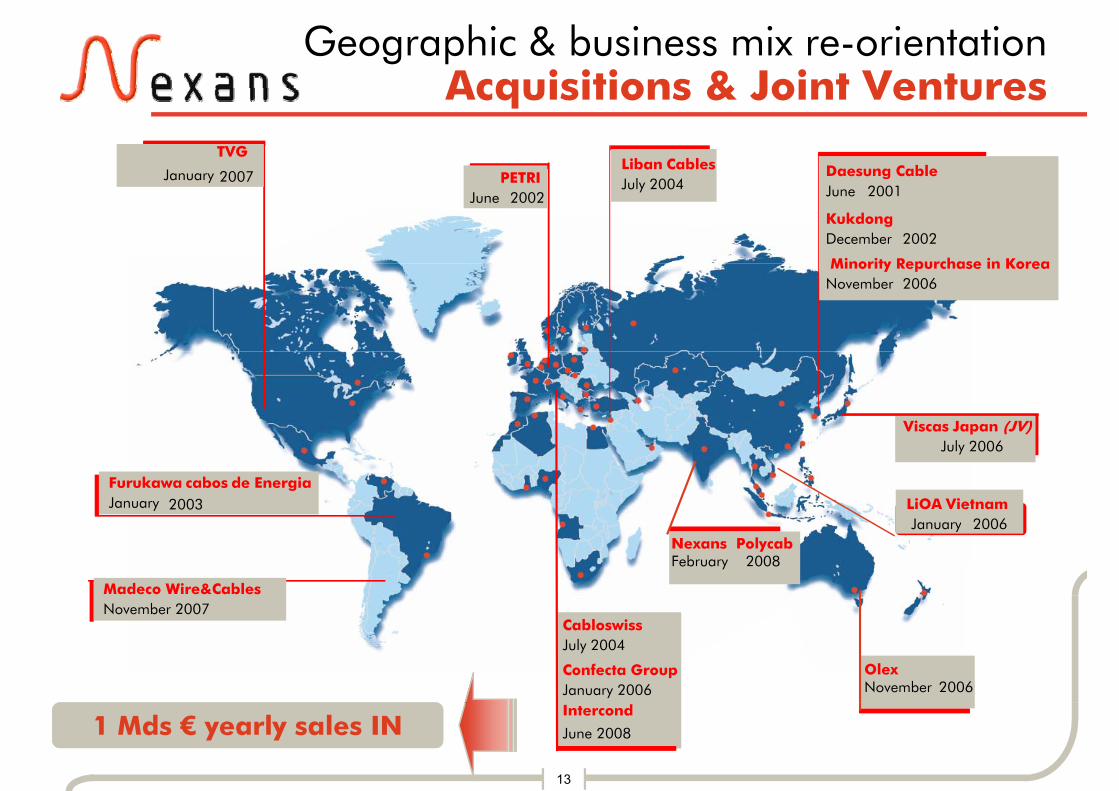
Geographic & business mix re-orientationAcquisitions & Joint VenturesAcquisitions & Joint Ventures
Liban CablesPETRI Daesung Cable2007
TVG
JanuaryJuly 2004PETRI
June 2002
Minority Repurchase in Korea
KukdongDecember 2002
Daesung CableJune 2001
2007January
Minority Repurchase in Korea November 2006
Viscas Japan (JV)
LiOA VietnamJanuary 2006
July 2006
Furukawa de EnergiaJanuary
cabos2003
January 2006Nexans PolycabFebruary 2008
Madeco Wire&CablesNovember 2007
OlexNovember 2006
Confecta GroupJanuary 2006
CabloswissJuly 2004
13
1 Mds € yearly sales IN1 Mds € yearly sales IN June 2008
Intercond

Higher exposure to specialty products
2,328
1,7301,932In M€
•Naval Shipboard•Automotive•Robotics•N l
OEMs
430327386
476BUILDING
•LAN•S f t
+ 18 %
+ 9 %
+ 23 % •Nuclear•Handling
Specialty Product
of which 430327393362
•Safety•Heating cables
+ 9 %
•High Voltage•U bili l
INFRASTRUCTURE+ 22 %
+ 9 %
Priority segments:893661 734+ 11 %
•Umbilicals•Energy accessories•Railway•xDSL•FTTx•Windmill
Priority segments:
Specialty products in Sales : 41 % 43 % 48 %
2005 2006 2007
Development plan in place for each priority segment
Constant monitoring through Country organization
in Sales :
14
Co s a o o g oug Cou y o ga a o
Primary target of M&A operations

Higher exposure to fast growing areas
Sales from high growth areas (*)Sales from high growth areas ( )at constant metal price (M€)
1 280X 6 in 5 years
860
+ 49 %X 6 in 5 years
• 30% through internal growth
• 70% through acquisitions
522
+ 65 %
+ 140 %
86070% through acquisitions
in M€
218
+ 140 %in M€
2006Pro-forma with Olex
2002 2005 2007Pro-forma with Madeco (**)
% of totalSales :
12 % 18 % 25 %5 %
15
(*) Including China, Vietnam, South Korea, Middle-East, Morocco, Australasia and Latin America(**) based on estimated 2007 Sales for Madeco, 1 € = 1.35 USD

Strong financial structure protectedg p
J 30 08D 31 07 June 30, 08Dec. 31, 07(in Million €)
Long term fixed assets 1,192 1,209of which goodwill 192 201gDeferred tax assets 48 45Non-current assets 1,240 1,254Working capital 1,222 1,556g p , ,Assets (net) held for sale 105 1
Total to finance 2,567 2,811
Net financial debt 290 457reserves 434 448Deferred tax liabilities 85 105Shareholder’s equity and Minority interests 1,758 1,801
Total financing 2,567 2,811
Gearing 25 %Leverage (Net debt / 12m EBITDA) = 0 8 x
Gearing 25 %Leverage (Net debt / 12m EBITDA) = 0 8 x
16
Leverage (Net debt / 12m EBITDA) = 0.8 xLeverage (Net debt / 12m EBITDA) = 0.8 x

AGENDA
I.I. Nexans in the Cable IndustryNexans in the Cable Industry
II.II. Financial performanceFinancial performance
III.III. Strategy & MT TargetsStrategy & MT Targets

Our medium term objectivesj
A Nexans group:
More Profitable
Less Cyclical
More Streamlined
With more Synergies between businessesWith more Synergies between businesses
18
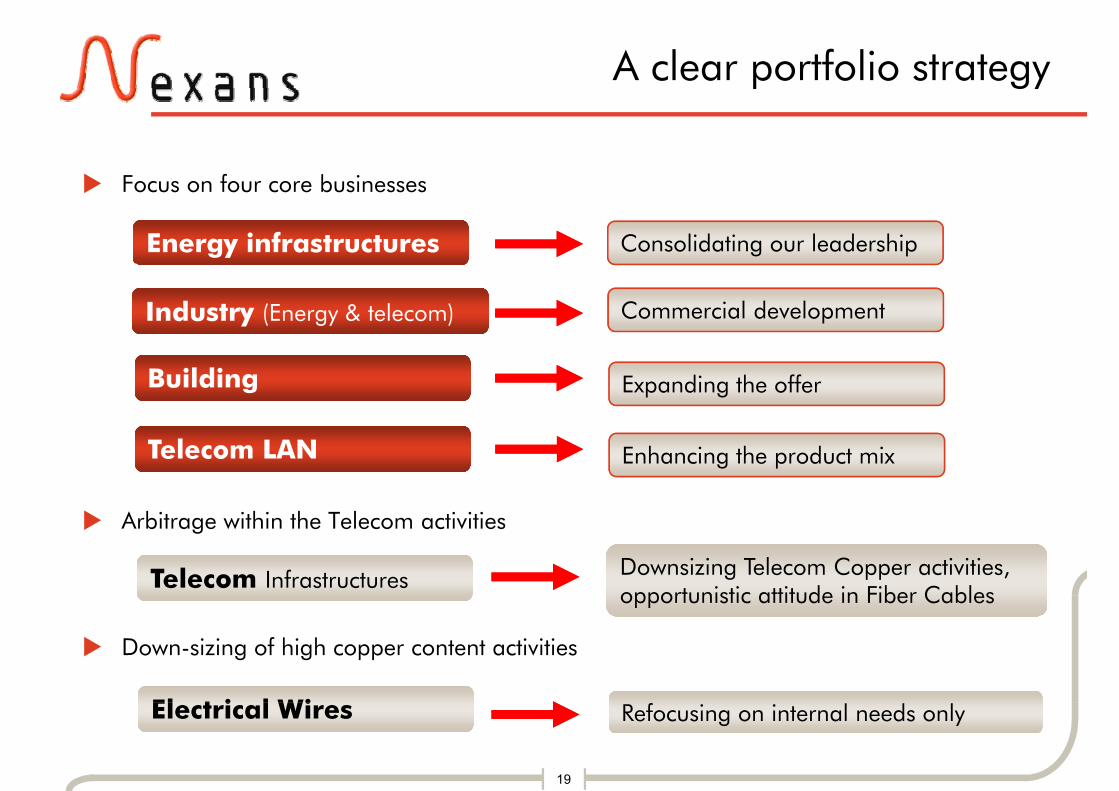
A clear portfolio strategy
F f b i
p gy
Focus on four core businesses
Energy infrastructuresEnergy infrastructures Consolidating our leadershipConsolidating our leadership
Industry (Energy & telecom)Industry (Energy & telecom) Commercial developmentCommercial development
BuildingBuilding Expanding the offerExpanding the offer
l l
Arbitrage within the Telecom activities
Telecom LANTelecom LAN Enhancing the product mixEnhancing the product mix
Arbitrage within the Telecom activities
Telecom InfrastructuresTelecom Infrastructures Downsizing Telecom Copper activities, opportunistic attitude in Fiber CablesDownsizing Telecom Copper activities, opportunistic attitude in Fiber Cables
Down-sizing of high copper content activities
El t i l WiEl t i l Wi
19
Electrical WiresElectrical Wires Refocusing on internal needs onlyRefocusing on internal needs only

Energy infrastructure: greater visibility and improved profitabilityvisibility and improved profitability
Marked increase in order b kl
Solid fundamentalsbacklog
Position of co-leader in the world
Powerful growth drivers :2 years' businessin High Voltage 1 year
2004
Network renovationNew energy sourcesEmerging economies 2007
g gand Umbilical
1 year
Increasing weight of HighAppropriate resources
Emerging economies
g g gVoltage(12 % of Sales in 2007)
Capacity X 2 in two yearsfor HV submarine+ 45%~ 570 M€
I 2008
Submarine & umbilical
~ 390 M€
In 2008 :
- Sustained growth
- Increasing contribution to Group
umbilical
Underground
Aerial
20
Increasing contribution to Group profits2005 2006 2007

Industry: High potential for growth and profitabilityfor growth and profitability
Appropriate resources Backed by growth sectors
Oil & Gas :2007/2011 Capex of this industry increased by 25% vs 2002/2006 period
New sales organization for global marketsMulti-site offering structure by 25% vs 2002/2006 period
Shipyards : order backlog X 3in 5 years (Hyundai, Mitsubishi ...)
Multi site offering structureCapacity freed up by re-examining customer and product portfolios
1,005
805
in M€ + 42%Other Transportation :
Alstom : order backlog entries doubled in 2007
Petrochemicals & nuclear
706805 2007
Airbus 5 years' order backlog
Mining Industries
In 2007 : Profitability up sharplyHarnesses
O h
Transportation
In 2008 :
- Continued growth- Potential for higher marginsOP i t
Other industries
3 % 5 6 % 8 7 %
2005(*) 2006(*) 2007
21
Potential for higher marginsOP margin rate 3 % 5.6 % 8.7 %
(*) Restated for segmentation changes made in 2007

Building: strength of Nexans business modelNexans business model2002/2007 : a different business model
A balanced product mix
Residential
Industrial & Commercial
Building~65%
~35%
business model
Significant changes:
• D l t f d t tf li
residential US very limited : 30 M€/year
Construction ~35% • Development of product portfolios
• Geographic redistribution
• Industrial restructuring (Nexans = balanced breakdown in Europe
(Maintenance & renovation = 43 % of the market)
A geographical balance
g (26 M€ over 4 years)
A geographical balance
In % of Sales (*)
France Benelux 35 %In 2008 :
- Pressure on margins (observed in N th A i d lik l i E )
France - Benelux 35 %
Scandinavia 9 %
Other Europe 24 %North America and likely in Europe)
- Business model holding upNorth America 15 %
Asia-Pacific 7 %
Emerging economies 10 %
22
(*) at constant metal prices
Emerging economies 10 %

Telecom: clarified positioningp g
LANLAN
Systems offering under developmentConfirmed in
“Core B siness” acti itConfirmed in
“Core B siness” acti ity g pProgression of 10 Gigabit
“Core Business” activity“Core Business” activity
Fiber Optic
Growth opportunitiesGrowth opportunitiesRollout in progress in EuropeTechnology and service offeringPotential partnerships
Telecom copper Infrastructurepp
Lack of critical size Divestiture of Santander plant completed in May 2008
Divestiture of Santander plant completed in May 2008
23

Electrical Wires: ongoing down-sizingg g g
F t d i iFaster down-sizing
37 % reduction
Weight in Nexans Sales (*)
18 %in external sales in 2007
Improved margins(prices and costs control)
10 % of Sales18 %
(prices and costs control)
20072006
Optimized capital employed
Capital employed reduced to
Reduction program stepped up:
Reduction program stepped up:
p p y~180 M€ at December end 2007 Objective: minimal
external sales in 2009Objective: minimal
external sales in 2009
24(*) at constant metal prices

2009 objectives
Operating marginunder favourable
8,5%
~10% under favourable economic environment
4,4%5,8% ~ 7% under depressed
economic environment
2006 2007 200920082005
New targets including announced M&A operations
Achieved results
Free Cash Flow excluding metal impacts (*)
Organic growth of Cable activities
Achieved results
+8,2%
+12,1%+6%
/year
Sales
+ 33
+ 275
(74)
2005
2006 2007
+ 33
25
2005 2006 2007 20092008 (*) Free Cash Flow excl. metal = Cash from operations + ▲ WCR at constant metal – Capex - Dividends

Q3 ‘08 trading update :Sustained growth in cable activities Sustained growth in cable activities
7.4 % organic growth of cable activities (*) Sales (**)
by destination
Electrical Wires down-sizingAsia Pacific
North America
at Sept.’08 end
In M€
Sales at constant metal prices Rest of World
18%
17%
13%
1,166 1,165FX
Consolidation
Cable activities
(34)
52%
scope(10)
(34)75
Electrical Wires
(32)Europe
+ 7.4 %
26
(*) Excluding Electrical Wires
Q3 ’07 Q3 ‘08(**) at current metal prices

Outlook for 2008
A i ti ti f fi t h lf 2008 i t dAssuming continuation of first-half 2008 economic trends
Above 6 % organic growth in cable activities for the year
Increase of operating margin compared to 2007
Net debt between 500 M€ and 600 M€ after acquisitions financing (Intercond et Madeco) and including the cancellation financing (Intercond et Madeco) and including the cancellation of the harnesses divestiture
27
•Appendices
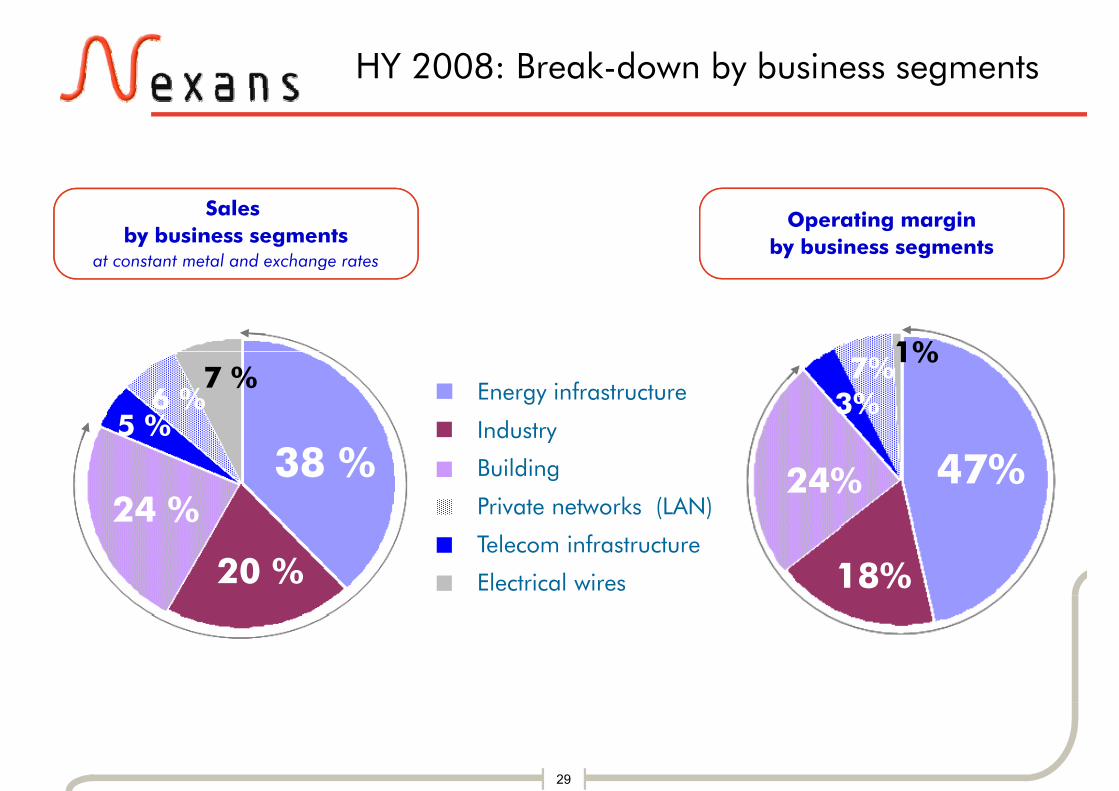
HY 2008: Break-down by business segments
Sales by business segments
at constant metal and exchange rates
Operating marginby business segments
at constant metal and exchange rates
1%
Industry
Energy infrastructure
5 %6 %
7 %3%7%1%
Building
y
Private networks (LAN)
38 %24 %
47%24%
Telecom infrastructure
Electrical wires20 % 18%
29

Sales & Operating margin by business
In M€ HY 2007 HY 2008
p g g y
In M€ HY 2007
Sales* OM
HY 2008
% Sales* OM %
Energy infrastructure 784 56 7.2 % 919 106 11.4 %
Industry 510 39 7.7 % 482 41 8.6 %
B ildi 589 65 10 9 % 571 55 9 7 % Building 589 65 10.9 % 571 55 9.7 %
Private network (LAN) 147 18 12.3 % 149 15 10.4 %
T l I f t t 129 9 7 1 % 118 8 6 8 % Telecom Infrastructure 129 9 7.1 % 118 8 6.8 %
Other 5 (4) - 5 (7) -
Total Cable 2 164 183 8 4 % 2 244 218 9 7 %Total Cable 2,164 183 8.4 % 2,244 218 9.7 %
Electrical Wires 287 4 1.4 % 175 2 1.1 %
Total Group 2,451 187 7.6 % 2,419 220 9.1 %
30
* Sales at constant metal prices

Very high growth in Energy networksEnergy networks
Organic growth of
Sustained
Organic growth of Cable activities 2007 Q1 Q2 HY ’08 Q3
Sustained Energy
infrastructureactivity
Energy infrastructure 10.2% 16.4 % 22.6 % 19.7 % 22.7 %
Industry 17.5 % 3.8 % 6.1 % 4.8 % - 2.3 %
Growth in
Industry 17.5 % 3.8 % 6.1 % 4.8 % 2.3 %
Building 10.4 % -0.7 % -7.7 % -4.2 % -3.5 %priority industry
segmentsPrivate networks (LAN) 13.9 % 2,5 % 3.4 % 3.2 % 2.7 %
Slow downin Building
increased by
Telecom infrastructure 9.9 % -8.5 % 3.5 % -2.2 % 1.5 %
increased by base effectTotal Cable 12.1 % 6.4 % 7.8 % 7.2 % 7.4 %
Electrical Wires - 32.8 % - 36.1 % -30.3 %
31

Higher profitability in two of our main core businessesin two of our main core businesses
Operating margin rate HY '07 HY '08Operating margin rate HY 07 HY 08
Energy Infrastructure 7.2 % 11.4 % Energy i f
Industry 7.7 % 8.6 %
infrastructure accelerating
Building 10.9 % 9.7 %
k ( AN)
Consolidationof industry
iPrivate networks (LAN) 12.3 % 10.4 %
Telecom infrastructure 7.1 % 6.8 %
margins
Total Cable 8.4 % 9.7 %
Building margins
holding up
Electrical Wires 1.4 % 1.1 %
Total Group 7.6 % 9.1 %
32
p
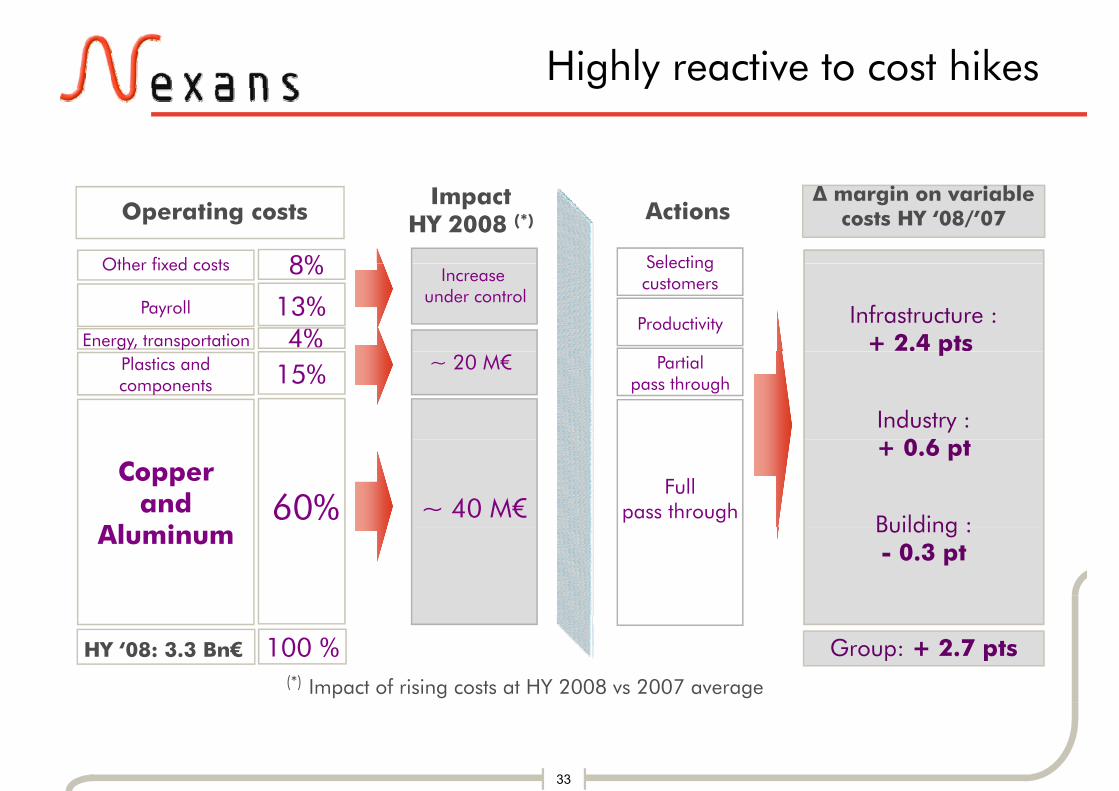
Highly reactive to cost hikesg y
Operating costsImpact
HY 2008 (*) Actions
8% SelectingOther fixed costs
∆ margin on variable costs HY ‘08/’07
4%13%
8% Increase under control
Productivity
Selectingcustomers
Other fixed costs
Payroll
Energy, transportationInfrastructure :
+ 2.4 pts ~ 20 M€ Partial
pass throughPlastics and components 15%
p
Industry : 0 6
60% ~ 40 M€Full
pass through
Copperand
Al i
+ 0.6 pt
Building :Aluminum Building :- 0.3 pt
(*) Impact of rising costs at HY 2008 vs 2007 average
HY ‘08: 3.3 Bn€ Group: + 2.7 pts100 %
33

Strong operating leverage maintained
Excluding Electrical Wires
g p g g
(in Million €) June 07 June 08Sales cable activities, at current metal prices 2,937 3,029
l bl 6Sales cable activities, at constant metal prices 2,163 80 2,243
Margin on variable costs 687 751
Margin on variable costs (%) 31.8 % 33.5 %
Indirect costs (*) (453) (481)
EBITDA (**) 234 270
EBITDA margin (%) 10.8 % 12 %
Depreciation (51) (52)
Operating margin cable activities 183 35 218
44 %
p g g
Operating margin rate (on Sales at constant metal prices) 8.4% 9.7%
34
(*) Includes factory indirect costs excluding Depreciation + R&D + SG&A
(**) Operating margin before depreciation
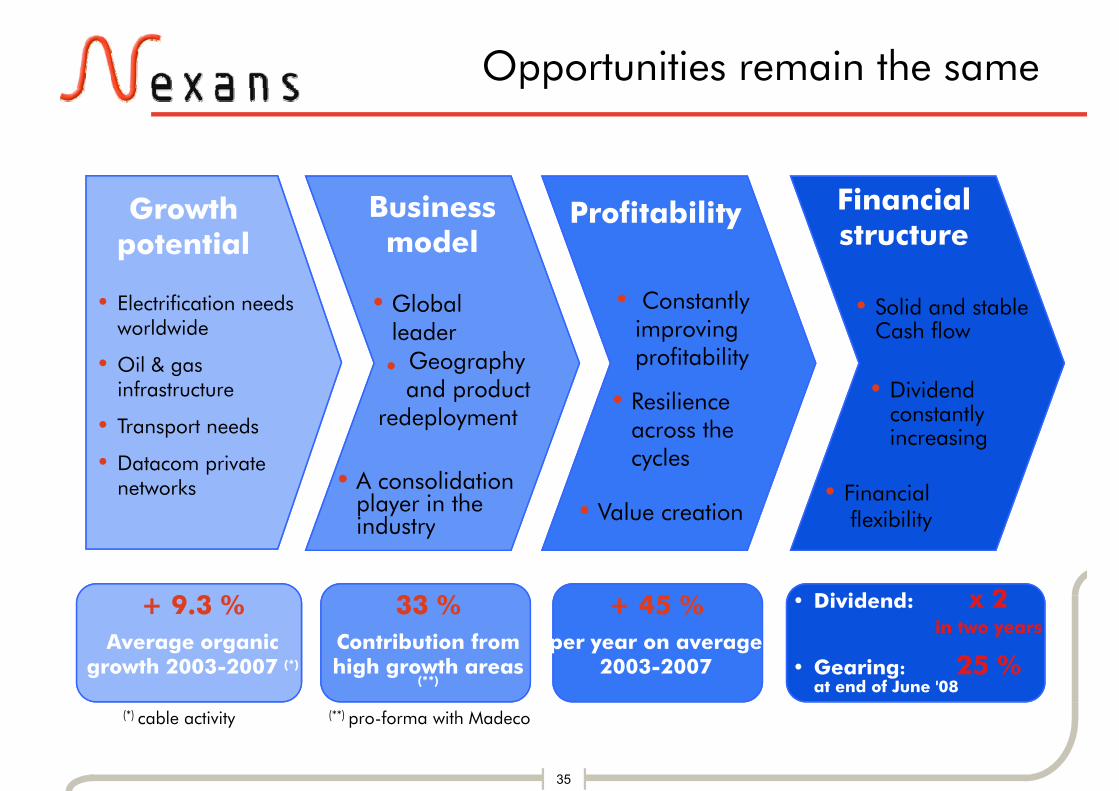
Opportunities remain the samepp
Growth potential
Business model
Profitability Financial structure
• Electrification needs worldwide
• Global leader
• Constantly improving
fit bilit
• Solid and stable Cash flow
h• Oil & gas infrastructure
• Transport needs
• profitability
• Resilience across the
• Dividend constantly increasing
Geographyand product
redeployment
• Datacom private networks • A consolidation
player in the industry
cycles
• Value creation
increasing
• Financialflexibilityindustry e b y
• Dividend: x 2+ 9.3 % 33 % + 45 %in two years
• Gearing: 25 % at end of June '08
Average organicgrowth 2003-2007 (*)
Contribution from high growth areas
(**)
per year on average 2003-2007
35
(**) pro-forma with Madeco(*) cable activity
