news release shaw announces strong fourth quarter and full year
TRANSCRIPT
NEWS RELEASE
Shaw announces strong fourth quarter and full year results
and provides 2009 preliminary guidance
Calgary, Alberta (October 23, 2008) – Shaw Communications Inc. today announced results for the fourth quarter and fiscal year ended August 31, 2008. Consolidated service revenue for the three and twelve month periods of $806 million and $3.10 billion, respectively, improved 13% and 12% over the same periods last year. Total service operating income before amortization1 of $370 million and $1.41 billion was up 13% and 14%, respectively, over the comparable periods. Funds flow from operations2 increased to $321 million and $1.22 billion for the quarter and year, respectively, compared to $273 million and $1.03 billion in the same periods last year. During the quarter Basic cable subscribers increased 4,122 to 2,248,120, Digital and Internet customers grew by 23,020 to 906,320 and 24,785 to 1,565,962, respectively, and Digital Phone lines grew by 61,999 to 611,931. DTH customers increased 1,736 to 892,528. Free cash flow1 for the quarter was $143 million bringing the twelve month total to $453 million compared to $76 million and $356 million, respectively, for the same periods last year. These improvements in free cash flow were mainly achieved through higher service operating income before amortization and for the annual period after taking into account over $85 million of increased capital investment. Chief Executive Officer and Vice Chairman Jim Shaw commented “Shaw continues to compete and win in a change driven, highly competitive environment. Throughout fiscal 2008 we delivered solid subscriber growth in all products. Digital Phone had record customer gains almost every quarter and we now have over 600,000 Digital Phone lines. We continue to maintain one of the strongest broadband businesses in North America with 70% penetration of basic customers. Digital TV had a record year adding over 140,000 customers which represents an increase of over 55% compared to last year. We compete and win by offering customers a choice and delivering the innovative products and services they want on a value priced basis.” He continued: “We delivered strong financial results and improved our financial metrics, including our industry leading operating margin. Annual consolidated revenues were up 12% and consolidated service operating income increased almost 14%. Growth in free cash flow of approximately $100 million to $453 million was achieved in conjunction with continued significant capital investment required to facilitate growth and maintain a leading network capable of providing the next generation of services. We make prudent investments to meet our current and longer term strategic goals while preserving our ability to return cash to our shareholders. Dividends paid to shareholders in fiscal 2008 increased 52% to over $300 million and we repurchased $100 million of shares. Looking back, fiscal 2008 was a year of impressive accomplishments.”

2
Net income of $132 million or $0.31 per share for the quarter ended August 31, 2008 compared to $136 million or $0.31 per share for the same quarter last year. Net income for the annual period was $672 million or $1.56 per share compared to $388 million and $0.90 per share last year. The current and comparable three and twelve month periods included non-operating items which are more fully detailed in Management’s Discussions and Analysis (MD&A). These included tax recoveries primarily related to reductions in enacted income tax rates in the current and comparable year of approximately $199 million and $35 million, respectively. Excluding the non-operating items, net income for the current three and twelve month periods would have been $133 million and $460 million compared to $100 million and $346 million, respectively, in the same periods last year. 3 Service revenue in the Cable division was up 14% for each of the three and twelve month periods to $620 million and $2.38 billion. The improvement was primarily driven by customer growth and rate increases. Service operating income before amortization improved 13% to $302 million for the quarter and was up almost 16% on a year-to-date basis to $1.15 billion. Service revenue in the Satellite division was $185 million and $729 million for the three and twelve month periods, up 7% and 5%, respectively, over the comparable periods last year. The improvement was primarily due to rate increases and customer growth. Service operating income before amortization for the quarter and year were up 13% and 5%, respectively, to $67 million and $255 million. During the quarter the Canadian Advanced Wireless Spectrum (“AWS”) auction concluded and Shaw was successful in acquiring 20 megahertz of spectrum across most of its cable footprint for a cost of $190 million. Mr. Shaw stated, “We continue to review our wireless strategy and believe our entry in this new market should be measured and prudent in light of the developing competitive wireless market dynamics. As a result, we do not currently anticipate making material investments in wireless during 2009.” Mr. Shaw continued: “Looking forward, we expect continued growth in fiscal 2009. Our preliminary view calls for service operating income before amortization in the Cable division to increase approximately 10% and we anticipate modest growth in the Satellite division. We plan to invest in capital expenditures to address business growth and drive continued improvements in competitiveness. We expect to generate free cash flow of at least $500 million and will manage the business to ensure we have flexibility to respond strategically to market conditions and opportunities.” On June 27, 2008 the Board of Directors approved an 11% increase in the equivalent annual dividend rate to $0.80 on Shaw’s Class B Non-Voting Participating shares and $0.7975 on Shaw’s Class A Participating shares. This new rate was effective commencing with the monthly dividend paid on September 29, 2008. In closing, Mr. Shaw commented “The accomplishments of Shaw’s management and staff this past year result from the dedication and commitment of our entire team. Shaw is financially and operationally strong and is never satisfied with the status quo. We will continue to employ creative and innovative strategies to successfully meet the competitive challenges that lie ahead in fiscal 2009.”

3
Shaw Communications Inc. is a diversified communications company whose core business is providing broadband cable television, High-Speed Internet, Digital Phone, telecommunications services (through Shaw Business Solutions) and satellite direct-to-home services (through Star Choice). The Company serves 3.4 million customers, including over 1.5 million Internet and 610,000 residential Digital Phone customers, through a reliable and extensive network, which comprises 625,000 kilometres of fibre. Shaw is traded on the Toronto and New York stock exchanges and is included in the S&P/TSX 60 Index (Symbol: TSX – SJR.B, NYSE – SJR). The accompanying Management’s Discussion and Analysis forms part of this news release and the “Caution Concerning Forward Looking Statements” applies to all forward-looking statements made in this news release. For more information, please contact: Shaw Investor Relations [email protected] ____________________ 1 See definitions and discussion under Key Performance Drivers in MD&A. 2 Funds flow from operations is before changes in non-cash working capital balances related to operations as presented
in the unaudited interim Consolidated Statements of Cash Flows. 3 See reconciliation of Net Income in Consolidated Overview in MD&A

Shaw Communications Inc.
4
MANAGEMENT’S DISCUSSION AND ANALYSIS AUGUST 31, 2008
October 15, 2008 Certain statements in this report may constitute forward-looking statements. Included herein is a “Caution Concerning Forward-Looking Statements” section which should be read in conjunction with this report. The following should also be read in conjunction with Management’s Discussion and Analysis included in the Company’s August 31, 2007 Annual Report and the Consolidated Financial Statements and the Notes thereto and the unaudited interim Consolidated Financial Statements and the Notes thereto of the current quarter.
CONSOLIDATED RESULTS OF OPERATIONS FOURTH QUARTER ENDING AUGUST 31, 2008
Selected Financial Highlights
Three months ended August 31, Year ended August 31, Change Change 2008 2007 % 2008 2007 % ($000’s Cdn except per share amounts) Operations: Service revenue 805,700 715,471 12.6 3,104,859 2,774,445 11.9 Service operating income before amortization (1) 369,527 326,052 13.3 1,408,236 1,239,625 13.6
Operating margin (1) 45.9% 45.6% 45.4% 44.7% Funds flow from operations (2) 321,276 272,545 17.9 1,222,895 1,028,363 18.9 Net income 132,378 135,932 (2.6) 671,562 388,479 72.9 Per share data: Earnings per share – basic $0.31 $0.31 $1.56 $0.90 – diluted $0.31 $0.31 $1.55 $0.89 Weighted average participating shares outstanding during period (000’s)
429,694 433,864
431,070 432,493
(1) See definition under Key Performance Drivers in Management’s Discussion and Analysis. (2) Funds flow from operations is before changes in non-cash working capital balances related to operations as presented in the
unaudited interim Consolidated Statements of Cash Flows.
Subscriber Highlights
Growth Total Three months ended August 31, Year ended August 31, August 31, 2008 2008 2007 2008 2007 Subscriber statistics: Basic cable customers 2,248,120 4,122 (2,057) 21,279 20,521 Digital customers 906,320 23,020 15,709 143,180 90,556 Internet customers (including pending installs) 1,565,962 24,785 29,857 114,206 134,301 DTH customers 892,528 1,736 1,686 12,943 10,377 Digital phone lines (including pending installs) 611,931 61,999 41,604 226,574 172,650

Shaw Communications Inc.
5
Additional Highlights • Consolidated service revenue of $805.7 million and $3.10 billion for the quarter and annual
periods, respectively, improved 12.6% and 11.9% over the comparable periods last year. Total service operating income before amortization of $369.5 million and $1.41 billion increased by 13.3% and 13.6% respectively over the same periods.
• During the quarter Basic cable subscribers increased 4,122 to 2,248,120, Digital and Internet
customers grew by 23,020 to 906,320 and 24,785 to 1,565,962, respectively, and Digital Phone lines grew by 61,999 to 611,931. DTH customers increased 1,736 to 892,528.
• Internet and Digital penetration of Basic cable subscribers currently stands at 70% and 40%,
respectively, up from 65% and 34% at August 31, 2007. Digital Phone penetration of Basic customers who have the service available to them is 31% compared to 22% at August 31, 2007.
• Consolidated free cash flow1 for the quarter was $143.3 million bringing the annual total to
$452.6 million compared to $76.1 million and $356.2 million, respectively, for the same periods last year.
• Shaw was successful in acquiring 20 megahertz of spectrum across most of its cable
operating footprint in the recent AWS auction for a cost of approximately $190.0 million. • During the quarter the Board of Directors approved an 11% increase in the equivalent annual
dividend rate to $0.80 on Shaw’s Class B Non-Voting Participating shares and $0.7975 on Shaw’s Class A Participating shares. This new rate was effective commencing with the monthly dividend paid on September 29, 2008. Total cash dividends paid per Class B Non-Voting Participating Share has increased each fiscal year as follows:
Total Annual Dividend Annual % Increase
2003 $0.025 - 2004 $0.080 220% 2005 $0.155 94% 2006 $0.238 55% 2007 $0.465 95% 2008 $0.705 52% 2009(1) $0.800 13%
(1) Expected cash dividend payment for fiscal 2009 is $0.80 based on the assumption that the Company’s Board of Directors will continue to approve monthly dividends in future periods consistent with those currently approved.
• Shaw repurchased 3,175,500 of its Class B Non-Voting Shares for cancellation during the
quarter for $67.7 million and on an annual basis repurchased 4,898,300 shares for $99.8 million. The Company plans to renew its normal course issuer bid in early November.
____________________
1 See definitions and discussion under Key Performance Drivers in Management’s Discussion and Analysis.

Shaw Communications Inc.
6
Consolidated Overview Consolidated service revenue of $805.7 million and $3.10 billion for the quarter and year, respectively, improved by 12.6% and 11.9% over the same periods last year. The improvement was primarily due to customer growth and rate increases. Consolidated service operating income before amortization for the three and twelve month periods improved 13.3% and 13.6%, respectively, over the comparable periods to $369.5 million and $1.41 billion. The increase was driven by the revenue improvements partially offset by higher employee and other costs related to growth. Net income was $132.4 million and $671.6 million for the quarter and year, respectively, compared to $135.9 million and $388.5 million for the same periods last year. Non-operating items affected net income in all periods including tax recoveries primarily related to reductions in enacted income tax rates in the current annual period and the comparable quarter and annual period. The current twelve month period also included a net duty recovery related to satellite importations of $22.3 million. Outlined below are further details on these and other operating and non-operating components of net income for each quarter.
Year ended Year ended
($000’s Cdn) August 31, 2008 Operating net
of interest Non-
operating August 31, 2007 Operating net
of interest Non-
operating Operating income 903,103 766,510
Amortization of financing costs – long-term debt (3,627) -
Interest expense - debt (230,588) (245,043) Operating income after interest 668,888 668,888 - 521,467 521,467 - Gain on sale of investment - - - 415 - 415 Debt retirement costs (5,264) - (5,264) - - - Other gains 24,009 - 24,009 9,105 - 9,105 Income before income taxes 687,633 668,888 18,745 530,987 521,467 9,520 Income tax expense (recovery) 16,366 209,108 (192,742) 142,871 175,488 (32,617) Income before the following 671,267 459,780 211,487 388,116 345,979 42,137 Equity income on investee 295 - 295 363 - 363 Net income 671,562 459,780 211,782 388,479 345,979 42,500
Three months ended Three months ended
($000’s Cdn) August 31, 2008 Operating net
of interest Non-
operating August 31, 2007 Operating net
of interest Non-
operating Operating income 241,838 205,479
Amortization of financing costs – long-term debt (882) -
Interest expense - debt (56,563) (60,387) Operating income after interest 184,393 184,393 - 145,092 145,092 - Other gains (losses) (1,742) - (1,742) 580 - 580 Income before income taxes 182,651 184,393 (1,742) 145,672 145,092 580 Income tax expense (recovery) 50,574 51,149 (575) 9,997 45,299 (35,302) Income before the following 132,077 133,244 (1,167) 135,675 99,793 35,882 Equity income on investee 301 - 301 257 - 257 Net income 132,378 133,244 (866) 135,932 99,793 36,139
Shaw Communications Inc.
7
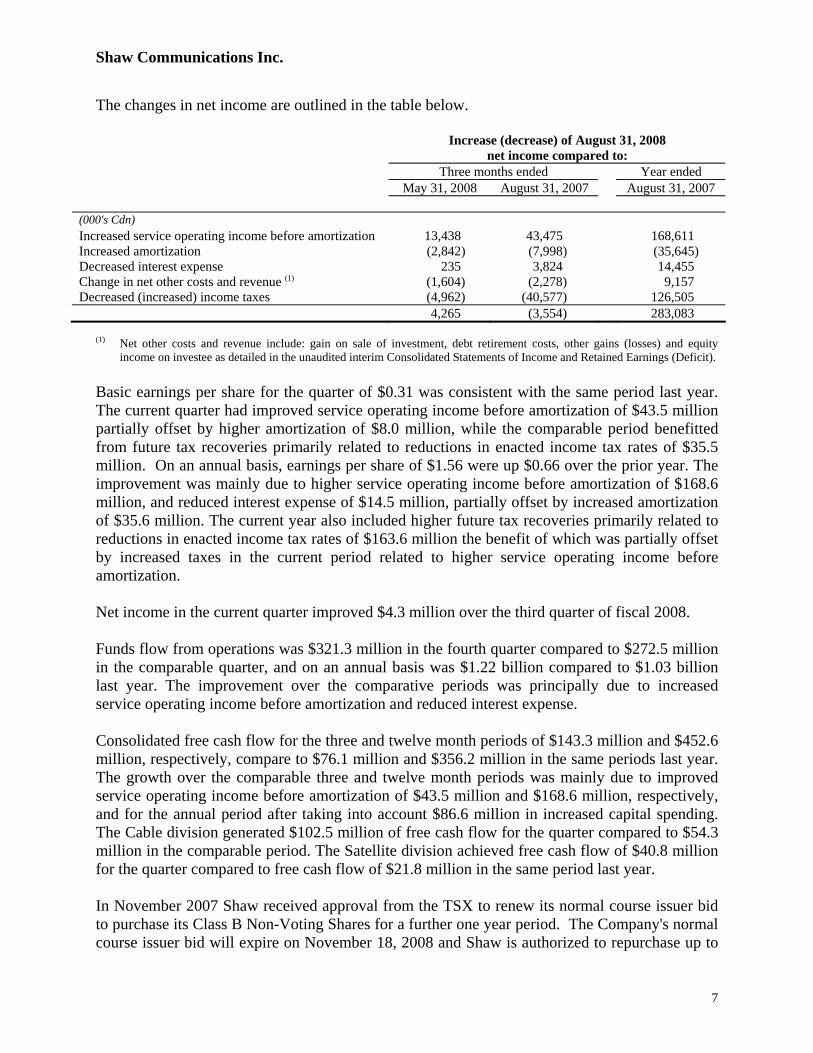
The changes in net income are outlined in the table below.
Increase (decrease) of August 31, 2008 net income compared to:
Three months ended Year ended May 31, 2008 August 31, 2007 August 31, 2007 (000's Cdn) Increased service operating income before amortization 13,438 43,475 168,611 Increased amortization (2,842) (7,998) (35,645) Decreased interest expense 235 3,824 14,455 Change in net other costs and revenue (1) (1,604) (2,278) 9,157 Decreased (increased) income taxes (4,962) (40,577) 126,505 4,265 (3,554) 283,083
(1) Net other costs and revenue include: gain on sale of investment, debt retirement costs, other gains (losses) and equity
income on investee as detailed in the unaudited interim Consolidated Statements of Income and Retained Earnings (Deficit). Basic earnings per share for the quarter of $0.31 was consistent with the same period last year. The current quarter had improved service operating income before amortization of $43.5 million partially offset by higher amortization of $8.0 million, while the comparable period benefitted from future tax recoveries primarily related to reductions in enacted income tax rates of $35.5 million. On an annual basis, earnings per share of $1.56 were up $0.66 over the prior year. The improvement was mainly due to higher service operating income before amortization of $168.6 million, and reduced interest expense of $14.5 million, partially offset by increased amortization of $35.6 million. The current year also included higher future tax recoveries primarily related to reductions in enacted income tax rates of $163.6 million the benefit of which was partially offset by increased taxes in the current period related to higher service operating income before amortization. Net income in the current quarter improved $4.3 million over the third quarter of fiscal 2008. Funds flow from operations was $321.3 million in the fourth quarter compared to $272.5 million in the comparable quarter, and on an annual basis was $1.22 billion compared to $1.03 billion last year. The improvement over the comparative periods was principally due to increased service operating income before amortization and reduced interest expense. Consolidated free cash flow for the three and twelve month periods of $143.3 million and $452.6 million, respectively, compare to $76.1 million and $356.2 million in the same periods last year. The growth over the comparable three and twelve month periods was mainly due to improved service operating income before amortization of $43.5 million and $168.6 million, respectively, and for the annual period after taking into account $86.6 million in increased capital spending. The Cable division generated $102.5 million of free cash flow for the quarter compared to $54.3 million in the comparable period. The Satellite division achieved free cash flow of $40.8 million for the quarter compared to free cash flow of $21.8 million in the same period last year. In November 2007 Shaw received approval from the TSX to renew its normal course issuer bid to purchase its Class B Non-Voting Shares for a further one year period. The Company's normal course issuer bid will expire on November 18, 2008 and Shaw is authorized to repurchase up to

Shaw Communications Inc.
8
35,600,000 Class B Non-Voting Shares. In the twelve months ended August 31, 2008 the Company repurchased 4,898,300 of its Class B Non-Voting Shares for $99.8 million. From August 31, 2008 to October 15, 2008 the Company repurchased an additional 483,000 shares for $10.5 million. Key Performance Drivers The Company’s continuous disclosure documents may provide discussion and analysis of non-GAAP financial measures. These financial measures do not have standard definitions prescribed by Canadian GAAP or US GAAP and therefore may not be comparable to similar measures disclosed by other companies. The Company utilizes these measures in making operating decisions and assessing its performance. Certain investors, analysts and others, utilize these measures in assessing the Company’s operational and financial performance and as an indicator of its ability to service debt and return cash to shareholders. These non-GAAP financial measures have not been presented as an alternative to net income or any other measure of performance required by Canadian or US GAAP. The following contains a listing of non-GAAP financial measures used by the Company and provides a reconciliation to the nearest GAAP measurement or provides a reference to such reconciliation. Service operating income before amortization and operating margin Service operating income before amortization is calculated as service revenue less operating, general and administrative expenses and is presented as a sub-total line item in the Company’s unaudited interim Consolidated Statements of Income and Retained Earnings (Deficit). It is intended to indicate the Company’s ability to service and/or incur debt, and therefore it is calculated before amortization (a non-cash expense) and interest. Service operating income before amortization is also one of the measures used by the investing community to value the business. Operating margin is calculated by dividing service operating income before amortization by service revenue. Free cash flow The Company utilizes this measurement as it measures the Company’s ability to repay debt and return cash to shareholders. Free cash flow for cable and satellite is calculated as service operating income before amortization, less interest, cash taxes paid or payable on net income, capital expenditures (on an accrual basis) and equipment costs (net). Consolidated free cash flow is calculated as follows:
Three months ended August 31, Year ended August 31, 2008 2007 2008 2007 ($000’s Cdn) Cable free cash flow (1) 102,525 54,286 305,338 237,601 Combined satellite free cash flow (1) 40,759 21,783 147,293 118,591 Consolidated 143,284 76,069 452,631 356,192
(1) Reconciliations of free cash flow for both cable and satellite are provided under “Cable – Financial
Highlights” and “Satellite – Financial Highlights”.

Shaw Communications Inc.
9
CABLE FINANCIAL HIGHLIGHTS
Three months ended August 31, Year ended August 31,
2008
2007 Change
%
2008
2007 Change
% ($000’s Cdn) Service revenue (third party) 620,410 542,171 14.4 2,375,586 2,082,652 14.1 Service operating income before amortization (1) 302,166 266,584 13.3 1,153,274 995,694 15.8 Less: Interest expense 49,657 51,056 (2.7) 199,600 205,062 (2.7) Cash flow before the following: 252,509 215,528 17.2 953,674 790,632 20.6 Capital expenditures and equipment costs (net): New housing development 22,786 23,105 (1.4) 93,547 90,016 3.9 Success based 30,185 22,763 32.6 102,735 82,238 24.9 Upgrades and enhancement 67,198 65,041 3.3 271,242 254,786 6.5 Replacement 13,187 14,510 (9.1) 57,575 44,489 29.4 Buildings/other 16,628 35,823 (53.6) 123,237 81,502 51.2 Total as per Note 2 to the unaudited interim Consolidated Financial Statements
149,984
161,242
(7.0)
648,336
553,031
17.2
Free cash flow (1) 102,525 54,286 88.9 305,338 237,601 28.5 Operating margin 48.7% 49.2% (0.5) 48.5% 47.8% 0.7
(1) See definitions and discussion under Key Performance Drivers in Management’s Discussion and Analysis.
Operating Highlights • During the quarter the Company added 61,999 Digital Phone lines and as at August 31, 2008
had 611,931 lines. Digital Phone line penetration stands at over 30% of Basic customers who have the service available to them. The Digital Phone footprint grew in the quarter with launches in Whistler and Squamish, both in British Columbia; as well as continued expansion on Vancouver Island, British Columbia and in Central Alberta.
• Digital customers increased during the quarter by 23,020 to 906,320. Basic cable subscribers
grew by 4,122 to 2,248,120. • During the quarter Shaw added 24,785 Internet customers to total 1,565,962 as at August 31,
2008. Internet penetration of Basic now stands at 69.7% up from 65.2% at August 31, 2007. • Shaw announced the acquisition of the Campbell River cable system in British Columbia
during the quarter. This acquisition is complementary to and will provide synergies with existing operations. The transaction is valued at approximately $46.0 million and is expected to close during the first half of fiscal 2009.
Cable service revenue for the quarter and annual periods of $620.4 million and $2.38 billion, respectively, improved 14.4% and 14.1% over the same periods last year. Customer growth and rate increases accounted for the increase. Service operating income before amortization of $302.2 million and $1.15 billion, respectively, was up 13.3% and 15.8% over the comparable three and twelve month periods. The increases were driven by revenue related growth and Digital Phone margin improvement, partially offset by higher employee related costs and other expenses related to business growth, including equipment maintenance and support.

Shaw Communications Inc.
10
Service revenue was up $12.6 million over the third quarter of fiscal 2008 primarily due to rate increases and customer growth. Service operating income before amortization improved $7.8 million over this same period primarily due to the revenue related growth. The prior quarter included higher expenses for CRTC Part II fees as a result of the Federal Court of Appeal decision on this matter while the current quarter included increased employee related costs and other expenses related to business growth. Total capital investment for the quarter and annual period was $150.0 million and $648.3 million respectively. Quarterly capital investment declined $11.3 million compared to the same period last year. On an annual basis capital investment increased $95.3 million over the comparable period. Investment in Buildings and Other was down $19.2 million compared to the same quarter last year and on an annual basis increased $41.7 million. The decline in the current quarter resulted primarily from higher spending in the same quarter last year upgrading certain corporate assets. On an annual basis the increase was due to investments in various facilities projects to support growth including a purchase of land and buildings, new facilities construction, and building renovations. The land and buildings purchased in the year are located immediately adjacent to other Company owned facilities in Calgary, Alberta. This will allow for the consolidation of various operating groups located in other areas of the city at one campus style location. Success-based capital increased $7.4 million and $20.5 million for the quarter and annual period, respectively, over the same periods last year. Digital success-based capital was up in both periods as a result of reduced customer pricing on certain digital equipment and higher sales volume. Digital Phone success-based capital also increased in both periods due to customer growth. Internet success based capital was up in the current twelve month period mainly due to reduced customer pricing on modems. On an annual basis the Replacement and Upgrades and enhancement categories combined were up $29.5 million over the same period last year. These increased investments continue to expand plant capacity to support customer growth and increasing usage demands. Digital Phone continues to grow rapidly. The Company had a record quarter adding 61,999 Digital Phone lines and since the initial market launch in February 2005 has added over 610,000 lines. Digital Phone is available to over 90% of Basic customers and over 30% of these have taken the service. Shaw offers a variety of tiered phone services appealing to various customer demographics and is now completing approximately 10,000,000 calls daily on its private managed broadband network. Digital growth continues to be driven by the customer demand for HD services as well as a lower priced entry level box introduced earlier this year attracting first time digital customers. In September, the Company expanded the HD offerings to include TSN2 for sports fans and added The Frame, a 24-hour commercial-free photographic art service turning the TV into a virtual picture frame with stunning visual imagery from celebrated artists and photographers. Shaw now offers 50 HD channels, including 19 HD pay-per-view services and a growing library of HD VOD content. The Company added over 140,000 digital subscribers during the year and Digital penetration of Basic customers is now 40.3% compared to 34.3% at August 31, 2007. Shaw has over 900,000 Digital customers including 330,000 with HD capabilities.

Shaw Communications Inc.
11
Subscriber Statistics
August 31, 2008 Three months ended Year ended
August 31, 2008
August 31, 2007
Growth
Change %
Growth
Change %
CABLE: Basic service: Actual 2,248,120 2,226,841 4,122 0.2 21,279 1.0 Penetration as % of homes passed 63.5% 64.6% Digital terminals 1,205,239 1,016,564 25,793 2.2 188,675 18.6 Digital customers 906,320 763,140 23,020 2.6 143,180 18.8 INTERNET: Connected and scheduled 1,565,962 1,451,756 24,785 1.6 114,206 7.9 Penetration as % of basic 69.7% 65.2% Standalone Internet not included in basic cable 214,127 182,569 3,382 1.6 31,558 17.3 DIGITAL PHONE: Number of lines(1) 611,931 385,357 61,999 11.3 226,574 58.8
(1) Represents primary and secondary lines on billing plus pending installs.
SATELLITE (DTH and Satellite Services)
FINANCIAL HIGHLIGHTS
Three months ended August 31, Year ended August 31,
2008
2007 Change
%
2008
2007 Change
% ($000’s Cdn) Service revenue (third party) DTH (Star Choice) 162,879 151,491 7.5 640,061 605,176 5.8 Satellite Services 22,411 21,809 2.8 89,212 86,617 3.0 185,290 173,300 6.9 729,273 691,793 5.4 Service operating income before amortization (1) DTH (Star Choice) 55,538 48,048 15.6 206,541 196,404 5.2 Satellite Services 11,823 11,420 3.5 48,421 47,527 1.9 67,361 59,468 13.3 254,962 243,931 4.5 Less: Interest expense (2) 6,562 8,979 (26.9) 29,599 38,563 (23.2) Cash flow before the following: 60,799 50,489 20.4 225,363 205,368 9.7 Capital expenditures and equipment costs (net): Success based (3) 18,524 24,667 (24.9) 72,512 73,504 (1.3) Transponders and other 1,516 4,039 (62.5) 5,558 13,273 (58.1) Total as per Note 2 to the unaudited interim Consolidated Financial Statements 20,040 28,706 (30.2)
78,070
86,777
(10.0)
Free cash flow (1) 40,759 21,783 87.1 147,293 118,591 24.2 Operating Margin 36.4% 34.3% 2.1 35.0% 35.3% (0.3)
(1) See definitions and discussion under Key Performance Drivers in Management’s Discussion and Analysis. (2) Interest is allocated to the Satellite division based on the actual cost of debt incurred by the Company to
repay Satellite debt and to fund accumulated cash deficits of Shaw Satellite Services and Star Choice. (3) Net of the profit on the sale of satellite equipment as it is viewed as a recovery of expenditures on customer
premise equipment.

Shaw Communications Inc.
12
Operating Highlights
• Free cash flow of $40.8 million for the quarter compares to $21.8 million in the same period last year.
• During the quarter Star Choice added 1,736 customers and as at August 31, 2008
customers now total 892,528. Subscriber growth for the year was 12,943 or 1.5%. Service revenue was up 6.9% and 5.4% over the comparable quarter and annual period last year to $185.3 million and $729.3 million, respectively. The improvement was primarily due to rate increases and customer growth. Service operating income before amortization of $67.4 million and $255.0 million for the quarter and annual periods, respectively, improved 13.3% and 4.5% over the same periods last year. The increase in both periods was mainly due to the revenue related growth partially offset by higher employee related and other costs to support growth. The comparative annual period also benefitted from the recovery of provisions related to certain contractual matters. Service operating income before amortization of $67.4 million increased 9.1% over the third quarter. The improvement is mainly due to higher expenses in the third quarter for CRTC Part II fees as a result of the Federal Court of Appeal decision on this matter. Total capital investment of $20.0 million and $78.1 million for the quarter and year respectively, compared to $28.7 million and $86.8 million for the same periods last year. Success-based capital declined in both periods mainly due to HD expansion projects undertaken in the latter part of last year. The current annual period benefitted from a duty recovery which was more than offset by increased activations. The quarterly decline in Transponders and other was due to upgrade spending related to HD expansion projects in the comparable quarter while the reduction on an annual basis was also due to investments made in the prior year to upgrade certain Satellite Service technology and office equipment to support call centre expansions. During the quarter Star Choice added additional HD channels including TVA HD, Superchannel HD as well as two PPV HD channels. Most recently Star Choice added TSN2 HD and now carries a total of 46 HD channels. During fiscal 2008 Star Choices’ HD customer base increased by approximately 100,000.
Subscriber Statistics
August 31, 2008 Three months ended Year ended
August 31, 2008
August 31, 2007
Growth Change
%
Growth Change
% Star Choice customers (1) 892,528 879,585 1,736 0.2 12,943 1.5
(1) Including seasonal customers who temporarily suspend their service.
Shaw Communications Inc.
13
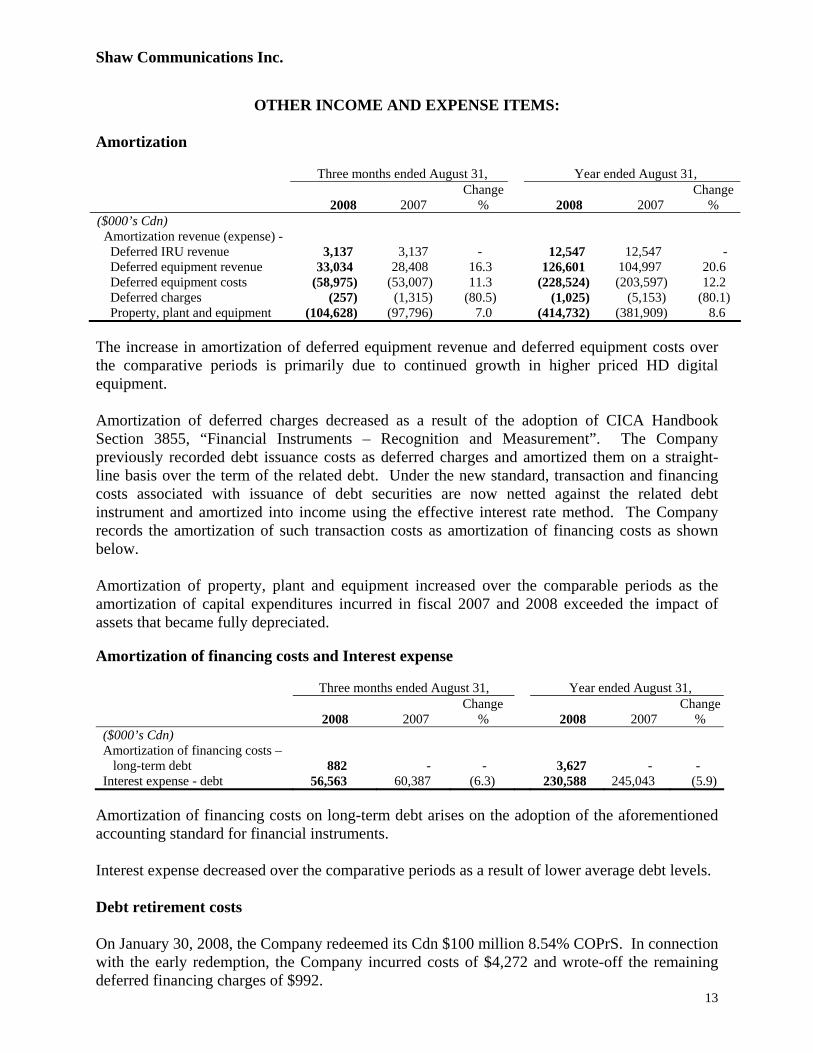
OTHER INCOME AND EXPENSE ITEMS: Amortization Three months ended August 31, Year ended August 31,
2008
2007
Change%
2008
2007
Change %
($000’s Cdn) Amortization revenue (expense) - Deferred IRU revenue 3,137 3,137 - 12,547 12,547 - Deferred equipment revenue 33,034 28,408 16.3 126,601 104,997 20.6 Deferred equipment costs (58,975) (53,007) 11.3 (228,524) (203,597) 12.2 Deferred charges (257) (1,315) (80.5) (1,025) (5,153) (80.1) Property, plant and equipment (104,628) (97,796) 7.0 (414,732) (381,909) 8.6 The increase in amortization of deferred equipment revenue and deferred equipment costs over the comparative periods is primarily due to continued growth in higher priced HD digital equipment. Amortization of deferred charges decreased as a result of the adoption of CICA Handbook Section 3855, “Financial Instruments – Recognition and Measurement”. The Company previously recorded debt issuance costs as deferred charges and amortized them on a straight-line basis over the term of the related debt. Under the new standard, transaction and financing costs associated with issuance of debt securities are now netted against the related debt instrument and amortized into income using the effective interest rate method. The Company records the amortization of such transaction costs as amortization of financing costs as shown below. Amortization of property, plant and equipment increased over the comparable periods as the amortization of capital expenditures incurred in fiscal 2007 and 2008 exceeded the impact of assets that became fully depreciated. Amortization of financing costs and Interest expense
Three months ended August 31, Year ended August 31,
2008
2007
Change %
2008
2007
Change%
($000’s Cdn) Amortization of financing costs – long-term debt
882
-
-
3,627
-
-
Interest expense - debt 56,563 60,387 (6.3) 230,588 245,043 (5.9) Amortization of financing costs on long-term debt arises on the adoption of the aforementioned accounting standard for financial instruments. Interest expense decreased over the comparative periods as a result of lower average debt levels. Debt retirement costs On January 30, 2008, the Company redeemed its Cdn $100 million 8.54% COPrS. In connection with the early redemption, the Company incurred costs of $4,272 and wrote-off the remaining deferred financing charges of $992.

Shaw Communications Inc.
14
Other gains This category generally includes realized and unrealized foreign exchange gains and losses on US dollar denominated current assets and liabilities, gains and losses on disposal of property, plant and equipment and the Company’s share of the operations of Burrard Landing Lot 2 Holdings Partnership (“the Partnership”). In the first quarter of the current year, other gains also includes a net customs duty recovery of $22.3 million related to satellite receiver importations in prior years. Future income taxes Future income taxes fluctuated over the comparative periods due to the combined impact of income tax recoveries in respect of reductions in corporate income tax rates and increased taxes on higher pre-tax income. In the second and third quarters of the current year and the fourth quarter of the prior year, future tax recoveries mainly related to reductions in corporate income tax rates of $188.0 million, $11.1 million, and $35.5 million, respectively, were recorded.
RISKS AND UNCERTAINTIES There have been no material changes in any risks or uncertainties facing the Company since August 31, 2007. A discussion of risks affecting the Company and its business is set forth in the Company’s August 31, 2007 Annual Report under the Introduction to the Business – Known Events, Trends, Risks and Uncertainties in Management’s Discussion and Analysis.
FINANCIAL POSITION Total assets at August 31, 2008 were $8.4 billion compared to $8.2 billion at August 31, 2007. Following is a discussion of significant changes in the consolidated balance sheet since August 31, 2007. Current assets declined $185.8 million due to decreases in cash and cash equivalents of $165.3 million, inventories of $8.8 million and future income taxes of $47.8 million which were partially offset by an increase in accounts receivable of $32.6 million. Cash and cash equivalents decreased as short-term deposits were used towards the repayment of the 7.4% senior unsecured notes at maturity and future income taxes declined due to the use of non-capital loss carryforwards. Inventories decreased due to timing of equipment purchases and higher shipments to retailers. Accounts receivable increased primarily due to subscriber growth and rate increases and increased shipments to retailers. Investments and other assets increased by $190.1 million due to deposits for wireless spectrum licenses. During the fourth quarter, the Company participated in Industry Canada’s auction of spectrum licenses for advanced wireless services and was successful in its bids for spectrum licenses primarily in Western Canada and Northern Ontario. Property, plant and equipment increased $193.6 million as current year capital expenditures exceeded amortization.

Shaw Communications Inc.
15
Deferred charges decreased $3.9 million primarily due to a reduction of $30.7 million upon adoption of a new accounting standard for financial instruments partially offset by an increase in deferred equipment costs of $24.5 million. Under the new accounting standard, transaction and financing costs associated with issuance of debt securities are now netted against the related debt instrument. Previously, such costs were recorded as deferred charges. Current liabilities (excluding current portion of long-term debt and derivative instruments) increased $262.1 million due to increases in bank indebtedness of $44.2 million, accounts payable of $214.3 million and unearned revenue of $5.5 million. Accounts payable increased due to amounts owing in respect of the wireless spectrum licenses and current year CRTC Part II fees arising from the recent Federal Court of Appeal decision. Unearned revenue increased due to customer growth and rate increases. Total long-term debt decreased $361.5 million as a result of the repayment of the $296.8 million senior unsecured notes at maturity, redemption of the $100.0 million 8.54% Series B COPrS and a decrease of $24.9 million in respect of the adoption of the aforementioned accounting standard for financial instruments, all of which were partially offset by a net increase in bank borrowings of $55.0 million and an increase of $5.6 million relating to the translation of hedged US denominated debt. Other long-term liability increased due to the current year defined benefit pension plan expense. Derivative instruments (including current portion) of $520.2 million arise on adoption of a new accounting standard for financial instruments which requires all derivative instruments be recorded at fair value in the balance sheet. This resulted in an increase of $526.7 million of which, $456.1 million was a reclassification from deferred credits in respect of cross-currency interest rate swaps and is the difference between the value of US denominated debt translated at the August 31, 2007 period end exchange rate and hedge rates. The remaining $70.6 million, net of tax, was charged to opening accumulated other comprehensive income. During the year ended August 31, 2008, a gain of $6.5 million was recorded, of which $5.6 million was in respect of the foreign exchange gain on the notional amounts of the derivatives relating to hedges on long-term debt. Deferred credits decreased by $463.9 million primarily due to a $459.7 million decrease on adoption of the aforementioned accounting standard for financial instruments and amortization of deferred IRU rental revenue of $12.5 million, both of which were partially offset by an increase in deferred equipment revenue of $7.7 million. Future income taxes decreased by $46.1 million due to the income tax recoveries primarily related to reductions in corporate income tax rates partially offset by the future income tax expense recorded in the current year. Share capital increased by $10.3 million primarily due to the issuance of 1,997,193 Class B Non-Voting Shares under the Company’s option plans for $32.5 million and the repurchase of 4,898,300 Class B Non-Voting Shares for $99.8 million of which $24.8 million reduced stated share capital and $75.0 million was charged to the deficit. As of October 15, 2008, share capital is as reported at August 31, 2008 with the exception of the issuance of 303,583 Class B Non-Voting Shares upon exercise of options and repurchase of 483,000 Class B Non-Voting Shares for cancellation at an average price of $21.66 subsequent to the quarter end. Contributed surplus increased due to stock-based compensation expense recorded in the current year.

Shaw Communications Inc.
16
LIQUIDITY AND CAPITAL RESOURCES In the current year, the Company generated $452.6 million of consolidated free cash flow. Shaw used its free cash flow along with cash and cash equivalents of $165.3 million, proceeds on issuance of Class B Non-Voting Shares of $32.5 million, the net increase in debt and bank indebtedness of $99.2 million, refunds received on a net customs duty recovery of $22.3 million, net change in working capital and inventory cash requirements of $30.7 million, and other net items of $36.2 million to redeem the $100.0 million 8.54% COPrS, repay the $296.8 million 7.4% senior unsecured notes at maturity, purchase $99.8 million of Class B Non-Voting Shares for cancellation, pay common share dividends of $303.8 million and fund the current cash requirements of $38.4 million related to the deposits on wireless spectrum licenses. On November 15, 2007, Shaw received the approval of the TSX to renew its normal course issuer bid to purchase its Class B Non-Voting Shares for a further one year period. The Company is authorized to acquire up to 35,600,000 Class B Non-Voting Shares, representing approximately 10% of the public float of Class B Non-Voting Shares, during the period November 19, 2007 to November 18, 2008. During the year, the Company repurchased 4,898,300 Class B Non-Voting Shares for $99.8 million.
At August 31, 2008, Shaw had access to $792.9 million of available credit facilities. Based on available credit facilities and forecasted free cash flow, the Company expects to have sufficient liquidity to fund operations and obligations during the current fiscal year. On a longer-term basis, Shaw expects to generate free cash flow and have borrowing capacity sufficient to finance foreseeable future business plans and refinance maturing debt.
CASH FLOW Operating Activities
Three months ended August 31, Year ended August 31,
2008
2007
Change %
2008
2007
Change %
($000’s Cdn) Funds flow from operations 321,276 272,545 17.9 1,222,895 1,028,363 18.9 Net decrease (increase) in non-cash
working capital balances related to operations 25,793 23,080 11.8
19,304
(28,250)
168.3 347,069 295,625 17.4 1,242,199 1,000,013 24.2 Funds flow from operations increased over comparative quarter primarily due to growth in service operating income before amortization and lower interest expense. The net change in non-cash working capital balances over the comparative periods is due to timing of payment of accounts payable and accrued liabilities and increases in accounts receivable due to subscriber growth and rate increases.

Shaw Communications Inc.
17
Investing Activities Three months ended August 31, Year ended August 31,
2008 2007
Increase
2008
2007
Increase
($000's Cdn) Cash flow used in investing activities
(218,936)
(194,767)
24,169
(734,135)
(719,777)
14,358
The cash used in investing activities increased over the comparative quarter due to the cash outlay in respect of deposits for the wireless spectrum licenses. The annual period was also impacted by a higher cash outlay for capital expenditures and equipment costs in the current year offset by the impact of cash requirements for cable business acquisitions in the prior year. Financing Activities The changes in financing activities during the comparative periods were as follows:
Three months ended August 31, Year ended August 31, 2008 2007 2008 2007 (In $millions Cdn) Bank loans and bank indebtedness – net borrowings
(repayments) 10.0 -
99.2
(300.4) Proceeds on $400 million senior unsecured notes - - - 400.0 Repayment of senior unsecured notes - - (296.8) - Redemption of Cdn 8.54% Series B COPrS - - (100.0) - Dividends (77.3) (60.8) (303.8) (201.2) Repayment of Partnership debt (0.2) (0.1) (0.4) (0.4) Debt retirement costs - - (4.3) - Issue of Class B Non-Voting Shares 7.0 19.1 32.5 92.1 Purchase of Class B Non-Voting Shares for cancellation (67.7) (104.8) (99.8) (104.8) Proceeds on bond forward - - - 0.2 Cost to terminate forward contract - - - (0.4) (128.2) (146.6) (673.4) (114.9)

Shaw Communications Inc.
18
SUPPLEMENTARY QUARTERLY FINANCIAL INFORMATION
Service revenue
Service operating
income before amortization(1)
Net income
Basic and
diluted earnings per share
Funds flow
from operations (2)
($000’s Cdn except per share amounts) 2008 Fourth 805,700 369,527 132,378 0.31 321,276 Third 792,149 356,089 128,113 0.30 310,984 Second 763,182 349,711 298,848 0.69 304,293 First 743,828 332,909 112,223 0.26 286,342 2007 Fourth 715,471 326,052 135,932 0.31 272,545 Third 702,238 310,748 91,658 0.21 259,470 Second 685,730 303,038 79,751 0.18 252,412 First 671,006 299,787 81,138 0.19 243,936 (1) See definition and discussion under Key Performance Drivers in Management’s Discussion and Analysis. (2) Funds flow from operations is presented before changes in net non-cash working capital balances related to
operations as presented in the unaudited interim Consolidated Statements of Cash Flows. Generally, service revenue and service operating income before amortization have grown quarter-over-quarter mainly due to customer growth and rate increases. Net income has generally trended positively quarter-over-quarter as a result of the growth in service operating income before amortization described above, reductions of interest expense as a result of debt repayment and retirement, the impact of the net change in non-operating items such as other gains, debt retirement costs and the impact of corporate income tax rate reductions. The exceptions to the consecutive quarter-over-quarter increases in net income are the second quarter of 2007 and first and third quarters of 2008. Net income declined by $23.7 million in the first quarter of 2008 and by $170.7 million in the third quarter of 2008 due to income tax recoveries primarily related to reductions in corporate income tax rates which contributed $35.5 million and $188.0 to net income in the fourth quarter of 2007 and second quarter of 2008, respectively. The decline related to income taxes in the first quarter of 2008 was partially offset by a net customs duty recovery of $22.3 million in respect of satellite receiver importations in prior years. The decline in net income in the second quarter of 2007 was marginal. As a result of the aforementioned changes in net income, basic and diluted earnings per share have trended accordingly.
ACCOUNTING STANDARDS Update to critical accounting policies and estimates The Management’s Discussion and Analysis (“MD&A”) included in the Company’s August 31, 2007 Annual Report outlined critical accounting policies including key estimates and assumptions that management has made under these policies and how they affect the amounts reported in the Consolidated Financial Statements. The MD&A also describes significant accounting policies where alternatives exist. Also described therein were several new accounting policies that the Company was required to adopt in fiscal 2008 as a result of changes in Canadian accounting pronouncements. The unaudited interim Consolidated Financial Statements follow the same accounting policies and methods of application as the most recent annual consolidated financial statements other than as set out below.

Shaw Communications Inc.
19
Financial instruments The Company has adopted CICA Handbook Sections 3855, “Financial Instruments - Recognition and Measurement”, 3861, “Financial Instruments - Disclosure and Presentation”, 3865, “Hedges”, 1530, “Comprehensive Income” and 3251, “Equity”. These new standards address when a company should recognize a financial instrument on its balance sheet and how the instrument should be measured once recognized. Adoption of these standards was effective September 1, 2007 on a retrospective basis without restatement of prior periods, except for the reclassification of equity balances to reflect Accumulated Other Comprehensive Income which included foreign currency translation adjustments.
On adoption of Section 1530, a new statement entitled “Consolidated Statements of Comprehensive Income (Loss) and Accumulated Other Comprehensive Income (Loss)” was added to the Company’s consolidated financial statements. Comprehensive income (loss) includes net income (loss) as well as other comprehensive income (loss). Other comprehensive income (loss) is comprised of changes in the fair value of derivative instruments designated as cash flow hedges and the net unrealized foreign currency translation gain (loss) from self sustaining foreign operations, which was previously classified as a separate component of shareholders’ equity. Accumulated other comprehensive income (loss) forms part of shareholders’ equity.
In addition, the Company classified all financial instruments into one of the following five categories: 1) “loans and receivables”, 2) “assets held-to-maturity”, 3) “assets available-for-sale”, 4) “financial liabilities”, and 5) “held-for-trading”. None of the Company’s financial instruments have been classified as held-to-maturity or held-for-trading. Financial instruments designated as “available-for-sale” are carried at their fair value while financial instruments such as “loans and receivables” and “financial liabilities” will be carried at amortized cost. Certain private investments where market value is not readily determinable will continue to be carried at cost.
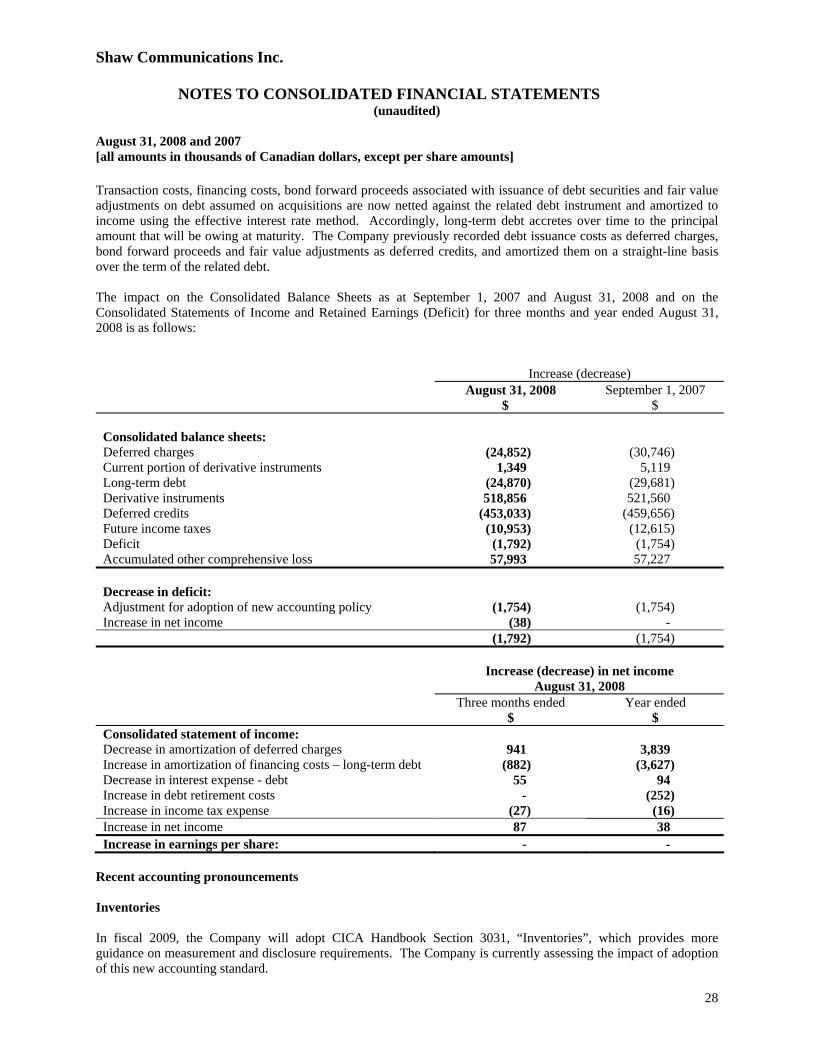
All derivatives, including embedded derivatives that must be separately accounted for, are measured at fair value in the balance sheet. The transition date for the assessment of embedded derivatives was September 1, 2002. The changes in fair value of cash flow hedging derivatives are recorded in other comprehensive income (loss), to the extent effective, until the variability of cash flows relating to the hedged asset or liability is recognized in the consolidated statements of income. Any hedge ineffectiveness will be recognized in net income (loss) immediately. Transaction costs, financing costs, bond forward proceeds associated with issuance of debt securities and fair value adjustments on debt assumed on acquisitions are now netted against the related debt instrument and amortized to income using the effective interest rate method. Accordingly, long-term debt accretes over time to the principal amount that will be owing at maturity. The Company previously recorded debt issuance costs as deferred charges, bond forward proceeds and fair value adjustments as deferred credits and amortized them on a straight-line basis over the term of the related debt. The impact on the Consolidated Balance Sheets as at September 1, 2007 and August 31, 2008 and on the Consolidated Statements of Income and Retained Earnings (Deficit) for three months

Shaw Communications Inc.
20
and year ended August 31, 2008 is as follows:
Increase (decrease) August 31, September 1, 2008 2007 $ $ ($000’s Cdn) Consolidated balance sheets: Deferred charges (24,852) (30,746) Current portion of derivative instruments 1,349 5,119 Long-term debt (24,870) (29,681) Derivative instruments 518,856 521,560 Deferred credits (453,033) (459,656) Future income taxes (10,953) (12,615) Deficit (1,792) (1,754) Accumulated other comprehensive loss 57,993 57,227 Decrease in deficit: Adjusted for adoption of new accounting policy (1,754) (1,754) Increase in net income (38) - (1,792) (1,754) Increase (decrease) in net income August 31, 2008 Three months ended Year ended ($000’s Cdn except per share amount) $ $ Consolidated statement of income: Decrease in amortization of deferred charges 941 3,839 Increase in amortization of financing costs – long-term debt (882) (3,627) Decrease in interest expense - debt 55 94 Increase in debt retirement costs - (252) Increase in income tax expense (27) (16) Increase in net income 87 38 Increase in earnings per share: - -
2009 GUIDANCE
Shaw expects continued growth in fiscal 2009 and the Company’s preliminary view calls for service operating income before amortization in the Cable division to increase approximately 10% and modest growth in the Satellite division. Shaw estimates paying cash taxes in 2009 and will plan capital expenditures to address business growth and to drive initiatives aimed at continuing to improve competitiveness. The Company expects to generate free cash flow of at least $500 million. Certain important assumptions for 2009 guidance purposes include: customer growth continuing generally in line with historical trends; stable pricing environment for Shaw’s products relative to today’s rates; no significant market disruption or other significant changes in competition or regulation that would have a material impact; cash income taxes to be paid or payable in 2009; and a stable regulatory fee and rate environment, with CRTC Part II fees payable. The Company believes that challenging economic times may lie ahead but that the Western Canadian market will remain relatively stable and has assumed no significant deterioration in economic conditions.

Shaw Communications Inc.
21
Shaw continues to review its wireless strategy and believes an entry into this market should be measured and prudent in light of the competitive wireless market dynamics. As a result, the Company does not currently anticipate material investments in wireless during fiscal 2009. See the section below entitled “Caution Concerning Forward-Looking Statements”.
CAUTION CONCERNING FORWARD-LOOKING STATEMENTS
Certain statements included and incorporated by reference herein may constitute forward-looking statements. Such forward-looking statements involve risks, uncertainties and other factors which may cause actual results, performance or achievements of the Company to be materially different from any future results, performance or achievements expressed or implied by such forward-looking statements. When used, the words “anticipate”, “believe”, “expect”, “plan”, “intend”, “target”, “guideline”, “goal”, and similar expressions generally identify forward-looking statements. These forward-looking statements include, but are not limited to, references to future capital expenditures (including the amount and nature thereof), financial guidance for future performance, business strategies and measures to implement strategies, competitive strengths, goals, expansion and growth of Shaw’s business and operations, plans and references to the future success of Shaw. These forward-looking statements are based on certain assumptions, some of which are noted above, and analyses made by Shaw in light of its experience and its perception of historical trends, current conditions and expected future developments as well as other factors it believes are appropriate in the circumstances as of the current date. These assumptions include but are not limited to general economic and industry growth rates, currency exchange rates, technology deployment, content and equipment costs, and industry structure and stability. Whether actual results and developments will conform with expectations and predictions of the Company is subject to a number of factors including, but not limited to, general economic, market or business conditions; the opportunities that may be available to Shaw; Shaw’s ability to execute its strategic plans; changes in the competitive environment in the markets in which Shaw operates and from the development of new markets for emerging technologies; changes in laws, regulations and decisions by regulators that affect Shaw or the markets in which it operates in both Canada and the United States; Shaw’s status as a holding company with separate operating subsidiaries; changing conditions in the entertainment, information and communications industries; risks associated with the economic, political and regulatory policies of local governments and laws and policies of Canada and the United States; and other factors, many of which are beyond the control of Shaw. The foregoing is not an exhaustive list of all possible factors. Should one or more of these risks materialize or should assumptions underlying the forward-looking statements prove incorrect, actual results may vary materially from those as described herein. Consequently, all of the forward-looking statements made in this report and the documents incorporated by reference herein are qualified by these cautionary statements, and there can be no assurance that the actual results or developments anticipated by Shaw will be realized or, even if substantially realized, that they will have the expected consequences to, or effects on, the Company. You should not place undue reliance on any such forward-looking statements. The Company utilizes forward-looking statements in assessing its performance. Certain investors, analysts and others, utilize the Company's financial guidance and other forward-looking information in order

Shaw Communications Inc.
22
to assess the Company's expected operational and financial performance and as an indicator of its ability to service debt and return cash to shareholders. The Company's financial guidance may not be appropriate for other purposes. Any forward-looking statement (and such risks, uncertainties and other factors) speaks only as of the date on which it was originally made and the Company expressly disclaims any obligation or undertaking to disseminate any updates or revisions to any forward-looking statement contained in this document to reflect any change in expectations with regard to those statements or any other change in events, conditions or circumstances on which any such statement is based, except as required by law. New factors affecting the Company emerge from time to time, and it is not possible for the Company to predict what factors will arise or when. In addition, the Company cannot assess the impact of each factor on its business or the extent to which any particular factor, or combination of factors, may cause actual results to differ materially from those contained in any forward-looking statement.
Shaw Communications Inc.
23
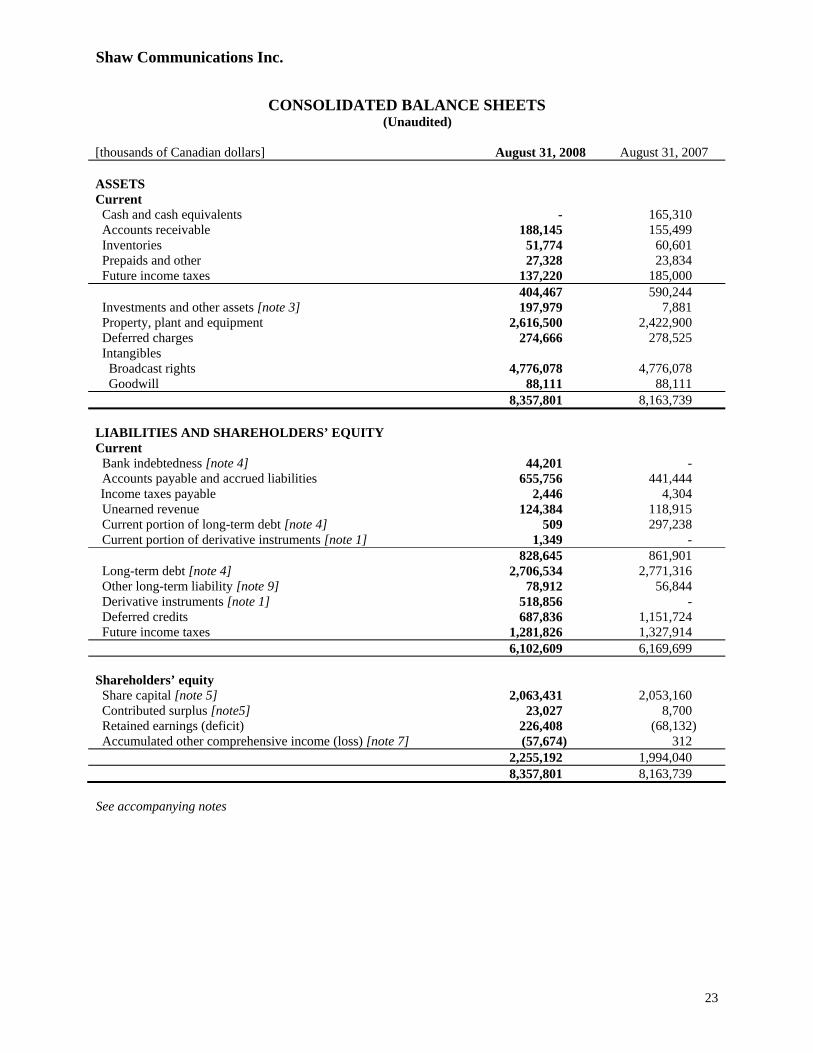
CONSOLIDATED BALANCE SHEETS (Unaudited) [thousands of Canadian dollars]
August 31, 2008
August 31, 2007
ASSETS Current Cash and cash equivalents - 165,310 Accounts receivable 188,145 155,499 Inventories 51,774 60,601 Prepaids and other 27,328 23,834 Future income taxes 137,220 185,000 404,467 590,244 Investments and other assets [note 3] 197,979 7,881 Property, plant and equipment 2,616,500 2,422,900 Deferred charges 274,666 278,525 Intangibles Broadcast rights 4,776,078 4,776,078 Goodwill 88,111 88,111 8,357,801 8,163,739 LIABILITIES AND SHAREHOLDERS’ EQUITY Current Bank indebtedness [note 4] 44,201 - Accounts payable and accrued liabilities 655,756 441,444 Income taxes payable 2,446 4,304 Unearned revenue 124,384 118,915 Current portion of long-term debt [note 4] 509 297,238 Current portion of derivative instruments [note 1] 1,349 - 828,645 861,901 Long-term debt [note 4] 2,706,534 2,771,316 Other long-term liability [note 9] 78,912 56,844 Derivative instruments [note 1] 518,856 - Deferred credits 687,836 1,151,724 Future income taxes 1,281,826 1,327,914 6,102,609 6,169,699 Shareholders’ equity Share capital [note 5] 2,063,431 2,053,160 Contributed surplus [note5] 23,027 8,700 Retained earnings (deficit) 226,408 (68,132) Accumulated other comprehensive income (loss) [note 7] (57,674) 312 2,255,192 1,994,040 8,357,801 8,163,739
See accompanying notes

Shaw Communications Inc.
24
CONSOLIDATED STATEMENTS OF INCOME AND RETAINED EARNINGS (DEFICIT) (Unaudited)
Three months ended August 31, Year ended August 31, [thousands of Canadian dollars except per share amounts] 2008 2007 2008 2007 Service revenue [note 2] 805,700 715,471 3,104,859 2,774,445 Operating, general and administrative expenses 436,173 389,419 1,696,623 1,534,820 Service operating income before amortization [note 2] 369,527 326,052 1,408,236 1,239,625 Amortization: Deferred IRU revenue 3,137 3,137 12,547 12,547 Deferred equipment revenue 33,034 28,408 126,601 104,997 Deferred equipment costs (58,975) (53,007) (228,524) (203,597) Deferred charges (257) (1,315) (1,025) (5,153) Property, plant and equipment (104,628) (97,796) (414,732) (381,909) Operating income 241,838 205,479 903,103 766,510 Amortization of financing costs – long-term debt (882) - (3,627) - Interest expense - debt [note 2] (56,563) (60,387) (230,588) (245,043) 184,393 145,092 668,888 521,467 Gain on sale of investment - - - 415
Debt retirement costs - - (5,264) - Other gains (losses) (1,742) 580 24,009 9,105 Income before income taxes 182,651 145,672 687,633 530,987 Future income tax expense 50,574 9,997 16,366 142,871 Income before the following 132,077 135,675 671,267 388,116 Equity income on investee 301 257 295 363 Net income 132,378 135,932 671,562 388,479 Retained earnings (deficit), beginning of period 222,948 (60,601) (68,132) (172,701) Adjustment for adoption of new accounting policy [note 1] - - 1,754 - Reduction on Class B Non-Voting Shares purchased for cancellation [note 5] (51,627) (82,702)
(74,963)
(82,702)
Dividends - Class A Shares and Class B Non-Voting Shares (77,291) (60,761) (303,813) (201,208) Retained earnings (deficit), end of period 226,408 (68,132) 226,408 (68,132) Earnings per share [note 6] Basic 0.31 0.31 1.56 0.90 Diluted 0.31 0.31 1.55 0.89 [thousands of shares] Weighted average participating shares outstanding during period 429,694 433,864 431,070 432,493 Participating shares outstanding, end of period 428,433 431,334 428,433 431,334 See accompanying notes

Shaw Communications Inc.
25
CONSOLIDATED STATEMENTS OF COMPREHENSIVE INCOME (LOSS) AND ACCUMULATED OTHER COMPREHENSIVE INCOME (LOSS)
(Unaudited)
Three months ended August 31, Year ended August 31, 2008 2007 2008 2007 Net income 132,378 135,932 671,562 388,479 Other comprehensive income (loss) [note 7] Change in unrealized fair value of derivatives designated as cash flow hedges 58,703 - (36,193) - Adjustment for hedged items recognized in the period 6,171 - 40,223 - Reclassification of foreign exchange gain on hedging derivatives to income to offset foreign exchange loss on US denominated debt (57,062) - (4,796) - Unrealized foreign exchange gain (loss) on translation of self- sustaining foreign operations 35 (6) 7 (18) 7,847 (6) (759) (18) Comprehensive income 140,225 135,926 670,803 388,461 Accumulated other comprehensive income (loss), beginning of
period (65,521) 318 312 330 Adjustment for adoption of new accounting policy [note 1] - - (57,227) - Other comprehensive income (loss) 7,847 (6) (759) (18) Accumulated other comprehensive income (loss), end of period (57,674) 312 (57,674) 312
See accompanying notes

Shaw Communications Inc.
26
CONSOLIDATED STATEMENTS OF CASH FLOWS
(Unaudited)
Three months ended August 31, Year ended August 31, [thousands of Canadian dollars] 2008 2007 2008 2007 OPERATING ACTIVITIES [note 8] Funds flow from operations 321,276 272,545 1,222,895 1,028,363 Net decrease (increase) in non-cash working capital balances related to operations 25,793 23,080
19,304
(28,350)
347,069 295,625 1,242,199 1,000,013 INVESTING ACTIVITIES Additions to property, plant and equipment [note 2] (152,330) (159,162) (606,093) (554,565) Additions to equipment costs (net) [note 2] (33,863) (35,280) (121,327) (96,516) Net customs duty recovery on equipment costs - - 22,267 - Net reduction (addition) to inventories 5,461 (298) 8,827 (6,607) Deposits on wireless spectrum licenses (38,447) - (38,447) - Cable business acquisitions - (136) - (72,361) Proceeds on sale of investments and other assets 243 121 638 15,970 Additions to deferred charges - (12) - (5,698) (218,936) (194,767) (734,135) (719,777) FINANCING ACTIVITIES Increase (decrease) in bank indebtedness 5,010 - 44,201 (20,362) Increase in long-term debt 77,904 - 297,904 460,000 Long-term debt repayments (73,026) (115) (640,142) (340,449) Cost to terminate forward contracts - - - (370) Debt retirement costs - - (4,272) -
Issue of Class B Non-Voting Shares, net of after-tax expenses [note 5] 6,955 19,111
32,498
92,058
Proceeds on bond forward - - - 190
Purchase of Class B Non-Voting Shares for cancellation [note 5] (67,719) (104,763)
(99,757)
(104,763)
Dividends paid on Class A Shares and Class B Non-Voting Shares (77,291) (60,761)
(303,813)
(201,208)
(128,167) (146,528) (673,381) (114,904) Effect of currency translation on cash balances and cash flows 34 (6) 7 (22) Increase (decrease) in cash and cash equivalents - (45,676) (165,310) 165,310 Cash and cash equivalents, beginning of the period - 210,986 165,310 - Cash and cash equivalents, end of the period - 165,310 - 165,310 Cash includes cash and term deposits See accompanying notes

Shaw Communications Inc.
NOTES TO CONSOLIDATED FINANCIAL STATEMENTS (unaudited)
August 31, 2008 and 2007 [all amounts in thousands of Canadian dollars, except per share amounts]
27
1. BASIS OF PRESENTATION AND ACCOUNTING POLICIES The unaudited interim Consolidated Financial Statements include the accounts of Shaw Communications Inc. and its subsidiaries (collectively the “Company”). The notes presented in these unaudited interim Consolidated Financial Statements include only significant events and transactions occurring since the Company’s last fiscal year end and are not fully inclusive of all matters required to be disclosed in the Company’s annual audited consolidated financial statements. As a result, these unaudited interim Consolidated Financial Statements should be read in conjunction with the Company’s consolidated financial statements for the year ended August 31, 2007. The unaudited interim Consolidated Financial Statements follow the same accounting policies and methods of application as the most recent annual consolidated financial statements except as noted below. Adoption of recent accounting pronouncements Financial instruments The Company has adopted CICA Handbook Sections 3855, “Financial Instruments - Recognition and Measurement”, 3861, “Financial Instruments - Disclosure and Presentation”, 3865, “Hedges”, 1530, “Comprehensive Income” and 3251, “Equity”. These new standards address when a company should recognize a financial instrument on its balance sheet and how the instrument should be measured once recognized. Adoption of these standards was effective September 1, 2007 on a retrospective basis without restatement of prior periods, except for the reclassification of equity balances to reflect Accumulated Other Comprehensive Income which included foreign currency translation adjustments.
On adoption of Section 1530, a new statement entitled “Consolidated Statements of Comprehensive Income (Loss) and Accumulated Other Comprehensive Income (Loss)” was added to the Company’s consolidated financial statements. Comprehensive income (loss) includes net income (loss) as well as other comprehensive income (loss). Other comprehensive income (loss) is comprised of changes in the fair value of derivative instruments designated as cash flow hedges and the net unrealized foreign currency translation gain (loss) from self sustaining foreign operations, which was previously classified as a separate component of shareholders’ equity. Accumulated other comprehensive income (loss) forms part of shareholders’ equity.
In addition, the Company classified all financial instruments into one of the following five categories: 1) “loans and receivables”, 2) “assets held-to-maturity”, 3) “assets available-for-sale”, 4) “financial liabilities”, and 5) “held-for-trading”. None of the Company’s financial instruments have been classified as held-to-maturity or held-for-trading. Financial instruments designated as “available-for-sale” are carried at their fair value while financial instruments such as “loans and receivables” and “financial liabilities” are carried at amortized cost. Certain private investments where market value is not readily determinable will continue to be carried at cost.
All derivatives, including embedded derivatives that must be separately accounted for, are measured at fair value in the balance sheet. The transition date for the assessment of embedded derivatives was September 1, 2002. The changes in fair value of cash flow hedging derivatives are recorded in other comprehensive income (loss), to the extent effective, until the variability of cash flows relating to the hedged asset or liability is recognized in the consolidated statements of income. Any hedge ineffectiveness will be recognized in net income (loss) immediately.
Shaw Communications Inc.
NOTES TO CONSOLIDATED FINANCIAL STATEMENTS (unaudited)
August 31, 2008 and 2007 [all amounts in thousands of Canadian dollars, except per share amounts]
28
Transaction costs, financing costs, bond forward proceeds associated with issuance of debt securities and fair value adjustments on debt assumed on acquisitions are now netted against the related debt instrument and amortized to income using the effective interest rate method. Accordingly, long-term debt accretes over time to the principal amount that will be owing at maturity. The Company previously recorded debt issuance costs as deferred charges, bond forward proceeds and fair value adjustments as deferred credits, and amortized them on a straight-line basis over the term of the related debt. The impact on the Consolidated Balance Sheets as at September 1, 2007 and August 31, 2008 and on the Consolidated Statements of Income and Retained Earnings (Deficit) for three months and year ended August 31, 2008 is as follows:
Increase (decrease) August 31, 2008 September 1, 2007 $ $ Consolidated balance sheets: Deferred charges (24,852) (30,746) Current portion of derivative instruments 1,349 5,119 Long-term debt (24,870) (29,681) Derivative instruments 518,856 521,560 Deferred credits (453,033) (459,656) Future income taxes (10,953) (12,615) Deficit (1,792) (1,754) Accumulated other comprehensive loss 57,993 57,227 Decrease in deficit: Adjustment for adoption of new accounting policy (1,754) (1,754) Increase in net income (38) - (1,792) (1,754) Increase (decrease) in net income August 31, 2008 Three months ended Year ended $ $ Consolidated statement of income: Decrease in amortization of deferred charges 941 3,839 Increase in amortization of financing costs – long-term debt (882) (3,627) Decrease in interest expense - debt 55 94 Increase in debt retirement costs - (252) Increase in income tax expense (27) (16) Increase in net income 87 38 Increase in earnings per share: - -
Recent accounting pronouncements Inventories In fiscal 2009, the Company will adopt CICA Handbook Section 3031, “Inventories”, which provides more guidance on measurement and disclosure requirements. The Company is currently assessing the impact of adoption of this new accounting standard.

Shaw Communications Inc.
NOTES TO CONSOLIDATED FINANCIAL STATEMENTS (unaudited)
August 31, 2008 and 2007 [all amounts in thousands of Canadian dollars, except per share amounts]
29
Goodwill and intangible assets In fiscal 2010, the Company will adopt CICA Handbook Section 3064, “Goodwill and intangible assets”, which replaces Sections 3062, “Goodwill and other intangible assets”, and 3450, “Research and development costs”. Section 3064 establishes standards for the recognition, measurement, presentation and disclosure of goodwill and intangible assets. The Company is currently assessing the impact of adoption of this new accounting standard. 2. BUSINESS SEGMENT INFORMATION The Company provides cable television services, high-speed Internet access, Digital Phone and Internet infrastructure services (“Cable”); DTH satellite services (Star Choice); and, satellite distribution services (“Satellite Services”). All of these operations are located in Canada. Information on operations by segment is as follows:
Operating information
Three months ended August 31, Year ended August 31, 2008 2007 2008 2007 $ $ $ $ Service revenue Cable 621,365 543,116 2,379,361 2,086,066 DTH 165,783 152,957 650,653 611,713 Satellite Services 23,286 22,684 92,712 90,117 Inter segment - 810,434 718,757 3,122,726 2,787,896 Cable (955) (945) (3,775) (3,414) DTH (2,904) (1,466) (10,592) (6,537) Satellite Services (875) (875) (3,500) (3,500) 805,700 715,471 3,104,859 2,774,445 Service operating income before amortization Cable 302,166 266,584 1,153,274 995,694 DTH 55,538 48,048 206,541 196,404 Satellite Services 11,823 11,420 48,421 47,527 369,527 326,052 1,408,236 1,239,625 Interest (1) Cable 49,657 51,056 199,600 205,062 DTH and Satellite Services 6,562 8,979 29,599 38,563 Burrard Landing Lot 2 Holdings Partnership 344 352 1,389 1,418 56,563 60,387 230,588 245,043
(1) The Company reports interest on a segmented basis for Cable and combined satellite only. It does not report
interest on a segmented basis for DTH and Satellite Services.

Shaw Communications Inc.
NOTES TO CONSOLIDATED FINANCIAL STATEMENTS (unaudited)
August 31, 2008 and 2007 [all amounts in thousands of Canadian dollars, except per share amounts]
30
Capital expenditures
Three months ended August 31, Year ended August 31, 2008 2007 2008 2007 $ $ $ $ Capital expenditures accrual basis Cable 126,860 121,979 509,411 471,058 Corporate 8,558 29,580 93,437 62,427 Sub-total Cable including corporate 135,418 151,559 602,848 533,485 Satellite (net of equipment profit) 743 3,109 2,231 9,807 136,161 154,668 605,079 543,292
Equipment costs (net of revenue received) Cable 14,566 9,683 45,488 19,546 Satellite 19,297 25,597 75,839 76,970 33,863 35,280 121,327 96,516 Capital expenditures and equipment costs (net) Cable 149,984 161,242 648,336 553,031 Satellite 20,040 28,706 78,070 86,777 170,024 189,948 726,406 639,808
Reconciliation to Consolidated Statements of Cash Flows Additions to property, plant and equipment 152,330 159,162 606,093 554,565 Additions to equipment costs (net) 33,863 35,280 121,327 96,516 Total of capital expenditures and equipment costs (net) per Consolidated Statements of Cash Flows 186,193 194,442 727,420 651,081 Decrease in working capital related to capital expenditures (15,201) (3,536) 2,608 (7,678) Less: IRU prepayments (1) - - - (7) Less: Satellite equipment profit (2) (968) (958) (3,622) (3,588) Total capital expenditures and equipment costs (net) reported by segments 170,024 189,948
726,406
639,808
(1) Prepayments on indefeasible rights to use (“IRUs”) certain specifically identified fibres in amounts not
exceeding the costs to build the fiber subject to the IRUs are subtracted from the calculation of segmented capital expenditures and equipment costs (net).
(2) The profit from the sale of satellite equipment is subtracted from the calculation of segmented capital
expenditures and equipment costs (net) as the Company views the profit on sale as a recovery of expenditures on customer premise equipment.

Shaw Communications Inc.
NOTES TO CONSOLIDATED FINANCIAL STATEMENTS (unaudited)
August 31, 2008 and 2007 [all amounts in thousands of Canadian dollars, except per share amounts]
31
Assets
August 31, 2008
Cable
DTH
Satellite Services
Total
$ $ $ $ Segment assets 6,465,183 869,710 523,736 7,858,629 Corporate assets 499,172 Total assets 8,357,801
August 31, 2007
Cable
DTH
Satellite Services
Total
$ $ $ $ Segment assets 6,300,834 894,893 529,411 7,725,138 Corporate assets 438,601 Total assets 8,163,739
3. INVESTMENTS AND OTHER ASSETS During the fourth quarter, the Company participated in Industry Canada’s auction of spectrum licenses for advanced wireless services and was successful in its bids for spectrum licenses primarily in Western Canada and Northern Ontario. The total cost was $190,912 which consisted of $189,519 for the licenses and $1,393 of related auction expenditures. The amounts have been recorded as deposits pending receipt of the licenses upon Industry Canada’s approval of documentation submitted by the Company subsequent to year end.
Shaw Communications Inc.
NOTES TO CONSOLIDATED FINANCIAL STATEMENTS (unaudited)
August 31, 2008 and 2007 [all amounts in thousands of Canadian dollars, except per share amounts]
32
4. LONG-TERM DEBT
August 31, 2008 August 31, 2007
Effective interest
rates %
Translated at period
end exchange
rate (1)
Adjustment for hedged
debt (2)
Translated at hedged
rate
Translated at year
end exchange
rate
Adjustment for hedged
debt (2)
Translated at hedged
rate $ $ $ $ $ $ Corporate Bank loans (3) Variable 55,000 - 55,000 - - - Senior notes-
Cdn $400,000 5.70% due March 2, 2017 5.72 395,196 - 395,196 400,000 - 400,000 Cdn $450,000 6.10% due November 16, 2012 6.11 445,997 - 445,997 450,000 - 450,000 Cdn $300,000 6.15% due May 9, 2016 6.34 291,059 - 291,059 300,000 - 300,000 Cdn $296,760 7.4% due October 17, 2007 7.40 - - - 296,760 - 296,760 US $440,000 8.25% due April 11, 2010 7.88 465,711 175,340 641,051 464,728 177,892 642,620 US $225,000 7.25% due April 6, 2011 7.68 237,781 116,888 354,669 237,645 118,193 355,838 US $300,000 7.20% due December 15, 2011 7.61 317,222 158,250 475,472 316,860 159,990 476,850 Cdn $350,000 7.50% due November 20, 2013 7.50 345,685 - 345,685 350,000 - 350,000
COPrS - Cdn $100,000 due September 30, 2027 (4) 8.54 - - - 100,000 - 100,000
2,553,651 450,478 3,004,129 2,915,993 456,075 3,372,068
Other subsidiaries and entities Videon CableSystems Inc. - Cdn $130,000 Senior Debentures Series
“A” 8.15% due April 26, 2010
7.63 131,429 - 131,429
130,000
- 130,000 Burrard Landing Lot 2 Holdings Partnership 6.31 21,963 - 21,963 22,561 - 22,561 153,392 - 153,392 152,561 - 152,561 Total consolidated debt 2,707,043 450,478 3,157,521 3,068,554 456,075 3,524,629 Less current portion (5) 509 - 509 297,238 - 297,238 2,706,534 450,478 3,157,012 2,771,316 456,075 3,227,391
(1) Long-term debt, excluding bank loans, is presented net of unamortized discounts, finance costs, fair value adjustment on
debt and bond forward proceeds of $24,870.
(2) Foreign denominated long-term debt is translated at the period-end foreign exchange rates. Because the Company follows hedge accounting, the resulting exchange gains and losses on translating hedged long-term debt are deferred and offset by foreign exchange gains and losses arising on the related cross-currency interest rate agreements. If the rate of translation was adjusted to reflect the hedged rates of the Company’s cross-currency interest rate agreements (which fix the liability for interest and principal), long-term debt would increase by $450,478 (August 31, 2007 - $456,075) representing a corresponding amount in derivative instruments. The hedged rates on the Senior notes of US $440,000, US $225,000 and US $300,000 are 1.4605, 1.5815 and 1.5895, respectively.
(3) Availabilities under banking facilities are as follows at August 31, 2008:
Operating Total Bank loans (a) (b) credit facilities (a) $ $ $ Total facilities 1,050,000 1,000,000 50,000 Amount drawn 99,201 55,000 44,201 Letters of credit 157,894 157,307 587 792,905 787,693 5,212
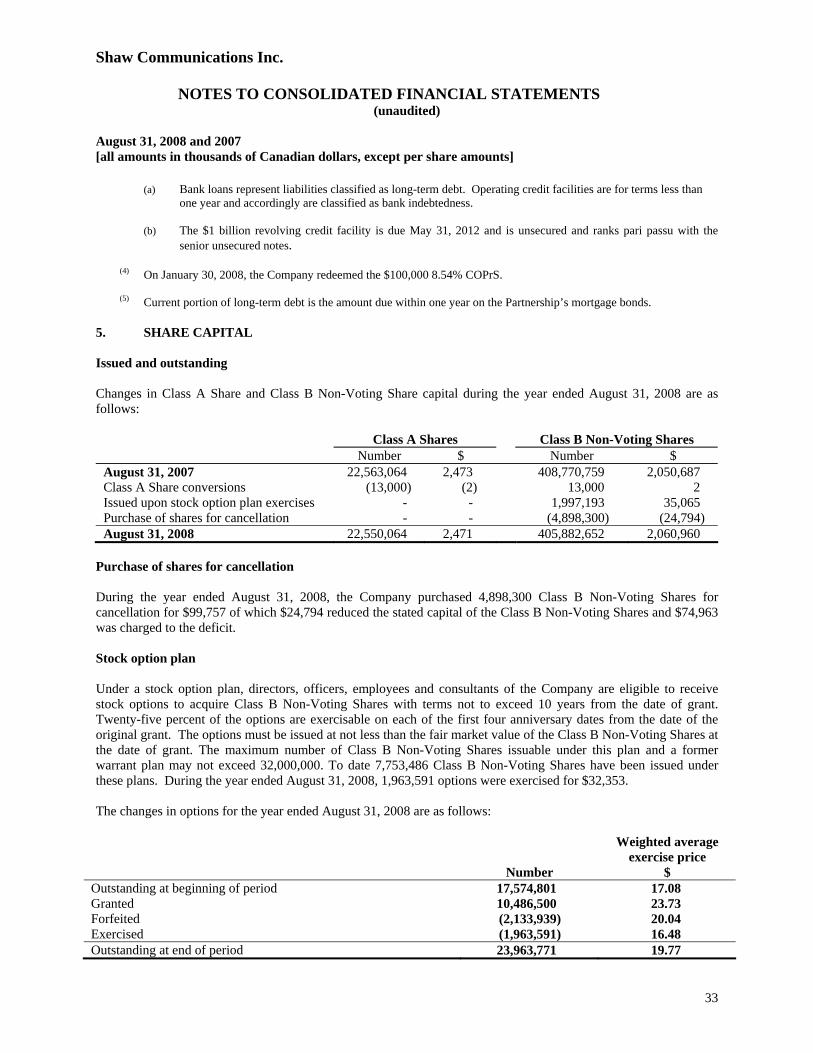
Shaw Communications Inc.
NOTES TO CONSOLIDATED FINANCIAL STATEMENTS (unaudited)
August 31, 2008 and 2007 [all amounts in thousands of Canadian dollars, except per share amounts]
33
(a) Bank loans represent liabilities classified as long-term debt. Operating credit facilities are for terms less than one year and accordingly are classified as bank indebtedness.
(b) The $1 billion revolving credit facility is due May 31, 2012 and is unsecured and ranks pari passu with the
senior unsecured notes.
(4) On January 30, 2008, the Company redeemed the $100,000 8.54% COPrS.
(5) Current portion of long-term debt is the amount due within one year on the Partnership’s mortgage bonds. 5. SHARE CAPITAL Issued and outstanding Changes in Class A Share and Class B Non-Voting Share capital during the year ended August 31, 2008 are as follows:
Class A Shares Class B Non-Voting Shares Number $ Number $ August 31, 2007 22,563,064 2,473 408,770,759 2,050,687 Class A Share conversions (13,000) (2) 13,000 2 Issued upon stock option plan exercises - - 1,997,193 35,065 Purchase of shares for cancellation - - (4,898,300) (24,794) August 31, 2008 22,550,064 2,471 405,882,652 2,060,960
Purchase of shares for cancellation During the year ended August 31, 2008, the Company purchased 4,898,300 Class B Non-Voting Shares for cancellation for $99,757 of which $24,794 reduced the stated capital of the Class B Non-Voting Shares and $74,963 was charged to the deficit. Stock option plan Under a stock option plan, directors, officers, employees and consultants of the Company are eligible to receive stock options to acquire Class B Non-Voting Shares with terms not to exceed 10 years from the date of grant. Twenty-five percent of the options are exercisable on each of the first four anniversary dates from the date of the original grant. The options must be issued at not less than the fair market value of the Class B Non-Voting Shares at the date of grant. The maximum number of Class B Non-Voting Shares issuable under this plan and a former warrant plan may not exceed 32,000,000. To date 7,753,486 Class B Non-Voting Shares have been issued under these plans. During the year ended August 31, 2008, 1,963,591 options were exercised for $32,353. The changes in options for the year ended August 31, 2008 are as follows:
Number
Weighted average exercise price
$ Outstanding at beginning of period 17,574,801 17.08 Granted 10,486,500 23.73 Forfeited (2,133,939) 20.04 Exercised (1,963,591) 16.48 Outstanding at end of period 23,963,771 19.77

Shaw Communications Inc.
NOTES TO CONSOLIDATED FINANCIAL STATEMENTS (unaudited)
August 31, 2008 and 2007 [all amounts in thousands of Canadian dollars, except per share amounts]
34
The following table summarizes information about the options outstanding at August 31, 2008: Range of prices
Number
outstanding at
August 31, 2008
Weighted average
remaining contractual life
Weighted average
exercise price
Number exercisable at
August 31, 2008
Weighted average
exercise price $ 8.69 20,000 5.14 $8.69 20,000 $8.69 $14.85 - $22.27 15,413,271 5.69 $17.20 8,802,799 $16.47 $22.28 - $26.20 8,530,500 9.00 $24.44 197,000 $22.32 For all common share options granted to employees up to August 2003, had the Company determined compensation costs based on the fair values at grant dates of the common share options consistent with the method prescribed under CICA Handbook Section 3870, the Company’s net income and earnings per share would have been reported as the pro forma amounts indicated below: Three months ended Year ended August 31, 2007 August 31, 2007 $ $ Net income for the period 135,932 388,479 Fair value of stock option grants 30 119 Pro forma net income for the period 135,902 388,360 Pro forma basic earnings per share 0.31 0.90 Pro forma diluted earnings per share 0.31 0.89 For the purposes of pro forma disclosures, the estimated fair value of the options is amortized to expense over the options’ vesting period on a straight-line basis. The weighted average estimated fair value at the date of the grant for common share options granted was $3.53 per option (2007 - $4.24) and $5.01 per option (2007 - $3.73) for the quarter and year-to-date, respectively. The fair value of each option granted was estimated on the date of the grant using the Black-Scholes option-pricing model with the following assumptions:
Three months ended August 31, Year ended August 31, 2008 2007 2008 2007 Dividend yield 3.65% 2.44% 2.92% 2.79% Risk-free interest rate 3.12% 4.21% 4.21% 4.12% Expected life of options 5 years 4 years 5 years 4 years Expected volatility factor of the future expected market price of Class B Non-Voting Shares 24.4% 22.7% 24.5% 26.0%
Other stock options In conjunction with the acquisition of Satellite Services, holders of Satellite Services options elected to receive 0.9 of a Shaw Class B Non-Voting Share in lieu of one Satellite Services share which would have been received upon the exercise of an option under the Satellite Services plan. During the third quarter, the remaining 37,336 Satellite Services options were exercised into 33,602 Class B Non-Voting Shares for $145.

Shaw Communications Inc.
NOTES TO CONSOLIDATED FINANCIAL STATEMENTS (unaudited)
August 31, 2008 and 2007 [all amounts in thousands of Canadian dollars, except per share amounts]
35
Contributed surplus The changes in contributed surplus are as follows:
August 31, 2008 $
Balance, beginning of period 8,700 Stock-based compensation 16,894 Stock options exercised (2,567) Balance, end of period 23,027
6. EARNINGS PER SHARE
Earnings per share calculations are as follows:
Three months ended August 31, Year ended August 31, 2008 2007 2008 2007 Numerator for basic and diluted earnings per
share ($)
Net income 132,378 135,932 671,562 388,479 Denominator (thousands of shares) Weighted average number of Class A Shares and
Class B Non-Voting Shares for basic earnings per share 429,694 433,864
431,070
432,493 Effect of dilutive securities 2,595 4,562 2,797 3,249 Weighted average number of Class A Shares and
Class B Non-Voting Shares for diluted earnings per share 432,289 438,426
433,867
435,742 Earnings per share ($) Basic 0.31 0.31 1.56 0.90 Diluted 0.31 0.31 1.55 0.89

Shaw Communications Inc.
NOTES TO CONSOLIDATED FINANCIAL STATEMENTS (unaudited)
August 31, 2008 and 2007 [all amounts in thousands of Canadian dollars, except per share amounts]
36
7. OTHER COMPREHENSIVE INCOME (LOSS) AND ACCUMULATED OTHER COMPREHENSIVE INCOME (LOSS)
Components of other comprehensive income (loss) and the related income tax effects for the year ended August 31, 2008 are as follows: Amount Income taxes Net $ $ $ Change in unrealized fair value of derivatives designated as cash flow hedges
(43,327)
7,134
(36,193)
Adjustment for hedged items recognized in the period 49,801 (9,578) 40,223 Reclassification of foreign exchange gain on hedging derivatives to income to offset foreign exchange loss on US denominated debt
(5,597)
801
(4,796) Unrealized foreign exchange gain on translation of self-sustaining foreign operations
7
-
7
884 (1,643) (759) Components of other comprehensive income (loss) and the related income tax effects for the three months ended August 31, 2008 are as follows: Amount Income taxes Net $ $ $ Changes in unrealized fair value of derivatives designated as cash flow hedges
68,811
(10,108)
58,703
Adjustment for hedged items recognized in the period 7,756 (1,585) 6,171 Reclassification of foreign exchange gain on hedging derivatives to income to offset foreign exchange loss on US denominated debt
(66,586)
9,524
(57,062) Unrealized foreign exchange gain on translation of self-sustaining foreign operations
35
-
35
10,016 (2,169) 7,847 Accumulated other comprehensive income (loss) is comprised of the following: August 31, 2008 August 31, 2007 $ $ Unrealized foreign exchange gain on translation of self-sustaining foreign operations 319 312 Fair value of derivatives (57,993) - (57,674) 312

Shaw Communications Inc.
NOTES TO CONSOLIDATED FINANCIAL STATEMENTS (unaudited)
August 31, 2008 and 2007 [all amounts in thousands of Canadian dollars, except per share amounts]
37
8. STATEMENTS OF CASH FLOWS Disclosures with respect to the Consolidated Statements of Cash Flows are as follows: (i) Funds flow from operations
Three months ended August 31, Year ended August 31, 2008 2007 2008 2007 $ $ $ $ Net income 132,378 135,932 671,562 388,479 Non-cash items: Amortization Deferred IRU revenue (3,137) (3,137) (12,547) (12,547) Deferred equipment revenue (33,034) (28,408) (126,601) (104,997) Deferred equipment costs 58,975 53,007 228,524 203,597 Deferred charges 257 1,315 1,025 5,153 Property, plant and equipment 104,628 97,796 414,732 381,909 Financing costs – long-term debt 882 - 3,627 - Future income tax expense 50,574 9,997 16,366 142,871 Gain on sale of investment - - - (415) Equity income on investee (301) (257) (295) (363) Debt retirement costs - - 5,264 - Stock-based compensation 4,419 1,947 16,894 6,787 Defined benefit pension plan 5,517 3,613 22,068 19,120 Net customs duty recovery on equipment costs - - (22,267) - Other 118 740 4,543 (1,231) Funds flow from operations 321,276 272,545 1,222,895 1,028,363 (ii) Changes in non-cash working capital balances related to operations include the following:
Three months ended August 31, Year ended August 31, 2008 2007 2008 2007 $ $ $ $ Accounts receivable (11,762) (4,508) (32,646) (16,435) Prepaids and other (5,085) (2,304) (9,900) (9,563) Accounts payable and accrued liabilities 42,930 27,371 54,839 (14,435) Income taxes payable (4) (65) (58) 661 Unearned revenue (286) 2,586 7,069 11,422 25,793 23,080 19,304 (28,350) (iii) Interest and income taxes paid (recovered) and classified as operating activities are as follows:
Three months ended August 31, Year ended August 31, 2008 2007 2008 2007 $ $ $ $ Interest 19,919 18,335 241,899 231,513 Income taxes (2) 6 57 (717)

Shaw Communications Inc.
NOTES TO CONSOLIDATED FINANCIAL STATEMENTS (unaudited)
August 31, 2008 and 2007 [all amounts in thousands of Canadian dollars, except per share amounts]
38
(iv) Non-cash transaction: The Consolidated Statements of Cash Flows exclude the following non-cash transaction:
Year ended August 31, 2008 2007 $ $ Issuance of Class B Non-Voting Shares on a cable system acquisition - 3,000
9. OTHER LONG-TERM LIABILITY Other long-term liability is the long-term portion of the Company’s defined benefit pension plan. The total benefit costs expensed under the Company’s defined benefit pension were $5,879 (2007 - $3,974) and $23,516 (2007 - $20,808) for the three months and year ended August 31, 2008, respectively.
-30-