finning announces fourth quarter and annual results quarter and annual 2008 results february 18,...
TRANSCRIPT

1
Fourth Quarter and Annual 2008 Results February 18, 2009
Finning Announces Fourth Quarter and Annual Results Highlights from Continuing Operations
• Record quarterly revenues achieved this quarter. Annual revenues in 2008 of almost $6 billion were also a record and were up 6% from prior year
• Annual diluted earnings per share was $0.55. Excluding certain non-recurring items of $0.06 per share and a non-cash goodwill impairment charge of $0.88 per share, annual diluted earnings per share was $1.49, down 4% from 2007.
• Cash flow provided by operating activities in 2008 improved almost $130 million, year over year, to $72.7 million
• Actions taken in the fourth quarter to respond to global economic downturn
Vancouver, Canada - Finning International Inc. (Finning) today reported record quarterly revenues of almost $1.6 billion for the fourth quarter of 2008, an increase of 7.3% over the fourth quarter of 2007 driven by strong demand for customer support services. As a result of certain non-recurring costs and charges in the fourth quarter of 2008, the Company experienced a loss from continuing operations before interest and income taxes (EBIT) of $84.5 million, and fourth quarter net loss from continuing operations was $106.8 million or $0.62 diluted loss per share. The non-recurring costs included a non-cash goodwill impairment charge as a result of a deterioration in market conditions, and restructuring costs in connection with the business support integration in the U.K. as well as the restructuring of Hewden’s nationwide depot network. In addition, in response to the current market conditions, Finning initiated certain actions in the fourth quarter of 2008 to reduce costs that resulted in restructuring charges globally. Excluding these non-recurring costs, diluted earnings per share from continuing operations for the fourth quarter of 2008 would have been $0.33 per share, 15.4% lower than the fourth quarter of 2007.
“Fourth quarter earnings were solid at 33 cents and consistent with expectations, excluding non-recurring items,” said Mike Waites, Finning’s President and CEO. “Revenues were at record levels and Free Cash Flow (before dividends) was also very strong at $152 million. While challenging business conditions will impact 2009 revenues, we have acted quickly and decisively to reduce our costs and adjust our staffing levels where needed. Having said that, I want to emphasize that the large fleet of Caterpillar equipment in our territories continues to provide us with good customer support growth. We achieved $1.9 billion of customer support revenues in 2008, well on our way to achieving our target of $2.3 billion of customer support revenues in 2010. Our balance sheet is healthy and our net debt to net debt plus equity ratio is expected to be towards the lower end of our target range of 40-50% by the end of 2009.”

Finning International Inc. Fourth Quarter and Annual 2008 Results
2
Three months ended December 31 Twelve months ended December 31
$ millions, except per share data 2008 2007 Change 2008 2007 Change
Revenue 1,566.7 1,459.5 7.3% 5,991.4 5,662.2 5.8%
Earnings from continuing operations before interest and income taxes (1)
before goodwill impairment 66.9 112.2 (40.4)% 388.1 455.8 (14.9)%
goodwill impairment (151.4) — — (151.4) — —
(84.5) 112.2 (175.3)% 236.7 455.8 (48.1)%
Net income (loss) (2)
before goodwill impairment 44.6 70.5 (36.7)% 247.4 280.1 (11.7)%
goodwill impairment (151.4) — — (151.4) — —
from continuing operations (106.8) 70.5 (251.5)% 96.0 280.1 (65.7)%
Diluted Earnings (Loss) Per Share (2)
before goodwill impairment $ 0.26 $ 0.39 (33.3)% $ 1.43 $ 1.55 (7.7%)
goodwill impairment (0.88) — — (0.88) — —
from continuing operations $ (0.62) $ 0.39 (259.0)% $ 0.55 $ 1.55 (64.5)% Cash flow after changes in working capital 169.0 221.3 (23.6)% 278.1 404.4 (31.2)%
(1) This amount does not have a standardized meaning under generally accepted accounting principles. For a reconciliation of this amount to net income from continuing operations, see the heading “Description of Non-GAAP Measure” in the Company’s management discussion and analysis which accompanies the fourth quarter and annual consolidated financial statements.
(2) On July 31, 2007, the Company’s U.K. subsidiary, Hewden Stuart Plc, sold its Tool Hire Division. As a consequence, the results of operations of the Tool Hire Division were reclassified as discontinued operations in 2007 and prior periods. The net loss from discontinued operations for the year ended December 31, 2007 was $2.0 million and diluted loss per share was $0.01.
Fourth Quarter Results
Finning’s revenues from continuing operations in the fourth quarter were almost $1.6 billion, up 7.3% from the fourth quarter of 2007 and were the highest quarterly revenues ever recorded by Finning. Finning achieved record quarterly revenues driven primarily by strong customer support services, particularly in the Company’s Canadian and South American operations. Revenue growth in Canada and South America was driven primarily by strong demand from mining customers. In the U.K., revenues were down in the fourth quarter of 2008 compared with the same period last year, with reduced new equipment sales and lower rental activity in the Hewden rental business, partially offset by higher customer support services revenues experienced at the Company’s UK dealership.
Finning’s global order book or backlog (the retail value of new equipment units ordered by customers for future deliveries) is approximately $1.5 billion at the end of the fourth quarter of 2008, lower than the December 2007 level of $1.7 billion and the September 2008 level of $2.0 billion. Backlog and new orders were down in all operations, reflecting the global economic slowdown, and as a result, Finning has reduced and cancelled certain orders with Caterpillar in the fourth quarter of 2008 in order to align its inventory orders with slower market demand.
In the fourth quarter of 2008, EBIT included certain costs which are considered by the Company to be non-recurring and as a result, the Company experienced a loss before interest and taxes of $84.5 million. These non-recurring items, which totalled $166.4 million, included a non-cash goodwill impairment charge, business support and depot restructuring costs in the U.K., and restructuring costs incurred globally by Finning in the fourth quarter of 2008 in light of current market conditions. Excluding these restructuring costs and a non-cash goodwill impairment charge, EBIT would have been $81.9 million, 27.0% lower than the fourth quarter of 2007.
Finning International Inc. Fourth Quarter and Annual 2008 Results
3
• EBIT from Finning’s Canadian reporting segment of $47.1 million in the fourth quarter of 2008 was 32.0% lower than the fourth quarter of 2007. The decrease in 2008 was primarily due to higher selling, general, and administrative costs, in part to support customer demand and growth in the Alberta oil sands. In addition, higher costs were incurred in the design of a new information technology system which is expected to provide benefits in the future, as well as restructuring costs incurred in response to the current market conditions.
• EBIT for Finning’s South American operations in the fourth quarter of 2008 of $38.3 million was 35.8% higher than the 2007 fourth quarter. The fourth quarter of 2008 includes the positive impact of translating U.S. dollar results with a weaker Canadian dollar and in functional currency (the U.S. dollar), EBIT was 10.0% higher than the fourth quarter in 2007, reflecting strong volumes in most lines of business.
• For the UK Group, EBIT in the fourth quarter of 2008 was a loss of $9.7 million, compared with EBIT of $16.1 million in the comparable period last year. Adjusting for the restructuring costs incurred in connection with the business support integration and depot closures, EBIT from continuing operations in the fourth quarter of 2008 would have been a loss of $3.7 million, primarily reflecting lower results from the UK Group’s rental business.
Finning recorded a net loss from continuing operations for the quarter of $106.8 million compared with net income of $70.5 million for the same period in 2007. Adjusting for the non-recurring restructuring costs and non-cash goodwill impairment charge noted above, net income from continuing operations would have been $55.9 million, and diluted earnings per share (EPS) from continuing operations for the quarter would have been $0.33, down 15.4% compared with the fourth quarter of 2007. The total positive impact due to the stronger Canadian dollar in the fourth quarter of 2008 compared to the same period last year was approximately $0.09 per share.
Cash flow after changes in working capital for the fourth quarter was $169.0 million, down from cash flow of $221.3 million generated in the same period last year. Strong demand, particularly in South America, from mining customers resulted in increased investments in inventory for committed orders for deliveries in early 2009. Working capital demands stabilized in the fourth quarter of 2008 and, combined with initiatives to improve cash cycle times, have resulted in the improvement in cash flow after changes in working capital in the fourth quarter of 2008 (generation of $169.0 million) compared to the third quarter of 2008 (generation of $84.1 million).
Annual 2008 Results
On an annual basis, revenue from continuing operations increased by 5.8% to almost $6 billion. EBIT of $236.7 million from continuing operations in 2008 included certain items that are considered by the Company to be non-recurring. These items, which totalled $169.1 million, included a non-cash goodwill impairment charge, costs related to the integration and transition of Collicutt Energy Services Inc. (Collicutt), business support and depot restructuring costs in the U.K., restructuring costs incurred globally by Finning in the fourth quarter of 2008 in light of the current market conditions, and the gains on the sale of certain properties at Hewden. Adjusting for these non-recurring items, EBIT for 2008 would have been $405.8 million, 11.0% lower than the prior year.
• Annual revenue was up 9.6% at the Company’s Canadian operations, reflecting growth in most lines of business, particularly new equipment sales and customer support services. Adjusting for non-recurring costs related to the transition and integration of Collicutt and restructuring costs, EBIT from Finning’s Canadian reporting segment would have been $255.1 million for 2008, down 10.9% from 2007. The results of 2008 were negatively impacted by higher variable operating costs, in part to support the growth in the Alberta oil sands, and costs related to the design of a new information technology system.
Finning International Inc. Fourth Quarter and Annual 2008 Results
4
• For the year ended December 31, 2008, revenues from the Company’s South American operations were at record levels. Finning South America’s revenues increased 13.3% (12.7% increase in functional currency) over last year, most notably in customer support services, new equipment sales, and rentals. Annual EBIT for 2008 of $148.2 million was 16.3% higher compared to 2007 (17.9% in functional currency).
• Annual revenues from the UK Group decreased 9.1% in 2008 compared with last year (1.0% decrease in local currency), and EBIT decreased 26.6% (22.3% in local currency). Adjusting for the restructuring costs related to the business support integration, depot closures, and restructuring noted above, net of the gain on the sale of properties, EBIT from continuing operations for 2008 would have been 31.9% lower than the comparable period in 2007. The results from Hewden were lower than the prior year, in part due to the significant operational changes experienced in the second half of the year.
Consolidated net income from continuing operations in 2008 was $96.0 million compared with $280.1 million in 2007. Adjusting for the non-recurring items noted above, net income from continuing operations would have been $257.8 million, 8.0% lower than 2007 results.
Basic EPS from continuing operations for the year ended December 31, 2008 of $0.56 included the non-recurring items described above. Adjusting the 2008 results for these non-recurring items, including the goodwill impairment charge, basic EPS would have been $1.50 for the year ended December 31, 2008 compared with $1.57 in 2007, a decrease of 4.5%. The total negative impact due to the stronger Canadian dollar in 2008 compared to the prior year was approximately $0.10 per share.
Cash flow after changes in working capital for the year ended December 31, 2008 was $278.1 million, compared with cash flow of $404.4 million generated in 2007. Throughout all operations, management continues to focus on improving cash cycle times and operating efficiencies while ensuring appropriate levels of working capital exist to support current activity levels.
The Company made a net investment in rental assets of $204.8 million in 2008, which was less than half of what was invested in 2007. As a result of softening demand, rental investment moderated in 2008 compared to the very high demand for rental assets in 2007, particularly at the Company’s Canadian and Hewden operations.
As a result of these items, cash flow provided by operating activities was $72.7 million in 2008 compared to cash flow used by operating activities of $56.7 million in 2007.
Important New Business
In December 2008, Finning announced that its South American mining division secured a sale of six 793 mining trucks to Minera Argentina Gold, a subsidiary of Barrick Gold Corporation and operator of the Veladero gold mine in Argentina. Finning also secured a one year extension on its Maintenance and Repair Contract (MARC) with Minera Argentina Gold that covers 28 existing 793 mining trucks and 18 pieces of support equipment. The combined value of these deals is approximately $70 million. The new trucks will be delivered in the first quarter of 2009 and used in the existing operations at the Veladero mine. The Veladero mine is located approximately 320 kilometres northwest of the city of San Juan in Argentina, close to the Chilean border.

Finning International Inc. Fourth Quarter and Annual 2008 Results
5
Executive Appointment
Mr. David S. Smith has been appointed Executive Vice President and Chief Financial Officer of Finning International Inc. effective February 2, 2009. Mr. Smith was Chief Financial Officer of Ballard Power Systems Inc. since December 2002 and was Ballard's Vice President, Controller from October, 2000. Immediately prior to joining Ballard, he spent 16 years with Placer Dome Inc. in various senior positions, including Vice President, Corporate Relations, Vice President, Business Development, and as regional Vice President and Chief Financial Officer in the United States, Chile, and Canada. Mr. Smith also was with Price Waterhouse for four years in the United States, is a Certified Public Accountant and holds a Bachelor of Science, Business Administration, from California State University, Sacramento.
Director Appointment
In December 2008, The Honourable David Emerson was appointed to the Board of Directors. Mr. Emerson has extensive senior leadership experience in business, as an elected Member of Parliament and in the Canadian Federal Cabinet. Mr. Emerson has held senior positions in government that include Minister of Foreign Affairs, Minister of Industry, Minister of International Trade and Minister for Pacific Gateway and Vancouver - Whistler Olympics. In British Columbia he served as Deputy Minister of Finance, Deputy Minister to the Premier and President of the British Columbia Trade Development Corporation. Mr. Emerson also held executive leadership roles in the private sector including President and CEO of Canfor Corporation, President and CEO of the Vancouver International Airport Authority and Chairman and CEO of Canadian Western Bank. Mr. Emerson received his doctorate degree in economics from Queen's University and also attended the University of Alberta where he obtained his bachelor's and master's degrees in economics.
Common Share Dividend
The Board of Directors approved the Company’s quarterly dividend at $0.11 per common share, payable on March 18, 2009, to shareholders of record on March 4, 2009.
For more information
Please call Tom Merinsky, Vice President, Investor Relations & Corporate Affairs Phone: (604) 331-4950 Email: [email protected]

Finning International Inc. Fourth Quarter and Annual 2008 Results
6
Fourth Quarter / Annual Results Conference Call Management will hold an investor conference call on Wednesday, February 18, 2009 at 3:30 pm Eastern Time. Dial-in numbers:
1-866-898-9626 (anywhere within Canada and the US) (416) 340-2216 (for participants dialing from Toronto and overseas)
The call will be webcast live at http://www.finning.com/investors/investors.aspx and subsequently archived on the Finning website. Playback recording will be available at 1-800-408-3053 from 6:00 pm Eastern Time on February 18, 2009 until the end of business day on February 25, 2009. The passcode to access the playback recording is 3280317 followed by the number sign.
About Finning International
Finning International Inc. sells, rents, and provides customer support services for Caterpillar equipment and engines, and complementary equipment, in Western Canada (Alberta, British Columbia, the Northwest Territories and the Yukon Territory and a portion of Nunavut), the U.K. and South America (Argentina, Bolivia, Chile and Uruguay). Headquartered in Vancouver, B.C., Canada, Finning International Inc. (www.finning.com) is a widely held, publicly traded corporation, listed on the Toronto Stock Exchange (symbol FTT). Complete financial statements and Management’s Discussion and Analysis can be accessed at www.finning.com.
Forward-Looking Disclaimer
This report (including the attached Management’s Discussion and Analysis) contains forward-looking statements and information, which reflect the current view of Finning International Inc. with respect to future events and financial performance. Any such forward-looking statements are subject to risks and uncertainties and Finning's actual results of operations could differ materially from historical results or current expectations. Finning assumes no obligation to publicly update or revise its forward-looking statements even if experience or future changes make it clear that any projected results expressed or implied therein do not materialize.
Refer to Finning's annual report, management information circular, annual information form and other filings with Canadian securities regulators, which can be found at www.sedar.com, for further information on risks and uncertainties that could cause actual results to differ materially from forward-looking statements contained in this report.
Next Quarterly Results May 14, 2009
Finning International’s first quarter for 2009 will be released and an investor conference call will be held on May 14, 2009.
Annual General Meeting
The Company’s annual general meeting will be held at the Terminal City Club, 837 West Hastings Street, Vancouver, British Columbia, at 10:00 am Pacific Time on Thursday May 14, 2009.

Finning International Inc. Fourth Quarter and Annual 2008 Results
7
MANAGEMENT’S DISCUSSION AND ANALYSIS This discussion and analysis of the financial results of Finning International Inc. (Finning or the Company) should be read in conjunction with the consolidated financial statements and accompanying notes. The results reported herein have been prepared in accordance with Canadian generally accepted accounting principles (GAAP) and are presented in Canadian dollars unless otherwise stated. Additional information relating to the Company, including the Company’s Annual Information Form, can be found on the SEDAR (System for Electronic Disclosure and Retrieval) website at www.sedar.com.
Results of Operations The results from continuing operations include those of acquired businesses from the date of their purchase and exclude results from operations that have been disposed or are classified as discontinued. Results of operations from businesses that qualified as discontinued operations in 2007 have been reclassified to that category in 2007 and prior periods presented unless otherwise noted. Please see the section entitled “Discontinued Operations – Tool Hire Division” for a discussion of these operations. Fourth Quarter Overview
Q4 2008 Q4 2007 Q4 2008 Q4 2007 ($ millions) (% of revenue) Revenue $ 1,566.7 $ 1,459.5
Gross profit 432.2 408.9 27.6% 28.0%
Selling, general & administrative expenses (348.7) (297.5) (22.3)% (20.4)%
Other income (expenses) (16.6) 0.8 (1.0)% 0.1%
66.9 112.2 4.3% 7.7%
Goodwill impairment (151.4) — (9.7)% —
Earnings from continuing operations before interest and income taxes (EBIT) (1) (84.5) 112.2 (5.4)% 7.7%
Finance costs (21.7) (18.9) (1.4)% (1.3)%
Provision for income taxes (0.6) (22.8) (0.0)% (1.6)%
Net income $ (106.8) $ 70.5 (6.8)% 4.8%
(1) EBIT as defined above and referred to throughout this Management’s Discussion and Analysis (MD&A) does not have a standardized meaning under generally accepted accounting principles. For a reconciliation of this amount to net income from continuing operations, see the heading “Description of Non-GAAP Measure” in this MD&A.
Revenue by Operation ($ millions) Three months ended December 31
750
.3
348
.0
361
.2
27
6.4
46
4.3
826.
0
0
500
1,000
Canada South America UK Group
2007 2008
Fourth quarter consolidated revenues from continuing operations of almost $1.6 billion increased 7.3% from the fourth quarter of 2007 and were the highest quarterly revenues ever recorded by Finning. Finning achieved record quarterly revenues driven primarily by strong demand for customer support services, particularly in Canada and South America.
Revenues from the Company’s Canadian operations increased 10.1% in the fourth quarter of 2008 compared with the same period last year, primarily reflecting strong revenues from customer support

Finning International Inc. Fourth Quarter and Annual 2008 Results
8
services. The increase in customer support services revenues was primarily due to servicing the steadily increasing number of Caterpillar units in the Company’s Canadian dealership territory and the accompanying demand for Caterpillar parts. The Canadian operations’ revenues also reflected solid market demand and growth in the mining sector, particularly in the Alberta oil sands. Revenues from the Company’s South American operations increased 33.4% compared with the fourth quarter of 2007 driven primarily by higher customer support services and increased equipment sales in the mining sector. Foreign exchange also had a positive impact on revenues. Excluding the impact of foreign exchange when translating results, revenues for the fourth quarter of 2008 in functional currency (the U.S. dollar) increased by 8.0% in the Company’s South American operations over the fourth quarter of 2007. In the U.K., revenues were down 23.5% over 2007 driven primarily by reduced new equipment sales and lower rental activity in the Hewden rental business, partially offset by higher customer support services revenues experienced at the Company’s UK dealership. In local currency, revenues were 19.3% lower when compared to last year’s fourth quarter.
Revenue by Line of Business ($ millions) Three months ended December 31
7.4
393.
8
188.
0
117.
1
142.
9
610.
3
4.6
123.
5
172.
6
134.
5
506.
7624.
8
0
350
700
NewEquip
Power &Energy
UsedEquip
EquipRental
CSS Other
2007 2008
From a line of business perspective, strong demand continued in the fourth quarter of 2008 for customer support services, dominating the revenue growth with an increase of 28.7% over the same period in 2007. Recent strong demand for equipment in the mining and infrastructure sectors has resulted in an increase in demand for customer support services in order to service the larger population of equipment. Used equipment revenues were slightly higher in the fourth quarter of 2008 and typically vary depending on product availability, customer buying preferences, and exchange rate considerations. Lower rental revenues in the fourth quarter of 2008 reflected the lower rental activity in the Hewden rental business.
Revenue mix in the fourth quarter of 2008 was weighted more towards customer support services as the Company services the large population of equipment sold to customers. Customer support services revenues made up 32.3% of total revenues in the fourth quarter of 2008, compared with 27.0% of total revenues in the same period last year.
Finning’s global order book or backlog (the retail value of new equipment units ordered by customers for future deliveries) continues to be strong at $1.5 billion at the end of the fourth quarter of 2008, although is lower than the December 2007 level of $1.7 billion and the September 2008 level of $2.0 billion. Backlog and new orders were down in all operations, reflecting the worldwide economic slowdown. The Company has proactively reconfirmed orders with customers to support the balances in the backlog. Finning has reduced and cancelled certain equipment orders with Caterpillar without any penalty.
The Company is dependent on Caterpillar Inc. (Caterpillar) for the timely supply of parts and equipment to fulfill its deliveries and meet the requirements of the Company’s service maintenance contracts. Availability of equipment has improved overall, and Finning continues to work closely with Caterpillar and customers to ensure that demand for parts and equipment can be met. Although Caterpillar has recently announced significant layoffs, this is not expected to impact the timely delivery of equipment on order.

Finning International Inc. Fourth Quarter and Annual 2008 Results
9
Gross profit of $432.2 million in the fourth quarter of 2008 increased 5.7% over the same period last year. As a percentage of revenue, gross profit for the quarter was 27.6%, down slightly when compared with 28.0% achieved in the fourth quarter of 2007. The lower gross profit as a percentage of revenue (gross profit margin) on a consolidated basis was primarily due to lower rental and used equipment margins. The Canadian operations earned a higher gross profit margin primarily due to price realization from customer support services. The South American operations experienced lower gross profit margins primarily due to lower margins earned on certain new equipment sales. Gross profit margin for the UK Group was lower when compared to the prior year’s quarter due to lower margins earned by the rental business in the U.K. This was partially offset by a higher gross profit margin achieved by the UK dealership, due to a higher proportion of revenues from customer support services, which typically have higher margins.
The Company performed its annual goodwill impairment review in the fourth quarter of 2008 and determined that the fair value of Hewden Stuart Plc (Hewden) was less than its book value, which included goodwill recorded on acquisition. This determination resulted from a decline in market multiples and a reduction of fair value as determined using a discounted cash flow methodology due to a change in assumptions in order to reflect current market conditions. This resulted in a full goodwill impairment charge of $151.4 million for Hewden in the fourth quarter of 2008. The goodwill impairment charge is non-cash in nature and does not affect the Company’s liquidity, cash flows from operating activities, or debt covenants and is not expected to have any adverse impact on future operations. The Company expects no income tax deduction from this charge. A further discussion regarding the non-cash goodwill impairment charge can be found in the Goodwill Impairment section of this MD&A.
EBIT by Operation ($ millions) Three months ended December 31
28.2
69.
3
16.
1
(9.7
)
38.34
7.1
(10)
30
70
Canada South Am erica UK Group
2007 2008
Excluding other operations – corporate head office and goodwill impairment
Earnings from continuing operations before interest and income taxes (EBIT) for the fourth quarter of 2008 were a loss of $84.5 million. EBIT in the fourth quarter of 2008 included certain costs which are considered by the Company to be non-recurring. These items, which totalled $166.4 million, included the goodwill impairment charge relating to Hewden, restructuring costs in connection with the business support integration in the U.K., and costs incurred related to the restructuring of Hewden’s nationwide depot network, with the closure or merger of 22 depots. In addition, in response to deteriorating global market conditions, Finning undertook certain actions that resulted in restructuring charges in the fourth quarter of 2008. Excluding these restructuring costs and goodwill impairment, EBIT would have been $81.9 million, 27.0% lower than the fourth quarter of 2007.
The lower EBIT in the fourth quarter of 2008 was primarily due to costs incurred in the design and implementation of a new global information technology system to benefit future periods as well as higher variable operating costs to support the increased level of activity anticipated in the near future for deliveries and product support. In addition, long-term incentive plan (LTIP) charges were $11.0 million higher in the fourth quarter of 2008 compared to the same period in 2007. The mark-to-market impact on the valuation of certain stock-based compensation was fully hedged in 2008, whereas the fourth quarter of 2007 included a favourable unhedged mark-to-market impact.
The Company’s EBIT margin (EBIT divided by revenues), excluding the restructuring costs and goodwill impairment charge noted above, was 5.2% in the fourth quarter of 2008, down from 7.7 % earned in the fourth quarter of 2007.

Finning International Inc. Fourth Quarter and Annual 2008 Results
10
Consolidated net loss from continuing operations for the quarter was $106.8 million compared with net income of $70.5 million for the same period in 2007. Adjusting for the restructuring costs and goodwill impairment noted above, net income from continuing operations would have been $55.9 million.
Basic loss per share from continuing operations for the quarter was 0.63. Excluding the restructuring costs and goodwill impairment charge, basic earnings per share (EPS) was $0.33 compared with $0.40 in the same period last year, a decrease of 17.5%. The total positive impact due the stronger Canadian dollar in the fourth quarter of 2008 compared to the same period last year was approximately $0.09 per share.
Cash Flow
Cash flow after changes in working capital for the fourth quarter was $169.0 million, down from cash flow of $221.3 million generated in the same period last year. Strong demand, particularly in South America, from mining customers resulted in increased investments in inventory for committed orders that will be delivered in early 2009. Working capital demands have stabilized in the fourth quarter of 2008 and, combined with initiatives to improve cash cycle times, have resulted in the improvement in cash flow after changes in working capital in the fourth quarter of 2008 (generation of $169.0 million) compared to the third quarter of 2008 (generation of $84.1 million).
The Company generated proceeds on the disposal of rental assets in excess of additions in the amount of $8.4 million in the fourth quarter of 2008, compared with a net investment in rental assets of $14.2 million in the same period in 2007. With lower utilization of rental assets in 2008, asset additions were moderated and underutilized assets were sold.
As a result of these items, cash flow from operating activities was $177.2 million in the fourth quarter of 2008 compared to $207.3 million in the fourth quarter of 2007. The cash flow generated in the fourth quarter of 2008 compares favourably to the previous three quarters in 2008.
During the fourth quarter of 2008, under the normal course issuer bid in place, the Company repurchased and cancelled 934,996 common shares at an average price of $18.68 for an aggregate amount of $17.5 million. During the fourth quarter of 2007, the Company repurchased and cancelled 2,465,200 common shares at an average price of $27.31 for an aggregate amount of $67.3 million.
Finning International Inc. Fourth Quarter and Annual 2008 Results
11
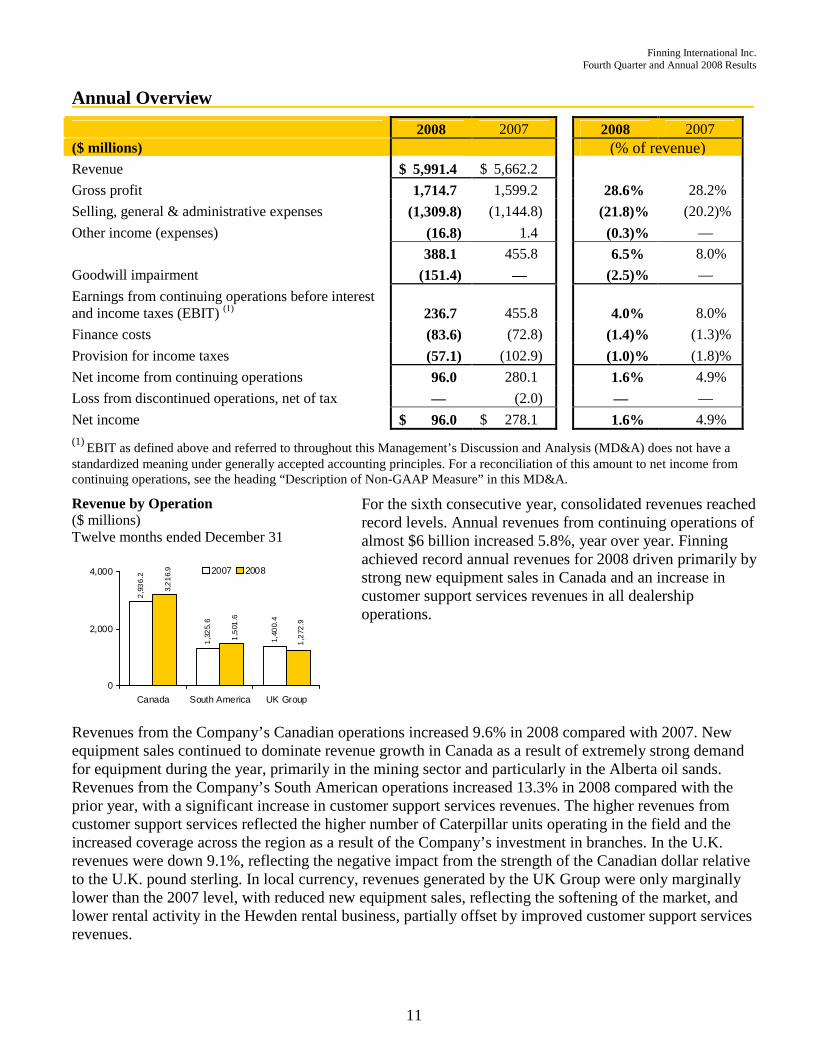
Annual Overview
2008 2007 2008 2007 ($ millions) (% of revenue) Revenue $ 5,991.4 $ 5,662.2
Gross profit 1,714.7 1,599.2 28.6% 28.2%
Selling, general & administrative expenses (1,309.8) (1,144.8) (21.8)% (20.2)%
Other income (expenses) (16.8) 1.4 (0.3)% —
388.1 455.8 6.5% 8.0%
Goodwill impairment (151.4) — (2.5)% —
Earnings from continuing operations before interest and income taxes (EBIT) (1) 236.7 455.8 4.0% 8.0%
Finance costs (83.6) (72.8) (1.4)% (1.3)%
Provision for income taxes (57.1) (102.9) (1.0)% (1.8)%
Net income from continuing operations 96.0 280.1 1.6% 4.9%
Loss from discontinued operations, net of tax — (2.0) — —
Net income $ 96.0 $ 278.1 1.6% 4.9% (1) EBIT as defined above and referred to throughout this Management’s Discussion and Analysis (MD&A) does not have a standardized meaning under generally accepted accounting principles. For a reconciliation of this amount to net income from continuing operations, see the heading “Description of Non-GAAP Measure” in this MD&A.
Revenue by Operation ($ millions) Twelve months ended December 31
2,9
36
.2
1,3
25.
6
1,40
0.4
1,2
72.9
1,5
01.6
3,2
16.
9
0
2,000
4,000
Canada South America UK Group
2007 2008
For the sixth consecutive year, consolidated revenues reached record levels. Annual revenues from continuing operations of almost $6 billion increased 5.8%, year over year. Finning achieved record annual revenues for 2008 driven primarily by strong new equipment sales in Canada and an increase in customer support services revenues in all dealership operations.
Revenues from the Company’s Canadian operations increased 9.6% in 2008 compared with 2007. New equipment sales continued to dominate revenue growth in Canada as a result of extremely strong demand for equipment during the year, primarily in the mining sector and particularly in the Alberta oil sands. Revenues from the Company’s South American operations increased 13.3% in 2008 compared with the prior year, with a significant increase in customer support services revenues. The higher revenues from customer support services reflected the higher number of Caterpillar units operating in the field and the increased coverage across the region as a result of the Company’s investment in branches. In the U.K. revenues were down 9.1%, reflecting the negative impact from the strength of the Canadian dollar relative to the U.K. pound sterling. In local currency, revenues generated by the UK Group were only marginally lower than the 2007 level, with reduced new equipment sales, reflecting the softening of the market, and lower rental activity in the Hewden rental business, partially offset by improved customer support services revenues.

Finning International Inc. Fourth Quarter and Annual 2008 Results
12
Revenue by Line of Business ($ millions) Twelve months ended December 31
25.
7
1,70
1.2
781.
2
417.
6
503.
0
2,23
3.5
18.7
431.
8
712.
8
551
.7
1,89
9.52,37
6.9
0
1,500
3,000
NewEquip
Power &Energy
UsedEquip
EquipRental
CSS Other
2007 2008
From a line of business perspective, strong demand continued in 2008 for new equipment and customer support services. These two lines of business comprised 71.4% of consolidated revenues in 2008, compared with 69.5% in 2007. The demand from the mining and infrastructure sectors for new equipment was high in 2008, and customer support services have increased to service the larger population of equipment, particularly in South America. This is expected to continue into 2009 as the population of equipment in the Company’s territories increased in 2008. The increase in customer support services revenues occurred in spite of no longer earning any revenues from the fuels and lubricants distribution business with Shell Canada which was terminated in the fourth quarter of 2007. Excluding the revenues from the Shell business in 2007, customer support services revenues were 17.5% higher in 2008 compared with the prior year. Lower rental revenues in 2008 reflected the lower rental activity in the Hewden rental business.
Gross profit of $1,714.7 million in 2008 increased 7.2% over 2007 and was also slightly higher as a percentage of revenue. The gross profit margin (gross profit divided by revenues) in the Canadian operations for 2008 was higher when compared to the prior year. This resulted primarily from higher margins earned on customer support services, partially offset by the shift in revenue mix to lower margined new equipment sales. South America contributed a higher gross profit margin due to its revenue mix shift towards higher margined customer support services. The UK Group had a lower gross profit margin, reflecting lower rental utilization rates earned from the UK rental business partially offset by higher gross profit margins earned on customer support services from the UK dealership.
EBIT by Operation – continuing operations ($ millions) Twelve months ended December 31
127
.4
286
.3
73.
0
53.6
148
.2
234
.5
0
150
300
Canada South America UK Group
2007 2008
Excluding other operations – corporate head office and goodwill impairment
EBIT was $236.7 million in 2008. Results in 2008 included certain items that are considered by the Company to be non-recurring. These items, which totalled $169.1 million, included the Hewden goodwill impairment, costs related to the integration and transition of Collicutt, business support and depot restructuring costs in the U.K., restructuring costs incurred globally by Finning in the fourth quarter of 2008 in light of the current market conditions partially offset by the gains on the sale of certain properties in Hewden. Adjusting for these non-recurring items, EBIT for 2008 would have been $405.8 million, 11.0% lower than the prior year.
The lower EBIT in 2008 can be attributed to a stronger Canadian dollar, on average for the year, and higher variable operating costs to support the increased level of activity that was anticipated for deliveries and product support through to the end of the year. Forecasted activity levels are being adjusted to take into account current global market conditions and actions have been taken by the Company globally to respond to the deteriorating economic conditions. The reduction in EBIT was partially offset by LTIP charges that were $8.6 million lower in 2008 compared with the same period in 2007. Mark-to-market

Finning International Inc. Fourth Quarter and Annual 2008 Results
13
volatility was significantly reduced in 2008 through a compensation hedge, the cost of which is reported in the Other operating unit.
Consolidated net income from continuing operations in 2008 was $96.0 million compared with $280.1 million in 2007. Adjusting for the non-recurring items noted above, net income from continuing operations would have been $257.8 million, 8.0% lower than the 2007 level.
Basic EPS from continuing operations for the year ended December 31, 2008 of $0.56 included a number of non-recurring items as described above. Adjusting the 2008 results for these non-recurring items, including the goodwill impairment charge, basic EPS would have been $1.50 for the year ended December 31, 2008 compared with $1.57 in 2007, a decrease of 4.5%. The total negative impact due to the stronger Canadian dollar in 2008 compared to the prior year was approximately $0.10 per share.
Cash Flow After Changes in Working Capital
Cash flow after changes in working capital for the year ended December 31, 2008 was $278.1 million, compared with cash flow of $404.4 million generated in 2007. Throughout all operations, management continues to focus on improving cash cycle times and operating efficiencies while ensuring appropriate levels of working capital exist to support current activity levels.
The Company made a net investment in rental assets of $204.8 million in 2008, which was less than half of what was invested in 2007. As a result of softening demand, rental investment moderated in 2008 compared to the very high demand for rental assets in 2007, particularly at the Company’s Canadian and Hewden operations.
As a result of these items, cash flow provided by operating activities was $72.7 million in 2008 compared to cash flow used by operating activities of $56.7 million in 2007.
For the year ended December 31, 2008, under a share repurchase program, the Company repurchased and cancelled 5,901,842 common shares at an average price of $24.99 for an aggregate amount of $147.5 million. For the year ended December 31, 2007, the Company repurchased and cancelled 3,691,400 common shares at an average price of $27.82 for an aggregate amount of $102.7 million.
Foreign Exchange
The Company’s reporting currency is the Canadian dollar. However, due to the geographical diversity of the Company’s operations, a significant portion of revenue and operating expenses are in a different currency. The most significant currencies in which the Company transacts business are the Canadian dollar, the U.S. dollar, and the U.K. pound sterling. The most significant foreign exchange impact on the Company’s net income is the translation of foreign currency based earnings into Canadian dollars.
Compared to the fourth quarter of 2007, foreign exchange had a positive impact of approximately $150 million on consolidated revenues earned by the Company in the fourth quarter of 2008 compared to the prior year due to the 23.5% weaker Canadian dollar relative to the U.S. dollar, partially offset by a 5.3% stronger Canadian dollar relative to the U.K. pound sterling. As a result, net income was positively impacted by approximately $0.09 per share in the fourth quarter of 2008 compared to the same period last year.
Net income was negatively impacted by approximately $0.10 per share in 2008 compared to the year ended December 31, 2007 as the Canadian dollar was marginally stronger (0.8%) in 2008 relative to the U.S. dollar, and 8.7% stronger relative to the U.K. pound sterling.
The impact of foreign exchange due to the movement of the Canadian dollar relative to the U.S. dollar and the U.K. pound sterling is expected to continue to affect Finning’s results in 2009. The sensitivity of the Company’s net earnings to fluctuations in the average annual foreign exchange rates is summarized on page 32.
Finning International Inc. Fourth Quarter and Annual 2008 Results
14
The following tables provide details of revenue and EBIT contribution by operation and the foreign exchange impact for the three and twelve months ended December 31, 2008.
Three months ended December 31 ($ millions) Canada
South America
UK Group Consolidated
Revenues – Q4 2007 $ 750.3 $ 348.0 $ 361.2 $ 1,459.5 Foreign exchange impact 79.7 80.7 (9.0) 151.4 Operating revenue increase (decrease) (4.0) 35.6 (75.8) (44.2) Revenues – Q4 2008 $ 826.0 $ 464.3 $ 276.4 $ 1,566.7
Total revenue increase (decrease) $ 75.7 $ 116.3 $ (84.8) $ 107.2 - percentage increase (decrease) 10.1% 33.4% (23.5)% 7.3% - percentage increase, excluding foreign exchange (0.5)% 10.2% (21.0)% (3.0)%
Twelve months ended December 31 ($ millions) Canada
South America
UK Group Consolidated
Revenues – 2007 Annual $ 2,936.2 $ 1,325.6 $ 1,400.4 $ 5,662.2 Foreign exchange impact (78.7) 6.9 (112.8) (184.6) Operating revenue increase (decrease) 359.4 169.1 (14.7) 513.8 Revenues – 2008 Annual $ 3,216.9 $ 1,501.6 $ 1,272.9 $ 5,991.4
Total revenue increase (decrease) $ 280.7 $ 176.0 $ (127.5) $ 329.2 - percentage increase (decrease) 9.6% 13.3% (9.1)% 5.8% - percentage increase, excluding foreign exchange 12.2% 12.8% (1.0)% 9.1%
Three months ended December 31 ($ millions) Canada
South America
UK Group Other
Goodwill Impairment Consolidated
EBIT – Q4 2007 $ 69.3 $ 28.2 $ 16.1 $ (1.4) $ — $ 112.2 Foreign exchange impact 8.9 12.4 (0.2) — — 21.1 Operating EBIT increase (decrease) (31.1) (2.3) (25.6) (7.4) (151.4) (217.8) EBIT – Q4 2008 $ 47.1 $ 38.3 $ (9.7) $ (8.8) $ (151.4) $ (84.5)
Total EBIT increase (decrease) $ (22.2) $ 10.1 $ (25.8) $ (7.4) $ (151.4) $ (196.7) - percentage increase (decrease) (32.0)% 35.8% (160.2)% — — (175.3)% - percentage increase (decrease),
excluding foreign exchange (44.9)% (8.2)% (159.0)% — — (194.1)%
Twelve months ended December 31 ($ millions) Canada
South America
UK Group Other
Goodwill Impairment Consolidated
EBIT – 2007 Annual $ 286.3 $ 127.4 $ 73.0 $ (30.9) $ — $ 455.8 Foreign exchange impact (18.1) (2.5) (5.2) — — (25.8) Operating EBIT increase (decrease) (33.7) 23.3 (14.2) (17.3) (151.4) (193.3) EBIT – 2008 Annual $ 234.5 $ 148.2 $ 53.6 $ (48.2) $ (151.4) $ 236.7
Total EBIT increase (decrease) $ (51.8) $ 20.8 $ (19.4) $ (17.3) $ (151.4) $ (219.1) - percentage increase (decrease) (18.1)% 16.3% (26.6)% — — (48.1)% - percentage increase (decrease),
excluding foreign exchange (11.8)% 18.3% (19.5)% — — (42.4)%
Results by Business Segment
The Company and its subsidiaries operate primarily in one principal business, that being the selling, servicing, and renting of heavy equipment and related products in various markets worldwide as noted below. Finning’s operating units are as follows:
• Canadian operations: British Columbia, Alberta, the Yukon Territory, the Northwest Territories, and a portion of Nunavut.
• South American operations: Chile, Argentina, Uruguay and Bolivia. • UK Group operations: England, Scotland, Wales, Falkland Islands, and the Channel Islands • Other: corporate head office.

Finning International Inc. Fourth Quarter and Annual 2008 Results
15
The table below provides details of revenue by operations and lines of business for continuing operations. For year ended December 31, 2008 ($ millions) Canada South America
UK Group Consolidated
Revenue percentage
New mobile equipment $ 1,464.9 $ 575.9 $ 336.1 $ 2,376.9 39.7% New power & energy systems 205.7 161.7 184.3 551.7 9.2% Used equipment 252.8 37.2 141.8 431.8 7.2% Equipment rental 296.6 58.8 357.4 712.8 11.9% Customer support services 981.8 664.4 253.3 1,899.5 31.7% Other 15.1 3.6 — 18.7 0.3%
Total $ 3,216.9 $ 1,501.6 $ 1,272.9 $ 5,991.4 100.0%
Revenue percentage by operations 53.7% 25.1% 21.2% 100.0% For year ended December 31, 2007 ($ millions) Canada
South America
UK Group Consolidated
Revenue percentage
New mobile equipment $ 1,253.2 $ 574.4 $ 405.9 $ 2,233.5 39.4%
New power & energy systems 194.9 108.7 199.4 503.0 8.9%
Used equipment 269.3 42.8 105.5 417.6 7.4%
Equipment rental 290.1 46.6 444.5 781.2 13.8%
Customer support services 905.8 550.3 245.1 1,701.2 30.0%
Other 22.9 2.8 — 25.7 0.5%
Total $ 2,936.2 $ 1,325.6 $ 1,400.4 $ 5,662.2 100.0%
Revenue percentage by operations 51.9% 23.4% 24.7% 100.0%
The table below provides selected income statement information by business segment for continuing operations: For year ended December 31, 2008 ($ millions) Canada
South America
UK Group Other
Goodwill Impairment Consolidated
Revenue from external sources $ 3,216.9 $ 1,501.6 $ 1,272.9 $ — $ — $ 5,991.4 Operating costs (2,801.8) (1,313.8) (1,099.8) (46.7) — (5,262.1) Depreciation and amortization (164.5) (34.2) (125.5) (0.2) — (324.4) Other income (expenses) (16.1) (5.4) 6.0 (1.3) — (16.8) Goodwill impairment — — — — (151.4) (151.4)
Earnings before interest and taxes $ 234.5 $ 148.2 $ 53.6 $ (48.2) $ (151.4) $ 236.7
Earnings before interest and tax
- percentage of revenue 7.3% 9.9% 4.2% — — 4.0% - percentage by operations (excluding
goodwill) 60.4% 38.2% 13.8% (12.4)% — 100% For year ended December 31, 2007 ($ millions) Canada
South America
UK Group Other
Goodwill Impairment Consolidated
Revenue from external sources $ 2,936.2 $ 1,325.6 $ 1,400.4 $ — $ — $ 5,662.2
Operating costs (2,486.0) (1,171.7) (1,191.3) (30.9) — (4,879.9)
Depreciation and amortization (165.5) (25.9) (136.5) — — (327.9)
Other income (expenses) 1.6 (0.6) 0.4 — — 1.4
Earnings before interest and taxes $ 286.3 $ 127.4 $ 73.0 $ (30.9) $ — $ 455.8
Earnings before interest and tax
- percentage of revenue 9.8% 9.6% 5.2% — — 8.0%
- percentage by operations 62.8% 28.0% 16.0% (6.8)% — 100%

Finning International Inc. Fourth Quarter and Annual 2008 Results
16
Canadian Operations
The Canadian operating segment primarily reflects the results of the Company’s operating division, Finning (Canada). This reporting segment also includes the Company’s interest in OEM Remanufacturing Company Inc. (OEM), which is separately managed from Finning (Canada), and a 25% interest in PipeLine Machinery International (PLM). On January 15, 2008, Finning (Canada) acquired the issued and outstanding common shares of Collicutt, a leading Canadian oilfield service company. The results of Collicutt’s operations have been included in the consolidated financial statements since the acquisition date.
The table below provides details of the results from the Canadian operating segment:
For years ended December 31 ($ millions) 2008 2007 Revenue from external sources $ 3,216.9 $ 2,936.2 Operating costs (2,801.8) (2,486.0) Depreciation and amortization (164.5) (165.5) Other income (expenses) (16.1) 1.6 Earnings before interest and taxes $ 234.5 $ 286.3 Earnings before interest and taxes (EBIT) - as a percentage of revenue 7.3% 9.8% - as a percentage of consolidated EBIT (excluding goodwill impairment) 60.4% 62.8%
Canada – Revenue by Line of Business ($ millions) Twelve months ended December 31
1,2
53.
2
19
4.9
269
.3
29
0.1
905
.8
22.
9
1,4
64.
9
981
.8
205.
7
296.
6
252
.8
15
.1
0
750
1,500
New Equip Power &Energy
U sedEquip
EquipR ental
CSS Other
2007 2008
Record revenues were achieved in the Company’s Canadian operations in 2008. Revenues increased 9.6% over the 2007 levels to $3,216.9 million. Revenues from most lines of business in Canada increased over 2007 levels, most notably in new equipment sales and customer support services.
The increase in new equipment revenues was primarily attributable to strong market demand and growth in the mining sectors, particularly the Alberta oil sands.
New equipment orders from customers declined during the last quarter of 2008, reflecting the current slowdown in the global economy and as a result, the backlog in Finning (Canada) is lower than the September 2008 level. Finning (Canada) has reduced and cancelled certain orders with Caterpillar as a result of the slowdown. However, the backlog continues to reflect future deliveries to the mining sector, which is the key strategic sector for Finning’s Canadian operations. Although global economic conditions are currently weaker in most sectors, activity in mining is expected to partially counter weakness in other market areas.
Higher revenues from customer support services were primarily a result of servicing the steadily increasing population of Caterpillar units in the Company’s Canadian dealership territory and the accompanying demand for Caterpillar parts. This increase in revenues occurred in spite of no longer earning any revenues from the fuels and lubricants distribution business with Shell Canada which was terminated in the fourth quarter of 2007. Revenues from the Shell business were approximately $84 million in 2007.

Finning International Inc. Fourth Quarter and Annual 2008 Results
17
Used equipment revenues are approximately 6% lower than the prior year, reflecting the slowdown in the general economy. Rental revenues increased over 2007 as a result of strong customer demand in this sector, particularly in the last quarter of the year. Finning (Canada) increased the number of the Company’s Cat Rental Stores in operation in Western Canada to 37 at December 31, 2008, compared with 34 stores at December 31, 2007.
Revenues from the Company’s 25% investment in PipeLine Machinery International (PLM) increased 32% over the prior year to $111.0 million. While the majority of revenues were earned in North America, PLM has experienced growth in international activity.
In Canada, overall gross profit as a percentage of revenue was slightly up compared to the prior year. This reflects higher margins from customer support services, primarily due to price realization, partially offset by lower margins earned on the sale of used equipment.
Selling, general, and administrative (SG&A) costs in 2008 increased both in absolute dollars and as a percentage of revenue compared with 2007. The higher costs in 2008 were primarily incurred to meet the long term strategic growth objectives of the Canadian operations, including an increase in its product support capability and its support of the higher activity levels in the Alberta oil sands.
A large part of the higher SG&A was driven by an increased investment in people in two strategic areas; one area being the development of a heavy equipment centre of excellence in Red Deer, Alberta, and the second was the Alberta oil sands. The integration of Collicutt was also a contributing factor to increased SG&A costs in 2008 as compared to 2007. In addition, standard variable selling costs such as warranty and freight have increased with the growth in new equipment revenues.
In the fourth quarter of 2008, the Canadian operations reacted to the downturn in the economy by downsizing its salaried workforce by approximately 225 people. The restructuring costs of $8.0 million, primarily severance, were included in other expenses. Also included in other expenses was the Canadian operations’ share of the costs related to the implementation of a new information technology system for the Company’s global operations.
EBIT of $234.5 million in 2008 was 18.1% lower than the $286.3 million earned in 2007. EBIT margin (EBIT divided by revenues) of the Canadian operating segment was 7.3% in 2008, down from 9.8% last year. The decline in EBIT margin is attributed primarily to the increase in SG&A costs as discussed above.
In the first quarter of 2008, the Company completed the acquisition of Collicutt and incurred costs in the first two quarters of 2008 to integrate and transition the Collicutt operations to support Finning customer service work. Excluding the costs incurred with this integration and transition and the restructuring costs noted above, the 2008 EBIT margin for 2008 would have been 8.0% compared with 9.8% achieved in 2007. This decrease reflects the higher costs incurred in 2008 to meet the long term strategic growth objectives, as discussed above.
The aggregate purchase price on the acquisition of Collicutt was $136.4 million. The purchase price was funded through $84.3 million in cash, and 15,403 common shares of the Company with a value of $0.4 million. Acquisition costs of $6.9 million were incurred and paid on the transaction. On the date of the acquisition, the Company repaid $44.8 million of Collicutt’s existing bank debt resulting in aggregate consideration of $136.4 million.
This acquisition is expected to provide Finning (Canada) with the opportunity to expand its capacity of regional branches to enable Finning to undertake more higher-margin customer service work, accelerate throughput of new equipment prepared for delivery to customers, and increase the ability to undertake machine overhaul and rebuild work. Finning (Canada) has relocated its Edmonton-based new equipment preparation to its new facilities in Red Deer, Alberta. This heavy equipment centre of excellence is expected to free up existing service facility capacity and give the Company the opportunity to develop a mining/heavy equipment overhaul rebuild capability in Red Deer.
Finning International Inc. Fourth Quarter and Annual 2008 Results
18
Finning, Finning (Canada), and OEM have been involved in legal proceedings for the past three years with the Alberta division of the International Association of Machinists and Aerospace Workers – Local Lodge 99 relating to Finning (Canada)’s outsourcing of component repair and rebuilding services to OEM in 2005. These legal proceedings are continuing, and a number of applications are currently before the Alberta Labour Relations Board. Finning expects that it will be able to continue to manage the operational impacts of these proceedings.
South America
The Company’s South American operations include the results of its Caterpillar dealerships in Chile, Argentina, Uruguay, and Bolivia.
The table below provides details of the results from the South American operations:
For years ended December 31 ($ millions) 2008 2007 Revenue from external sources $ 1,501.6 $ 1,325.6 Operating costs (1,313.8) (1,171.7) Depreciation and amortization (34.2) (25.9) Other expenses (5.4) (0.6) Earnings before interest and taxes $ 148.2 $ 127.4 Earnings before interest and taxes (EBIT) - as a percentage of revenue 9.9% 9.6% - as a percentage of consolidated EBIT (excluding goodwill impairment) 38.2% 28.0%
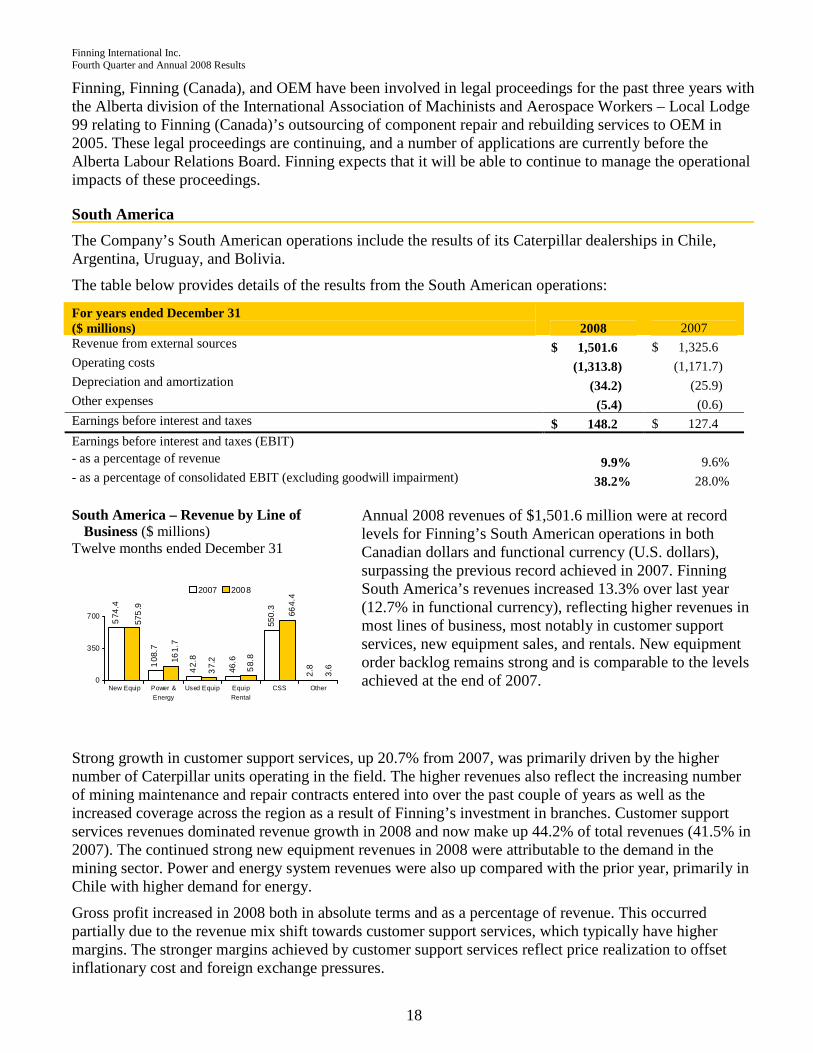
South America – Revenue by Line of Business ($ millions)
Twelve months ended December 31
574
.4
108
.7
42.
8
46.6
550.
3
2.8
575
.9
664.
4
161.
7
58.
8
37.
2
3.6
0
350
700
New Equip Power &Energy
Used Equip EquipRental
CSS Other
2007 2008
Annual 2008 revenues of $1,501.6 million were at record levels for Finning’s South American operations in both Canadian dollars and functional currency (U.S. dollars), surpassing the previous record achieved in 2007. Finning South America’s revenues increased 13.3% over last year (12.7% in functional currency), reflecting higher revenues in most lines of business, most notably in customer support services, new equipment sales, and rentals. New equipment order backlog remains strong and is comparable to the levels achieved at the end of 2007.
Strong growth in customer support services, up 20.7% from 2007, was primarily driven by the higher number of Caterpillar units operating in the field. The higher revenues also reflect the increasing number of mining maintenance and repair contracts entered into over the past couple of years as well as the increased coverage across the region as a result of Finning’s investment in branches. Customer support services revenues dominated revenue growth in 2008 and now make up 44.2% of total revenues (41.5% in 2007). The continued strong new equipment revenues in 2008 were attributable to the demand in the mining sector. Power and energy system revenues were also up compared with the prior year, primarily in Chile with higher demand for energy.
Gross profit increased in 2008 both in absolute terms and as a percentage of revenue. This occurred partially due to the revenue mix shift towards customer support services, which typically have higher margins. The stronger margins achieved by customer support services reflect price realization to offset inflationary cost and foreign exchange pressures.

Finning International Inc. Fourth Quarter and Annual 2008 Results
19
SG&A costs have increased in absolute dollars, but as a percentage of revenue were comparable to 2007. In order to meet customer service demand and the increasing number of service maintenance contracts, over 300 additional revenue-generating employees and support staff were hired, representing a 6% increase over December 2007 levels. As a result of the increased headcount, SG&A expenses included higher salaries and benefit costs in 2008. The increase in other SG&A costs was mostly driven by increased activity levels with higher associated selling costs, and continued to reflect the upward pressure of inflationary increases. Where possible, price increases have been implemented to offset rising costs, and cost controls have been put in place to mitigate the general inflationary pressures in the region. Foreign exchange did not have a significant impact on EBIT as the Canadian dollar relative to the U.S. dollar for the year ended December 31, 2008 was comparable to 2007.
In light of the current market conditions, Finning South America restructured its operations in the fourth quarter of 2008, and incurred costs of $1.0 million which were included in other expenses. Also included in other expenses was the South American operations’ share of the costs related to the implementation of a new information technology system for the Company’s global operations.
EBIT of the Company’s South American operations of $148.2 million for the year ended December 31, 2008, was 16.3% higher than 2007, reflecting the strong revenue growth. EBIT as a percentage of revenue for Finning South America increased to 9.9%, up from 9.6% in 2007. The improvement was primarily a result of higher price realization as well as a higher proportion of customer support services revenues in 2008, which earns a higher margin.
In the third quarter and early in the fourth quarter of 2008, the Company successfully renewed the collective agreements with the three unions representing the vast majority of Finning (Chile) employees. The new collective agreements have a four year term, which include an enhanced wage settlement. The contract enhancement will assist the Company in retaining and attracting the employees needed to meet future demand.

Finning International Inc. Fourth Quarter and Annual 2008 Results
20
United Kingdom (“UK”) Group
The Company’s UK Group includes the following three market units: Construction, Power Systems, and Rental (Hewden). In the fourth quarter of 2008, the UK Group combined Heavy Construction and General Construction into one market unit.
On July 31, 2007, Hewden sold its Tool Hire Division. The results from the Tool Hire Division are recorded as discontinued operations with prior period results restated accordingly.
The table below provides details of the results of the continuing operations from the UK Group:
For years ended December 31 ($ millions) 2008 2007 Revenue from external sources $ 1,272.9 $ 1,400.4 Operating costs (1,099.8) (1,191.3) Depreciation and amortization (125.5) (136.5) Other income (expenses) 6.0 0.4 Earnings before interest and taxes $ 53.6 $ 73.0 Earnings before interest and taxes (EBIT) - as a percentage of revenue 4.2% 5.2% - as a percentage of consolidated EBIT (excluding goodwill impairment) 13.8% 16.0%
UK Group – Revenue by Line of Business ($ millions) Twelve months ended December 31
405.
9
199.
4
105.
5
444.
5
245.
1336.
1
253.
3
184.
3
357.
4
141.
8
0
250
500
New Eq uip Pow er &
Energy
Used Equip Equip Rental CSS
2007 2008
Annual 2008 revenues of $1,272.9 million were down 9.1% from the prior year. Foreign exchange had a negative impact on the translation of revenues due to the 8.7% strengthening of the Canadian dollar relative to the U.K. pound sterling year over year. In local currency, revenues were comparable with 2007.
In local currency, revenues from customer support services and used equipment sales improved compared with 2007. Revenues from other lines of business in 2008 were lower compared to the prior year, reflecting the softening of the market for new equipment sales.
Rental revenues continue to be affected by lower utilization rates at Hewden. A reorganization of this business unit is underway to improve its focus on delivering on its commitments to customers, reducing its overall cost structure, and improving the performance of its assets.
Gross profit for the year ended December 31, 2008 was lower compared with the same period last year in absolute terms and as a percentage of revenue. The rental business experienced lower margins in 2008 compared to the prior year for the reasons noted above, and margins were also lower in new and used equipment.
SG&A costs were lower in 2008 compared with 2007 in absolute terms, and comparable as a percentage of revenue. The reduction is a result of various initiatives and management’s focus on realizing cost efficiencies.
Other income / expenses in 2008 include a number of non-recurring items.
• As part of the ongoing reorganization of the UK Group business units first announced in the fourth quarter of 2006, it was announced in early 2008 that Finning would centralize the business support services of its Finning UK Group into a single location at Cannock, England. As a result, Hewden has closed its administration offices in Tannochside, near Glasgow and is strengthening a Hewden operational support team in Manchester. Combined with investments in new information technology

Finning International Inc. Fourth Quarter and Annual 2008 Results
21
last year, the move is designed to achieve lower overall operating costs and better integrated information technology, finance, and other support services across the Finning UK Group. Other expenses for 2008 included restructuring costs of approximately $7.8 million incurred in connection with this integration of support services. A further $2 million is anticipated to be spent during 2009. This integration will promote efficiencies and is expected to substantially reduce administrative support costs over time.
• In the fourth quarter of 2008, Hewden announced a restructuring of its nationwide depot network, with the closure or merger of 22 depots. This restructuring included costs of approximately $2.5 million which were incurred in 2008. A further $6 million is anticipated to be spent during 2009. The organization structure was simplified to provide a greater focus on the customer combined with opportunities for cost savings.
• In light of the current market conditions, the UK Group also further restructured their operations and incurred restructuring costs of $0.5 million. Other income / expenses in 2008 also included a $14.7 million pre-tax gain on the sale of certain properties at Hewden, and Finning (UK)’s share of the costs related to the implementation of a new information technology system for the Company’s global operations.
In 2008, the UK Group contributed EBIT of $53.6 million, compared with $73.0 million in 2007. After adjusting for the restructuring costs related to the business support integration, depot closures, and global restructuring noted above, as well as the gain on the properties sale, EBIT would have been $49.7 million, lower by 31.9% compared with last year. Excluding those same costs, EBIT as a percentage of revenue for the UK Group of 3.9% in 2008 was lower than the 5.2% achieved in 2007.
Discontinued Operations – Tool Hire Division
On July 31, 2007, the Company sold its Tool Hire Division. This division is classified as discontinued operations within the consolidated income statements for all periods presented prior to the disposition.
The table below provides details of the discontinued operations of the Tool Hire Division for the year ended December 31, 2007, excluding the gain and loss on sale:
For year ended December 31, 2007 ($ thousands)
Revenue from external sources $ 113.3 Operating costs (82.2) Depreciation and amortization (23.4) Other expenses (8.0) Earnings before interest and taxes $ (0.3)
Approximately 1,200 employees were transferred with the sale of the Tool Hire Division.
Finning International Inc. Fourth Quarter and Annual 2008 Results
22
Corporate and Other Operations
For years ended December 31 ($ millions) 2008 2007 Operating costs – corporate $ (25.8) $ (27.0) Operating costs – mark to market and equity investment (20.9) (3.9) Depreciation and amortization (0.2) — Other expenses (1.3) — Earnings before interest and taxes $ (48.2) $ (30.9)
For the year ended December 31, 2008, corporate operating costs decreased to $25.8 million compared with $27.0 million in 2007.
Equity earnings from the Company’s investment in Energyst B.V. in 2008 were lower by $1 million compared with 2007. The mark-to-market LTIP expense incurred at the corporate level in 2008 was $16.0 million higher than in 2007. The Company entered into a compensation hedge at the end of 2007 which offsets the mark-to-market impact relating to certain stock-based compensation plans. The 2007 balance reflects the mark-to-market impact following the valuation of certain stock-based compensation plans. The 2008 balance primarily reflects the mark-to-market expense of the compensation hedge which offsets the LTIP mark-to-market gains recorded by the operating companies. On a consolidated basis, the LTIP mark-to-market impact, net of hedging costs, is minimal for 2008.
Costs included in other expenses in 2008 relate to the implementation of a new information technology system for the Company’s global operations.
Goodwill Impairment
Goodwill is assessed for impairment at the reporting unit level at least annually. Any potential goodwill impairment is identified by comparing the fair value of a reporting unit to its carrying value. If the fair value of the reporting unit exceeds its carrying value, goodwill is considered not to be impaired. If the carrying value of the reporting unit exceeds its fair value, a more detailed assessment must be undertaken to determine the fair value of goodwill. A goodwill impairment charge is recognized to the extent that, at the reporting unit level, the carrying value of goodwill exceeds its fair value.
The Company determines the fair value of the reporting unit using a discounted cash flow model corroborated by other valuation techniques such as market multiples. The process of determining these fair values requires management to make estimates and assumptions including, but not limited to, projected future sales, earnings and capital investment, discount rates, and terminal growth rates. Projected future sales, earnings, and capital investment are consistent with strategic plans presented to the Company’s Board of Directors. Discount rates are based on an industry weighted average cost of capital. These estimates are subject to change due to uncertain competitive and economic market conditions or changes in business strategies.
In the fourth quarter of 2008, the Company performed its annual goodwill impairment test and determined that the carrying value of goodwill established on the acquisition of Hewden in 2001 exceeded its respective fair value. As a result, the Company recorded in other expenses a full goodwill impairment charge of $151.4 million. The Company expects no income tax deduction from this non-cash goodwill impairment charge. The determination that the fair value of goodwill was less than its carrying value resulted from a decline in market multiples. It was also due to a reduction of fair value as determined using the discounted cash flow methodology, primarily due to a change in market assumptions principally from the increasing economic uncertainty in the global market. Although the market conditions have changed in the fourth quarter of 2008, management believes the Company’s strategy and rationalization efforts for Hewden are sound.

Finning International Inc. Fourth Quarter and Annual 2008 Results
23
Earnings Before Interest and Taxes (EBIT)
On a consolidated basis, EBIT was $236.7 million in 2008. Gross profit increased 7.2% to $1,714.7 million in 2008 compared with 2007, and gross profit margin (gross profit as a percentage of revenues) was 28.6%, up from the prior year gross profit margin of 28.2%. However, the increase in gross profit was offset by higher SG&A costs, which were incurred to meet anticipated growth and customer demand primarily in the mining sector, as well as cost increases in both Western Canada and South America.
Results in 2008 included certain items that are considered by the Company to be non-recurring. These included the Hewden goodwill impairment charge, costs related to the integration and transition of Collicutt, business support and depot restructuring costs in the U.K., restructuring costs incurred globally by Finning in the fourth quarter of 2008 in light of the current market conditions, partially offset by the gains on the sale of certain properties in Hewden. Adjusting for these non-recurring items, EBIT for 2008 would have been $405.8 million, 11.0% lower than the prior year. EBIT as a percentage of revenue would have been 6.8%, compared with 8.0% for 2007.
EBIT by operation ($ millions) Twelve months ended December 31
127
.4
286.
3
73.
0
53
.6
148
.2
234
.5
0
150
300
Can ada South America UK Grou p
2007 2008
Excluding other operations – corporate head office and goodwill impairment
Major components of the annual EBIT variance were: ($ millions)
2007 EBIT 455.8
Net change in operations (19.7)
Foreign exchange impact (25.8)
Hewden goodwill impairment charge (151.4)
Gain on sale of certain properties in Hewden 14.7
Collicutt integration and start-up costs (12.6)
Restructuring costs in the U.K. (10.3)
Global restructuring costs (9.5)
Lower LTIP costs 8.6
Other net expenses (13.1)
2008 EBIT 236.7 Finance Costs
Finance costs for the year ended December 31, 2008 of $83.6 million were 14.8% higher than 2007. The higher finance costs in 2008 were primarily due to higher debt in 2008 as a result of the acquisition of Collicutt, the repurchase of the Company’s common shares as part of a normal course issuer bid, as well as to support the Company’s higher working capital requirements.

Finning International Inc. Fourth Quarter and Annual 2008 Results
24
Provision for Income Taxes
Finning’s 2008 annual income tax expense was $57.1 million (37.3% effective tax rate) compared with $102.9 million (26.9% effective tax rate) for 2007. The higher effective tax rate in 2008 reflects a number of non-recurring items, primarily the goodwill impairment charge recorded in the fourth quarter of 2008, which is not deductible for tax purposes. Adjusting for the non-recurring gains and costs discussed throughout this MD&A, as well as the Hewden goodwill impairment charge, the effective tax rate would have been approximately 20%. This is lower than the 2007 effective tax rate as well as management’s guidance of 25-30% for 2008 primarily due to the change in the Company’s earnings mix with proportionately more income earned in lower tax jurisdictions. In addition, the Company benefited from tax adjustments resulting from the closure of previously open tax years, lower capital tax rates applied to the sale of properties in the U.K., and a tax benefit recognized on the wind up of Collicutt.
Net Income
Finning’s net income from continuing operations in 2008 was $96.0 million compared with $280.1 million in 2007. Finning’s 2008 earnings included certain items considered by the Company to be non-recurring. These included a non-cash goodwill impairment charge, costs related to the integration of Collicutt, business support and depot restructuring costs in the U.K., as well as global restructuring costs incurred by Finning in the fourth quarter of 2008 in light of the current market conditions. These non-recurring costs were partially offset by gains on the sale of certain properties in Hewden. Adjusting for these non-recurring items, net income from continuing operations would have been $257.8 million, 8.0% lower than the 2007 level. The Company realized improved margins in 2008 but this was more than offset by higher costs to meet customer demand.
Basic EPS from continuing operations for the year ended December 31, 2008 of $0.56 included a number of non-recurring items as described above. Adjusting the 2008 results for these non-recurring items, including the goodwill impairment charge, basic EPS would have been $1.50 for the year ended December 31, 2008 compared with $1.57 in 2007, a decrease of 4.5%. The total negative impact due to the stronger Canadian dollar in 2008 compared to the prior year was approximately $0.10 per share.
Liquidity and Capital Resources Management of the Company assesses liquidity in terms of Finning’s ability to generate sufficient cash flow to fund its operations. Net cash flow is affected by the following items:
• operating activities, including the level of accounts receivable, inventories, accounts payable, rental equipment, and financing provided to customers;
• investing activities, including acquisitions of complementary businesses, divestitures of non-core businesses, and capital expenditures; and
• external financing, including bank credit facilities, commercial paper, and other capital market activities, providing both short and long-term financing.

Finning International Inc. Fourth Quarter and Annual 2008 Results
25
Cash Flow from Operating Activities
For the year ended December 31, 2008, cash flow after working capital changes was $278.1 million, a decrease from cash flow of $404.4 million generated last year. Throughout all operations, management continues to focus on improving cash cycle times and operating efficiencies while ensuring appropriate levels of working capital exist to support current activity levels.
The Company made a net investment in rental assets of $204.8 million during 2008, less than half of the $474.6 million invested in 2007, and slightly below management’s annual guidance given in the third quarter of 2008 of $220 million to $250 million. Rental investment moderated in 2008 compared to the very high demand for rental assets in 2007, particularly at the Company’s Canadian operations. With utilization of rental assets decreasing in 2008, rental expenditures were reduced wherever possible and underutilized assets were sold.
Overall, cash flow generated by operating activities was $72.7 million in 2008 which improved from the use of cash from operating activities of $56.7 million in 2007.
Free cash flow (before dividends) is defined as cash flow provided by operating activities less net capital expenditures, discussed below. The Company’s free cash flow (before dividends) for 2008 was $23.2 million, below the annual guidance provided of $100-$120 million primarily due to the timing of cash receipts and higher inventory levels than expected in South America to support deliveries in early 2009.
Cash Used For Investing Activities
Net cash used in investing activities in 2008 totalled $198.1 million compared with cash provided by investing activities of $181.3 million in 2007. The primary use of cash in 2008 related to the acquisition of Collicutt for $135.8 million, net of cash received. The primary source of cash in 2007 was the net proceeds of $242.9 million received on the sale of the Tool Hire division in the U.K.
Gross capital additions for the year ended December 31, 2008 were $100.4 million compared with $74.2 million for the year ended December 31, 2007. Net capital expenditures in 2008 of $49.5 million were slightly below management’s annual guidance given in the third quarter of 2008 of $60 million to $75 million due to further delays in certain capital projects. The capital additions in 2008 and 2007 reflect general capital spending to support operations. Capital additions in 2008 also included capitalized costs related to the Company’s new global information system, and capital additions in the prior year also included the capitalization of certain costs related to the development of Hewden’s new information system. The Company has committed to pay approximately $16 million over the next three years for consulting and implementation support for the new information technology system solution for its global operations.
Investing activities in 2008 included approximately $8.6 million in proceeds on the sale of vehicles at Hewden. These vehicles were subsequently leased back under an operating lease.
In 2008, the Company increased its investment in Energyst B.V. by $11.5 million, increasing its equity investment to 25.4%. In both 2008 and 2007, the Company acquired one Cat Rental Store for $1.3 million and $2.7 million, respectively. Also in 2007 the Company paid proceeds of approximately $4.1 million on the settlement of foreign currency forwards that hedged foreign subsidiary investments.
The Company believes that internally generated cash flow, supplemented by borrowing from existing financing sources, if necessary, will be sufficient to meet anticipated capital expenditures and other cash requirements in 2009. Management believes that the 2009 results will by highlighted by stronger cash generation as working capital requirements are reduced, expenditures on equipment for the rental fleets are significantly reduced, and capital expenditures are actively managed, depending on business conditions, over the course of the year. At this time, the Company does not reasonably expect any presently known trend or uncertainty to affect our ability to access our historical sources of cash.

Finning International Inc. Fourth Quarter and Annual 2008 Results
26
Financing Activities
As at December 31, 2008, the Company’s short and long-term borrowings totalled $1.6 billion, an increase of $430.0 million, or 36.5% since December 31, 2007, primarily to support the acquisition of Collicutt and the repurchase of common shares as part of a normal course issuer bid, as well as support the Company’s higher working capital requirements.
To complement the internally generated funds from operating and investing activities, the Company has approximately $1.3 billion in unsecured credit facilities. Included in this amount, Finning has committed bank facilities totalling approximately $870 million with various Canadian and U.S. financial institutions. The largest of these facilities ($800 million) is in place until December 2011. As at December 31, 2008 over $300 million was available under these committed facilities and no term debt matures until December 2011. Availability of these facilities, seasonal needs for working capital, and the discretionary nature of some of the outflows like rental additions and share buybacks mean that the Company has sufficient liquidity to meet operational needs in the foreseeable future.
Longer-term capital resources are provided by direct access to capital markets. The Company is rated by both Standard & Poor’s (S&P) and Dominion Bond Rating Service (DBRS). In 2008, the Company’s long-term debt rating was upgraded to A (low) by DBRS, and was confirmed at BBB+ by S&P. The Company’s short-term debt rating was reconfirmed by DBRS at R-1 (low). The Company continues to utilize the Canadian commercial paper market as well as borrowings under its credit facilities as its principal sources of short-term funding in Canada. The Company’s commercial paper program is backstopped by the global syndicated credit facility. In February 2008, the maximum authorized limit of the Company’s commercial paper program was increased from $500 million to $600 million.
In May 2008, the Company issued two unsecured Medium Term Notes (MTN). The 5-year, $250 million MTN has a coupon interest rate of 5.16% per annum, payable semi-annually commencing September 3, 2008. The 10-year, $350 million MTN has a coupon interest rate of 6.02% per annum, payable semi-annually commencing December 1, 2008. Proceeds from these issuances were used for debt repayment, including the repayment of the Company's existing $200 million 7.40% MTN which matured in June 2008 as well as outstanding commercial paper borrowings.
Financing activities in 2008 also included a payment of $8.9 million on the settlement of a derivative that hedged future cash flows associated with the new MTN issuances noted above.
In 2007, an additional pension payment of $17.1 million was made to fund the UK pension plans as agreed at the time of the sale of the Materials Handling Division. In addition, the Company repurchased previously securitized receivables for cash of $45 million.
As a result of the Board’s confidence in the future earnings for the Company and its ongoing commitment to the return of value to its shareholders, the Company increased its quarterly dividend in May 2008 by one cent to eleven cents per common share. As a result, dividends paid to shareholders increased in 2008 by $9.5 million to $74.0 million.
The Company has an active share repurchase program in effect until July 8, 2009. For the year ended December 31, 2008, the Company repurchased and cancelled 5,901,842 common shares at an average price of $24.99 for an aggregate amount of $147.5 million. For the year ended December 31, 2007, the Company repurchased and cancelled 3,691,400 common shares at an average price of $27.82 for an aggregate amount of $102.7 million.
The Company’s overall net debt to total capitalization ratio was 48.9% at the end of 2008, compared with 40.8% at the end of 2007. This ratio is higher than the prior year due to the higher debt in 2008, primarily as a result of the acquisition of Collicutt and the repurchase of the Company’s common shares as part of a normal course issuer bid. The non-cash goodwill impairment charge did not have a significant impact on the net debt to total capitalization ratio.
Finning International Inc. Fourth Quarter and Annual 2008 Results
27
Contractual Obligations
Payments on contractual obligations in each of the next five years and thereafter are as follows:
($ millions) 2009 2010 2011 2012 2013 Thereafter Total
Long-term debt
- principal repayment $ 2.6 $ 3.4 $ 557.0 $ — $ 504.9 $ 350.0 $ 1,417.9
- interest 63.3 63.2 63.1 47.2 47.2 94.8 378.8
Operating leases 71.2 63.2 49.7 31.7 23.5 150.8 390.1
Capital leases 26.3 6.8 1.2 1.1 1.1 14.7 51.2
Total contractual obligations $ 163.4 $ 136.6 $ 671.0 $ 80.0 $ 576.7 $ 610.3 $ 2,238.0
The above table does not include obligations to fund pension benefits, although the Company is making regular contributions to their registered defined benefit pension plans in Canada and the UK in order to fund the pension plans as required. Contribution requirements are based on periodic (at least triennial) actuarial funding valuations performed by the Company’s (or plan Trustees’) actuaries. For 2008, approximately $50 million was contributed towards the Company’s defined benefit pension plans. Currently, the Company is committed to maintain a similar level of funding during 2009. However, the decreases in security values in global financial markets in the latter part of 2008 will likely increase required pension funding levels in 2010. The amount of increase will be determined over the next 12-18 months as new funding valuations are performed, with the resulting new funding requirements likely to come into effect commencing in 2010. Management anticipates any increase in funding requirements will be manageable.
Off-Balance Sheet Arrangement
In 2002, the Company entered into an arrangement and sold a $45.0 million co-ownership interest in a pool of eligible non-interest bearing trade receivables to a multi-seller securitization trust (the “Trust”), net of overcollateralization. Under the terms of the agreement, which expired on November 29, 2007, the Company could sell co-ownership interests of up to $120.0 million on a revolving basis. The Company retained a subordinated interest in the cash flows arising from the eligible receivables underlying the Trust’s co-ownership interest. The Trust and its investors did not have recourse to the Company’s other assets in the event that obligors failed to pay the underlying receivables when due. Pursuant to the agreement, the Company serviced the pool of underlying receivables.
On the expiry date, the Company terminated the co-ownership interests, ceased all securitization of its accounts receivable, and repurchased previously securitized receivables for cash of $45.0 million.
For the 2007 period up to the repurchase of the receivables held by the Trust, the Company recognized a pre-tax loss of $1.8 million relating to these transfers. In 2007, proceeds from revolving reinvestment of collections were $451.9 million.
Employee Share Purchase Plan
The Company has an employee share purchase plan for its Canadian employees. Under the terms of this plan, eligible employees may purchase common shares of the Company in the open market at the current market price. The Company pays a portion of the purchase price to a maximum of 2% of employee earnings. At December 31, 2008, 62% of Canadian employees were contributing to this plan. The Company has an All Employee Share Purchase Ownership Plan for its employees in Finning (UK) and Hewden. Under the terms of this plan, employees may contribute up to 10% of their salary to a maximum of £125.00 per month. The Company will provide one common share, purchased in the open market, for every three shares the employee purchases. At December 31, 2008, 26% and 13% of eligible employees in Finning (UK) and Hewden, respectively, were contributing to this plan. These plans may be cancelled by Finning at any time.

Finning International Inc. Fourth Quarter and Annual 2008 Results
28
Accounting Estimates and Contingencies
Accounting, Valuation and Reporting
Changes in the rules or standards governing accounting can impact our financial reporting. The Company employs professionally qualified accountants throughout its finance group and all of the operating unit financial officers have a reporting relationship to the Chief Financial Officer (CFO). Senior financial representatives are assigned to all significant projects that impact financial accounting and reporting systems. Policies are in place to ensure completeness and accuracy of reported transactions. Key transaction controls are in place, and there is a segregation of duties between transaction initiation, processing, and cash receipt or disbursement, and there is restricted physical access to the Treasury and cash settlements area. Accounting, measurement, valuation, and reporting of accounts, which involve estimates and / or valuations, are reviewed quarterly by the CFO and the Audit Committee of the Board of Directors. Significant accounting and financial topics and issues are presented to and discussed with the Audit Committee.
Management’s discussion and analysis of the Company’s financial condition and results of operations are based on the Company’s consolidated financial statements, which have been prepared in accordance with Canadian GAAP. The Company’s significant accounting policies are contained in Note 1 to the consolidated financial statements. Certain of these policies require management to make estimates and assumptions that affect the reported amounts of assets, liabilities, revenues, expenses, and disclosure of contingent assets and liabilities. These policies may require particularly subjective and complex judgments to be made as they relate to matters that are inherently uncertain and because the likelihood that materially different amounts could be reported under different conditions or using different assumptions. The Company has discussed the development, selection, and application of its key accounting policies, and the critical accounting estimates and assumptions they involve, with the Audit Committee. The more significant estimates include: fair values for goodwill impairment tests, allowance for doubtful accounts, provisions for inventory obsolescence, reserves for warranty, provisions for income tax, the determination of employee future benefits, the useful lives of the rental fleet and related residual values, costs associated with maintenance and repair contracts, and provisions for restructuring costs.
A significant portion of goodwill recorded on the consolidated balance sheets related to the Company’s investment in Hewden Stuart plc (Hewden), acquired in 2001. The Company performs impairment tests on its goodwill balances on at least an annual basis or as warranted by events or circumstances. During the year, the Company performed its assessment of goodwill by estimating the fair value of operations to which the goodwill relates using the present value of expected discounted future cash flows. The Company determined that the fair value of Hewden was less than its book value, primarily due to the higher cost of capital assumptions in the valuation methodology, reflecting year-end market conditions. As a result, the Company recorded a full goodwill impairment charge of $151.4 million. The goodwill impairment charge is non-cash in nature and does not affect the Company’s liquidity, cash flows from operating activities, or debt covenants and will not have an impact on future operations.
Due to the size, complexity, and nature of the Company’s operations, various legal and tax matters are pending. In the opinion of management, none of these matters will have a material effect on the Company’s consolidated financial position or results of operations.
Income Taxes
The Company exercises judgment in estimating the provision for income taxes. Provisions for federal, provincial, and foreign taxes are based on the respective laws and regulations in each jurisdiction within which the Company operates. These complex laws and regulations are potentially subject to different interpretation between the Company and the respective tax authority. Due to the number of variables associated with the differing tax laws and regulations across the multiple jurisdictions, the precision and

Finning International Inc. Fourth Quarter and Annual 2008 Results
29
reliability of the resulting estimates are subject to uncertainties and may change as additional information becomes known.
Future income tax assets and liabilities are comprised of the tax effect of temporary differences between the carrying amount and tax basis of assets and liabilities as well as the tax effect of undeducted tax losses, and are measured according to the income tax law that is expected to apply when the asset is realized or liability settled. Assumptions underlying the composition of future income tax assets and liabilities include estimates of future results of operations and the timing of reversal of temporary differences as well as the tax rates and laws in each respective jurisdiction at the time of the expected reversal. The composition of future income tax assets and liabilities is reasonably likely to change from period to period due to the uncertainties surrounding these assumptions.
Description of Non-GAAP Measure EBIT is defined herein as earnings from continuing operations before interest expense, interest income, and income taxes and is a measure of performance utilized by management to measure and evaluate the financial performance of its operating segments. It is also a measure that is commonly reported and widely used in the industry to assist in understanding and comparing operating results. EBIT does not have any standardized meaning prescribed by GAAP and is therefore unlikely to be comparable to similar measures presented by other issuers. Accordingly, this measure should not be considered as a substitute or alternative for net income or cash flow, in each case as determined in accordance with GAAP.
A reconciliation between EBIT and net income from continuing operations is as follows:
For years ended December 31 ($ millions) 2008 2007 Earnings from continuing operations before interest, income taxes, and goodwill
impairment charge $ 388.1 $ 455.8 Goodwill impairment (151.4) — Earnings from continuing operations before interest and income taxes (EBIT) 236.7 455.8 Finance costs (83.6) (72.8) Provision for income taxes (57.1) (102.9) Net income from continuing operations $ 96.0 $ 280.1
Finning’s 2008 earnings included certain items considered by the Company to be non-recurring. These included a non-cash goodwill impairment charge, costs related to the integration of Collicutt, business support and depot restructuring costs in the U.K., as well as global restructuring costs incurred by Finning in the fourth quarter of 2008 in light of the current market conditions. These non-recurring costs were partially offset by gains on the sale of certain properties in Hewden.
A reconciliation between Basic EPS and Adjusted Basic EPS, reflecting the per share impact of the non-recurring items noted above, is as follows:
For years ended December 31 ($ millions)
Three months ended December 31, 2008
Twelve months ended December 31, 2008
Basic earnings (loss) per share $ (0.63) $ 0.56 Per share impact of non-recurring items
Goodwill impairment charge 0.89 0.88 Other non-recurring items 0.07 0.06
Adjusted basic earnings per share 0.33 1.50

Finning International Inc. Fourth Quarter and Annual 2008 Results
30
Risk Management Finning and its subsidiaries are exposed to market, financial, and other risks in the normal course of their business activities. The Company has adopted an Enterprise Risk Management (ERM) approach in identifying, prioritizing, and evaluating risks. This ERM framework assists the Company in managing business activities and risks across the organization in order to achieve the Company’s strategic objectives.
The Company is dedicated to a strong risk management culture to protect and enhance shareholder value. The processes within Finning’s risk management function are designed to ensure that risks are properly identified, managed, and reported. The Company discloses all of its key risks in its most recent Annual Information Form (AIF) with key financial risks also included herein. On a quarterly basis, the Company assesses all of its key risks and any changes to key financial or business risks are disclosed in the Company’s quarterly MD&A. On a quarterly basis, the Audit Committee reviews the Company’s process with respect to risk assessment and management of key risks, including the Company’s major financial risks and exposures and the steps taken to monitor and control such exposures. Changes to the key risks are also reviewed by the Audit Committee.
Financial Derivatives The Company uses various financial instruments such as interest rate swaps, forward foreign exchange contracts, and collars as well as foreign currency debt to manage its foreign exchange exposures, interest rate exposures, and stock-based compensation expenses which fluctuate with share price movements (see Notes 3 and 4 of Notes to the Consolidated Financial Statements). The Company uses derivative financial instruments only in connection with managing related risk positions and does not use them for trading or speculative purposes.
The Company continually evaluates and manages risks associated with financial derivatives, which includes counterparty credit exposure.
Financial Risks and Uncertainties L IQUIDITY RISK
Liquidity risk is the risk that the Company will not be able to meet its financial obligations as they fall due. The Company’s approach to managing liquidity is to ensure, as far as possible, that it will always have sufficient cash flows to fund its operations and to meet its liabilities when due, under both normal and stressed conditions. The Company also maintains certain credit facilities which can be drawn upon as needed.
Financing arrangements
The Company will require capital to finance its future growth and to refinance its outstanding debt obligations as they come due for repayment. If the cash generated from the Company’s business, together with the credit available under available bank facilities, is not sufficient to fund future capital requirements, the Company will require additional debt or equity financing in the capital markets. The Company’s ability to access capital markets on terms that are acceptable will be dependent upon prevailing market conditions, as well as the Company’s future financial condition. Further, the Company’s ability to increase its debt financing may be limited by its financial covenants or its credit rating objectives. Although the Company does not anticipate any difficulties in raising necessary funds in the future, there can be no assurance that capital will be available on suitable terms and conditions, or that borrowing costs and credit ratings will not be adversely affected. In addition, the Company’s current financing arrangements contain certain restrictive covenants that may impact the Company’s future operating and financial flexibility.

Finning International Inc. Fourth Quarter and Annual 2008 Results
31
CREDIT RISK
Credit risk is the risk of financial loss to the Company if a customer or counterparty to a financial instrument fails to meet its contractual obligations, and arises principally from the Company’s receivables from customers, instalment notes receivables, and derivative counterparties. The Company has a large diversified customer base, and is not dependent on any single customer or group of customers. Credit risk is minimized because of the diversification of the Company’s operations as well as its large customer base and its geographical dispersion. Although there is usually no significant concentration of credit risk related to the Company’s position in trade accounts or notes receivable, the Company does have a certain degree of credit exposure arising from its derivative contracts and investments. There is a risk that counterparties to these derivative contracts and investments may default on their obligations. However, the Company minimizes this risk by ensuring there is no excessive concentration of credit risk with any single counterparty, by active credit management and monitoring, and by dealing only with financial institutions that have a credit rating of at least A- from S&P and A (low) from DBRS.
MARKET RISK
Market risk is the risk that changes in market prices, such as foreign exchange rates and interest rates will affect the Company’s income or the value of its holdings of financial instruments. The objective of market risk management is to manage and control market risk exposures within acceptable parameters.
The Company buys and sells derivatives in the ordinary course of business, and also incurs financial liabilities, in order to manage market risks. All such transactions are carried out within the guidelines set by the Company’s Global Hedging Policy approved by the Audit Committee.
Currency Risk
The Company is geographically diversified, with significant investments in several different countries. The Company transacts business in multiple currencies, the most significant of which are the U.S. dollar (USD), the Canadian dollar (CAD), the U.K. pound sterling (GBP), and the Chilean peso (CLP). As a result, the Company has foreign currency exposure with respect to items denominated in foreign currencies. The three main types of foreign exchange risk of the Company can be categorized as follows:
Investment in Foreign Operations
All of the Company’s foreign operations are considered self-sustaining. Accordingly, assets and liabilities are translated into Canadian dollars using the exchange rates in effect at the balance sheet dates. Any unrealized translation gains and losses are recorded as an item of comprehensive income and accumulated other comprehensive income.
It is the Company’s objective to manage its exposure to currency fluctuations arising from its foreign investments. The Company has hedged a portion of its foreign investments through foreign currency denominated loans and other derivative contracts. Any exchange gains or losses arising from the translation of the hedging instruments are recorded, net of tax, as an item of comprehensive income and accumulated other comprehensive income. Cumulative currency translation adjustments, net of gains or losses of the associated hedging instruments, are recognized in net income when there is a reduction in the Company’s net investment in the self-sustaining foreign operations. A 5% hypothetical strengthening of the Canadian dollar relative to all other currencies from the December 2008 month end rates, assuming the same current level of hedging instruments, would result in an after-tax deferred unrealized loss of approximately $29 million.
Transaction Exposure
Many of the Company’s operations purchase, sell, rent, and lease products as well as incur costs throughout the world using different currencies. This mismatch of currencies creates transactional exposure at the operational level, which may affect the Company’s profitability as exchange rates

Finning International Inc. Fourth Quarter and Annual 2008 Results
32
fluctuate. It may also impact the Company’s competitive position as relative currency movements affect the business practices and/or pricing strategies of the Company’s competitors.
It is the Company’s objective to manage the impact of exchange rate movements and volatility in results. Each operation manages the majority of its transactional exposure through sales pricing policies and practices. The Company also enters into forward exchange contracts to manage residual mismatches in foreign currency cash flows. As a result, the foreign exchange impact on earnings with respect to transactional activity is not significant.
Translation Exposure
The most significant foreign exchange impact on the Company’s net income is the translation of foreign currency based earnings into Canadian dollars each reporting period. All of the Company’s foreign subsidiaries report their operating results in currencies other than the Canadian dollar. Therefore, exchange rate movements in the U.S. dollar and U.K. pound sterling relative to the Canadian dollar will impact the consolidated results of the South American and U.K. operations in Canadian dollar terms. In addition, the Company’s Canadian results are impacted by the translation of their U.S. dollar based earnings. Some of the Company’s earnings translation exposure is offset by interest on foreign currency denominated loans and derivative contracts associated with the net investment hedges.
Sensitivity to variances in foreign exchange rates
The sensitivity of the Company’s net earnings to fluctuations in average annual foreign exchange rates is summarized in the table below. A 5 percent strengthening of the Canadian dollar against the following currencies for a full year relative to the December 31, 2008 month end rates would increase / (decrease) annual net income by the amounts shown below. This analysis assumes that all other variables, in particular volumes, relative pricing, interest rates, and hedging activities are unchanged.
Currency December 31, 2008 month end rates Increase (decrease) in annual net income
$ millions USD 1.2246 (22) GBP 1.7896 (2) CLP 0.0019 1
The sensitivities noted above ignore the impact of exchange rate movements on other macroeconomic variables, including overall levels of demand and relative competitive advantages. If it were possible to quantify these impacts, the results would likely be different from the sensitivities shown above.
Interest Rate Risk
The Company’s interest bearing financial assets comprise instalment note receivables, which bear interest at a fixed rate. The Company’s debt portfolio comprises both fixed and floating rate debt instruments, with terms to maturity ranging up to ten years. In relation to its debt financing, the Company is exposed to potential changes in interest rates, which may cause the Company’s borrowing costs to fluctuate. Floating rate debt exposes the Company to fluctuations in short-term interest rates, while fixed rate debt exposes the Company to future interest rate movements upon refinancing the debt at maturity. Fluctuations in current or future interest rates could result in a material adverse impact on the Company’s financial results by causing related finance expense to rise. Further, the fair value of the Company’s fixed rate debt obligations and the mark-to-market on the cross currency interest rate swaps may be negatively affected by changes in interest rates, thereby exposing the Company to potential losses on early settlements or refinancing. The Company minimizes its interest rate risk by balancing its portfolio of fixed and floating rate debt, as well as managing the term to maturity of its debt portfolio. At certain times the Company utilizes derivative instruments such as interest rate swaps to adjust the balance of fixed and floating rate debt to appropriately determined levels.

Finning International Inc. Fourth Quarter and Annual 2008 Results
33
Commodity Prices
The Company’s revenues can be indirectly affected by fluctuations in commodity prices; in particular, changes in views on long-term commodity prices. In Canada, commodity price movements in the forestry, metals, coal, and petroleum sectors can have an impact on customers’ demands for equipment and customer service. In Chile and Argentina, significant fluctuations in the price of copper and gold can have similar effects, as customers base their capital expenditure decisions on the long-term outlook for metals. In the U.K., changes to prices for thermal coal may impact equipment demand in that sector. Significant fluctuations in commodity prices could result in a material adverse impact on the Company’s financial results. With significantly lower commodity prices, demand is reduced as development of new projects is slowed or stopped and production from existing projects can be curtailed, both leading to less demand for equipment. However, product support growth has been, and will continue to be, important in mitigating the effects of downturns in the business cycle. Finning’s customer support services revenues typically contribute higher gross margins than new equipment sales.
STOCK -BASED COMPENSATION RISK
Stock-based compensation is an integral part of the Company’s compensation program, and can be in the form of the Company’s common shares or cash payments that reflect the value of the shares. Since Canadian GAAP require certain stock-based compensation which is accounted for as liability-based awards to be recorded on a mark-to-market basis, compensation cost can vary significantly as the price of the Company’s common shares changes. The Company has entered into a derivative contract to manage this potential exposure, called a Variable Rate Share Forward (VRSF).
A 5% strengthening or weakening in the Company’s share price as at December 31, 2008, all other variables remaining constant, would have increased or decreased net income by approximately $0.9 million as a result of revaluing certain of the Company’s stock-based compensation. As the Company’s share price changes, the mark-to-market impact related to the stock-based compensation liability is effectively offset by the mark-to-market impact related to the VRSF.
Controls and Procedures Certification Disclosure Controls and Procedures
Management is responsible for establishing and maintaining a system of controls and procedures over the public disclosure of financial and non-financial information regarding the Company. Such controls and procedures are designed to provide reasonable assurance that all relevant information is gathered and reported to senior management, including the Chief Executive Officer (CEO) and Chief Financial Officer (CFO), on a timely basis so that appropriate decisions can be made regarding public disclosure.
The CEO and the CFO, together with other members of management, have designed the Company’s disclosure controls and procedures in order to provide reasonable assurance that material information relating to the Company and its consolidated subsidiaries would have been known to them, and by others, within those entities.

Finning International Inc. Fourth Quarter and Annual 2008 Results
34
The Company has a Disclosure Policy and a Disclosure Committee in place to mitigate risks associated with the disclosure of inaccurate or incomplete information, or failure to disclose required information.
• The Disclosure Policy sets out accountabilities, authorized spokespersons, and Finning’s approach to the determination, preparation, and dissemination of material information. The policy also defines restrictions on insider trading and the handling of confidential information.
• A Disclosure Committee, consisting of senior management and external legal counsel, review all financial information prepared for communication to the public to ensure it meets all regulatory requirements and is responsible for raising all outstanding issues it believes require the attention of the Audit Committee prior to recommending disclosure for that Committee’s approval.
Internal Control over Financial Reporting
Management is responsible for establishing and maintaining adequate internal control over financial reporting. Management have designed internal control over financial reporting to provide reasonable assurance regarding the reliability of financial reporting and the preparation of financial statements in accordance with Canadian GAAP. There has been no change in the design of the Company’s internal control over financial reporting during the quarter ended December 31, 2008, that would materially affect, or is reasonably likely to materially affect, the Company’s internal control over financial reporting.
Evaluation of Effectiveness
As required by National Instrument 52-109, Certification of Disclosure in Issuers’ Annual and Interim Filings (NI 52-109) issued by the Canadian Securities regulatory authorities, an evaluation and testing of the effectiveness of the design and operation of the Company’s disclosure controls and procedures and internal control over financial reporting were conducted as of December 31, 2008, by and under the supervision of management, including the CEO and CFO. In making the assessment of the effectiveness of the Company’s internal control over financial reporting, management used the criteria set forth by the Committee of Sponsoring Organizations of the Treadway Commission (COSO) in Internal Control – Integrated Framework. The evaluation included documentation review, enquiries, and other procedures considered by management to be appropriate in the circumstances.
Based on that evaluation, the CEO and CFO have concluded that the Company’s disclosure controls and internal control over financial reporting were effective as of December 31, 2008.
Regular involvement of Internal Audit and quarterly reporting to the Audit Committee and the Company’s external auditors assists in providing reasonable assurance that the objectives of the control system are met. While the officers of the Company have designed the Company’s disclosure controls and procedures and internal control over financial reporting, they expect that these controls and procedures may not prevent all errors and fraud. A control system, no matter how well conceived or operated, can only provide reasonable, not absolute, assurance that the objectives of the control system are met.

Finning International Inc. Fourth Quarter and Annual 2008 Results
35
Selected Quarterly Information $ millions, except for share and option data
2008
2007
Q4 Q3 Q2 Q1 Q4 Q3 Q2 Q1 Revenue (1)
Canada $ 826.0 $ 748.9 $ 849.1 $ 792.9 $ 750.3 $ 639.9 $ 846.4 $ 699.6
South America 464.3 389.7 340.7 306.9 348.0 317.4 321.6 338.6
UK Group 276.4 324.6 341.5 330.4 361.2 371.8 329.6 337.8
Total revenue $ 1,566.7 $ 1,463.2 $ 1,531.3 $ 1,430.2 $1,459.5 $1,329.1 $1,497.6 $1,376.0
Net income (loss) (1) (2)
from continuing operations $ (106.8) $ 64.8 $ 67.2 $ 70.8 $ 70.5 $ 63.6 $ 75.3 $ 70.7
from discontinued operations — — — — — — (1.2) (0.8)
Total net income $ (106.8) $ 64.8 $ 67.2 $ 70.8 $ 70.5 $ 63.6 $ 74.1 $ 69.9
Basic Earnings (Loss) Per Share (1) (2) (3)
from continuing operations $ (0.63) $ 0.38 $ 0.39 $ 0.41 $ 0.40 $ 0.35 $ 0.42 $ 0.39
from discontinued operations — — — — — — (0.01) —
Total basic EPS $ (0.63) $ 0.38 $ 0.39 $ 0.41 $ 0.40 $ 0.35 $ 0.41 $ 0.39
Diluted Earnings (Loss) Per Share (1) (2) (3)
from continuing operations $ (0.62) $ 0.37 $ 0.39 $ 0.40 $ 0.39 $ 0.35 $ 0.42 $ 0.39
from discontinued operations — — — — — — (0.01) —
Total diluted EPS $ (0.62) $ 0.37 $ 0.39 $ 0.40 $ 0.39 $ 0.35 $ 0.41 $ 0.39
Total assets (1) $ 4,720.4 $ 4,604.4 $ 4,603.8 $ 4,527.8 $ 4,134.2 $ 4,079.7 $ 4,434.4 $ 4,386.2
Long-term debt
Current $ 2.6 $ 2.5 $ 100.5 $ 215.9 $ 215.7 $ 204.2 $ 204.1 $ 2.2
Non-current 1,410.7 1,313.1 1,121.8 605.7 590.4 554.5 600.6 753.8
Total long-term debt (4) $ 1,413.3 $ 1,315.6 $1,222.3 $ 821.6 $ 806.1 $ 758.7 $ 804.7 $ 756.0 Cash dividends paid per common share (3) $ 0.11 $ 0.11 $ 0.11 $ 0.10 $ 0.10 $ 0.09 $ 0.09 $ 0.08 Common shares outstanding (000’s) (3) 170,445 171,356 172,692 172,623 176,132 178,521 179,601 179,272
Options outstanding (000’s) (3) 6,037 6,200 6,343 4,576 4,656 4,737 4,934 3,606
(1) On January 15, 2008 the Company’s Canadian operations purchased Collicutt Energy Services Ltd. The results of operations and financial position of Collicutt are included in the 2008 figures above.
On July 31, 2007, the Company’s U.K. subsidiary, Hewden Stuart Plc, sold its Tool Hire Division. Results from the Tool Hire Division qualify as discontinued operations and have been reclassified to that category for all periods presented. Included in the loss from discontinued operations in the third quarter of 2007 is the after-tax gain on the sale of the Tool Hire Division of $0.1 million. Restructuring and other costs associated with the disposition of $2.0 million after tax were recorded in the second and third quarters of 2007. Revenues from the UK Tool Hire Division have been excluded from the revenue figures above. Assets from the Tool Hire Division have been included in the total assets figures for periods prior to their sale.
(2) The Company performed its annual goodwill impairment review in the fourth quarter of 2008 and determined that the fair value of Hewden was less than its book value, which included goodwill on acquisition. As a result, the Company recorded a full goodwill impairment of $151.4 million for Hewden in the fourth quarter of 2008. The goodwill impairment charge is non-cash in nature and does not affect the Company’s liquidity, cash flows from operating activities, or debt covenants and is not expected to have any adverse impact on future operations. The Company expects no income tax deduction from this charge.
(3) On May 9, 2007, the Company’s shareholders approved a split of the Company’s outstanding common shares on a two-for-one basis. Each shareholder of record at the close of business on May 30, 2007, received one additional share for every outstanding share held on the record date. All share and per-share data have been adjusted to reflect the stock split. During 2008, the Company repurchased 5,901,842 common shares at an average price of $24.99 as part of a normal course issuer bid. During 2007, 3,691,400 common shares were repurchased at an average price of $27.82.
Earnings per share (EPS) for each quarter has been computed based on the weighted average number of shares issued and outstanding during the respective quarter; therefore, quarterly amounts may not add to the annual or year-to-date total.
(4) In the second quarter of 2008, the Company issued two unsecured Medium Term Notes (MTN); a five year $250 million MTN and a 10 year $350 million MTN. Proceeds from these issuances were used for debt repayment, including the repayment of a $200 million MTN which expired in June 2008 as well as outstanding commercial paper borrowings.

Finning International Inc. Fourth Quarter and Annual 2008 Results
36
New Accounting Pronouncements Changes Adopted in 2008
Effective January 1, 2008, the Company adopted the following new accounting standards issued by the Canadian Institute of Chartered Accountants (CICA): Section 3031, Inventories; Section 3862, Financial Instruments – Disclosures; and Section 3863, Financial Instruments – Presentation. The principal changes related to these standards are described below.
(i) Inventories The new standard provides more guidance on the measurement and disclosure requirements for inventories. Specifically the new pronouncement requires inventories to be measured at the lower of cost and net realizable value, and provides guidance on the determination of cost and its subsequent recognition as an expense, including any write-down to net realizable value.
The new standard has been applied prospectively; accordingly comparative periods have not been restated. However, prior period financial statements retroactively reflect the classification of external unbilled service work in progress, which was previously presented in inventory. Adjustments to the previous carrying amount of inventories have been recognized as an adjustment of the balance of retained earnings as at January 1, 2008.
As at January 1, 2008, the impact on the consolidated balance sheet as a result of the adoption of these standards was an increase in inventory of $8.7 million; an increase in future income tax liability of $2.4 million; and an increase in retained earnings of $6.3 million.
The effect on net income for the year ended December 31, 2008 as a result of adopting the new standard is not material.
Details of the specific impact of these standards on the Company are disclosed in Note 1 to the Company’s Consolidated Interim Financial Statements
(ii) Financial Instrument Disclosures Section 3862 Financial Instruments – Disclosures and Section 3863 Financial Instruments – Presentation, together comprise a complete set of disclosure and presentation requirements that revise and enhance current disclosure requirements for financial instruments, as discussed further in Note 4 to the consolidated financial statements. Section 3862 requires disclosure of additional detail by financial asset and liability categories. Section 3863 establishes standards for presentation of financial instruments and non-financial derivatives. It deals with the classification of financial instruments, from the perspective of the issuer, between liabilities and equity, the classification of related interest, dividends, losses, and gains, and the circumstances in which financial assets and financial liabilities are offset.
Future Accounting Pronouncements
(a) Goodwill and Intangible Assets In February 2008, the CICA issued Section 3064, Goodwill and Intangible Assets, replacing Section 3062, Goodwill and Other Intangible Assets and Section 3450, Research and Development Costs. The new pronouncement establishes standards for the recognition, measurement, presentation, and disclosure of goodwill subsequent to its initial recognition and of intangible assets by profit-oriented enterprises. Standards concerning goodwill are unchanged from the standards included in the previous Section 3062. This Section is effective in the first quarter of 2009, and the new standard does not have a material impact on the Company’s consolidated financial statements.

Finning International Inc. Fourth Quarter and Annual 2008 Results
37
(b) Business Combinations In January 2009, the CICA issued Section 1582, Business Combinations, Section 1601, Consolidations, and Section 1602, Non-controlling Interests. These new standards are harmonized with International Financial Reporting Standards (IFRS). Section 1582 specifies a number of changes, including: an expanded definition of a business; a requirement to measure all business acquisitions at fair value; a requirement to measure non-controlling interests at fair value; and a requirement to recognize acquisition-related costs as expenses. Section 1601 establishes the standards for preparing consolidated financial statements. Section 1602 specifies that non-controlling interests be treated as a separate component of equity, not as a liability or other item outside of equity. The new standards will become effective in 2011. Early adoption is permitted.
(c) Convergence with International Financial Reporting Standards In February 2008, Canada’s Accounting Standards Board confirmed that Canadian GAAP, as used by public companies, will be converged with International Financial Reporting Standards (IFRS) effective January 1, 2011. The transition from Canadian GAAP to IFRS will be applicable for the Company for the first quarter of 2011 when the Company will prepare both the current and comparative financial information using IFRS.
While IFRS uses a conceptual framework similar to Canadian GAAP, there are significant differences on recognition, measurement, and disclosures. The Company commenced its IFRS conversion project in late 2007. The project consists of four phases: raise awareness; assessment; design; and implementation. With the assistance of an external expert advisor, the Company has completed a high level review of the major differences between Canadian GAAP and IFRS as applicable to the Company. While a number of differences have been identified, the areas of highest potential impact include property, plant and equipment, certain aspects of revenue recognition, income taxes, foreign currency, employee future benefits, stock-based compensation, presentation and disclosure, as well as the initial adoption of IFRS under the provisions of IFRS 1 First Time Adoption. The Company expects the transition to IFRS to impact financial reporting, business processes, internal controls, and information systems.
The Company will initiate the design phase in 2009 which will involve establishing issue-specific work teams to focus on generating options and making recommendations in the identified risk areas. The Company will also establish a communications plan, begin to develop staff training programs, and evaluate the impact of the IFRS transition on other business activities.
Earnings Coverage Ratio The following earnings coverage ratio is calculated for the twelve months ended December 31, 2008 and constitutes an update to the earnings coverage ratio described in the Company's short form base shelf prospectus dated May 5, 2008.
Twelve months ended December 31, 2008 Earnings coverage ratio 2.8
The earnings coverage ratio is calculated by dividing: (a) the Company’s earnings from continuing operations before interest and taxes for the period stated; by (b) finance costs incurred over the period stated.
The earnings coverage ratio was negatively impacted by the non-cash goodwill impairment charge noted throughout this MD&A. Excluding the impact of this charge, the earnings coverage ratio would have been 4.6.
Finning International Inc. Fourth Quarter and Annual 2008 Results
38
Outstanding Share Data As at February 13, 2009 Common shares outstanding 170,533,067 Options outstanding 5,837,770
Market Outlook The world’s financial crisis and liquidity concerns continued through the fourth quarter of 2008. The resultant expected economic slowdown has occurred and commodity prices have fallen to comparatively low levels. Spending has been curbed by consumers in most parts of the world. Reduced consumer demand, lower availability of credit and reduced access to capital markets will impact some of Finning’s customers who will have less demand for new equipment as a result.
However, Governments around the world have responded with stimulus packages that include significant amounts of capital spending directed to infrastructure projects. Much of this construction will require heavy equipment and will provide work for some of Finning’s customers.
In Western Canada, existing operations in the oil sands as well as the larger coal and copper mining operations continue to operate at high levels in order to maximize cash flow and achieve lowest cost per ton economics. High equipment operating levels support Finning’s parts and service business. Some new projects have been delayed or deferred and capital expenditure plans have been scaled back pending a return to higher commodity prices. Construction spending continues on infrastructure projects, especially by Governments. Engine sales to gas compression packagers, for international sales, continues at good levels. The residential construction, forestry, and conventional oil and gas industries in Western Canada continue to experience considerably slower business conditions and equipment purchases are expected to remain at lower levels. This situation is expected to continue through 2009.
Heavy equipment markets in Chile remain comparatively healthy and demand for the Company's products and services continues at reasonable levels at the present time. Demand for equipment and support services for the Chilean construction industry is fairly good. Sales of engines for power generation have slowed considerably. While copper prices are significantly lower, they are expected to remain at levels which support economic operations at most of Finning’s large South American mining customers. These companies are among the lowest cost producers of copper in the world, and parts and service revenues are expected to continue to grow reflecting the impact of new equipment sales to the industry in the recent past.
In Argentina, significant inflationary cost pressures continue and constrained liquidity in the banking sector is challenging customers in arranging financing for equipment purchases. Finning has been actively managing its business in Argentina to reduce the level of exposure to an economic crisis in that country. This includes keeping parts and equipment inventories at modest levels, ensuring accounts receivable are as current as possible and by managing its operations to run as efficiently as possible with cost increases arising from inflation promptly passed along in the form of price increases.
Business at the Caterpillar dealership in the UK has slowed in most sectors. Demand for equipment from the coal mining sector remains satisfactory, but the downturn in the UK housing market and slowing business conditions are being felt in most other sectors. Market conditions in the UK plant hire (equipment rental) industry are also challenging. The business is highly competitive and utilization rates are lower.
A significant portion of Finning’s business is derived from the sale of parts and service for previously sold equipment operating in Finning’s geographic territories. Given the large volumes of new equipment sold in recent years, the demand for parts and service is expected to remain reasonably good. Finning’s large mining and oil sands customers continue to run their equipment at high levels and continue to require significant parts and service from Finning.
Finning International Inc. Fourth Quarter and Annual 2008 Results
39
Given the current economic uncertainty, management’s confidence in predicting future business levels is lower than in the past. The current outlook is for lower new equipment sales compared to 2008 and for parts and services revenues to grow, but at a more modest rate than the prior year. 2009 results are also expected to generate higher cash flow than 2008 as working capital requirements are reduced, and assuming budgeted levels of equipment sales are achieved. Overall expenditures on equipment additions to Finning’s rental fleets are expected to be meaningfully reduced in 2009; however, demand for rental equipment, as an alternative to purchasing, is increasing among Finning’s customers, especially in Canada.
Finning’s financial condition is strong. The Company has committed bank facilities totalling approximately $870 million with various Canadian and U.S. financial institutions. The largest of these facilities ($800 million) is committed until December 2011. At December 31, 2008 over $300 million was available under these facilities. At January 31, 2009 approximately $230 million was available. Finning expects to generate higher cash flow in 2009 as a result of lower capital spending, lower rental equipment additions, and reduced working capital requirements. Given the expected improved cash flow, the committed credit facilities, and the discretionary nature of some of Finning’s cash outflows, such as rental additions and capital expenditures, as well as the absence of any term debt maturities until late 2011, management believes that Finning has sufficient credit and liquidity to meet operational needs in the foreseeable future.
Finning has taken extensive action to reduce its costs in the face of lower demand for equipment. In response to the current market conditions, Finning incurred restructuring costs globally during the fourth quarter of 2008, resulting in a reduction of headcount of approximately 700 employees. However, its long term strategy is unchanged as it continues to focus on the parts and service business as well as the mining and heavy construction sectors. Finning expects to continue to invest in technical training, and in some locations additional human resources are still required to meet the projected strategic growth. These include Fort McMurray, Edmonton, and some mining branches in Chile.
The decreases in security values in global financial markets in the latter part of 2008 will have an impact on the pension funding and expense levels of Finning’s defined benefit pension plans going forward. The predominant pension arrangement in Canada going forward is a defined contribution plan, with the existing defined benefit plan having been closed to new members (other than executives) since 2004. The Company’s South American employees do not participate in a Company pension plan. As such, the more significant impact on pension funding and pension expense would relate to the UK operations although the UK defined benefit plans are also essentially closed to new entrants (new hires now participate in a defined contribution arrangement, if any), a significant liability still exists. At present, management anticipates that the changes to the funded level and related pension expense of its defined benefit pension plans will be manageable.
Finning’s financial results are impacted by changes to the value of the Canadian dollar compared to the U.S. dollar and the U.K. pound sterling in the translation of its foreign currency earnings. The Company’s 2008 results were negatively impacted as a result of translating foreign currency based earnings from the strengthening of the Canadian dollar in the first half of 2008. Nominal changes in average foreign exchange rates in the third quarter of 2008 had a minimal impact on third quarter financial results. Foreign exchange had a positive impact on net income in the fourth quarter due to the weaker Canadian dollar relative to the U.S. dollar, compared to the prior year’s fourth quarter. For the year ended December 31, 2008, net income was negatively impacted by approximately $0.10 per share compared to last year. The impact of foreign exchange due to the movement of the Canadian dollar relative to the U.S. dollar and the U.K. pound sterling is expected to continue to affect Finning’s results in 2009.
February 18, 2009

Finning International Inc. Fourth Quarter and Annual 2008 Results
40
Selected annual information ($ millions, except for share data) 2008 2007 2006 Total revenue (1) 5,991.4 5,662.2 4,853.2 Net income (loss) (1) (2)
before goodwill impairment 247.4 280.1 236.2 goodwill impairment (151.4) — — from continuing operations 96.0 280.1 236.2 from discontinued operations — (2.0) (32.1)
Total net income 96.0 278.1 204.1 Basic Earnings (Loss) Per Share (1) (2) (3)
before goodwill impairment 1.44 1.57 1.32 goodwill impairment (0.88) — — from continuing operations 0.56 1.57 1.32 from discontinued operations — (0.01) (0.18)
Total basic EPS 0.56 1.56 1.14 Diluted Earnings (Loss) Per Share (1) (2) (3)
before goodwill impairment 1.43 1.55 1.31 goodwill impairment (0.88) — — from continuing operations 0.55 1.55 1.31 from discontinued operations — (0.01) (0.18)
Total diluted EPS 0.55 1.54 1.13 Total assets (1) (2) 4,720.4 4,134.2 4,200.8 Long-term debt (4) Current 2.6 215.7 2.2 Non-current 1,410.7 590.4 735.9 1,413.3 806.1 738.1 Cash dividends declared per common share (3) 0.43 0.36 0.275
1) On July 31, 2007, the Company’s U.K. subsidiary, Hewden Stuart Plc, sold its Tool Hire Division. On September 29, 2006, the Company’s U.K. subsidiary, Finning (UK), sold its Materials Handling Division.
Results from the Tool Hire and Materials Handling divisions qualify as discontinued operations and have been reclassified to that category for all periods presented. Included in the loss from discontinued operations in 2007 is the after-tax gain on the sale of the Tool Hire Division of $0.1 million. Included in the loss from discontinued operations in 2006 is the after-tax loss on the sale of the Materials Handling Division of $32.7 million or $0.18 per share. Revenues from the UK Tool Hire and Materials Handling divisions have been excluded from the revenue figures above. Assets from the Tool Hire and Materials Handling divisions have been included in the total assets figures for periods prior to their sale.
On January 15, 2008 the Company’s Canadian operations purchased Collicutt Energy Services Ltd. The results of operations and financial position of Collicutt are included in the 2008 figures above.
(2) The Company performed its annual goodwill impairment review in the fourth quarter of 2008 and determined that the fair value of Hewden was less than its book value, which included goodwill on acquisition. As a result, the Company recorded a full goodwill impairment charge of $151.4 million for Hewden in the fourth quarter of 2008. The goodwill impairment charge is non-cash in nature and does not affect the Company’s liquidity, cash flows from operating activities, or debt covenants and is not expected to have any adverse impact on future operations. The Company expects no income tax deduction from this charge.
(3) On May 9, 2007, the Company’s shareholders approved a split of the Company’s outstanding common shares on a two-for-one basis. Each shareholder of record at the close of business on May 30, 2007, received one additional share for every outstanding share held on the record date. All share and per-share data have been adjusted to reflect the stock split. During 2008, the Company repurchased 5,901,842 common shares at an average price of $24.99 as part of a normal course issuer bid. During 2007, 3,691,400 common shares were repurchased at an average price of $27.82.
Earnings per share (EPS) for each quarter has been computed based on the weighted average number of shares issued and outstanding during the respective quarter; therefore, quarterly amounts may not add to the annual or year-to-date total.
(4) In 2008, the Company issued two unsecured Medium Term Notes (MTN); a five year $250 million MTN and a 10 year $350 million MTN. Proceeds from these issuances were used for debt repayment, including the repayment of a $200 million MTN which expired in June 2008 as well as outstanding commercial paper borrowings.

Finning International Inc. Fourth Quarter and Annual 2008 Results
41
Attachment 1
Supplementary Information
Quarterly Segmented Revenue Information
Three months ended December 31, 2008 ($ millions) Canada
South America
UK Group Consolidated
Revenue percentage
New mobile equipment $ 356.6 $ 195.5 $ 72.7 $ 624.8 39.9% New power & energy systems 58.3 45.1 31.1 134.5 8.6% Used equipment 77.5 10.7 35.3 123.5 7.9% Equipment rental 81.6 15.3 75.7 172.6 11.0% Customer support services 248.0 197.1 61.6 506.7 32.3% Other 4.0 0.6 — 4.6 0.3%
Total $ 826.0 $ 464.3 $ 276.4 $ 1,566.7 100.0%
Revenue percentage by operations 52.7% 29.6% 17.7% 100.0% Three months ended December 31, 2007 ($ millions) Canada
South America
UK Group Consolidated
Revenue percentage
New mobile equipment $ 341.8 $ 154.1 $ 114.4 $ 610.3 41.8%
New power & energy systems 45.9 35.9 61.1 142.9 9.8%
Used equipment 81.1 9.2 26.8 117.1 8.0%
Equipment rental 73.6 9.2 105.2 188.0 12.9%
Customer support services 201.6 138.5 53.7 393.8 27.0%
Other 6.3 1.1 — 7.4 0.5%
Total $ 750.3 $ 348.0 $ 361.2 $ 1,459.5 100.0%
Revenue percentage by operations 51.4% 23.9% 24.7% 100.0%

Finning International Inc. Fourth Quarter and Annual 2008 Results
42
Attachment 1 [continued]
Supplementary Information
Quarterly Segmented EBIT Information
Three months ended December 31, 2008 ($ thousands) Canada
South America
UK Group Other
Goodwill Impairment Consolidated
Revenue from external sources $ 826.0 $ 464.3 $ 276.4 $ — $ — $ 1,566.7 Operating costs (719.6) (410.7) (250.5) (16.5) — (1,397.3) Depreciation and amortization (45.2) (10.4) (30.2) (0.1) — (85.9) Other income (expenses) (14.1) (4.9) (5.4) 7.8 — (16.6) Goodwill impairment — — — — (151.4) (151.4)
Earnings before interest and taxes $ 47.1 $ 38.3 $ (9.7) $ (8.8) $ (151.4) $ (84.5)
Earnings before interest and tax
- percentage of revenue 5.7% 8.2% (3.5)% — — (5.4)% - percentage by operations (excluding
goodwill impairment) 70.4% 57.3% (14.5)% (13.2)% — 100.0% Three months ended December 31, 2007 ($ thousands) Canada
South America
UK Group Other
Goodwill Impairment Consolidated
Revenue from external sources $ 750.3 $ 348.0 $ 361.2 $ — $ — $ 1,459.5
Operating costs (642.4) (312.7) (309.4) (1.4) — (1,265.9)
Depreciation and amortization (40.6) (5.5) (36.1) — — (82.2)
Other income (expenses) 2.0 (1.6) 0.4 — — 0.8
Earnings before interest and taxes $ 69.3 $ 28.2 $ 16.1 $ (1.4) $ — $ 112.2
Earnings before interest and tax
- percentage of revenue 9.2% 8.1% 4.5% — — 7.7%
- percentage by operations 61.8% 25.1% 14.3% (1.2)% — 100.0%

Finning International Inc. Fourth Quarter and Annual 2008 Results
43
Attachment 1 [continued]
Supplementary Information
Quarterly Consolidated Statements of Income
Three months ended December 31 ($ thousands, except share and per share amounts)
2008 unaudited
2007 unaudited
Revenue New mobile equipment $ 624,843 $ 610,301 New power and energy systems 134,498 142,907 Used equipment 123,461 117,079 Equipment rental 172,582 188,021 Customer support services 506,747 393,831 Other 4,617 7,355
Total revenue 1,566,748 1,459,494 Cost of sales 1,134,567 1,050,678 Gross profit 432,181 408,816 Selling, general, and administrative expenses 348,632 297,491 Other expenses (income) 16,611 (870) Goodwill impairment 151,373 — Earnings before interest and income taxes (84,435) 112,195 Finance costs 21,765 18,943 Income (loss) before provision for income taxes (106,200) 93,252 Provision for income taxes 629 22,732 Net income (loss) $ (106,829) $ 70,520 Earnings per share – basic $ (0.63) $ 0.40
Earnings per share – diluted $ (0.62) $ 0.39 Weighted average number of shares outstanding
Basic 170,518,739 177,594,478 Diluted 170,971,810 179,097,027

Finning International Inc. Fourth Quarter and Annual 2008 Results
44
Attachment 1 [continued]
Supplementary Information
Quarterly Consolidated Statements of Cash Flow
Three months ended December 31 ($ thousands)
2008 unaudited
2007 unaudited
OPERATING ACTIVITIES Net income (loss) $ (106,829) $ 70,520 Add items not affecting cash
Depreciation and amortization 86,660 82,198 Future income taxes (2,331) 21,246 Stock-based compensation 3,008 (5,195) Gain on disposal of capital assets (2,824) (3,340) Goodwill impairment 151,373 — Other (117) (178) 128,940 165,251
Changes in working capital items 40,102 56,023 Cash provided after changes in working capital items 169,042 221,274
Rental equipment, net of disposals 8,404 (14,162) Equipment leased to customers, net of disposals (270) 150
Cash flow provided by operating activities 177,176 207,262 INVESTING ACTIVITIES Additions to capital assets (31,619) (22,455) Proceeds on disposal of capital assets 6,161 10,640 Acquisition of businesses (9,373) — Payment of contingent consideration — (500) Proceeds on settlement of foreign currency forwards — 673
Cash used in investing activities (34,831) (11,642) FINANCING ACTIVITIES Decrease in short-term debt (143,267) (79,740) Increase in long-term debt 83,317 62,887 Repurchase of securitized accounts receivable — (45,000) Issue of common shares on exercise of stock options 125 625 Repurchase of common shares (17,468) (67,325) Dividends paid (18,746) (17,791)
Cash used in financing activities (96,039) (146,344) Effect of currency translation on cash balances 6,975 (7,801) Increase in cash and cash equivalents 53,281 41,475 Cash and cash equivalents, beginning of period 56,491 20,385 Cash and cash equivalents, end of period $ 109,772 $ 61,860

Finning International Inc. Annual 2008 Results
Consolidated Financial Statements
45
CONSOLIDATED STATEMENTS OF INCOME
For years ended December 31 ($ thousands, except share and per share amounts) 2008 2007 Revenue
New mobile equipment $ 2,376,933 $ 2,233,512 New power and energy systems 551,710 503,012 Used equipment 431,804 417,613 Equipment rental 712,791 781,194 Customer support services 1,899,483 1,701,253 Other 18,704 25,660
Total revenue 5,991,425 5,662,244 Cost of sales 4,276,749 4,063,079 Gross profit 1,714,676 1,599,165 Selling, general, and administrative expenses 1,309,756 1,144,753 Other expenses (income) (Note 2) 16,801 (1,435) Goodwill impairment (Note 17) 151,373 — Earnings from continuing operations before interest and income taxes 236,746 455,847 Finance costs (Notes 3 and 4) 83,636 72,842 Income from continuing operations before provision for income taxes 153,110 383,005 Provision for income taxes (Note 6) 57,114 102,898 Net income from continuing operations 95,996 280,107 Loss from discontinued operations, net of tax (Note 16) — (2,050) Net income $ 95,996 $ 278,057 Earnings (loss) per share – basic
From continuing operations (Note 9) $ 0.56 $ 1.57 From discontinued operations — (0.01) $ 0.56 $ 1.56
Earnings (loss) per share – diluted From continuing operations (Note 9) $ 0.55 $ 1.55 From discontinued operations — (0.01) $ 0.55 $ 1.54
Weighted average number of shares outstanding
Basic 172,361,881 178,844,411 Diluted 173,318,957 180,459,955
The accompanying Notes to the Consolidated Financial Statements are an integral part of these statements.
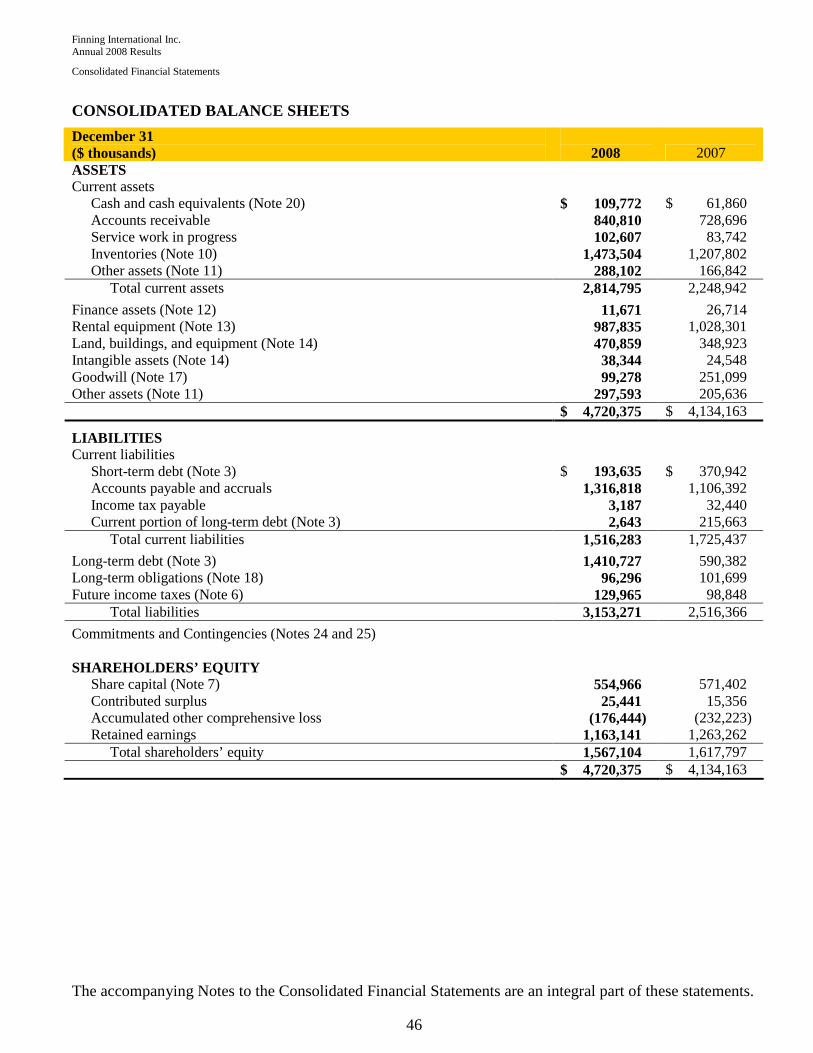
Finning International Inc. Annual 2008 Results
Consolidated Financial Statements
46
CONSOLIDATED BALANCE SHEETS
December 31 ($ thousands)
2008 2007
ASSETS Current assets
Cash and cash equivalents (Note 20) $ 109,772 $ 61,860 Accounts receivable 840,810 728,696 Service work in progress 102,607 83,742 Inventories (Note 10) 1,473,504 1,207,802 Other assets (Note 11) 288,102 166,842
Total current assets 2,814,795 2,248,942 Finance assets (Note 12) 11,671 26,714 Rental equipment (Note 13) 987,835 1,028,301 Land, buildings, and equipment (Note 14) 470,859 348,923 Intangible assets (Note 14) 38,344 24,548 Goodwill (Note 17) 99,278 251,099 Other assets (Note 11) 297,593 205,636 $ 4,720,375 $ 4,134,163 LIABILITIES Current liabilities
Short-term debt (Note 3) $ 193,635 $ 370,942 Accounts payable and accruals 1,316,818 1,106,392 Income tax payable 3,187 32,440 Current portion of long-term debt (Note 3) 2,643 215,663
Total current liabilities 1,516,283 1,725,437 Long-term debt (Note 3) 1,410,727 590,382 Long-term obligations (Note 18) 96,296 101,699 Future income taxes (Note 6) 129,965 98,848
Total liabilities 3,153,271 2,516,366 Commitments and Contingencies (Notes 24 and 25) SHAREHOLDERS’ EQUITY
Share capital (Note 7) 554,966 571,402 Contributed surplus 25,441 15,356 Accumulated other comprehensive loss (176,444) (232,223) Retained earnings 1,163,141 1,263,262
Total shareholders’ equity 1,567,104 1,617,797 $ 4,720,375 $ 4,134,163 The accompanying Notes to the Consolidated Financial Statements are an integral part of these statements.
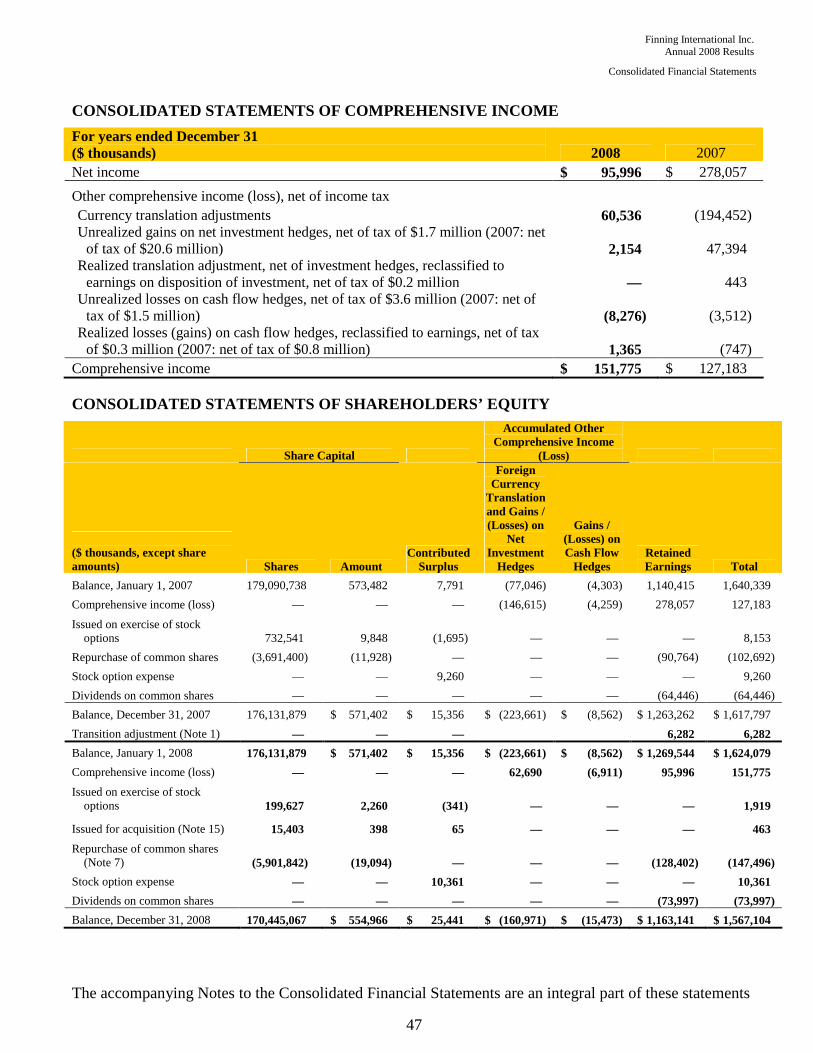
Finning International Inc. Annual 2008 Results
Consolidated Financial Statements
47
CONSOLIDATED STATEMENTS OF COMPREHENSIVE INCOME
For years ended December 31 ($ thousands) 2008 2007 Net income $ 95,996 $ 278,057
Other comprehensive income (loss), net of income tax Currency translation adjustments 60,536 (194,452) Unrealized gains on net investment hedges, net of tax of $1.7 million (2007: net
of tax of $20.6 million) 2,154 47,394 Realized translation adjustment, net of investment hedges, reclassified to
earnings on disposition of investment, net of tax of $0.2 million — 443 Unrealized losses on cash flow hedges, net of tax of $3.6 million (2007: net of
tax of $1.5 million) (8,276) (3,512) Realized losses (gains) on cash flow hedges, reclassified to earnings, net of tax
of $0.3 million (2007: net of tax of $0.8 million) 1,365 (747) Comprehensive income $ 151,775 $ 127,183
CONSOLIDATED STATEMENTS OF SHAREHOLDERS’ EQUITY
Share Capital
Accumulated Other Comprehensive Income
(Loss)
($ thousands, except share amounts) Shares Amount
Contributed Surplus
Foreign Currency
Translation and Gains / (Losses) on
Net Investment
Hedges
Gains / (Losses) on Cash Flow
Hedges Retained Earnings Total
Balance, January 1, 2007 179,090,738 573,482 7,791 (77,046) (4,303) 1,140,415 1,640,339
Comprehensive income (loss) — — — (146,615) (4,259) 278,057 127,183
Issued on exercise of stock options 732,541 9,848 (1,695) — — — 8,153
Repurchase of common shares (3,691,400) (11,928) — — — (90,764) (102,692)
Stock option expense — — 9,260 — — — 9,260
Dividends on common shares — — — — — (64,446) (64,446)
Balance, December 31, 2007 176,131,879 $ 571,402 $ 15,356 $ (223,661) $ (8,562) $ 1,263,262 $ 1,617,797
Transition adjustment (Note 1) — — — 6,282 6,282
Balance, January 1, 2008 176,131,879 $ 571,402 $ 15,356 $ (223,661) $ (8,562) $ 1,269,544 $ 1,624,079
Comprehensive income (loss) — — — 62,690 (6,911) 95,996 151,775
Issued on exercise of stock options 199,627 2,260 (341) — — — 1,919
Issued for acquisition (Note 15) 15,403 398 65 — — — 463
Repurchase of common shares (Note 7) (5,901,842) (19,094) — — — (128,402) (147,496)
Stock option expense — — 10,361 — — — 10,361
Dividends on common shares — — — — — (73,997) (73,997)
Balance, December 31, 2008 170,445,067 $ 554,966 $ 25,441 $ (160,971) $ (15,473) $ 1,163,141 $ 1,567,104
The accompanying Notes to the Consolidated Financial Statements are an integral part of these statements

Finning International Inc. Annual 2008 Results
Consolidated Financial Statements
48
CONSOLIDATED STATEMENTS OF CASH FLOW
For years ended December 31 ($ thousands) 2008 2007 OPERATING ACTIVITIES Net income $ 95,996 $ 278,057 Add items not affecting cash
Depreciation and amortization 326,095 351,289 Future income taxes 9,822 18,393 Stock-based compensation 14,144 25,540 Gain on disposal of capital assets (Note 2) (19,892) (6,552) Goodwill impairment 151,373 — Gain on disposal of discontinued operations (Note 16) — (38,590) Other (816) (5,122) 576,722 623,015
Changes in working capital items (Note 20) (298,589) (218,588) Cash provided after changes in working capital items 278,133 404,427
Rental equipment, net of disposals (204,800) (474,566) Equipment leased to customers, net of disposals (652) 13,449
Cash flow provided by (used in) operating activities 72,681 (56,690) INVESTING ACTIVITIES Additions to capital assets (100,417) (74,226) Proceeds on disposal of capital assets 50,954 20,212 Proceeds from sale of discontinued operations (Note 16) — 242,851 Acquisition of businesses (Notes 11, 15 and 17) (148,639) (2,670) Payment of contingent consideration — (767) Payments on settlement of foreign currency forwards — (4,065)
Cash provided by (used in) investing activities (198,102) 181,335 FINANCING ACTIVITIES Decrease in short-term debt (198,147) (43,608) Increase of long-term debt 589,861 135,642 Payment on settlement of derivative (8,914) — Repurchase of securitized accounts receivable (Note 27) — (45,000) Defined benefit pension plan special funding (Note 21) — (17,066) Issue of common shares on exercise of stock options 1,919 8,153 Repurchase of common shares (Note 7) (147,496) (102,692) Dividends paid (73,997) (64,446)
Cash provided by (used in) financing activities 163,226 (129,017) Effect of currency translation on cash balances 10,107 (12,253) Increase (decrease) in cash and cash equivalents 47,912 (16,625) Cash and cash equivalents, beginning of year 61,860 78,485 Cash and cash equivalents, end of year $ 109,772 $ 61,860 See supplemental cash flow information, Note 20 The accompanying Notes to the Consolidated Financial Statements are an integral part of these statements.

Finning International Inc. Annual 2008 Results
Notes to Consolidated Financial Statements
49
1. SIGNIFICANT ACCOUNTING POLICIES
These Consolidated Financial Statements have been prepared in accordance with Canadian generally accepted accounting principles (GAAP) and are presented in Canadian dollars, unless otherwise stated.
The significant accounting policies used in these Consolidated Financial Statements are as follows:
(a) Principles of Consolidation The Consolidated Financial Statements include the accounts of Finning International Inc. (“Finning” or “Company”), which includes the Finning (Canada) division, Finning’s wholly owned subsidiaries, and its proportionate share of joint venture investments. Principal operating subsidiaries include Finning (UK) Ltd., Finning Chile S.A., Hewden Stuart plc (“Hewden”), Finning Argentina S.A. and Finning Soluciones Mineras S.A. (in Argentina), Finning Uruguay S.A., and Finning Bolivia S.A. The Company’s principal joint venture is PipeLine Machinery International (PLM), in which Finning has a 25% interest.
For interests acquired or disposed of during the year, the results of operations are included in the consolidated statements of income from, or up to, the date of the transaction, respectively.
(b) Use of Estimates The preparation of consolidated financial statements in accordance with Canadian GAAP requires the Company’s management to make estimates and assumptions about future events that affect the reported amounts of assets, liabilities, revenues, expenses, and disclosure of contingent assets and liabilities. Actual amounts may differ from those estimates.
Significant estimates used in the preparation of these consolidated financial statements include, but are not limited to, fair values for goodwill impairment tests, allowance for doubtful accounts, provisions for inventory obsolescence, reserves for warranty, provisions for income tax, the determination of employee future benefits, the useful lives of the rental fleet and related residual values, costs associated with maintenance and repair contracts, and provisions for restructuring costs.
(c) Foreign Currency Translation Transactions undertaken in foreign currencies are translated into Canadian dollars at exchange rates prevailing at the time the transactions occurred. Account balances denominated in foreign currencies are translated into Canadian dollars as follows:
• Monetary assets and liabilities are translated at exchange rates in effect at the balance sheet dates and non-monetary items are translated at historical exchange rates.
• Exchange gains and losses are included in income except where the exchange gain or loss arises from the translation of monetary items designated as hedges, in which case the gain or loss is deferred and accounted for in conjunction with the hedged asset.
Financial statements of foreign operations, all considered self-sustaining, are translated from the functional currency into Canadian dollars as follows:
• Assets and liabilities are translated using the exchange rates in effect at the balance sheet dates.
• Revenue and expense items are translated at average exchange rates prevailing during the period that the transactions occurred.
• Unrealized translation gains and losses are recorded as an item of other comprehensive income and accumulated other comprehensive income. Cumulative currency translation adjustments are recognized in net income when there is a reduction in the net investment in the self-sustaining foreign operation.
The Company has hedged some of its investments in foreign subsidiaries using derivatives and foreign currency denominated borrowings. Exchange gains or losses arising from the translation of the hedge instruments are accounted for as items of other comprehensive income and presented in the accumulated other comprehensive loss account on the consolidated balance sheet.

Finning International Inc. Annual 2008 Results
Notes to Consolidated Financial Statements
50
(d) Cash and Cash Equivalents Short-term investments, consisting of highly rated and liquid money market instruments with original maturities of three months or less, are considered to be cash equivalents and are recorded at fair value, which approximates cost.
(e) Securitization of Trade Receivables In 2002 and 2004, the Company sold a co-ownership interest in certain accounts receivable in Canada to a securitization trust (the “Trust”). These transactions were accounted for as sales to the extent that the Company was considered to have surrendered control over the interest in the accounts receivable and received proceeds from the Trust, other than a beneficial interest in the assets sold. The Company serviced the receivables and recognized a servicing liability on the date of the transfer, which was amortized to income over the expected life of the transferred receivable interest. In November 2007, the co-ownership interest was repurchased from the Trust and the securitization program was terminated.
(f) Inventories Inventories are assets held for sale in the ordinary course of business, in the process of production for sale, or in the form of materials or supplies to be consumed in the production process or in the rendering of services. Inventories are stated at the lower of cost and net realizable value. Cost is determined on a specific item basis for on-hand equipment, and on a weighted average cost basis for parts and supplies. The cost of inventories includes all costs of purchase, conversion costs, and other costs incurred in bringing inventories to their existing location and condition. In the case of internal service work in progress on equipment, cost includes an appropriate share of overhead costs based on normal operating capacity.
(g) Other Assets Investments in which the Company exercises significant influence, but not control, are accounted for using the equity method. A long-term investment is considered impaired if its fair value falls below its cost, and the decline is considered other than temporary.
(h) Income Taxes The asset and liability method of tax allocation is used in accounting for income taxes. Under this method, temporary differences arising from the difference between the tax basis of an asset and a liability and its carrying amount on the balance sheet are used to calculate future income tax assets or liabilities. Future income tax assets or liabilities are calculated using tax rates anticipated to be in effect in the periods that the temporary differences are expected to reverse. The effect of a change in income tax rates on future income tax assets and liabilities is recognized in income in the period that the change becomes substantively enacted.
(i) Finance Assets Finance assets comprise instalment notes receivable and equipment leased to customers on long-term financing leases.
Instalment notes receivable represents amounts due from customers relating to financing of equipment sold and parts and service sales. These receivables are recorded net of unearned finance charges.
Depreciation of equipment leased to customers is provided in equal monthly amounts over the terms of the individual leases after recognizing the estimated residual value of each unit at the end of each lease.
(j) Rental Equipment Rental equipment is available for short and medium term rentals and is recorded at cost, net of accumulated depreciation. Cost is determined on a specific item basis. Rental equipment is depreciated to its estimated residual value over its estimated useful life on a straight-line or on an actual usage basis.

Finning International Inc. Annual 2008 Results
Notes to Consolidated Financial Statements
51
(k) Capital Assets Land, buildings, and equipment are recorded at cost, net of accumulated depreciation. Depreciation of these capital assets is recorded in selling, general, and administrative expenses in the consolidated statement of income.
Buildings and equipment are depreciated over their estimated useful lives on either a declining balance or straight-line basis using the following annual rates:
Buildings 2% - 5% General equipment 10% - 33% Automotive equipment 20% - 33%
Intangible assets with indefinite lives are not amortized. Intangible assets with finite lives are amortized on a straight-line basis over their estimated useful lives, which range to a maximum period of ten years. Amortization is recorded in selling, general, and administrative expenses in the consolidated statement of income.
(l) Goodwill Goodwill represents the excess cost of an investment over the fair value of the net assets acquired and is not amortized.
(m) Asset Impairment The Company reviews both long-lived assets to be held and used and identifiable intangible assets with finite lives for impairment whenever events or changes in circumstances indicate that the carrying amount of such assets may not be fully recoverable. Determination of recoverability is based on an estimate of undiscounted future cash flows resulting from the use of the asset and its eventual disposition. Measurement of an impairment loss for long-lived assets and certain identifiable intangible assets that management expects to hold and use is based on the fair value of the assets, whereas assets to be disposed of are reported at the lower of carrying amount or fair value less estimated selling costs. The deterioration in the global economic environment in the last quarter of 2008 triggered the requirement for an impairment analysis on the Company’s long-lived assets and identifiable intangible assets with finite lives as at December 31, 2008. Based on management’s analysis, it was determined there was no impairment of these assets at that time. As at December 31, 2007, the Company determined there were no triggering events requiring an impairment analysis.
Goodwill and intangible assets with indefinite lives are subject to an annual assessment for impairment unless events or changes in circumstances indicate that the value may not be fully recoverable, in which case the assessment is done at that time. Goodwill and intangible assets with indefinite lives are assessed primarily by applying a fair value-based test at the reporting unit level. The fair value is estimated using the present value of expected future cash flows. The Company also considers projected future operating results, trends, and other circumstances in making such evaluations. An impairment loss would be recognized to the extent the carrying amount of goodwill or intangible assets exceeds their fair value – see Note 17.
(n) Leases Leases entered into by the Company as lessee are classified as either capital or operating leases. Leases where all of the benefits and risks of ownership of property rest with the Company are accounted for as capital leases. Equipment under capital lease is depreciated on the same basis as capital assets. Gains or losses resulting from sale/leaseback transactions are deferred and amortized in proportion to the amortization of the leased asset. Rental payments under operating leases are expensed as incurred.

Finning International Inc. Annual 2008 Results
Notes to Consolidated Financial Statements
52
(o) Asset Retirement Obligations The Company recognizes its legal obligations for the retirement of certain tangible long-lived assets. The fair value of a liability for an asset retirement obligation is recognized in the period in which it is incurred if a reasonable estimate of fair value can be made. The associated asset retirement costs are capitalized as part of the carrying amount of the long-lived asset and then amortized over the estimated useful life. In subsequent periods, the asset retirement obligation is adjusted for the passage of time and any changes in the amount or timing of the underlying future cash flows through charges to earnings. A gain or loss may be incurred upon settlement of the liability.
(p) Revenue Recognition Revenue recognition, with the exception of cash sales, occurs when there is a written arrangement in the form of a contract or purchase order with the customer, a fixed or determinable sales price is established with the customer, performance requirements are achieved, and ultimate collection of the revenue is reasonably assured. Revenue is recognized as performance requirements are achieved in accordance with the following:
• Revenue from sales of equipment is recognized at the time title to the equipment and significant risks of ownership passes to the customer, which is generally at the time of shipment of the product to the customer;
• Revenue from sales of power and energy systems includes construction contracts with customers that involve the design, installation, and assembly of power and energy equipment systems. Revenue is recognized on a percentage of completion basis proportionate to the work that has been completed which is based on associated costs incurred;
• Revenue from equipment rentals and operating leases is recognized in accordance with the terms of the relevant agreement with the customer, either evenly over the term of that agreement or on a usage basis such as the number of hours that the equipment is used; and
• Revenue from customer support services includes sales of parts and servicing of equipment. For sales of parts, revenue is recognized when the part is shipped to the customer or when the part is installed in the customer’s equipment. For servicing of equipment, revenue is recognized as the service work is performed. Customer support services are also offered to customers in the form of long-term maintenance and repair contracts. For these contracts, revenue is recognized on a basis proportionate to the service work that has been performed based on the parts and labour service provided. Parts revenue is recognized based on parts list price and service revenue is recognized based on standard billing labour rates. At or near the completion of the contract, any remaining deferred revenue on the contract is recognized as revenue. Any losses estimated during the term of the contract are recognized when identified.
(q) Stock-Based Compensation The Company has stock option plans and other stock-based compensation plans for directors and certain eligible employees which are described in Note 8. Stock-based awards are measured and recognized using a fair value-based method of accounting.
For stock options granted after January 1, 2003, fair value is determined on the grant date of the stock option and recorded as compensation expense over the vesting period, with a corresponding increase to contributed surplus. For stock options granted prior to January 1, 2003, the Company recorded no compensation expense and will continue to use the intrinsic value-based method of accounting for those stock options. When stock options are exercised, the proceeds received by the Company, together with any related amount recorded in contributed surplus, are credited to share capital.
Compensation expense which arises from fluctuations in the market price of the Company’s common shares underlying other stock-based compensation plans (net of hedging instruments) is recognized in
Finning International Inc. Annual 2008 Results
Notes to Consolidated Financial Statements
53
selling, general, and administrative expense in the consolidated income statement with the corresponding liability recorded on the consolidated balance sheet in long-term obligations.
(r) Employee Future Benefits The Company and its subsidiaries offer a number of benefit plans that provide pension and other benefits to many of its employees in Canada and the U.K. These plans include defined benefit and defined contribution plans.
The Company’s South American employees do not participate in employer pension plans but are covered by country specific legislation with respect to indemnity plans. The Company accrues its obligations to employees under these indemnity plans based on the actuarial valuation of anticipated payments to employees.
Defined benefit plans: The cost of pensions and other retirement benefits is determined by independent actuaries using the projected benefit method prorated on service and management’s best estimates of assumptions including the expected return on plan assets and salary escalation rate, along with the use of a discount rate as prescribed under Canadian Institute of Chartered Accountants (CICA) Section 3461, Employee Future Benefits. For the purpose of calculating the expected return on plan assets, those assets are valued at market value.
Past service costs from plan amendments are amortized on a straight-line basis over the expected average remaining service life of employees active at the date of amendment.
Actuarial gains and losses arise from differences between actual experience and that expected as a result of economic, demographic, and other assumptions made. These include the difference between the actual and expected rate of return on plan assets for a period, and differences from changes in actuarial assumptions used to determine the accrued benefit obligation. The excess of the net accumulated actuarial gains or losses over 10% of the greater of the accrued benefit obligation and the market value of the plan assets is amortized on a straight-line basis over the expected average remaining service life of the active employees covered by the plans.
Upon adoption of CICA 3461 on January 1, 2000, a transitional asset or obligation was determined for each plan as a result of the new standard. The Company is amortizing these transitional amounts on a straight-line basis over 13 years for the Finning (Canada) and Hewden plans and over 14 years for the Finning (UK) plan, representing the average remaining service period of employees expected to receive benefits under the benefit plans as of January 1, 2000, the transition date.
Defined contribution plans: The cost of pension benefits includes the current service cost, which comprise the actual contributions made by the Company during the year. These contributions are based on a fixed percentage of member earnings for the year.
(s) Comprehensive Income, Financial Instruments, and Hedges Comprehensive Income Comprehensive income comprises the Company’s net income and other comprehensive income and represents changes in shareholders’ equity during a period arising from non-owner sources. Other comprehensive income includes currency translation adjustments on the Company’s net investment in self-sustaining foreign operations and related hedging gains and losses, unrealized gains and losses on available-for-sale securities, and hedging gains and losses on cash flow hedges. The Company’s comprehensive income, components of other comprehensive income, and accumulated other comprehensive income are presented in the Statements of Comprehensive Income and the Statements of Shareholders’ Equity.

Finning International Inc. Annual 2008 Results
Notes to Consolidated Financial Statements
54
Financial Assets and Financial Liabilities Classification
The Company has made the following classification of its financial assets and financial liabilities:
• Cash equivalents are classified as Held for Trading. They are measured at fair value with realized and unrealized gains and losses reported in net income.
• Accounts receivable, instalment notes receivable, and supplier claims receivable are classified as Loans and Receivables. They are measured at amortized cost using the effective interest rate method. At December 31, 2008 and 2007, the recorded amount approximates fair value.
• Short-term and long-term debt and accounts payable and accruals are classified as “Other Financial Liabilities”. They are measured at amortized cost using the effective interest rate method. At December 31, 2008 and 2007, the measured amount approximates fair value, with the exception of long-term debt. The estimated fair value of the Company’s long-term debt as at December 31, 2008 and 2007 is disclosed in Note 4.
Transaction costs directly attributable to the acquisition or issue of a financial asset or financial liability are included in the carrying amount of the financial asset or financial liability, and are amortized to income using the effective interest rate method.
Derivatives All derivative instruments are recorded on the balance sheet at fair value.
Embedded Derivatives Derivatives may be embedded in other financial instruments (host instruments). Embedded derivatives are treated as separate derivatives when their economic characteristics and risks are not closely related to those of the host instrument, the terms of the embedded derivative are the same as those of a stand-alone derivative, and the combined contract is not classified as held for trading. These embedded derivatives are measured at fair value on the balance sheet with subsequent changes in fair value recognized in income. The Company selected January 1, 2003 as its transition date for embedded derivatives. The Company has not identified any embedded derivatives that are required to be accounted for separately from the host contract.
Hedges The Company utilizes derivative financial instruments and foreign currency debt in order to manage its foreign currency and interest rate exposures, and stock-based compensation expenses which fluctuate with share price movements. The Company uses derivative financial instruments only in connection with managing related risk positions and does not use them for trading or speculative purposes.
The Company determines whether or not to formally designate, for accounting purposes, eligible hedging relationships between hedging instruments and hedged items. This process includes linking derivatives to specific risks from assets or liabilities on the balance sheet or specific firm commitments or forecasted transactions. For hedges designated as such for accounting purposes, the Company formally assesses, both at inception and on an ongoing basis, whether the hedging item is highly effective in offsetting changes in fair value or cash flows associated with the identified hedged items. When derivative instruments have been designated as a hedge and are highly effective in offsetting the identified hedged risk, hedge accounting is applied to the derivative instruments. The ineffective portion of hedging gains and losses of highly effective hedges is reported in income. The accounting treatment for the types of hedges used by the Company is described below.
Cash Flow Hedges The Company uses foreign exchange forward contracts and collars to hedge the currency risk associated with certain foreign currency purchase commitments, payroll, and associated accounts payable and accounts receivable. The effective portion of hedging gains and losses associated with these cash flow

Finning International Inc. Annual 2008 Results
Notes to Consolidated Financial Statements
55
hedges is recorded, net of tax, in other comprehensive income and is released from accumulated other comprehensive income and recorded in income when the hedged item affects income.
When a hedging instrument expires or is sold, or when a hedge is discontinued or no longer meets the criteria for hedge accounting, any accumulated gain or loss recorded in other comprehensive income at that time remains in other comprehensive income until the originally hedged transaction affects income. When a forecasted transaction is no longer expected to occur, the accumulated gain or loss that was reported in other comprehensive income is immediately recorded in the income statement.
Gains and losses relating to forward foreign exchange contracts that are not designated as hedges for accounting purposes are recorded in selling, general, and administrative expenses.
From time to time, the Company uses derivative financial instruments to hedge interest rate risk associated with future proceeds of debt.
As at December 31, 2008, approximately $8.8 million of net losses (net of tax) included in accumulated other comprehensive income are expected to be reclassified to current earnings over the next twelve months when earnings are affected by the hedged transactions.
Fair Value Hedges Changes in the fair value of derivatives designated and qualifying as fair value hedging instruments are recorded in income along with changes in the fair value of the hedged item attributable to the hedged risk.
Generally, if a hedging relationship no longer meets the criteria for hedge accounting, the cumulative adjustment to the carrying amount of the hedged item is amortized to income based on a recalculated effective interest rate over the remaining expected life of the hedged item, unless the hedged item has been derecognized in which case the cumulative adjustment is recorded immediately in the income statement.
Net Investment Hedges The Company typically uses forward contracts, cross-currency interest rate swaps, and foreign currency debt to hedge foreign currency gains and losses on its long-term net investments in self-sustaining foreign operations. The effective portion of the gain or loss of such instruments associated with the hedged risk is recorded in other comprehensive income each period. These gains or losses will be recorded in income when there is a reduction in the Company’s net investment in the self-sustaining foreign operation.
The Company uses the forward rate method for net investment hedges where derivative financial instruments are used. The Company uses the spot method, as required, when the Company uses debt to hedge foreign currency net investments.
(t) Change in Accounting Policies Effective January 1, 2008, the Company adopted the following new accounting standards issued by the CICA: Section 3031, Inventories; Section 3862, Financial Instruments – Disclosures; and Section 3863, Financial Instruments – Presentation. The principal changes related to these standards are described below.
(i) Inventories The new standard provides more guidance on the measurement and disclosure requirements for inventories. Specifically the new pronouncement requires inventories to be measured at the lower of cost and net realizable value, and provides guidance on the determination of cost and its subsequent recognition as an expense, including any write-down to net realizable value.
The new standard has been applied retrospectively without restatement; accordingly comparative periods have not been restated. However, prior period financial statements retroactively reflect the separate presentation of external unbilled service work in progress, which was previously presented in inventory. Adjustments to the previous carrying amount of inventories have been recognized as an adjustment of the balance of retained earnings as at January 1, 2008.

Finning International Inc. Annual 2008 Results
Notes to Consolidated Financial Statements
56
The adoption of the new standard resulted in the following adjustments as of January 1, 2008 in accordance with the transition provisions:
1. Allocation of Fixed and Variable Overhead In accordance with the new standard, fixed and variable overheads have been applied to internal service work in progress. Upon adoption, the carrying value of internal service work in progress has been increased by $8.7 million, with an increase in future income tax liability of $2.4 million and an increase in retained earnings of $6.3 million.
2. Presentation of Service Work in Progress Service work in progress relates to unbilled work in progress for external customers and represents the costs incurred plus recognized profits, net of any recognized losses and progress billings. Revenue is recognized on service work in progress on a basis proportionate to the service work that has been performed based on the parts and labour service provided. Service work in progress was previously included in inventory. It is presented as a current asset and the 2007 figure has been reclassified for comparative purposes.
The effect on net income for the twelve months ended December 31, 2008 as a result of adopting the new standard is not material.
(ii) Financial Instrument Disclosures Section 3862 Financial Instruments – Disclosures and Section 3863 Financial Instruments – Presentation, together comprise a complete set of disclosure and presentation requirements that revise and enhance current disclosure requirements for financial instruments, as discussed further in Note 4 to the consolidated financial statements. Section 3862 requires disclosure of additional detail by financial asset and liability categories. Section 3863 establishes standards for presentation of financial instruments and non-financial derivatives. It deals with the classification of financial instruments, from the perspective of the issuer, between liabilities and equity, the classification of related interest, dividends, losses and gains, and the circumstances in which financial assets and financial liabilities are offset.
(u) Comparative Figures Certain comparative figures have been reclassified to conform to the 2008 presentation.
(v) Future Accounting Pronouncements
(i) Goodwill and Intangible Assets In February 2008, the CICA issued Section 3064, Goodwill and Intangible Assets, replacing Section 3062, Goodwill and Other Intangible Assets and Section 3450, Research and Development Costs. The new pronouncement establishes standards for the recognition, measurement, presentation, and disclosure of goodwill subsequent to its initial recognition and of intangible assets by profit-oriented enterprises. Standards concerning goodwill are unchanged from the standards included in the previous Section 3062. This Section is effective in the first quarter of 2009, and the new standard does not have a material impact on the Company’s consolidated financial statements.

Finning International Inc. Annual 2008 Results
Notes to Consolidated Financial Statements
57
(ii) Business Combinations In January 2009, the CICA issued Section 1582, Business Combinations, Section 1601, Consolidations, and Section 1602, Non-controlling Interests. These new standards are harmonized with International Financial Reporting Standards (IFRS). Section 1582 specifies a number of changes, including: an expanded definition of a business, a requirement to measure all business acquisitions at fair value, a requirement to measure non-controlling interests at fair value, and a requirement to recognize acquisition-related costs as expenses. Section 1601 establishes the standards for preparing consolidated financial statements. Section 1602 specifies that non-controlling interests be treated as a separate component of equity, not as a liability or other item outside of equity. The new standards will become effective in 2011. Early adoption is permitted.
(iii) Convergence with International Financial Reporting Standards In February 2008, Canada’s Accounting Standards Board confirmed that Canadian GAAP, as used by public companies, will be converged with IFRS effective January 1, 2011. The transition from Canadian GAAP to IFRS will be applicable for the Company for the first quarter of 2011 when the Company will prepare both the current and comparative financial information using IFRS.
2. OTHER EXPENSES (INCOME)
Other expenses (income) include the following items:
For years ended December 31 ($ thousands) 2008 2007 Gain on sale of properties in Hewden (a) $ (19,210) $ — Restructuring (b) 20,496 1,607 Project costs (c) 16,197 3,510 Gain on sale of other surplus properties (682) (4,144) Gain on disposition of distribution arrangement in Canada (d) — (2,408) $ 16,801 $ (1,435)
The tax recovery on other expenses for the year ended December 31, 2008 was $7.3 million (2007: tax expense of $0.1 million on other income).
(a) In 2008, the Company’s UK subsidiary, Hewden, sold certain properties for cash proceeds of approximately $37.8 million, resulting in a pre-tax gain of $19.2 million.
(b) In 2008, the Company’s UK operations incurred restructuring costs of approximately $8 million in connection with the integration of business support services. The UK operations also incurred costs of approximately $3 million in 2008 related to the restructuring of Hewden’s nationwide depot network. In addition, Finning incurred restructuring costs globally in 2008 in response to the current market conditions.
(c) Project costs in 2008 relate to the implementation of a new information technology system for the Company’s global operations.
(d) In 2007, Finning (Canada) terminated its distribution arrangement with Shell Canada Products for net cash proceeds of approximately $7 million, resulting in a pre-tax gain of $2.4 million.

Finning International Inc. Annual 2008 Results
Notes to Consolidated Financial Statements
58
3. SHORT-TERM AND LONG-TERM DEBT
December 31 ($ thousands) 2008 2007 Short-term debt $ 193,635 $ 370,942 Long-term debt: Medium Term Notes 7.40%, $200 million, due June 19, 2008 — 200,812 4.64%, $150 million, due December 14, 2011 149,718 149,622 5.16%, $250 million, due September 3, 2013 249,057 — 6.02%, $350 million, due June 1, 2018 348,241 — 5.625%, £125 million Eurobond, due May 30, 2013 222,122 242,881 Other term loans (a) 444,232 212,730 1,413,370 806,045 Less current portion of long-term debt (2,643) (215,663) Total long-term debt $ 1,410,727 $ 590,382
(a) Other term loans include U.S. $291.0 million and £10.0 million (2007: U.S. $130.6 million and £30 million) of unsecured borrowings under committed bank facilities that are classified as long-term debt, and other unsecured term loans primarily from supplier merchandising programs. Other loans also include £2.4 million of rental equipment financing secured by the related equipment, with varying rates of interest from 5.5% – 10.3% and maturing on various dates up to 2011.
Short-Term Debt Short-term debt primarily consists of commercial paper borrowings and other short-term bank indebtedness.
The Company maintains a maximum authorized commercial paper program of $600 million which is utilized as its principal source of short-term funding. This commercial paper program is backstopped by credit available under an $800 million long-term committed credit facility. In addition, the Company also maintains, as required, certain other secured and unsecured bank credit facilities to support its subsidiary operations. As at December 31, 2008, the Company had approximately $1,300 million (2007: $1,380 million) of unsecured credit facilities, and including all bank and commercial paper borrowings drawn against these facilities, approximately $660 million (2007: $800 million) of capacity remained available.
Included in short-term debt is foreign currency denominated debt of U.S. $29.0 million (2007: U.S. $14.3 million) and £32.7 million (2007: £27.2 million).
The average interest rate applicable to the consolidated short-term debt for 2008 was 4.5% (2007: 5.3%).
Long-Term Debt The Company's Canadian dollar denominated medium term notes are unsecured, and interest is payable semi-annually with principal due on maturity. The Company’s £125.0 million 5.625% Eurobond is unsecured, and interest is payable annually with principal due on maturity.
In May 2008, the Company issued two unsecured Medium Term Notes (MTN). The 5-year, $250 million MTN has a coupon interest rate of 5.16% per annum, payable semi-annually commencing September 3, 2008. The MTN was priced at $99.994 of its principal amount to yield 5.163% per annum. The 10-year, $350 million MTN has a coupon interest rate of 6.02% per annum, payable semi-annually commencing December 1, 2008. The MTN was priced at $99.936 of its principal amount to yield 6.028% per annum.
Proceeds from these issuances were used for debt repayment, including the repayment of the Company's $200 million 7.40% MTN which matured in June 2008 as well as outstanding commercial paper borrowings.
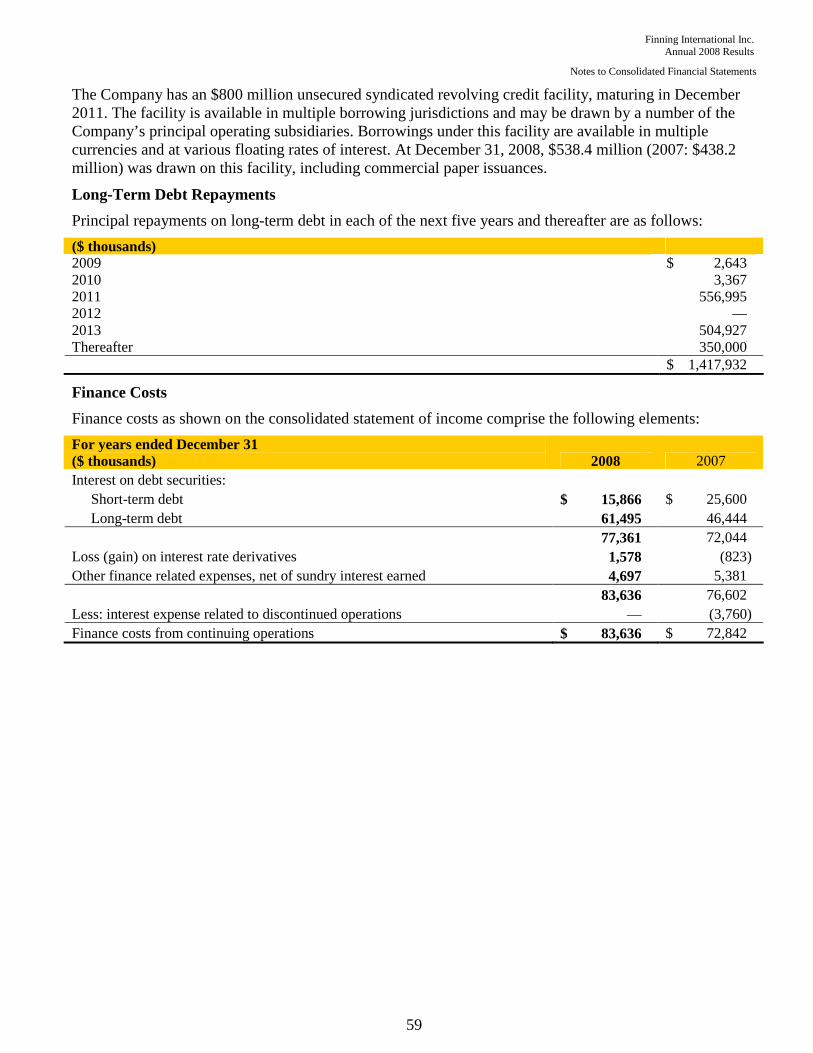
Finning International Inc. Annual 2008 Results
Notes to Consolidated Financial Statements
59
The Company has an $800 million unsecured syndicated revolving credit facility, maturing in December 2011. The facility is available in multiple borrowing jurisdictions and may be drawn by a number of the Company’s principal operating subsidiaries. Borrowings under this facility are available in multiple currencies and at various floating rates of interest. At December 31, 2008, $538.4 million (2007: $438.2 million) was drawn on this facility, including commercial paper issuances.
Long-Term Debt Repayments
Principal repayments on long-term debt in each of the next five years and thereafter are as follows:
($ thousands) 2009 $ 2,643 2010 3,367 2011 556,995 2012 — 2013 504,927 Thereafter 350,000 $ 1,417,932
Finance Costs
Finance costs as shown on the consolidated statement of income comprise the following elements:
For years ended December 31 ($ thousands) 2008 2007 Interest on debt securities:
Short-term debt $ 15,866 $ 25,600 Long-term debt 61,495 46,444
77,361 72,044 Loss (gain) on interest rate derivatives 1,578 (823) Other finance related expenses, net of sundry interest earned 4,697 5,381 83,636 76,602 Less: interest expense related to discontinued operations — (3,760) Finance costs from continuing operations $ 83,636 $ 72,842
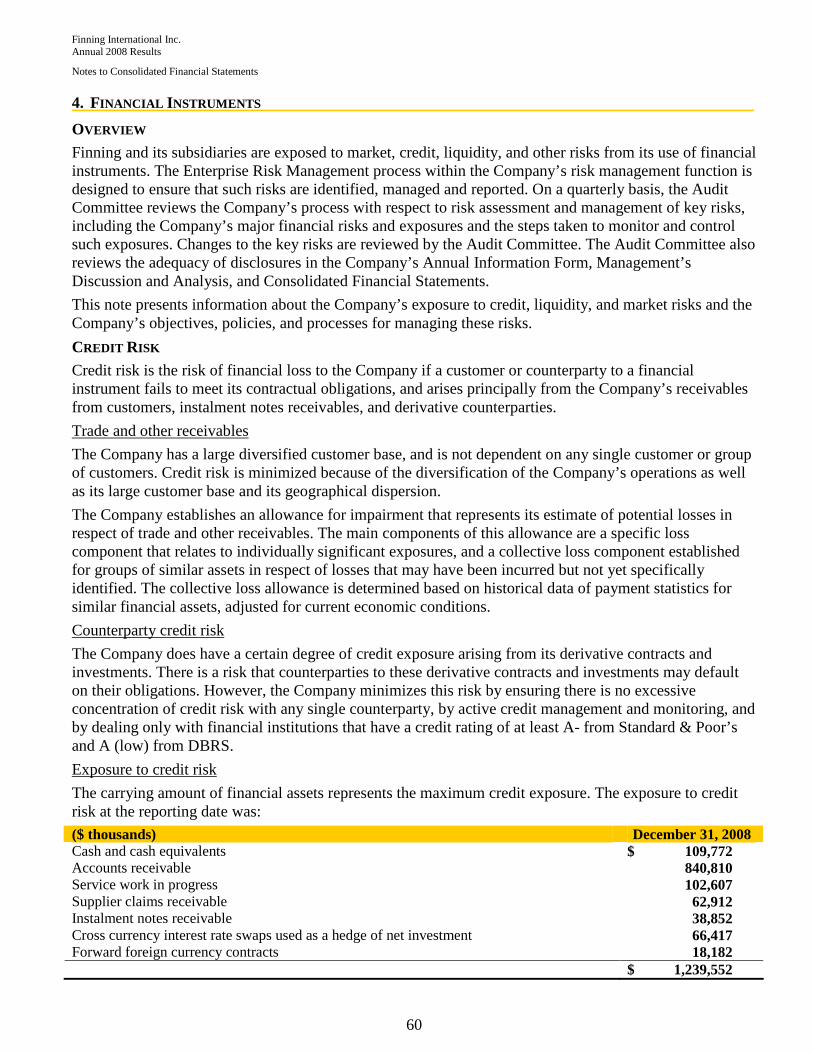
Finning International Inc. Annual 2008 Results
Notes to Consolidated Financial Statements
60
4. FINANCIAL INSTRUMENTS
OVERVIEW
Finning and its subsidiaries are exposed to market, credit, liquidity, and other risks from its use of financial instruments. The Enterprise Risk Management process within the Company’s risk management function is designed to ensure that such risks are identified, managed and reported. On a quarterly basis, the Audit Committee reviews the Company’s process with respect to risk assessment and management of key risks, including the Company’s major financial risks and exposures and the steps taken to monitor and control such exposures. Changes to the key risks are reviewed by the Audit Committee. The Audit Committee also reviews the adequacy of disclosures in the Company’s Annual Information Form, Management’s Discussion and Analysis, and Consolidated Financial Statements.
This note presents information about the Company’s exposure to credit, liquidity, and market risks and the Company’s objectives, policies, and processes for managing these risks.
CREDIT RISK
Credit risk is the risk of financial loss to the Company if a customer or counterparty to a financial instrument fails to meet its contractual obligations, and arises principally from the Company’s receivables from customers, instalment notes receivables, and derivative counterparties.
Trade and other receivables
The Company has a large diversified customer base, and is not dependent on any single customer or group of customers. Credit risk is minimized because of the diversification of the Company’s operations as well as its large customer base and its geographical dispersion.
The Company establishes an allowance for impairment that represents its estimate of potential losses in respect of trade and other receivables. The main components of this allowance are a specific loss component that relates to individually significant exposures, and a collective loss component established for groups of similar assets in respect of losses that may have been incurred but not yet specifically identified. The collective loss allowance is determined based on historical data of payment statistics for similar financial assets, adjusted for current economic conditions.
Counterparty credit risk
The Company does have a certain degree of credit exposure arising from its derivative contracts and investments. There is a risk that counterparties to these derivative contracts and investments may default on their obligations. However, the Company minimizes this risk by ensuring there is no excessive concentration of credit risk with any single counterparty, by active credit management and monitoring, and by dealing only with financial institutions that have a credit rating of at least A- from Standard & Poor’s and A (low) from DBRS.
Exposure to credit risk
The carrying amount of financial assets represents the maximum credit exposure. The exposure to credit risk at the reporting date was:
($ thousands) December 31, 2008 Cash and cash equivalents $ 109,772 Accounts receivable 840,810 Service work in progress 102,607 Supplier claims receivable 62,912 Instalment notes receivable 38,852 Cross currency interest rate swaps used as a hedge of net investment 66,417 Forward foreign currency contracts 18,182 $ 1,239,552

Finning International Inc. Annual 2008 Results
Notes to Consolidated Financial Statements
61
The maximum exposure to credit risk for trade receivables at the reporting date by geographic location of customer was:
($ thousands) December 31, 2008 Canada $ 397,738 U.K. 176,062 South America 212,495 Europe 3,751 Other 4,462 $ 794,508
Impairment losses
The aging of trade receivables at the reporting date was:
December 31, 2008
($ thousands) Gross Allowance Not past due $ 527,331 $ 176 Past due 1 – 30 days 172,473 284 Past due 31 – 90 days 65,498 1,618 Past due 91 – 120 days 12,323 2,127 Past due greater than 120 days 44,037 22,949 Total $ 821,662 $ 27,154
The movement in the allowance for doubtful accounts in respect of trade receivables during the period was as follows:
For years ended December 31 ($ thousands) 2008 2007 Balance, beginning of year $ 28,229 $ 28,248 Additional allowance 12,331 13,682 Receivables written off (13,408) (10,489) Foreign exchange translation adjustment 2 (3,212) Balance, end of year $ 27,154 $ 28,229
The allowance amounts in respect of trade receivables are used to record impairment losses unless the Company is satisfied that no recovery of the amount owing is possible; at that point the amount is considered not recoverable and is written off against the financial asset directly.
L IQUIDITY RISK
Liquidity risk is the risk that the Company will not be able to meet its financial obligations as they fall due. The Company’s approach to managing liquidity is to ensure, as far as possible, that it will always have sufficient cash flows to fund its operations and to meet its liabilities when due, under both normal and stressed conditions. The Company also maintains certain credit facilities which can be drawn upon as needed.
The following are the contractual maturities of financial liabilities and derivatives. The amounts presented represent the future undiscounted principal and interest cash flows and therefore do not equate to the carrying amount on the consolidated balance sheet.

Finning International Inc. Annual 2008 Results
Notes to Consolidated Financial Statements
62
4. FINANCIAL INSTRUMENTS (CONTINUED )
Carrying amount Contractual cash flows ($ thousands) December 31, 2008 2009 2010-2011 2012-2013 Thereafter
Non-derivative financial liabilities Short-term debt $ 193,635 $ (193,635) $ — $ — $ —
Unsecured Medium Term Notes 747,016 (40,930) (231,860) (317,940) (444,786)
Eurobond 222,122 (12,583) (25,166) (248,866) —
Unsecured bank facilities 436,226 (9,451) (423,901) (32,539) —
Other term loans 8,006 (3,000) (5,726) — —
Accounts payable and accruals 1,316,818 (1,316,818) — — — Derivatives Cross currency interest rate swaps
Pay GBP (fixed) — (11,946) (23,892) (23,892) (364,005)
Receive CAD (fixed) 66,417 14,749 29,497 29,497 446,181
Interest rate swaps
Pay USD (fixed) (1,045) (146) (416) — —
Receive USD (floating) — 13 37 — — Forward foreign currency contracts and collars
Sell CAD — (137,500) (2,620) — —
Buy USD 18,182 155,221 3,146 — — Sell USD (3,389) (309,824) — — —
Buy CAD — 306,579 — — — Sell CLP (487) (56,011) — — —
Buy USD — 55,107 — — — Sell USD (9,592) (72,115) — — —
Buy CLP — 64,884 — — —
Share forward
Sell (26,876) — — (54,142) —
Buy $ — $ — $ — $ 35,164 $ —
Canadian dollar (CAD) British pound (GBP) United States dollar (USD) Chilean peso (CLP)
MARKET RISK
Market risk is the risk that changes in market prices, such as foreign exchange rates and interest rates will affect the Company’s income or the value of its holdings of financial instruments. The objective of market risk management is to manage and control market risk exposures within acceptable parameters.
The Company buys and sells derivatives in the ordinary course of business, and also incurs financial liabilities, in order to manage market risks. All such transactions are carried out within the guidelines set by the Company’s Global Hedging Policy approved by the Audit Committee.
Currency risk
The Company is geographically diversified, with significant investments in several different countries. The Company transacts business in multiple currencies, the most significant of which are the U.S. dollar, the Canadian dollar, the U.K. pound sterling, and the Chilean peso.

Finning International Inc. Annual 2008 Results
Notes to Consolidated Financial Statements
63
As a result, the Company has foreign currency exposure with respect to items denominated in foreign currencies. The three main types of foreign exchange risk of the Company can be categorized as follows:
Investment in Foreign Operations
All of the Company’s foreign operations are considered self-sustaining. Accordingly, assets and liabilities are translated into Canadian dollars using the exchange rates in effect at the balance sheet dates. Any unrealized translation gains and losses are recorded as an item of other comprehensive income and accumulated other comprehensive income.
It is the Company’s objective to manage its exposure to currency fluctuations arising from its foreign investments. The Company has hedged a portion of its foreign investments through foreign currency denominated loans and other derivative contracts. Any exchange gains or losses arising from the translation of the hedging instruments are recorded as an item of other comprehensive income and accumulated other comprehensive income. Cumulative currency translation adjustments, net of gains or losses of the associated hedging instruments, are recognized in net income when there is a reduction in the Company’s net investment in the self-sustaining foreign operations.
Transaction Exposure
Many of the Company’s operations purchase, sell, rent, and lease products as well as incur costs throughout the world in different currencies. This mismatch of currencies creates transactional exposure at the operational level, which may affect the Company’s profitability as exchange rates fluctuate. It may also impact the Company’s competitive position as relative currency movements affect the business practices and/or pricing strategies of the Company’s competitors.
It is the Company’s objective to manage the impact of exchange rate movements and volatility in results. Each operation manages the majority of its transactional exposure through sales pricing policies and practices. The Company also enters into forward exchange contracts to manage residual mismatches in foreign currency cash flows. As a result, the foreign exchange impact on earnings with respect to transactional activity is not significant.
Translation Exposure
The most significant foreign exchange impact on the Company’s net income is the translation of foreign currency based earnings into Canadian dollars each reporting period. All of the Company’s foreign subsidiaries report their operating results in currencies other than the Canadian dollar. Therefore, exchange rate movements in the U.S. dollar and U.K. pound sterling relative to the Canadian dollar will impact the consolidated results of the South American and U.K. operations in Canadian dollar terms. In addition, the Company’s Canadian results are impacted by the translation of its U.S. dollar based earnings. Some of the Company’s earnings translation exposure is offset by interest on foreign currency denominated loans and derivative contracts associated with the net investment hedges.
Exposure to currency risk
The Company is exposed to foreign currency risk. The currencies of the Company’s financial instruments, based on notional amounts, were as follows: December 31, 2008 (thousands) CAD USD GBP CLP Cash and cash equivalents 22,076 58,353 848 4,702,208 Accounts receivable 377,032 79,025 99,298 72,432,169 Short-term and long-term debt (912,311) (319,990) (169,220) — Accounts payable and accruals (310,433) (522,651) (130,249) (50,658,822) Gross balance sheet exposure (823,636) (705,263) (199,323) 26,475,555 Cross currency interest rate swaps 328,190 — (150,000) — Foreign forward exchange contracts and collars 166,459 (137,567) — 3,388,336

Finning International Inc. Annual 2008 Results
Notes to Consolidated Financial Statements
64
4. FINANCIAL INSTRUMENTS (CONTINUED )
Sensitivity analysis
A 5 percent strengthening of the Canadian dollar against the following currencies for a full year relative to the December 31, 2008 month end rates would increase / (decrease) profit or loss by the amounts shown below. A 5% strengthening of the Canadian dollar against the following currencies from the December 31, 2008 month end rates would increase / (decrease) equity by the amounts shown below. This analysis assumes that all other variables, in particular volumes, relative pricing, interest rates, and hedging activities are unchanged.
December 31, 2008
($ thousands) Equity Profit or Loss USD $ (11,800) $ (22,500) GBP (17,200) (2,200) CLP $ — $ 700
A 5 percent weakening of the Canadian dollar against the above currencies relative to the December 31, 2008 month end rates would have an equal but opposite effect on the above currencies in the amounts shown above, on the basis that all other variables are unchanged.
Interest rate risk
The Company’s interest bearing financial assets comprise instalment note receivables, which bear interest at a fixed rate. The Company’s debt portfolio comprises both fixed and floating rate debt instruments, with terms to maturity ranging up to ten years. In relation to its debt financing, the Company is exposed to potential changes in interest rates, which may cause the Company’s borrowing costs to fluctuate. Floating rate debt exposes the Company to fluctuations in short-term interest rates, while fixed rate debt exposes the Company to future interest rate movements upon refinancing the debt at maturity. Fluctuations in current or future interest rates could result in a material adverse impact on the Company’s financial results, by causing related finance expense to rise. Further, the fair value of the Company’s fixed rate debt obligations and the mark to market on the cross currency interest rate swaps may be negatively affected by changes in interest rates, thereby exposing the Company to potential losses on early settlements or refinancing.
The Company minimizes its interest rate risk by balancing its portfolio of fixed and floating rate debt, as well as managing the term to maturity of its debt portfolio. At certain times the Company utilizes derivative instruments such as interest rate swaps to adjust the balance of fixed and floating rate debt to appropriately determined levels.
Profile
At the reporting date the interest rate profile of the Company’s interest-bearing financial instruments was as follows:
December 31, 2008 ($ thousands) Fixed rate instruments Financial assets $ 42,719 Financial liabilities (986,113) $ (943,394) Variable rate instruments Financial liabilities $ (637,867)
Finning International Inc. Annual 2008 Results
Notes to Consolidated Financial Statements
65
Fair value sensitivity analysis for fixed rate instruments
The Company does not account for any fixed rate financial assets and liabilities at fair value through the income statement, and the Company does not currently have any derivatives (interest rate swaps) designated as hedging instruments under a fair value hedge accounting model. Therefore a change in interest rates at the reporting date would not affect net income.
A change of 100 basis points in interest rates for a full year relative to the interest rates at the reporting date would have increased or decreased equity by approximately $4.8 million.
Cash flow sensitivity analysis for variable rate instruments
A change of 100 basis points in short-term interest rates for a full year relative to the interest rates at the reporting date would have increased or decreased net income by approximately $4.5 million. This analysis assumes that all other variables, in particular foreign currency rates, remain constant.
Other risk
The Company’s revenues can be indirectly affected by fluctuations in commodity prices; in particular, changes in views on long-term commodity prices. In Canada, commodity price movements in the forestry, metals, coal, and petroleum sectors can have an impact on customers’ demands for equipment and customer service. In Chile and Argentina, significant fluctuations in the price of copper and gold can have similar effects, as customers base their capital expenditure decisions on the long-term outlook for metals. In the U.K., changes to prices for thermal coal may impact equipment demand in that sector. Significant fluctuations in commodity prices could result in a material adverse impact on the Company’s financial results.
STOCK -BASED COMPENSATION COSTS RISK
Stock-based compensation is an integral part of the Company’s compensation program, and can be in the form of the Company’s common shares or cash payments that reflect the value of the shares. Since Canadian GAAP require certain stock-based compensation which is accounted for as liability-based awards to be recorded on a mark-to-market basis, compensation cost can vary significantly as the price of the Company’s common shares changes. The Company has entered into a derivative contract to manage this potential exposure, called a Variable Rate Share Forward (VRSF).
The VRSF is cash-settled at the end of a five-year term, or at any time prior to that at the option of the Company, based on the difference between the Company’s common share price at the time of settlement and the execution price plus accrued interest. The average execution price per share was $28.71 on 2.0 million common shares, which approximated the number of outstanding deferred share units and vested share appreciation units as at December 31, 2007.
At December 31, 2008, the VRSF relates to 1.7 million common shares at a price of $28.71 plus interest maturing in 2012. A 5% strengthening or weakening in the Company’s share price as at December 31, 2008, all other variables remaining constant, would have increased or decreased net income by approximately $0.9 million as a result of revaluing certain of the Company’s stock-based compensation. As the Company’s share price changes, the mark-to-market impact related to the stock-based compensation liability is effectively offset by the mark-to-market impact related to the VRSF.

Finning International Inc. Annual 2008 Results
Notes to Consolidated Financial Statements
66
4. FINANCIAL INSTRUMENTS (CONTINUED )
Fair Values
The following fair value information is provided solely to comply with financial instrument disclosure requirements. The Company cautions readers in the interpretation of the impact of these estimated fair values. The fair value of financial instruments is determined by reference to quoted market prices for actual or similar instruments, where available, or by estimates derived using present value or other valuation techniques. The fair value of accounts receivable, notes receivable, short-term debt, and accounts payable and accruals approximates their recorded values due to the short-term maturities of these instruments.
The fair values of the derivatives below have been estimated using market information as at December 31, 2008 and 2007, and are recorded at fair value on the balance sheet as indicated below. These fair values approximate the amount the Company would receive or pay to terminate the contracts:
($ or £ thousands) 2008 Balance Sheet Notional Term to Fair Value
Foreign Exchange Classification Value Maturity Receive (Pay)
Cross Currency Interest Rate Swaps Pay GBP fixed / receive CAD fixed Other assets – long-term GBP 150,000 perpetual $ 66,417 Forwards buy USD / sell CAD Other assets – current USD 129,321 1-13 months $ 18,182 Swaps sell USD / buy CAD Accounts payable and accruals USD 253,000 1-6 months $ (3,389) Forwards buy USD / sell CLP Accounts payable and accruals USD 45,000 1-2 months $ (487) Forward sell USD / buy CLP Accounts payable and accruals USD 34,889 1-12 months $ (6,240) Collars sell USD / buy CLP Accounts payable and accruals USD 24,000 1-12 months $ (3,352)
Interest Rates Interest Rate Swaps Accounts payable and accruals USD 11,250 1-3 years $ (1,045)
Long-Term Incentive Plans Variable Rate Share Forward Long-term obligations $ 48,809 November 2012 $ (26,876) 2007 Notional Term to Fair Value
Foreign Exchange Value Maturity Receive (Pay) Cross Currency Interest Rate Swaps Pay GBP fixed / receive CAD fixed Other assets – long term GBP 150,000 perpetual $ 41,637 Forwards buy USD / sell CAD Accounts payable and accruals USD 166,921 1-12 months $ (3,283) Forwards buy USD / sell CLP Accounts payable and accruals USD 48,000 1-2 months $ (48) Forward buy USD / sell CAD Other assets – current USD 3,875 3 months $ 71
Interest Rates Bond Forward Accounts payable and accruals $ 200,000 September 2008 $ (5,028) Interest Rate Swaps Accounts payable and accruals USD 11,250 1-4 years $ (325) Long-Term Incentive Plans Variable Rate Share Forward Long-term obligations $ 57,422 November 2012 $ (193)
Long-Term Debt
The fair value of the Company’s long-term debt is estimated as follows:
December 31 2008 2007 ($ thousands) Book Value Fair Value Book Value Fair Value Long-term debt $ 1,413,370 $ 1,336,351 $ 806,045 $ 788,459

Finning International Inc. Annual 2008 Results
Notes to Consolidated Financial Statements
67
5. MANAGEMENT OF CAPITAL
The Company’s objective when managing capital is to maintain a flexible capital structure which optimizes the cost of capital at acceptable risk. In the management of capital, the Company includes shareholders’ equity, cash and cash equivalents, short-term and long-term debt in the definition of capital.
The Company manages its capital structure and makes adjustments to it in light of changes in economic conditions and the risk characteristics of its underlying assets. In order to maintain or adjust the capital structure, the Company may purchase shares for cancellation pursuant to normal course issuer bids, issue new shares, issue new debt, issue new debt to replace existing debt with different characteristics, or adjust the amount of dividends paid to shareholders.
The Company monitors the following ratios: net debt to total capitalization and dividend payout ratio. Net debt to total capitalization and dividend payout ratio are non-GAAP measures which do not have a standardized meaning prescribed by GAAP and therefore may not be comparable to similar measures presented by other issuers.
Net debt to total capitalization is calculated as short-term and long-term debt, net of cash and cash equivalents (net debt) divided by total capitalization. Total capitalization is defined as the sum of net debt and all components of equity (share capital, contributed surplus, accumulated other comprehensive loss, and retained earnings).
Dividend payout ratio is calculated as the annual dividend declared per share divided by basic earnings per share from continuing operations for the past twelve month period.
The Company’s strategy is to maintain the targets set out in the following table. The Company believes that these target ratios are in the optimal range and provide access to capital at a reasonable cost.
As at and for years ended December 31 ($ thousands, except as noted)
2008 2007
Components of Debt and Coverage Ratios Cash and cash equivalents $ (109,772) $ (61,860) Short-term debt 193,635 370,942 Current portion of long-term debt 2,643 215,663 Long-term debt 1,410,727 590,382 Net debt $ 1,497,233 $ 1,115,127 Shareholders’ equity $ 1,567,104 $ 1,617,797
Company Targets 2008 2007 Net debt to total capitalization 40 – 50% 48.9% 40.8% Dividend payout ratio 25 – 30% 77.2% 22.9%
The net debt to total capitalization ratio is within the Company’s target. This ratio is higher than the prior year due to the higher debt in 2008, primarily as a result of the acquisition of Collicutt Energy Services Inc. and the repurchase of the Company’s common shares as part of a normal course issuer bid. The non-cash goodwill impairment charge negatively impacted the net debt to total capitalization ratio by 2.3% as a result of a $151.4 million reduction to equity.
The dividend payout ratio was impacted by the non-cash goodwill impairment charge noted above. Excluding the impact of this charge, the dividend payout ratio would have been 29.9%, an increase over the 2007 level and within the Company’s target.
Covenant
The Company is subject to a maximum net debt to total capitalization level pursuant to a covenant within its syndicated bank credit facility. As at December 31, 2008 and 2007, the Company is in compliance with this covenant.

Finning International Inc. Annual 2008 Results
Notes to Consolidated Financial Statements
68
6. INCOME TAXES
Provision for Income Taxes
As the Company operates in several tax jurisdictions, its income is subject to various rates of taxation. The components of the Company’s income tax provision are as follows:
For years ended December 31 ($ thousands) 2008 2007 Provision for income taxes Current Canada $ 38,663 $ 70,954 International 8,629 19,352 47,292 90,306 Future Canada (4,037) 230 International 13,859 12,362 9,822 12,592 $ 57,114 $ 102,898
The provision for income taxes differs from the amount that would have resulted from applying the Canadian statutory income tax rates to income from continuing operations before income taxes as follows:
For years ended December 31 ($ thousands) 2008 2007 Combined Canadian federal and provincial
income taxes at the statutory tax rate $ 46,010 30.05% $ 125,971 32.89% Increase / (decrease) resulting from:
Lower statutory rates on the earnings of foreign subsidiaries (17,349) (11.33)% (24,183) (6.31)%
Goodwill impairment 43,126 28.17% — — Change in statutory tax rates in UK and Canada (799) (0.52)% (4,536) (1.18)% Non-deductible stock-based compensation and
other expenses 5,393 3.52% 6,012 1.57% Income not subject to tax (2,953) (1.92)% (410) (0.11)% Non-taxable capital gain (11,939) (7.81)% (277) (0.07)% Other (4,375) (2.86)% 321 0.08%
Provision for income taxes $ 57,114 37.30% $ 102,898 26.87%
Future Income Tax Asset and Liability
Included in other assets on the consolidated balance sheets are a current future income tax asset and long-term future income tax asset of $66.9 million (2007: $51.8 million) and $1.7 million (2007: $2.6 million), respectively.

Finning International Inc. Annual 2008 Results
Notes to Consolidated Financial Statements
69
Temporary differences and tax loss carry-forwards that give rise to future income tax assets and liabilities are as follows:
December 31 ($ thousands) 2008 2007 Future income tax assets: Accounting provisions not currently deductible for tax purposes $ 63,696 $ 51,096 Loss carry-forwards 6,435 5,416 Other stock-based compensation 4,203 10,938 Goodwill of foreign subsidiaries 1,172 849 Other — 1,800 75,506 70,099 Future income tax liabilities:
Derivative financial instruments (6,663) (12,968) Capital, rental, and leased assets (81,767) (63,392) Employee benefits (46,267) (38,214) Other (1,364) —
(136,061) (114,574) Net future income tax liability $ (60,555) $ (44,475)
The Company has recognized the benefit of the following tax loss carry-forwards available to reduce future taxable income and capital gains expiring through 2028 for Canada and available indefinitely for International:
December 31 ($ thousands) 2008 2007 Canada $ 19,809 $ 14,464 International 5,571 5,821 $ 25,380 $ 20,285
7. SHARE CAPITAL
The Company is authorized to issue an unlimited number of preferred shares without par value, of which 4.4 million are designated as cumulative redeemable preferred shares. The Company had no preferred shares outstanding for the years ended December 31, 2008 and 2007.
The Company is authorized to issue an unlimited number of common shares.
The Company repurchased and cancelled 5,901,842 common shares during 2008 as part of a normal course issuer bid. These shares were repurchased at an average price of $24.99, which has been allocated to reduce share capital by $19.1 million and retained earnings by $128.4 million. During 2007, the Company repurchased and cancelled 3,691,400 common shares at an average price of $27.82, which were allocated to reduce share capital by $11.9 million and retained earnings by $90.8 million.
On May 9, 2007, the Company’s shareholders approved a split of the Company’s outstanding common shares on a two-for-one basis. Each shareholder of record at the close of business on May 30, 2007, received one additional share for every outstanding share held on the record date. All stock-based compensation plans, share, and per-share data have been adjusted to reflect the stock split.
A shareholders' rights plan is in place which is intended to provide all holders of common shares with the opportunity to receive full and fair value for all of their shares in the event a third party attempts to acquire a significant interest in the Company. The Company's dealership agreements with subsidiaries of Caterpillar Inc. are fundamental to its business and any change in control must be approved by Caterpillar Inc.

Finning International Inc. Annual 2008 Results
Notes to Consolidated Financial Statements
70
7. SHARE CAPITAL (CONTINUED )
The plan provides that one share purchase right has been issued for each common share and will trade with the common shares until such time as any person or group, other than a “permitted bidder”, bids to acquire or acquires 20% or more of the Company's common shares, at which time the plan rights become exercisable. The rights may also be triggered by a third party proposal for a merger, amalgamation or a similar transaction. In May 2008, the rights plan was extended for three years such that it will automatically terminate at the end of the Company’s Annual Meeting of shareholders in 2011 unless further extended by the shareholders prior to that time.
The plan will not be triggered if a bid meets certain criteria (a permitted bidder). These criteria include that:
• the offer is made for all outstanding voting shares of the Company;
• more than 50% of the voting shares have been tendered by independent shareholders pursuant to the Takeover Bid (voting shares tendered may be withdrawn until taken up and paid for); and
• the Takeover Bid expires not less than 60 days after the date of the bid circular.
8. STOCK -BASED COMPENSATION PLANS
The Company has a number of stock-based compensation plans, which are described below.
Stock Options
The Company has several stock option plans for certain employees and directors with vesting occurring over a three-year period. The exercise price of each option is based on the closing price of the common shares of the Company on the date of the grant. Options granted after January 1, 2004 are exercisable over a seven-year period. Options granted prior to January 1, 2004 are exercisable over a ten-year period. Under the 2005 Stock Option Plan, the Company may issue up to 7.5 million common shares pursuant to the exercise of stock options. At December 31, 2008, 2.1 million common shares remain eligible to be issued in connection with future grants under this Stock Option Plan.
Details of the stock option plans are as follows:
2008 2007
For years ended December 31 Options
Weighted Average
Exercise Price Options
Weighted Average
Exercise Price Options outstanding, beginning of year 4,656,402 $ 20.99 3,903,526 $ 14.44 Granted 1,853,100 $ 29.83 1,721,000 $ 31.59 Exercised (209,832) $ 10.47 (746,188) $ 11.50 Cancelled (262,400) $ 26.85 (221,936) $ 19.86 Options outstanding, end of year 6,037,270 $ 23.72 4,656,402 $ 20.99 Exercisable at year end 2,726,492 $ 17.54 1,745,280 $ 11.92
In the second quarter of 2008, the Company granted 1,853,100 common share options to senior executives and management of the Company (2007: 1,721,000 common share options). In 2008 and 2007, long term incentives for executives and senior management were made primarily in the form of stock options. It is the Company’s practice to grant and price stock options only when it is felt that all material information has been disclosed to the market.
The Company determines the cost of all stock options granted since January 1, 2003 using the fair value-based method of accounting for stock options. This method of accounting uses an option-pricing model to determine the fair value of stock options granted which is amortized over the vesting period.

Finning International Inc. Annual 2008 Results
Notes to Consolidated Financial Statements
71
The fair value of the options granted has been estimated on the date of grant using the Black-Scholes option-pricing model with the following weighted-average assumptions:
2008 Grant 2007 Grant Dividend yield 1.27% 1.21% Expected volatility 25.44% 21.57% Risk-free interest rate 4.250% 4.09% Expected life 5.5 years 5.5 years
At the grant date, the weighted average fair value of each option granted during the year was $8.35 (2007: $7.89). Total stock option expense recognized in 2008 was $10.4 million (2007: $9.3 million).
The following table summarizes information about stock options outstanding at December 31, 2008:
Options Outstanding Options Exercisable
Range of exercise prices
Number outstanding
Weighted Average
Remaining Life
Weighted Average
Exercise Price Number
Outstanding
Weighted Average
Exercise Price
$4.52 - $8.50 777,502 1.5 years $ 6.23 777,502 $ 6.23
$14.69 - $16.27 433,002 3.0 years $ 15.79 433,002 $ 15.79
$19.75 - $19.82 1,509,066 4.3 years $ 19.75 990,996 $ 19.75
$25.85 - $31.67 3,317,700 5.9 years $ 30.66 524,992 $ 31.59
6,037,270 4.7 years $ 23.72 2,726,492 $ 17.54
Other Stock-Based Compensation Plans The Company has other stock-based compensation plans in the form of deferred share units and stock appreciation rights plans that use notional common share units. These notional units, upon vesting, are valued based on the Company’s common share price on the Toronto Stock Exchange and are marked to market at the end of each fiscal quarter.
In December 2007, the Company entered into a Variable Rate Share Forward (VRSF) with a financial institution to hedge a portion of its outstanding deferred share units and vested share appreciation units, reducing the impact of movements in the Company’s share price on these stock-based compensation plans – see Note 4.
Details of the plans are as follows:
Directors Directors’ Deferred Share Unit Plan A (DDSU)
The Company offers a Deferred Share Unit Plan (DDSU) for members of the Board of Directors. Under the DDSU Plan, non-employee Directors of the Company may elect to allocate all or a portion of their annual compensation as deferred share units. These units are fully vested upon issuance. These units accumulate dividend equivalents in the form of additional units based on the dividends paid on the Company’s common shares. Units are redeemable for cash or shares only following termination of service on the Board of Directors and must be redeemed by December 31st of the year following the year in which the termination occurred. The value of the deferred share units when converted to cash will be equivalent to the market value of the Company’s common shares at the time the conversion takes place.
Non-employee Directors of the Company were allocated a total of 39,512 deferred share units in 2008 (2007: 14,301 share units), which were granted to the Directors and expensed over the calendar year as the units are issued.
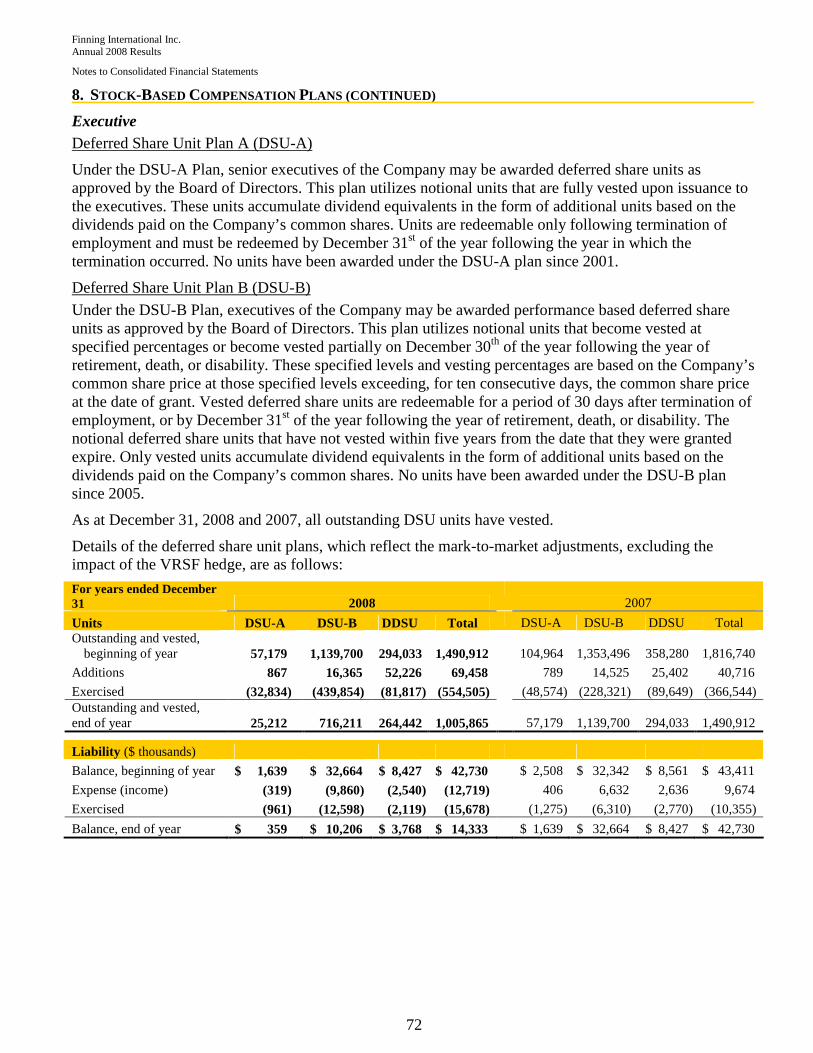
Finning International Inc. Annual 2008 Results
Notes to Consolidated Financial Statements
72
8. STOCK -BASED COMPENSATION PLANS (CONTINUED)
Executive Deferred Share Unit Plan A (DSU-A)
Under the DSU-A Plan, senior executives of the Company may be awarded deferred share units as approved by the Board of Directors. This plan utilizes notional units that are fully vested upon issuance to the executives. These units accumulate dividend equivalents in the form of additional units based on the dividends paid on the Company’s common shares. Units are redeemable only following termination of employment and must be redeemed by December 31st of the year following the year in which the termination occurred. No units have been awarded under the DSU-A plan since 2001.
Deferred Share Unit Plan B (DSU-B)
Under the DSU-B Plan, executives of the Company may be awarded performance based deferred share units as approved by the Board of Directors. This plan utilizes notional units that become vested at specified percentages or become vested partially on December 30th of the year following the year of retirement, death, or disability. These specified levels and vesting percentages are based on the Company’s common share price at those specified levels exceeding, for ten consecutive days, the common share price at the date of grant. Vested deferred share units are redeemable for a period of 30 days after termination of employment, or by December 31st of the year following the year of retirement, death, or disability. The notional deferred share units that have not vested within five years from the date that they were granted expire. Only vested units accumulate dividend equivalents in the form of additional units based on the dividends paid on the Company’s common shares. No units have been awarded under the DSU-B plan since 2005.
As at December 31, 2008 and 2007, all outstanding DSU units have vested.
Details of the deferred share unit plans, which reflect the mark-to-market adjustments, excluding the impact of the VRSF hedge, are as follows:
For years ended December 31 2008
2007
Units DSU-A DSU-B DDSU Total DSU-A DSU-B DDSU Total Outstanding and vested,
beginning of year 57,179 1,139,700 294,033 1,490,912 104,964 1,353,496 358,280 1,816,740
Additions 867 16,365 52,226 69,458 789 14,525 25,402 40,716
Exercised (32,834) (439,854) (81,817) (554,505) (48,574) (228,321) (89,649) (366,544) Outstanding and vested, end of year 25,212 716,211 264,442 1,005,865 57,179 1,139,700 294,033 1,490,912 Liability ($ thousands)
Balance, beginning of year $ 1,639 $ 32,664 $ 8,427 $ 42,730 $ 2,508 $ 32,342 $ 8,561 $ 43,411
Expense (income) (319) (9,860) (2,540) (12,719) 406 6,632 2,636 9,674
Exercised (961) (12,598) (2,119) (15,678) (1,275) (6,310) (2,770) (10,355)
Balance, end of year $ 359 $ 10,206 $ 3,768 $ 14,333 $ 1,639 $ 32,664 $ 8,427 $ 42,730

Finning International Inc. Annual 2008 Results
Notes to Consolidated Financial Statements
73
Management Share Appreciation Rights (SAR) Plan
Beginning in 2002, awards under the SAR Plan were granted to senior managers within Canada and the U.K. The exercise price is determined based on the Company’s common share price on the Toronto Stock Exchange on the grant date. Under the SAR Plan, awards are expensed over the vesting period of three years when the market price of the Company’s common shares exceeds the exercise price under the plan for vested units. Changes, either increases or decreases, in the quoted market value of common shares between the date of grant and the measurement date result in a change in the measure of compensation for the award and will be amortized over the remaining vesting period. The SAR Plan uses notional units that are valued based on the Company’s common share price on the Toronto Stock Exchange.
In 2008 and 2007, there were no SAR units issued to management. Details of the SAR plans, excluding the impact of the VRSF hedge, are as follows:
For years ended December 31 Units 2008 2007 Outstanding, beginning of year 836,875 1,162,132 Exercised (162,351) (317,557) Cancelled (28,920) (7,700) Outstanding, end of year 645,604 836,875 Vested, beginning of year 711,102 762,722 Vested 122,105 265,937 Exercised (162,351) (317,557) Cancelled (25,252) — Vested, end of year 645,604 711,102 Liability ($ thousands) Balance, beginning of year $ 11,443 $ 9,965 Expense (income) (9,378) 6,413 Exercised (1,849) (4,935) Balance, end of year $ 216 $ 11,443 Strike price ranges: $13.03 - $16.22
Summary – Impact of Stock-Based Compensation Plans
Changes in the value of all deferred share units and share appreciation rights is a result of fluctuations in the Company’s common share price and the impact of new issues, including stock options, partially offset by the impact of the VRSF hedge. The total impact was an expense of $16.9 million in 2008 (2007: $25.5 million).

Finning International Inc. Annual 2008 Results
Notes to Consolidated Financial Statements
74
9. EARNINGS PER SHARE
Basic earnings per share (EPS) is calculated by dividing net income available to common shareholders by the weighted average number of common shares outstanding during the period. Diluted earnings per share is calculated to reflect the dilutive effect of exercising outstanding stock options by applying the treasury stock method.
Earnings used in determining earnings per share from continuing operations are presented below. Earnings used in determining earnings per share from discontinued operations are the earnings from discontinued operations as reported within the consolidated statements of income and retained earnings.
For years ended December 31 Income Shares Per Share ($thousands, except share and per share amounts) 2008 Basic EPS from continuing operations: Net income from continuing operations $ 95,996 172,361,881 $ 0.56 Effect of dilutive securities: stock options — 957,076 — Diluted EPS from continuing operations: Net income from continuing operations and assumed conversions $ 95,996 173,318,957 $ 0.55 2007 Basic EPS from continuing operations: Net income from continuing operations $ 280,107 178,844,411 $ 1.57 Effect of dilutive securities: stock options — 1,615,544 — Diluted EPS from continuing operations: Net income from continuing operations and assumed conversions $ 280,107 180,459,955 $ 1.55
10. INVENTORIES
December 31 2008 2007 ($ thousands) On-hand equipment $ 1,013,204 $ 844,699 Parts and supplies 384,112 326,581 Internal service work in progress 76,188 36,522 Inventories $ 1,473,504 $ 1,207,802
For the year ended December 31, 2008, on-hand equipment, parts, supplies, and internal service work in progress recognized as an expense amounted to $3,776.2 million (2007: $3,570.5 million). For the year ended December 31, 2008, the write-down of inventories to net realizable value, included in cost of sales, amounted to $20.8 million (2007: $23.5 million).

Finning International Inc. Annual 2008 Results
Notes to Consolidated Financial Statements
75
11. OTHER ASSETS
December 31 ($ thousands) 2008 2007 Other assets – current: Future income taxes (Note 6) $ 66,889 $ 51,806 Value Added Tax receivable 7,868 6,519 Prepaid expenses 21,980 13,817 Current portion of finance assets (Note 12) 29,344 11,789 Supplier claims receivable 62,912 45,780 Income taxes recoverable 45,081 582 Short-term derivative contracts receivable (Note 4) 18,182 — Other 35,846 36,549 $ 288,102 $ 166,842 Other assets – long-term: Accrued defined benefit pension asset (Note 21) $ 157,028 $ 126,747 Long-term swap contracts receivable (Note 4) 66,417 41,637 Investment in Energyst B.V. (a) 34,655 17,105 Deferred project costs — 746 Future income taxes (Note 6) 2,521 2,567 Other 36,972 16,834 $ 297,593 $ 205,636
(a) The Company accounts for its 25.4% investment in Energyst using the equity method of accounting. In 2008, the Company increased its interest in Energyst by purchasing 36,455 new shares that were issued from Treasury for cash of $11.5 million (EUR 7.6 million). As a result, the Company’s equity interest in Energyst increased to 25.4% from 24.4%.
12. FINANCE ASSETS
December 31 ($ thousands) 2008 2007 Instalment notes receivable $ 38,852 $ 36,590 Equipment leased to customers 2,676 2,636 Less accumulated depreciation (513) (723) 2,163 1,913 Total finance assets 41,015 38,503 Less current portion of instalment notes receivable (29,344) (11,789) $ 11,671 $ 26,714
Depreciation of equipment leased to customers for the year ended December 31, 2008 was $0.4 million (2007: $5.7 million). Depreciation expense in 2007 reflects a full year of depreciation on a higher balance of equipment leased to customers before significant disposals in the fourth quarter of 2007.
13. RENTAL EQUIPMENT
December 31 ($ thousands) 2008 2007 Cost $ 1,621,494 $ 1,707,545 Less accumulated depreciation (633,659) (679,244) $ 987,835 $ 1,028,301
Rental equipment under capital leases of $40.4 million (2007: $22.9 million), net of accumulated depreciation of $6.5 million (2007: $9.4 million), are included above. Depreciation of rental equipment for the year ended December 31, 2008 was $273.0 million (2007: $278.7 million).

Finning International Inc. Annual 2008 Results
Notes to Consolidated Financial Statements
76
14. CAPITAL ASSETS
Land, Buildings, and Equipment
December 31 2008 2007
($ thousands) Cost Accumulated depreciation
Net book value Cost
Accumulated depreciation
Net book value
Land $ 71,224 $ — $ 71,224 $ 55,217 $ — $ 55,217
Buildings and equipment 610,253 (210,618) 399,635 488,848 (195,142) 293,706
$ 681,477 $ (210,618) $ 470,859 $ 544,065 $ (195,142) $ 348,923
Land, buildings, and equipment under capital leases of $12.1 million (2007: $13.5 million), net of accumulated depreciation of $2.9 million (2007: $2.2 million), are included above. Depreciation of buildings and equipment for the year ended December 31, 2008 was $44.4 million (2007: $38.1 million).
Intangible Assets
December 31 2008 2007
($ thousands) Cost Accumulated amortization
Net book value Cost
Accumulated amortization
Net book value
Subject to amortization Customer contracts and related customer relationships $ 12,879 $ (3,248) $ 9,631 $ 3,132 $ (1,549) $ 1,583
Software 44,844 (16,777) 28,067 34,994 (12,675) 22,319
57,723 (20,025) 37,698 38,126 (14,224) 23,902
Indefinite lives
Distribution rights 646 — 646 646 — 646
$ 58,369 $ (20,025) $ 38,344 $ 38,772 $ (14,224) $ 24,548
The Company acquired intangible assets subject to amortization of $18.9 million in 2008 (2007: $10.8 million). Amortization of intangible assets subject to amortization for the year ended December 31, 2008 was $6.8 million (2007: $4.1 million).
Certain intangible assets are considered to have indefinite lives because they are expected to generate cash flows indefinitely.

Finning International Inc. Annual 2008 Results
Notes to Consolidated Financial Statements
77
15. ACQUISITION
On January 15, 2008, the Company’s Canadian operation, Finning (Canada), acquired all of the issued and outstanding common shares of Collicutt Energy Services Ltd. (Collicutt), a Canadian oilfield service company. The purchase is accounted for under the purchase method of accounting. The results of Collicutt’s operations have been included in the consolidated financial statements since that date.
The purchase price of the Collicutt acquisition totaled $136.4 million. The purchase price was funded through $84.3 million in cash and 15,403 common shares of the Company with a value of $0.4 million. Acquisition costs of $6.9 million were incurred and paid on the transaction. On the date of the acquisition, the Company repaid $44.8 million of Collicutt’s existing bank debt resulting in aggregate consideration of $136.4 million.
In December 2008, the Company finalized its valuation of the Collicutt net assets acquired and modified the purchase price allocation. This resulted in an increase in goodwill of $3.0 million from that reported in the third quarter of 2008.
The following table summarizes the fair value of the assets acquired and liabilities assumed at the date of acquisition.
($ thousands) Cash $ 159 Inventories 29,914 Other current assets 20,985 Future income taxes – current 4,203 Property, plant, and equipment 99,255 Intangible assets 6,670 Goodwill 10,282 Total assets acquired 171,468 Current liabilities 18,320 Future income taxes – long-term 16,795 Total liabilities assumed 35,115 Net assets acquired $ 136,353
The intangible assets acquired primarily represent customer relationships and non-competition agreements. Customer relationships valued at $4.4 million are being amortized on a straight-line basis over their estimated life of three years, and non-competition agreements valued at $1.9 million are being amortized on a straight-line basis over their estimated life of seven years.
The goodwill was assigned to the Canada operating segment and is not deductible for tax purposes.

Finning International Inc. Annual 2008 Results
Notes to Consolidated Financial Statements
78
16. DISPOSITION OF DISCONTINUED OPERATION
On July 31, 2007, the Company sold the business and assets of the Tool Hire Division of the Company’s U.K. subsidiary, Hewden Stuart Plc, excluding real estate, for cash proceeds of $242.9 million (approximately £112 million), net of costs.
The gross sale price, net of taxes and transaction costs, was approximately equal to the net book value of the net tangible assets and goodwill associated with the tools rental business, and resulted in an after-tax gain on disposal of $0.1 million.
The results of operations of the Tool Hire Division have been included in the consolidated statements of cash flow up to the date of disposition and as discontinued operations in the consolidated statements of income up to the date of disposition. The results of the Tool Hire Division had previously been reported in the Finning UK Group segment.
Loss from the Tool Hire Division to the date of disposition is summarized as follows:
For year ended December 31, 2007 ($ thousands) Revenue $ 113,272 Loss before provision for income taxes (4,108) Gain on sale of discontinued operations 38,590 Provision for income tax expense (36,532) Loss from discontinued operations $ (2,050)
The significant net cash flows from the Tool Hire Division are as follows:
For year ended December 31, 2007 ($ thousands) Cash flows used in operating activities $ (3,795) Cash used in investing activities $ (561)
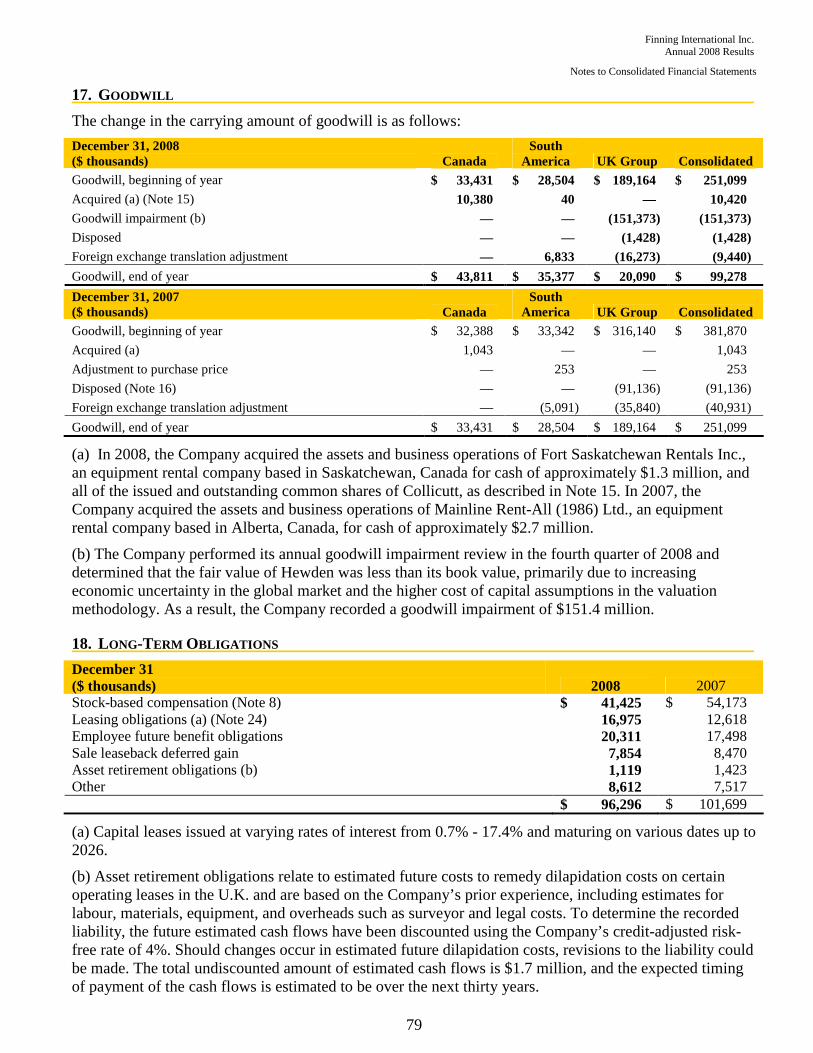
Finning International Inc. Annual 2008 Results
Notes to Consolidated Financial Statements
79
17. GOODWILL
The change in the carrying amount of goodwill is as follows:
December 31, 2008 ($ thousands) Canada
South America UK Group Consolidated
Goodwill, beginning of year $ 33,431 $ 28,504 $ 189,164 $ 251,099 Acquired (a) (Note 15) 10,380 40 — 10,420 Goodwill impairment (b) — — (151,373) (151,373) Disposed — — (1,428) (1,428) Foreign exchange translation adjustment — 6,833 (16,273) (9,440)
Goodwill, end of year $ 43,811 $ 35,377 $ 20,090 $ 99,278 December 31, 2007 ($ thousands) Canada
South America UK Group Consolidated
Goodwill, beginning of year $ 32,388 $ 33,342 $ 316,140 $ 381,870
Acquired (a) 1,043 — — 1,043
Adjustment to purchase price — 253 — 253
Disposed (Note 16) — — (91,136) (91,136)
Foreign exchange translation adjustment — (5,091) (35,840) (40,931)
Goodwill, end of year $ 33,431 $ 28,504 $ 189,164 $ 251,099
(a) In 2008, the Company acquired the assets and business operations of Fort Saskatchewan Rentals Inc., an equipment rental company based in Saskatchewan, Canada for cash of approximately $1.3 million, and all of the issued and outstanding common shares of Collicutt, as described in Note 15. In 2007, the Company acquired the assets and business operations of Mainline Rent-All (1986) Ltd., an equipment rental company based in Alberta, Canada, for cash of approximately $2.7 million.
(b) The Company performed its annual goodwill impairment review in the fourth quarter of 2008 and determined that the fair value of Hewden was less than its book value, primarily due to increasing economic uncertainty in the global market and the higher cost of capital assumptions in the valuation methodology. As a result, the Company recorded a goodwill impairment of $151.4 million.
18. LONG-TERM OBLIGATIONS
December 31 ($ thousands) 2008 2007 Stock-based compensation (Note 8) $ 41,425 $ 54,173 Leasing obligations (a) (Note 24) 16,975 12,618 Employee future benefit obligations 20,311 17,498 Sale leaseback deferred gain 7,854 8,470 Asset retirement obligations (b) 1,119 1,423 Other 8,612 7,517 $ 96,296 $ 101,699
(a) Capital leases issued at varying rates of interest from 0.7% - 17.4% and maturing on various dates up to 2026.
(b) Asset retirement obligations relate to estimated future costs to remedy dilapidation costs on certain operating leases in the U.K. and are based on the Company’s prior experience, including estimates for labour, materials, equipment, and overheads such as surveyor and legal costs. To determine the recorded liability, the future estimated cash flows have been discounted using the Company’s credit-adjusted risk-free rate of 4%. Should changes occur in estimated future dilapidation costs, revisions to the liability could be made. The total undiscounted amount of estimated cash flows is $1.7 million, and the expected timing of payment of the cash flows is estimated to be over the next thirty years.

Finning International Inc. Annual 2008 Results
Notes to Consolidated Financial Statements
80
19. CUMULATIVE CURRENCY TRANSLATION ADJUSTMENTS
The Company’s subsidiaries operate in three functional currencies: Canadian dollars, U.S. dollars, and the U.K. pound sterling. The Company experiences foreign currency translation gains or losses as a result of consolidating the financial statements of self-sustaining foreign operations. These unrealized foreign currency translation gains or losses are recorded in the Accumulated Other Comprehensive Income/Loss account on the Consolidated Balance Sheet. Currency translation adjustments arise as a result of fluctuations in foreign currency exchange rates at the period end. The cumulative currency translation adjustment for 2008 mainly resulted from the weaker Canadian dollar relative to the U.S. dollar (23.9% stronger), and stronger relative to the U.K. pound sterling (8.7% stronger), from December 31, 2007 to December 31, 2008.
The exchange rates of the Canadian dollar against the following foreign currencies were as follows:
December 31 Exchange rate
2008 2007
U.S. dollar 1.2246 0.9881 U.K. pound sterling 1.7896 1.9600 For years ended December 31 Average exchange rates U.S. dollar 1.0660 1.0748 U.K. pound sterling 1.9617 2.1487
20. SUPPLEMENTAL CASH FLOW INFORMATION
Non cash working capital changes
For years ended December 31 ($ thousands) 2008 2007 Accounts receivable and other $ (159,284) $ (158,857) Inventories – on-hand equipment (112,587) (65,548) Inventories – parts and supplies (43,045) (31,897) Accounts payable and accruals 85,340 31,215 Income taxes (69,013) 6,499 Changes in working capital items (298,589) (218,588)
Components of cash and cash equivalents
December 31 ($ thousands) 2008 2007 Cash $ 105,905 $ 16,533 Short-term investments 3,867 45,327 Cash and cash equivalents $ 109,772 $ 61,860
Interest and tax payments
For years ended December 31 ($ thousands) 2008 2007 Interest paid $ (83,569) $ (74,668) Income taxes paid $ (94,767) $ (105,091)
Finning International Inc. Annual 2008 Results
Notes to Consolidated Financial Statements
81
21. EMPLOYEE FUTURE BENEFITS
The Company and its subsidiaries in Canada and the U.K. have defined benefit pension plans and defined contribution pension plans providing retirement benefits for most of their permanent employees.
The defined benefit pension plans include both registered and non-registered pension plans that provide a pension based on the members’ final average earnings and years of service while participating in the pension plan.
• In Canada, defined benefit plans exist for eligible employees. Final average earnings are based on the highest 3-5 year average salary and there is no standard indexation feature. Effective July 1, 2004, non-executive members of the defined benefit plan were offered a voluntary opportunity to convert their benefits to a defined contribution pension plan. The registered defined benefit plan was subsequently closed to all new non-executive employees, who are eligible to enter one of the Company’s defined contribution plans. The defined benefit pension plan continues to be open to new executives. Pension benefits under the registered plans’ formula that exceed the maximum taxation limits are provided from a non-registered supplemental pension plan. Benefits under this plan are partially funded by a Retirement Compensation Arrangement.
• Finning (UK) provides a defined benefit plan for all employees hired prior to January 2003. Final average earnings are based on the highest 3-year period and benefits are indexed annually with inflation subject to limits. Effective January 2003, this plan was closed to new non-executive employees and replaced with a defined contribution pension plan. The defined benefit plan was temporarily re-opened in June 2003, on a one-time basis, to allow for the transfer of employees assumed upon the acquisition of the Lex Harvey business. These employees were allowed to join the Finning (UK) defined benefit pension plan, for future service only. With the sale of the UK Materials Handling business, certain employees became non-active members of the defined benefit plan.
• Hewden has two defined benefit plans that are open to eligible management and executive members by invitation only. Final average earnings are based on the highest 3-year period and benefits are indexed annually with inflation subject to limits. With the sale of the Hewden Tool Hire business, certain employees became non-active members of the defined benefit plan.
The defined contribution pension plans in Canada are registered pension plans that offer a base Company contribution rate for all members. The Company will also partially match employee contributions to a maximum additional Company contribution of 1% of employee earnings. The defined contribution pension plan in the UK offers a match of employee contributions, within a required range, plus 1%.
The Company’s South American employees do not participate in employer pension plans but are covered by country specific legislation with respect to indemnity plans. The Company has recorded a liability to employees based on an actuarial valuation of anticipated payments to employees. An amount of $4.3 million was expensed in 2008 (2007: $4.8 million) for a total obligation at December 31, 2008 of $20.3 million (2007: $17.5 million).

Finning International Inc. Annual 2008 Results
Notes to Consolidated Financial Statements
82
21. EMPLOYEE FUTURE BENEFITS (CONTINUED)
The expense for the Company’s benefit plans, primarily for pension benefits, is as follows:
For years ended December 31 2008 2007 ($ thousands) Canada UK Hewden Total Canada UK Hewden Total Defined contribution plans Net benefit plan expense $ 21,163 $ 1,104 $ 159 $ 22,426 $ 16,193 $ 823 $ 241 $ 17,257 Defined benefit plans Current service cost, net of employee contributions $ 7,014 $ 3,713 $ 1,436 $ 12,163 $ 8,343 $ 5,328 $ 2,039 $ 15,710
Interest cost 18,474 24,329 10,324 53,127 16,563 26,238 10,582 53,383 Actual loss (return) on plan assets 42,184 86,407 33,859 162,450 (8,120) (17,619) (7,321) (33,060)
Actuarial (gains) losses (60,837) (99,297) (30,120) (190,254) (3,559) (75,643) (21,148) (100,350) Plan curtailment (a) — — — — — — 958 958 Employee future benefit costs before adjustments to recognize the long-term nature of employee future benefit costs
6,835
15,152
15,499
37,486
13,227
(61,696)
(14,890)
(63,359) Adjustments to recognize the long-term nature of employee future benefit costs:
Difference between expected return and actual return on plan assets for year (62,505) (115,187) (45,539) (223,231) (11,707) (11,498) (4,280) (27,485)
Difference between actuarial loss recognized for year and actual actuarial gain on accrued benefit obligation for year 64,060 100,941 30,693 195,694 5,769 82,102 22,894 110,765
Difference between amortization of past service costs for year and actual plan amendments for year
298
(647) (143) (492) 298 (709) — (411) Amortization of transitional obligation / (asset)
(19)
(1,140)
1,259 100 (19) (1,248) 1,523 256
Defined benefit costs recognized 8,669 (881) 1,769 9,557 7,568 6,951 5,247 19,766 Total $ 29,832 $ 223 $ 1,928 $ 31,983 $ 23,761 $ 7,774 $ 5,488 $ 37,023
(a) As a result of the sale of the Tool Hire Division, the Company recognized a curtailment to reflect the impact of the significant reduction of the expected years of future service of active employees participating in the Hewden defined benefit plans.
Total cash payments for employee future benefits for 2008, which is made up of cash contributed by the Company to its defined benefit plans and its defined contribution plans was $49.3 million and $22.4 million, respectively (2007: $78.5 million and $17.2 million, respectively).
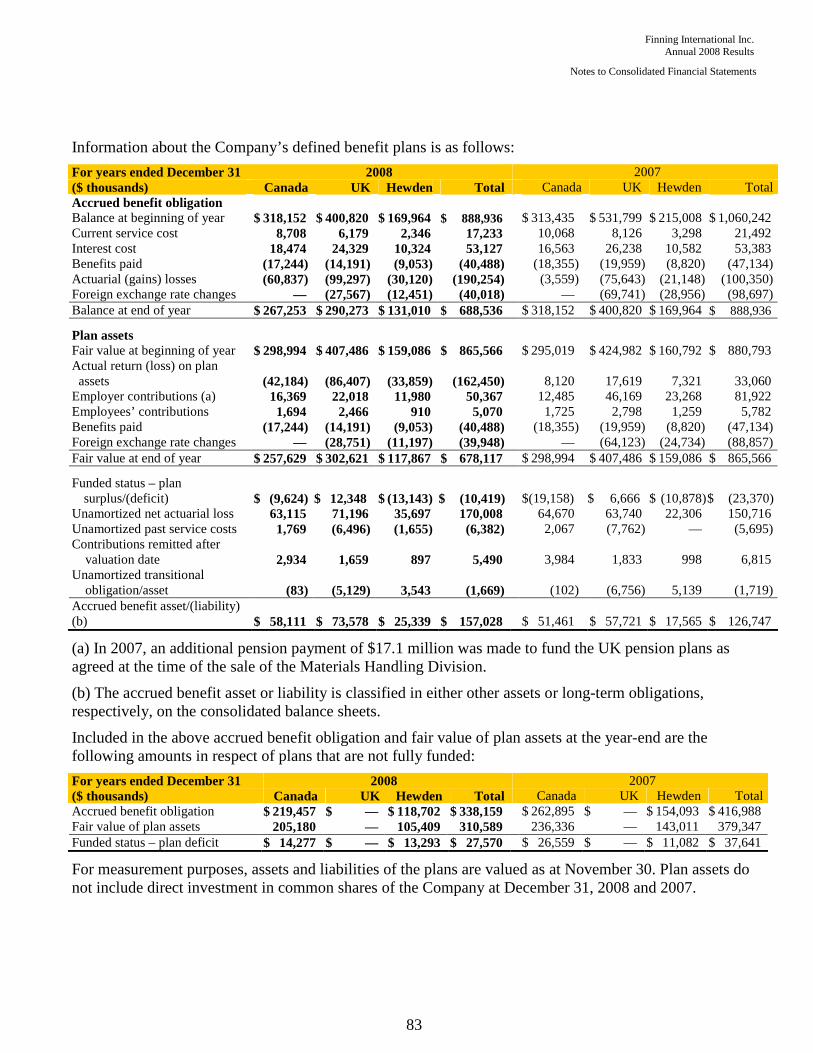
Finning International Inc. Annual 2008 Results
Notes to Consolidated Financial Statements
83
Information about the Company’s defined benefit plans is as follows:
For years ended December 31 2008 2007 ($ thousands) Canada UK Hewden Total Canada UK Hewden Total Accrued benefit obligation Balance at beginning of year $ 318,152 $ 400,820 $ 169,964 $ 888,936 $ 313,435 $ 531,799 $ 215,008 $ 1,060,242 Current service cost 8,708 6,179 2,346 17,233 10,068 8,126 3,298 21,492 Interest cost 18,474 24,329 10,324 53,127 16,563 26,238 10,582 53,383 Benefits paid (17,244) (14,191) (9,053) (40,488) (18,355) (19,959) (8,820) (47,134) Actuarial (gains) losses (60,837) (99,297) (30,120) (190,254) (3,559) (75,643) (21,148) (100,350) Foreign exchange rate changes — (27,567) (12,451) (40,018) — (69,741) (28,956) (98,697) Balance at end of year $ 267,253 $ 290,273 $ 131,010 $ 688,536 $ 318,152 $ 400,820 $ 169,964 $ 888,936 Plan assets Fair value at beginning of year $ 298,994 $ 407,486 $ 159,086 $ 865,566 $ 295,019 $ 424,982 $ 160,792 $ 880,793 Actual return (loss) on plan assets (42,184) (86,407) (33,859) (162,450) 8,120 17,619 7,321 33,060
Employer contributions (a) 16,369 22,018 11,980 50,367 12,485 46,169 23,268 81,922 Employees’ contributions 1,694 2,466 910 5,070 1,725 2,798 1,259 5,782 Benefits paid (17,244) (14,191) (9,053) (40,488) (18,355) (19,959) (8,820) (47,134) Foreign exchange rate changes — (28,751) (11,197) (39,948) — (64,123) (24,734) (88,857) Fair value at end of year $ 257,629 $ 302,621 $ 117,867 $ 678,117 $ 298,994 $ 407,486 $ 159,086 $ 865,566 Funded status – plan
surplus/(deficit) $ (9,624) $ 12,348 $ (13,143) $ (10,419) $(19,158) $ 6,666 $ (10,878)$ (23,370) Unamortized net actuarial loss 63,115 71,196 35,697 170,008 64,670 63,740 22,306 150,716 Unamortized past service costs 1,769 (6,496) (1,655) (6,382) 2,067 (7,762) — (5,695) Contributions remitted after valuation date 2,934 1,659 897 5,490 3,984 1,833 998 6,815 Unamortized transitional obligation/asset (83) (5,129) 3,543 (1,669) (102) (6,756) 5,139 (1,719) Accrued benefit asset/(liability)
(b) $ 58,111 $ 73,578 $ 25,339 $ 157,028 $ 51,461 $ 57,721 $ 17,565 $ 126,747
(a) In 2007, an additional pension payment of $17.1 million was made to fund the UK pension plans as agreed at the time of the sale of the Materials Handling Division.
(b) The accrued benefit asset or liability is classified in either other assets or long-term obligations, respectively, on the consolidated balance sheets.
Included in the above accrued benefit obligation and fair value of plan assets at the year-end are the following amounts in respect of plans that are not fully funded:
For years ended December 31 2008 2007 ($ thousands) Canada UK Hewden Total Canada UK Hewden Total Accrued benefit obligation $ 219,457 $ — $ 118,702 $ 338,159 $ 262,895 $ — $ 154,093 $ 416,988 Fair value of plan assets 205,180 — 105,409 310,589 236,336 — 143,011 379,347 Funded status – plan deficit $ 14,277 $ — $ 13,293 $ 27,570 $ 26,559 $ — $ 11,082 $ 37,641
For measurement purposes, assets and liabilities of the plans are valued as at November 30. Plan assets do not include direct investment in common shares of the Company at December 31, 2008 and 2007.

Finning International Inc. Annual 2008 Results
Notes to Consolidated Financial Statements
84
21. EMPLOYEE FUTURE BENEFITS (CONTINUED)
Plan assets are principally invested in the following securities at November 30, 2008:
Canada UK Hewden Equity 45% 61% 58% Fixed-income 46% 39% 42% Real estate 9% — —
The significant actuarial assumptions are as follows:
2008 2007
Canada UK Hewden Canada UK Hewden
Discount rate – obligation 7.50% 7.20% 7.20% 5.80% 6.20% 6.20%
Discount rate – expense 5.80% 6.20% 6.20% 5.25% 5.30% 5.30%
Expected long-term rate of return on plan assets 7.25% 7.00% 7.25% 7.25% 7.00% 7.25%
Rate of compensation increase 3.50% 4.00% 4.00% 3.50% 4.00% 4.00%
Estimated remaining service life (years) 8-11 14 13 10-15 14 13
Discount rates are determined based on high quality corporate bonds at the measurement date, November 30. Recent market conditions and the current economic environment have resulted in significantly higher corporate bond yields at November 30, 2008 than in previous years. If yields were lower, the accrued defined benefit pension obligations as presented in this note would be higher. As an indication of the sensitivity of Finning’s defined benefit pension obligation, if the discount rates were 0.25% lower at November 30, 2008, the accrued defined benefit pension obligation presented would have increased by approximately $8 million for Finning (Canada)’s plans, £7 million for the Finning UK plan, and £3 million for the Hewden plans.
Defined benefit pension plans are country and entity specific. The major defined benefit plans and their respective valuation dates are:
Defined Benefit Plan Last Actuarial Valuation Date Next Actuarial Valuation Date Canada – BC Regular & Executive Plan December 31, 2006 December 31, 2009 Canada – Executive Supplemental Income Plan December 31, 2006 December 31, 2009 Canada – General Supplemental Income Plan December 31, 2006 December 31, 2009 Canada – Alberta Defined Benefit Plan December 31, 2005 December 31, 2008 Finning UK Defined Benefit Scheme December 31, 2005 December 31, 2008 Hewden Stuart Pension Scheme December 31, 2005 December 31, 2008 Hewden Pension Plan January 1, 2008 January 1, 2011
22. ECONOMIC RELATIONSHIPS
The Company distributes and services heavy equipment and related products. The Company has dealership agreements with numerous equipment manufacturers, of which the most significant are with subsidiaries of Caterpillar Inc. Distribution and servicing of Caterpillar products account for the major portion of the Company's operations. Finning has a strong relationship with Caterpillar Inc. that has been ongoing since 1933.

Finning International Inc. Annual 2008 Results
Notes to Consolidated Financial Statements
85
23. SEGMENTED INFORMATION
The Company and its subsidiaries have operated primarily in one industry during the year, that being the selling, servicing, and renting of heavy equipment and related products.
The reportable operating segments are as follows:
• Canadian operations: British Columbia, Alberta, the Yukon Territory, the Northwest Territories, and a portion of Nunavut.
• South American operations: Chile, Argentina, Uruguay, and Bolivia. • UK Group operations: England, Scotland, Wales, Falkland Islands, and the Channel Islands • Other: corporate head office.
For year ended December 31, 2008 ($ thousands) Canada
South America
UK Group Other
Goodwill Impairment Consolidated
Revenue from external sources $ 3,216,946 $ 1,501,633 $ 1,272,842 $ 4 $ — $ 5,991,425 Operating costs (2,801,877) (1,313,753) (1,099,805) (46,709) — (5,262,144) Depreciation and amortization (164,489) (34,217) (125,447) (208) — (324,361) Other income (expenses) (16,102) (5,428) 6,036 (1,307) — (16,801) Goodwill impairment (Note 17) — — — — (151,373) (151,373)
Earnings before interest and taxes $ 234,478 $ 148,235 $ 53,626 $ (48,220) $ (151,373) $ 236,746 Finance costs (83,636) Provision for income taxes (57,114)
Net income $ 95,996
Identifiable assets $ 2,094,186 $ 1,350,929 $ 1,135,352 $ 139,908 $ — $ 4,720,375 Capital assets $ 278,171 $ 115,626 $ 114,811 $ 595 $ — $ 509,203 Gross capital expenditures (1) $ 143,269 $ 47,940 $ 15,234 $ — $ — $ 206,443 Gross rental asset expenditures $ 296,166 $ 76,715 $ 161,803 $ — $ — $ 534,684 For year ended December 31, 2007 ($ thousands) Canada
South America
UK Group Other
Goodwill Impairment Consolidated
Revenue from external sources $ 2,936,229 $ 1,325,582 $ 1,400,427 $ 6 $ — $ 5,662,244
Operating costs (2,486,030) (1,171,761) (1,191,290) (30,867) — (4,879,948)
Depreciation and amortization (165,488) (25,922) (136,474) — — (327,884)
Other income (expenses) 1,602 (551) 384 — — 1,435 Earnings from continuing operations before interest and taxes $ 286,313 $ 127,348 $ 73,047 $ (30,861) $ — $ 455,847
Finance costs (72,842)
Provision for income taxes (102,898) Net income from continuing operations 280,107
Loss from discontinued operations, net of tax (2,050)
Net income $ 278,057
Identifiable assets $ 1,820,394 $ 810,465 $ 1,434,608 $ 68,696 $ — $ 4,134,163
Capital assets $ 158,301 $ 58,339 $ 156,014 $ 817 $ — $ 373,471
Gross capital expenditures (1) $ 23,604 $ 21,856 $ 32,359 $ — $ — $ 77,819
Gross rental asset expenditures $ 449,894 $ 76,481 $ 231,110 $ — $ — $ 757,485
(1) includes capital leases

Finning International Inc. Annual 2008 Results
Notes to Consolidated Financial Statements
86
24. CONTRACTUAL OBLIGATIONS
Future minimum lease payments due under capital lease contracts and payments due under various operating lease contracts are as follows: For years ended December 31 ($ thousands)
Capital Leases
Operating Leases
2009 $ 26,336 $ 71,168 2010 6,799 63,159 2011 1,235 49,684 2012 1,083 31,752 2013 1,064 23,465 Thereafter 14,720 150,832 51,237 $ 390,060 Less imputed interest (10,607) n/a 40,630 390,060 Less current portion of capital lease obligation (23,655) n/a Total long-term capital lease obligation $ 16,975 $ 390,060
25. COMMITMENTS AND CONTINGENCIES
(a) Due to the size, complexity, and nature of the Company’s operations, various legal and tax matters are pending. In the opinion of management, these matters will not have a material effect on the Company’s consolidated financial position or results of operations.
(b) The Company has committed to pay approximately $16 million over the next three years for consulting and implementation support for a new information technology system solution for its global operations.
26. GUARANTEES AND INDEMNIFICATIONS
The Company enters into contracts with rights of return, in certain circumstances, for the repurchase of equipment sold to customers for an amount based on an estimate of the future value of the fair market price at that time. As at December 31, 2008, the total estimated value of these contracts outstanding is $172.4 million coming due at periods ranging from 2009 to 2015. The Company’s experience to date has been that the equipment at the exercise date of the contract is worth more than the repurchase amount. The total amount recognized as a provision against these contracts is $0.7 million.
As part of the Tool Hire and Materials Handling divisions’ Purchase and Sale Agreements, Finning has provided indemnifications to the respective third party purchaser, covering breaches of representation and warranties as well as litigation and other matters set forth in the agreement. Claims may be made by the third party purchaser under these agreements for various periods of time depending on the nature of the claim. The maximum potential exposure of Finning under these indemnifications is 100% of the purchase price with respect to the Tool Hire Division, and 75% of the purchase price with respect to the Materials Handling Division. As at December 31, 2008, Finning had no material liabilities recorded for these indemnifications.
In connection with the sale of the Materials Handling Division in 2006, the Company provided a guarantee to a third party with respect to a property lease. If the lessee were to default, the Company would be required to make the annual lease payments of approximately $1.2 million to the end of the lease term in 2020. As at December 31, 2008, the Company had no liability recorded for this guarantee.
In the normal course of operations, the Company has several long-term maintenance and repair contracts with various customers which contain cost per hour guarantees.
During the year, the Company entered into various other commercial letters of credit in the normal course of operations.

Finning International Inc. Annual 2008 Results
Notes to Consolidated Financial Statements
87
27. ACCOUNTS RECEIVABLE SECURITIZATION
In 2002, the Company entered into an arrangement and sold a $45.0 million co-ownership interest in a pool of eligible non-interest bearing trade receivables to a multi-seller securitization trust (the “Trust”), net of overcollateralization. Under the terms of the agreement, which expired on November 29, 2007, the Company could sell co-ownership interests of up to $120.0 million on a revolving basis. The Company retained a subordinated interest in the cash flows arising from the eligible receivables underlying the Trust’s co-ownership interest. The Trust and its investors did not have recourse to the Company’s other assets in the event that obligors failed to pay the underlying receivables when due. Pursuant to the agreement, the Company serviced the pool of underlying receivables.
On the expiry date, the Company terminated the co-ownership interests, ceased all securitization of its accounts receivable, and repurchased previously securitized receivables for cash of $45.0 million.
For the 2007 period up to the repurchase of the receivables held by the Trust, the Company recognized a pre-tax loss of $1.8 million relating to these transfers.
In 2007, proceeds from revolving reinvestment of collections were $451.9 million.