news release - conference-board.org - hwol aug... · 1 news release follow the conference board for...
TRANSCRIPT
1
News Release
Follow The Conference Board
For further information:
Carol Courter 212-339-0232 / [email protected] Release #6029
For Immediate Release 10:00 AM ET, Wednesday, August 1, 2018
Online Job Ads Increased 170,800 in July
▪ Increases widespread across virtually all States and MSAs
▪ Most occupations showed gains over the month
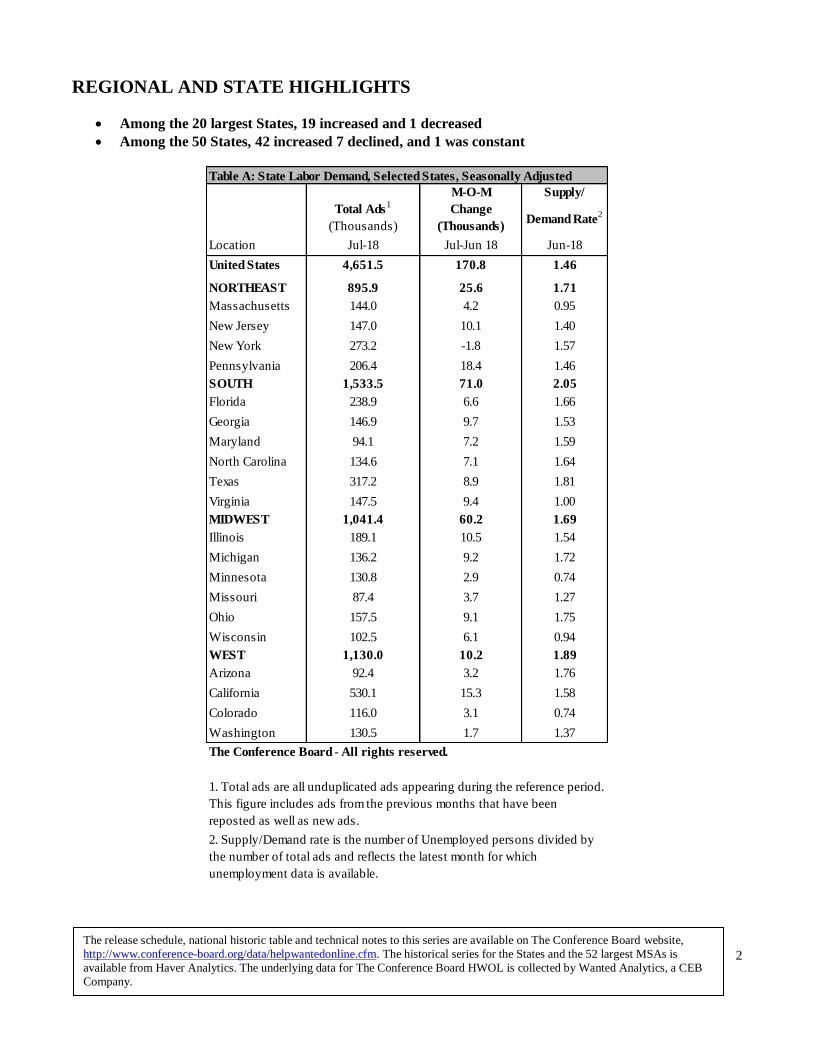
NEW YORK, August 1, 2018…Online advertised vacancies increased 170,800 to 4,651,500 in July, according to The
Conference Board Help Wanted OnLine® (HWOL) Data Series, released today. The June Supply/Demand rate stands at
1.46 unemployed for each advertised vacancy, with a total of 2.1 million more unemployed workers than the number of
advertised vacancies. The number of unemployed was approximately 6.6 million in June.
The Professional occupational category saw changes in Healthcare practitioners (23.9), Management (22.1), and Business
(18.5). The Services/Production occupational category saw changes in Sales (28.2), Transportation (23.3), and Food prep
(16.3).
NOTE: Recently, the HWOL Data Series has experienced a declining trend in the number of online job ads that may not reflect broader trends in the U.S. labor market. Based on changes in how job postings appear online, The Conference Board is reviewing its
HWOL methodology to ensure accuracy and alignment with market trends.
2
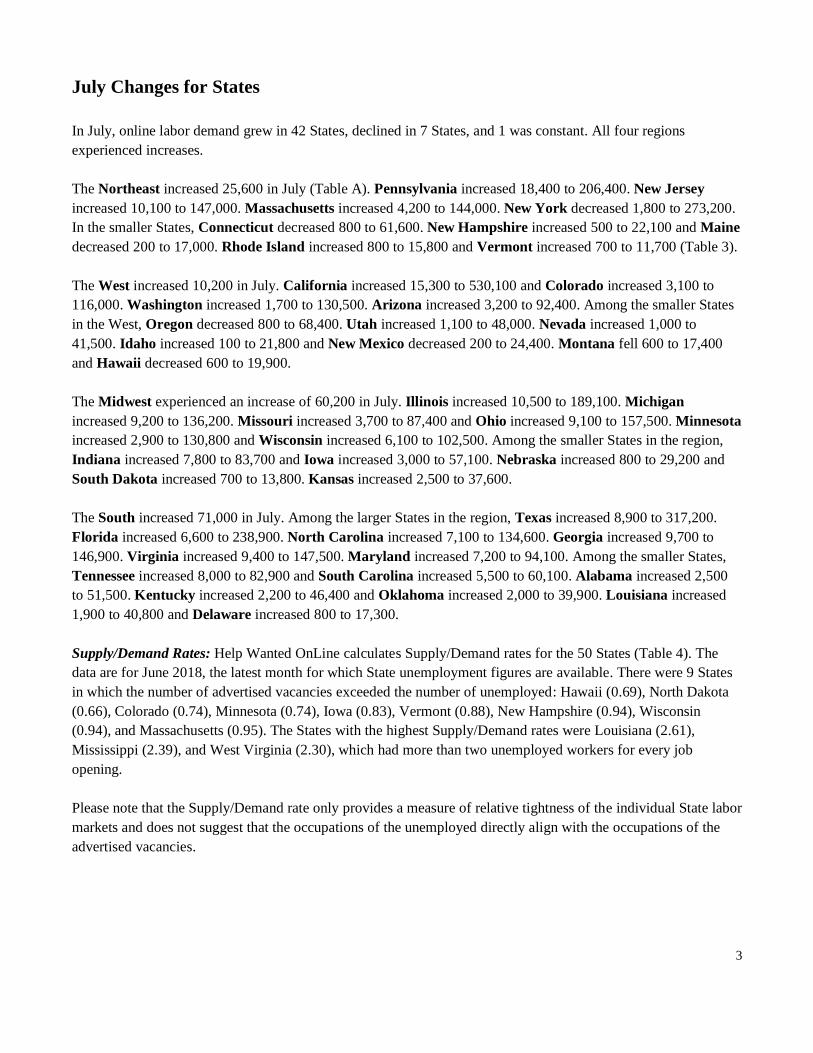
REGIONAL AND STATE HIGHLIGHTS
• Among the 20 largest States, 19 increased and 1 decreased
• Among the 50 States, 42 increased 7 declined, and 1 was constant
Table A: State Labor Demand, Selected States, Seasonally Adjusted
Supply/
Demand Rate2
Location Jul-18 Jul-Jun 18 Jun-18
United States 4,651.5 170.8 1.46
NORTHEAST 895.9 25.6 1.71
Massachusetts 144.0 4.2 0.95
New Jersey 147.0 10.1 1.40
New York 273.2 -1.8 1.57
Pennsylvania 206.4 18.4 1.46
SOUTH 1,533.5 71.0 2.05
Florida 238.9 6.6 1.66
Georgia 146.9 9.7 1.53
Maryland 94.1 7.2 1.59
North Carolina 134.6 7.1 1.64
Texas 317.2 8.9 1.81
Virginia 147.5 9.4 1.00
MIDWEST 1,041.4 60.2 1.69
Illinois 189.1 10.5 1.54
Michigan 136.2 9.2 1.72
Minnesota 130.8 2.9 0.74
Missouri 87.4 3.7 1.27
Ohio 157.5 9.1 1.75
Wisconsin 102.5 6.1 0.94
WEST 1,130.0 10.2 1.89
Arizona 92.4 3.2 1.76
California 530.1 15.3 1.58
Colorado 116.0 3.1 0.74
Washington 130.5 1.7 1.37
1. Total ads are all unduplicated ads appearing during the reference period.
This figure includes ads from the previous months that have been
reposted as well as new ads.
2. Supply/Demand rate is the number of Unemployed persons divided by
the number of total ads and reflects the latest month for which
unemployment data is available.
The Conference Board - All rights reserved.
Total Ads1
(Thousands)
M-O-M
Change
(Thousands)
The release schedule, national historic table and technical notes to this series are available on The Conference Board website,
http://www.conference-board.org/data/helpwantedonline.cfm. The historical series for the States and the 52 largest MSAs is
available from Haver Analytics. The underlying data for The Conference Board HWOL is collected by Wanted Analytics, a CEB
Company.
3
July Changes for States
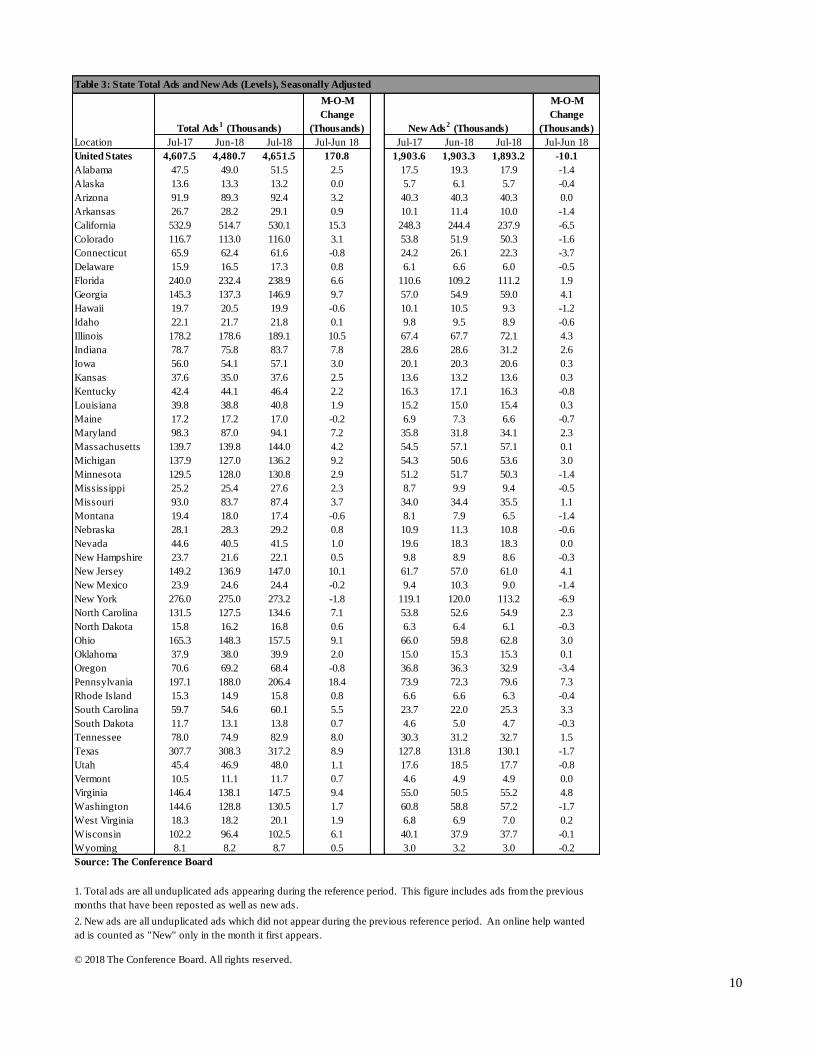
In July, online labor demand grew in 42 States, declined in 7 States, and 1 was constant. All four regions
experienced increases.
The Northeast increased 25,600 in July (Table A). Pennsylvania increased 18,400 to 206,400. New Jersey
increased 10,100 to 147,000. Massachusetts increased 4,200 to 144,000. New York decreased 1,800 to 273,200.
In the smaller States, Connecticut decreased 800 to 61,600. New Hampshire increased 500 to 22,100 and Maine
decreased 200 to 17,000. Rhode Island increased 800 to 15,800 and Vermont increased 700 to 11,700 (Table 3).
The West increased 10,200 in July. California increased 15,300 to 530,100 and Colorado increased 3,100 to
116,000. Washington increased 1,700 to 130,500. Arizona increased 3,200 to 92,400. Among the smaller States
in the West, Oregon decreased 800 to 68,400. Utah increased 1,100 to 48,000. Nevada increased 1,000 to
41,500. Idaho increased 100 to 21,800 and New Mexico decreased 200 to 24,400. Montana fell 600 to 17,400
and Hawaii decreased 600 to 19,900.
The Midwest experienced an increase of 60,200 in July. Illinois increased 10,500 to 189,100. Michigan
increased 9,200 to 136,200. Missouri increased 3,700 to 87,400 and Ohio increased 9,100 to 157,500. Minnesota
increased 2,900 to 130,800 and Wisconsin increased 6,100 to 102,500. Among the smaller States in the region,
Indiana increased 7,800 to 83,700 and Iowa increased 3,000 to 57,100. Nebraska increased 800 to 29,200 and
South Dakota increased 700 to 13,800. Kansas increased 2,500 to 37,600.
The South increased 71,000 in July. Among the larger States in the region, Texas increased 8,900 to 317,200.
Florida increased 6,600 to 238,900. North Carolina increased 7,100 to 134,600. Georgia increased 9,700 to
146,900. Virginia increased 9,400 to 147,500. Maryland increased 7,200 to 94,100. Among the smaller States,
Tennessee increased 8,000 to 82,900 and South Carolina increased 5,500 to 60,100. Alabama increased 2,500
to 51,500. Kentucky increased 2,200 to 46,400 and Oklahoma increased 2,000 to 39,900. Louisiana increased
1,900 to 40,800 and Delaware increased 800 to 17,300.
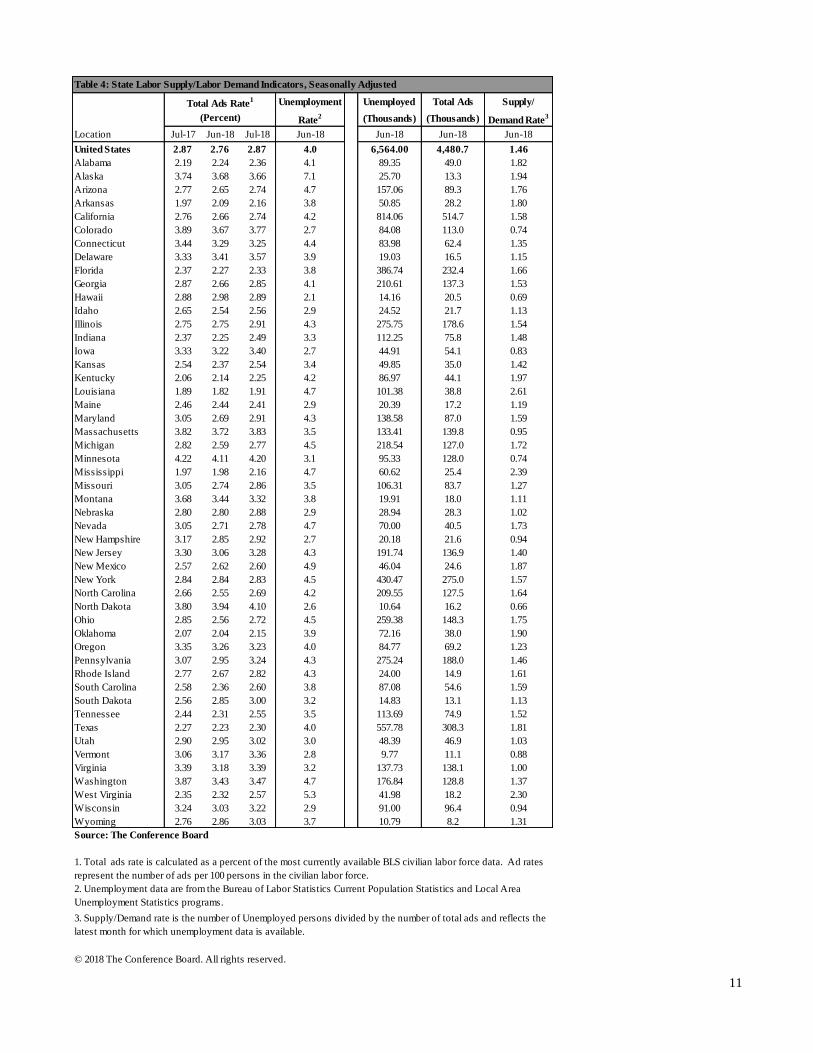
Supply/Demand Rates: Help Wanted OnLine calculates Supply/Demand rates for the 50 States (Table 4). The
data are for June 2018, the latest month for which State unemployment figures are available. There were 9 States
in which the number of advertised vacancies exceeded the number of unemployed: Hawaii (0.69), North Dakota
(0.66), Colorado (0.74), Minnesota (0.74), Iowa (0.83), Vermont (0.88), New Hampshire (0.94), Wisconsin
(0.94), and Massachusetts (0.95). The States with the highest Supply/Demand rates were Louisiana (2.61),
Mississippi (2.39), and West Virginia (2.30), which had more than two unemployed workers for every job
opening.
Please note that the Supply/Demand rate only provides a measure of relative tightness of the individual State labor
markets and does not suggest that the occupations of the unemployed directly align with the occupations of the
advertised vacancies.
4
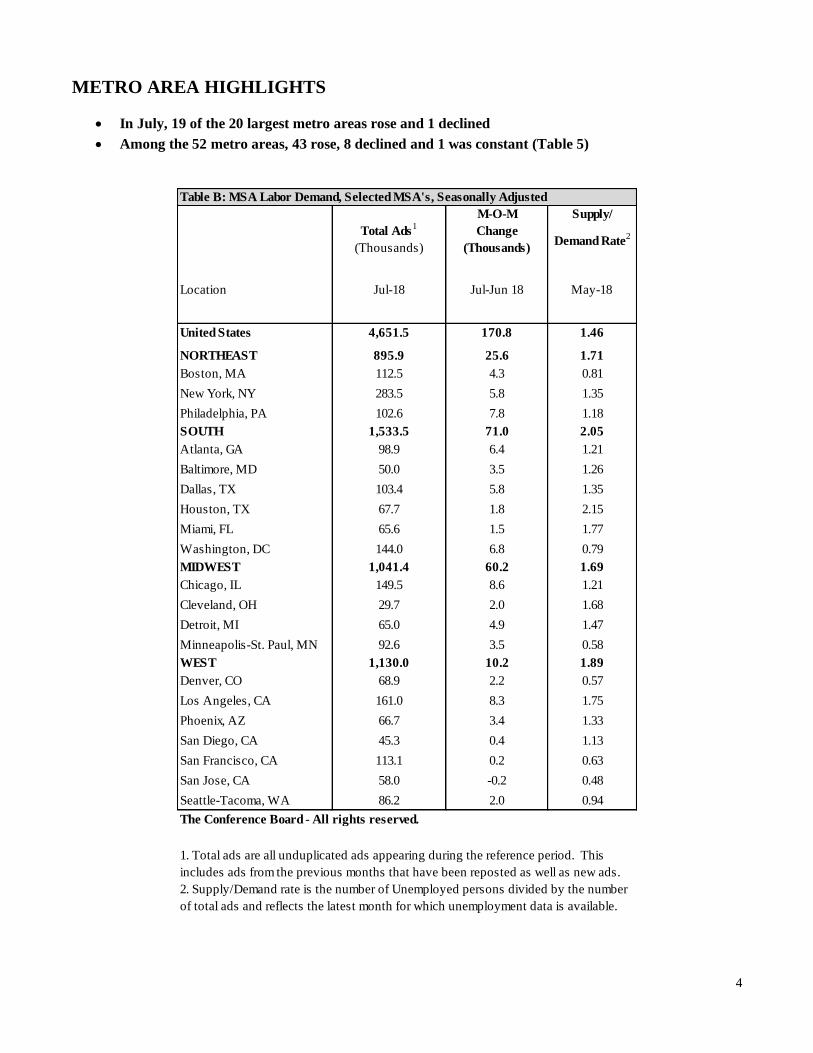
METRO AREA HIGHLIGHTS
• In July, 19 of the 20 largest metro areas rose and 1 declined
• Among the 52 metro areas, 43 rose, 8 declined and 1 was constant (Table 5)
Supply/
Demand Rate2
Location Jul-18 Jul-Jun 18 May-18
United States 4,651.5 170.8 1.46
NORTHEAST 895.9 25.6 1.71
Boston, MA 112.5 4.3 0.81
New York, NY 283.5 5.8 1.35
Philadelphia, PA 102.6 7.8 1.18
SOUTH 1,533.5 71.0 2.05
Atlanta, GA 98.9 6.4 1.21
Baltimore, MD 50.0 3.5 1.26
Dallas, TX 103.4 5.8 1.35
Houston, TX 67.7 1.8 2.15
Miami, FL 65.6 1.5 1.77
Washington, DC 144.0 6.8 0.79
MIDWEST 1,041.4 60.2 1.69
Chicago, IL 149.5 8.6 1.21
Cleveland, OH 29.7 2.0 1.68
Detroit, MI 65.0 4.9 1.47
Minneapolis-St. Paul, MN 92.6 3.5 0.58
WEST 1,130.0 10.2 1.89
Denver, CO 68.9 2.2 0.57
Los Angeles, CA 161.0 8.3 1.75
Phoenix, AZ 66.7 3.4 1.33
San Diego, CA 45.3 0.4 1.13
San Francisco, CA 113.1 0.2 0.63
San Jose, CA 58.0 -0.2 0.48
Seattle-Tacoma, WA 86.2 2.0 0.94
Table B: MSA Labor Demand, Selected MSA's, Seasonally Adjusted
Total Ads1
(Thousands)
M-O-M
Change
(Thousands)
The Conference Board - All rights reserved.
1. Total ads are all unduplicated ads appearing during the reference period. This
includes ads from the previous months that have been reposted as well as new ads.
2. Supply/Demand rate is the number of Unemployed persons divided by the number
of total ads and reflects the latest month for which unemployment data is available.
5
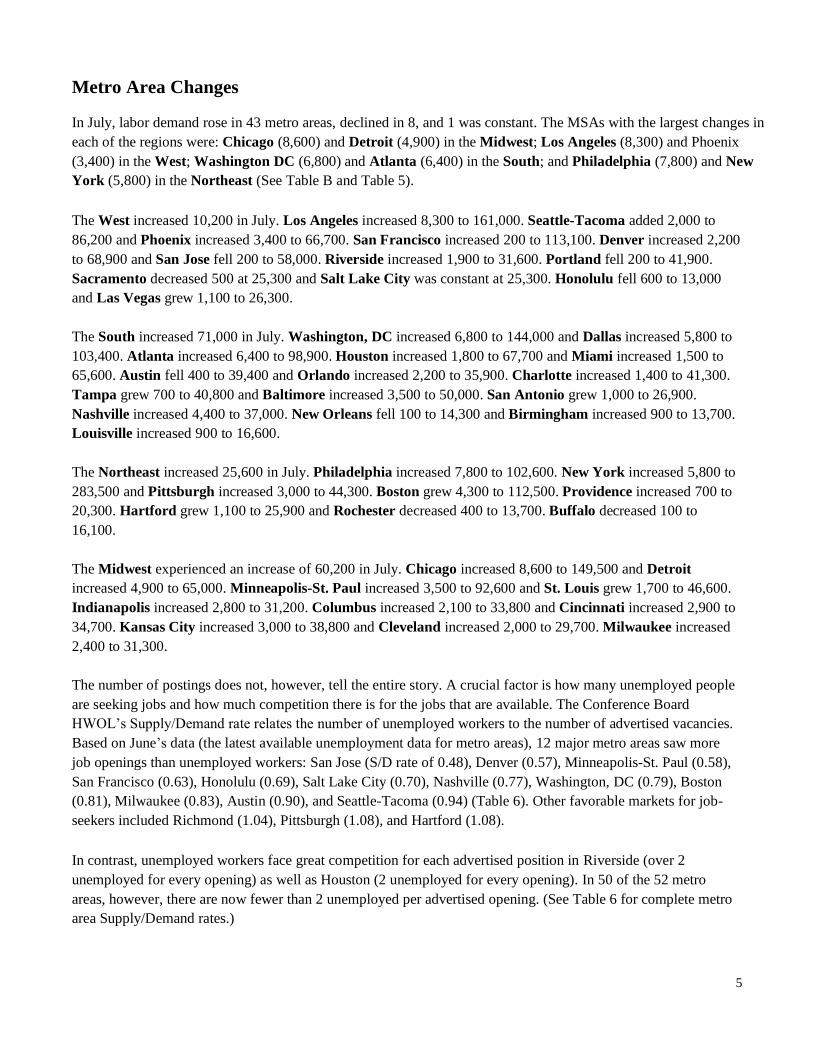
Metro Area Changes
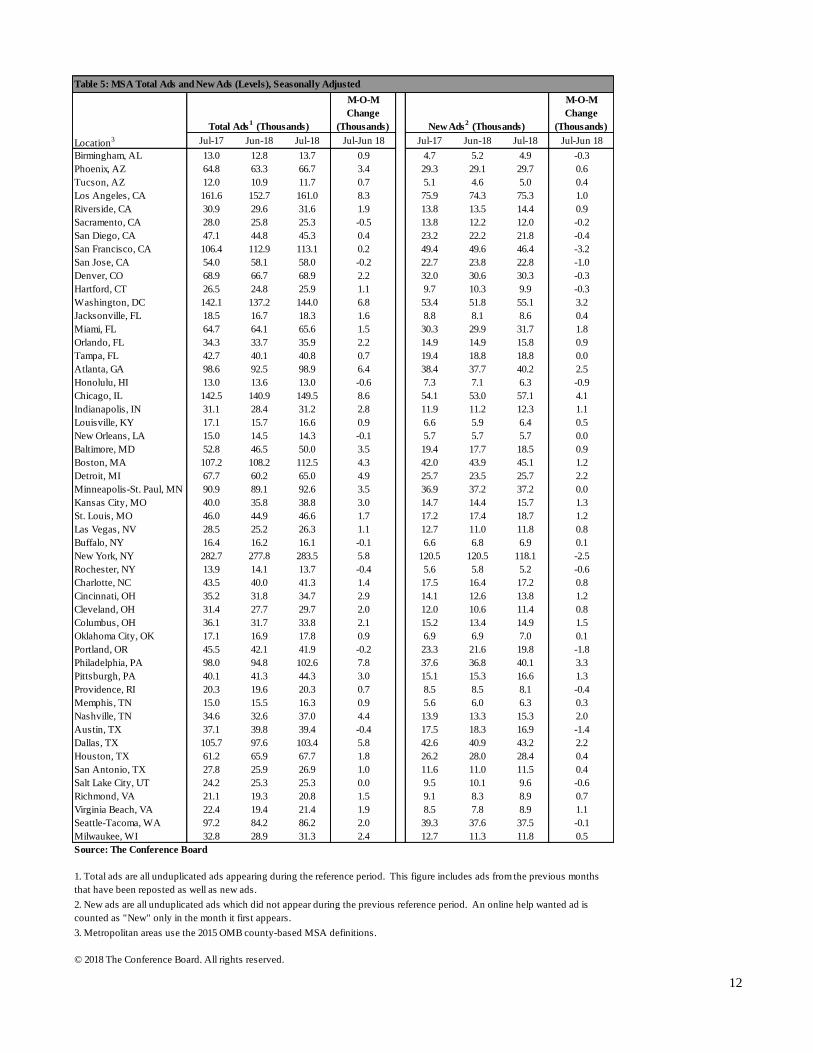
In July, labor demand rose in 43 metro areas, declined in 8, and 1 was constant. The MSAs with the largest changes in
each of the regions were: Chicago (8,600) and Detroit (4,900) in the Midwest; Los Angeles (8,300) and Phoenix
(3,400) in the West; Washington DC (6,800) and Atlanta (6,400) in the South; and Philadelphia (7,800) and New
York (5,800) in the Northeast (See Table B and Table 5).
The West increased 10,200 in July. Los Angeles increased 8,300 to 161,000. Seattle-Tacoma added 2,000 to
86,200 and Phoenix increased 3,400 to 66,700. San Francisco increased 200 to 113,100. Denver increased 2,200
to 68,900 and San Jose fell 200 to 58,000. Riverside increased 1,900 to 31,600. Portland fell 200 to 41,900.
Sacramento decreased 500 at 25,300 and Salt Lake City was constant at 25,300. Honolulu fell 600 to 13,000
and Las Vegas grew 1,100 to 26,300.
The South increased 71,000 in July. Washington, DC increased 6,800 to 144,000 and Dallas increased 5,800 to
103,400. Atlanta increased 6,400 to 98,900. Houston increased 1,800 to 67,700 and Miami increased 1,500 to
65,600. Austin fell 400 to 39,400 and Orlando increased 2,200 to 35,900. Charlotte increased 1,400 to 41,300.
Tampa grew 700 to 40,800 and Baltimore increased 3,500 to 50,000. San Antonio grew 1,000 to 26,900.
Nashville increased 4,400 to 37,000. New Orleans fell 100 to 14,300 and Birmingham increased 900 to 13,700.
Louisville increased 900 to 16,600.
The Northeast increased 25,600 in July. Philadelphia increased 7,800 to 102,600. New York increased 5,800 to
283,500 and Pittsburgh increased 3,000 to 44,300. Boston grew 4,300 to 112,500. Providence increased 700 to
20,300. Hartford grew 1,100 to 25,900 and Rochester decreased 400 to 13,700. Buffalo decreased 100 to
16,100.
The Midwest experienced an increase of 60,200 in July. Chicago increased 8,600 to 149,500 and Detroit
increased 4,900 to 65,000. Minneapolis-St. Paul increased 3,500 to 92,600 and St. Louis grew 1,700 to 46,600.
Indianapolis increased 2,800 to 31,200. Columbus increased 2,100 to 33,800 and Cincinnati increased 2,900 to
34,700. Kansas City increased 3,000 to 38,800 and Cleveland increased 2,000 to 29,700. Milwaukee increased
2,400 to 31,300.
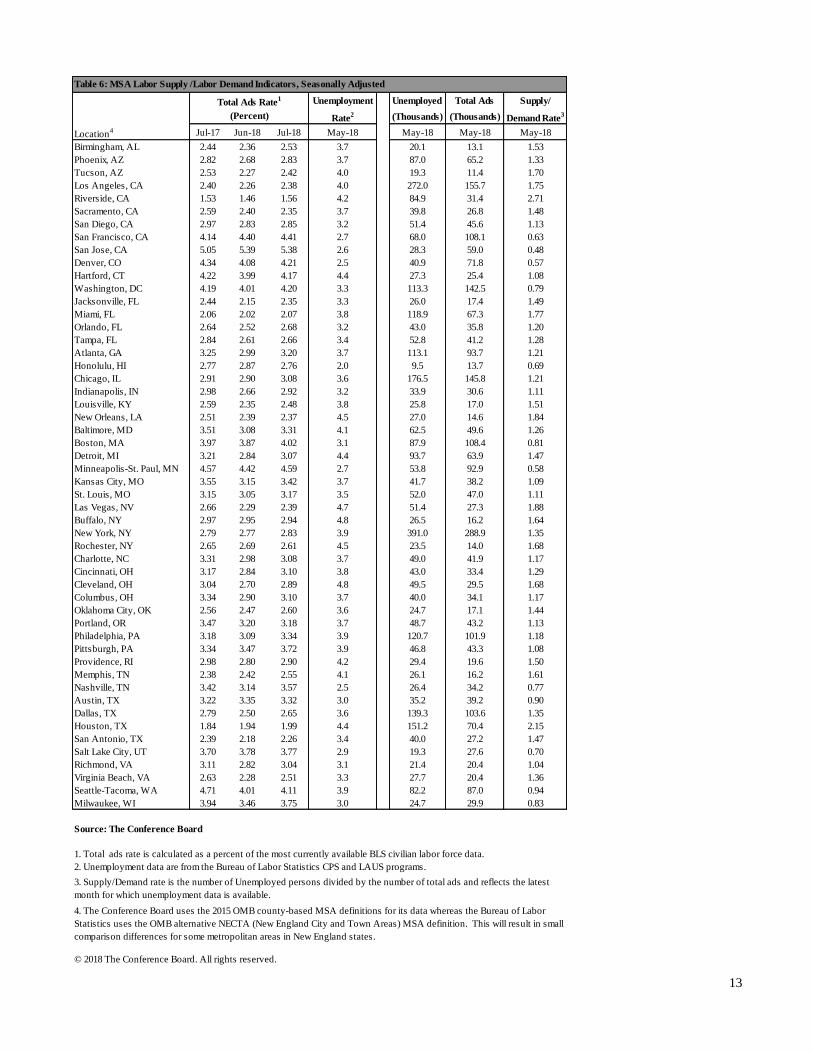
The number of postings does not, however, tell the entire story. A crucial factor is how many unemployed people
are seeking jobs and how much competition there is for the jobs that are available. The Conference Board
HWOL’s Supply/Demand rate relates the number of unemployed workers to the number of advertised vacancies.
Based on June’s data (the latest available unemployment data for metro areas), 12 major metro areas saw more
job openings than unemployed workers: San Jose (S/D rate of 0.48), Denver (0.57), Minneapolis-St. Paul (0.58),
San Francisco (0.63), Honolulu (0.69), Salt Lake City (0.70), Nashville (0.77), Washington, DC (0.79), Boston
(0.81), Milwaukee (0.83), Austin (0.90), and Seattle-Tacoma (0.94) (Table 6). Other favorable markets for job-
seekers included Richmond (1.04), Pittsburgh (1.08), and Hartford (1.08).
In contrast, unemployed workers face great competition for each advertised position in Riverside (over 2
unemployed for every opening) as well as Houston (2 unemployed for every opening). In 50 of the 52 metro
areas, however, there are now fewer than 2 unemployed per advertised opening. (See Table 6 for complete metro
area Supply/Demand rates.)
6
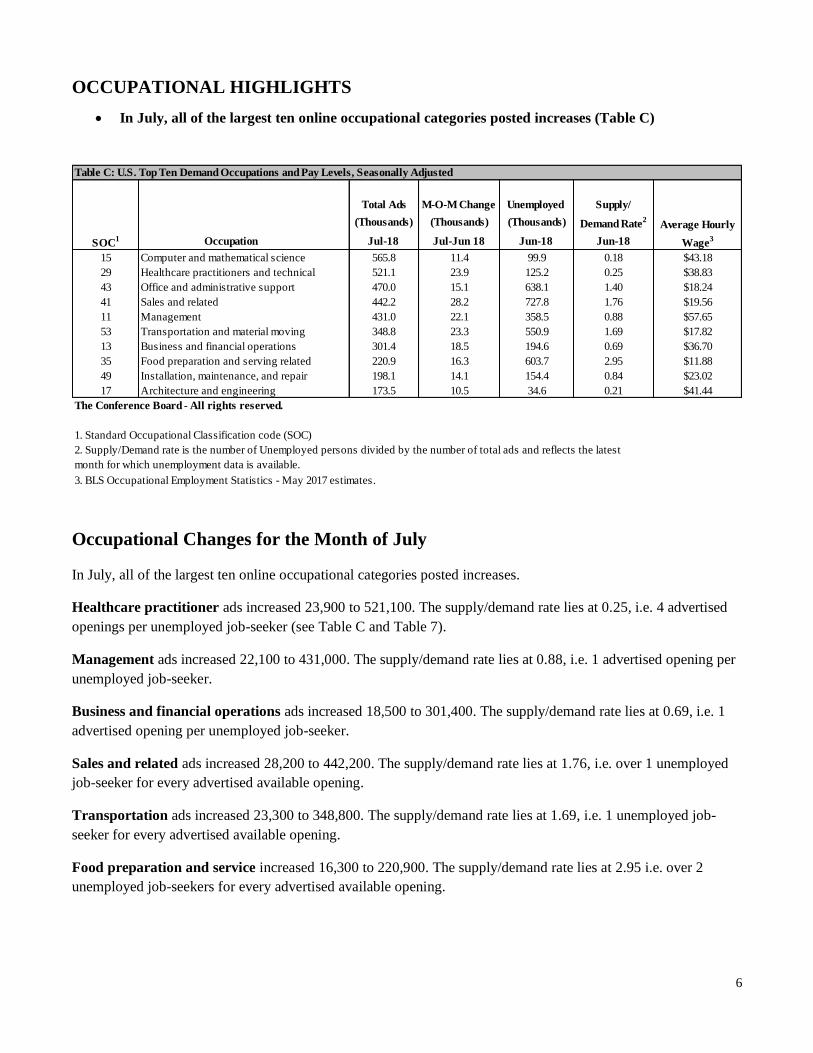
OCCUPATIONAL HIGHLIGHTS
• In July, all of the largest ten online occupational categories posted increases (Table C)
Total Ads M-O-M Change Unemployed Supply/
(Thousands) (Thousands) (Thousands) Demand Rate2
SOC1 Occupation Jul-18 Jul-Jun 18 Jun-18 Jun-18
15 Computer and mathematical science 565.8 11.4 99.9 0.18 $43.18
29 Healthcare practitioners and technical 521.1 23.9 125.2 0.25 $38.83
43 Office and administrative support 470.0 15.1 638.1 1.40 $18.24
41 Sales and related 442.2 28.2 727.8 1.76 $19.56
11 Management 431.0 22.1 358.5 0.88 $57.65
53 Transportation and material moving 348.8 23.3 550.9 1.69 $17.82
13 Business and financial operations 301.4 18.5 194.6 0.69 $36.70
35 Food preparation and serving related 220.9 16.3 603.7 2.95 $11.88
49 Installation, maintenance, and repair 198.1 14.1 154.4 0.84 $23.02
17 Architecture and engineering 173.5 10.5 34.6 0.21 $41.44
1. Standard Occupational Classification code (SOC)
3. BLS Occupational Employment Statistics - May 2017 estimates.
The Conference Board - All rights reserved.
2. Supply/Demand rate is the number of Unemployed persons divided by the number of total ads and reflects the latest
month for which unemployment data is available.
Average Hourly
Wage3
Table C: U.S. Top Ten Demand Occupations and Pay Levels, Seasonally Adjusted
Occupational Changes for the Month of July
In July, all of the largest ten online occupational categories posted increases.
Healthcare practitioner ads increased 23,900 to 521,100. The supply/demand rate lies at 0.25, i.e. 4 advertised
openings per unemployed job-seeker (see Table C and Table 7).
Management ads increased 22,100 to 431,000. The supply/demand rate lies at 0.88, i.e. 1 advertised opening per
unemployed job-seeker.
Business and financial operations ads increased 18,500 to 301,400. The supply/demand rate lies at 0.69, i.e. 1
advertised opening per unemployed job-seeker.
Sales and related ads increased 28,200 to 442,200. The supply/demand rate lies at 1.76, i.e. over 1 unemployed
job-seeker for every advertised available opening.
Transportation ads increased 23,300 to 348,800. The supply/demand rate lies at 1.69, i.e. 1 unemployed job-
seeker for every advertised available opening.
Food preparation and service increased 16,300 to 220,900. The supply/demand rate lies at 2.95 i.e. over 2
unemployed job-seekers for every advertised available opening.
7
PROGRAM NOTES
Special Note
Recently, the HWOL Data Series has experienced a declining trend in the number of online job ads that may not
reflect broader trends in the U.S. labor market. Based on changes in how job postings appear online, The
Conference Board is reviewing its HWOL methodology to ensure accuracy and alignment with market trends.
HWOL available on Haver Analytics
Over 3,000 of the key HWOL press release time series are exclusively available on Haver Analytics. The
available time series include the geographic and occupational series for levels and rates for both Total Ads and
New Ads. In addition to the seasonally adjusted series, many of the unadjusted series are also available. The
geographic detail includes: U.S., 9 Regions, 50 States, 52 MSAs (largest metro areas). The occupational detail
includes: U.S. (2-digit SOC), States (1-digit SOC) and MSAs (1-digit SOC).
For more information about the Help Wanted OnLine database delivered via Haver Analytics, please email
[email protected] or navigate to http://www.haver.com/contact.html. For HWOL data for detailed geographic
areas and occupations not in the press release, please contact [email protected].
__________________________________________________________________________
The Conference Board Help Wanted OnLine® Data Series (HWOL) measures the number of new, first-time
online jobs and jobs reposted from the previous month for over 16,000 Internet job boards, corporate boards and
smaller job sites that serve niche markets and smaller geographic areas.
Like The Conference Board’s long-running Help Wanted Advertising Index of print ads (which was published for
over 55 years and discontinued in July 2008), the HWOL series measures help wanted advertising, i.e. labor
demand. The HWOL data series began in May 2005. With the September 2008 release, HWOL began providing
seasonally adjusted data for the U.S., the nine Census regions and the 50 States. Seasonally adjusted data for
occupations were provided beginning with the May 2009 release, and seasonally adjusted data for the 52 largest
metropolitan areas began with the February 2012 release.
People using this data are urged to review the information on the database and methodology available on The
Conference Board website and contact us with questions and comments. Background information and technical
notes and discussion of revisions to the series are available at: http://www.conference-
board.org/data/helpwantedonline.cfm.
Additional information on the Bureau of Labor Statistics data used in this release can be found on the BLS
website, www.bls.gov.
The Conference Board
The Conference Board is a global, independent business membership and research association working in the
public interest. Our mission is unique: To provide the world’s leading organizations with the practical knowledge
they need to improve their performance and better serve society. The Conference Board is a non-advocacy, not-
for-profit entity holding 501 (c) (3) tax-exempt status in the United States.
8
WANTED Analytics, a CEB Company
WANTED is a leading supplier of real-time business intelligence solutions for the talent marketplace. Using
technology to gather data from corporate career sites and online job boards, WANTED builds products to help our
users make better human capital decisions faster. Users of our products include corporate human resources
departments, market analysts and employment services firms as well as the federal, state and local labor market
analysts that use HWOL. For more information, please visit: www.wantedanalytics.com.
HAVER ANALYTICS®
Haver Analytics is the premier provider of time series data for the Global Strategy and Research community.
Haver Analytics was founded in 1978 as a consulting firm and today provides the highest quality data and
software for industry professionals. Haver provides products and services to clients in financial services,
government, academia and various industry groups from consulting to manufacturing. From more information
please see: http://www.haver.com/contact.html.
Publication Schedule, Help Wanted OnLine Data Series
Data for the Month Release Date
August 2018 September 5, 2018
September 2018 October 3, 2018
October 2018 October 31, 2018
November 2018 December 5, 2018

9
Location3 Jul-17 Jun-18 Jul-18 Jul-Jun 18 Jul-17 Jun-18 Jul-18 Jul-Jun 18
United States 4,607.5 4,480.7 4,651.5 170.8 1,903.6 1,903.3 1,893.2 -10.1
New England 271.5 267.6 271.0 3.5 106.3 110.7 105.5 -5.3
Middle Atlantic 620.7 602.7 624.9 22.2 255.0 250.1 254.1 4.1
South Atlantic 891.2 856.0 898.4 42.3 363.9 353.1 371.0 17.9
East North Central 662.3 622.6 669.1 46.5 255.7 244.2 256.6 12.5
East South Central 192.5 193.1 207.8 14.6 72.4 77.6 76.0 -1.6
West North Central 371.5 358.6 372.3 13.7 139.0 142.6 139.8 -2.8
West South Central 412.4 413.4 427.3 13.9 168.3 173.0 171.0 -1.9
Mountain 371.3 362.3 369.2 7.0 161.4 160.4 153.5 -6.9
Pacific 780.4 757.5 760.8 3.3 362.4 357.0 343.4 -13.6
Source: The Conference Board
3. Regions are as defined by the U.S. Census Bureau.
Location2 Jul-17 Jun-18 Jul-18 Jul-17 Jun-18 Jul-18
United States 2.87 2.76 2.87 1.19 1.17 1.17
New England 3.43 3.33 3.38 1.34 1.38 1.31
Middle Atlantic 3.00 2.94 3.05 1.23 1.22 1.24
South Atlantic 2.82 2.68 2.81 1.15 1.10 1.16
East North Central 2.80 2.62 2.82 1.08 1.03 1.08
East South Central 2.21 2.20 2.37 0.83 0.88 0.87
West North Central 3.33 3.20 3.32 1.25 1.27 1.25
West South Central 2.19 2.16 2.23 0.89 0.90 0.89
Mountain 3.11 2.99 3.04 1.35 1.32 1.26
Pacific 2.98 2.88 2.90 1.38 1.36 1.31
Source: The Conference Board
2. Regions are as defined by the U.S. Census Bureau.
© 2018 The Conference Board. All rights reserved.
1. Ads rates are calculated as a percent of the most currently available BLS civilian labor force
data. Ads rates represent the number of ads per 100 participants in the civilian labor force.
1. Total ads are all unduplicated ads appearing during the reference period. This figure includes ads from the previous
months that have been reposted as well as new ads.
2. New ads are all unduplicated ads which did not appear during the previous reference period. An online help wanted ad is
counted as "New" only in the month it first appears.
Table 2: National/Regional Total Ads and New Ads Rates, Seasonally Adjusted
Total Ads Rate1
New Ads Rate1
Table 1: National/Regional Total Ads and New Ads (Levels), Seasonally Adjusted
Total Ads1
(Thousands) New Ads2
(Thousands)
(Percent) (Percent)
M-O-M
Change
(Thousands)
M-O-M
Change
(Thousands)
10
Location Jul-17 Jun-18 Jul-18 Jul-Jun 18 Jul-17 Jun-18 Jul-18 Jul-Jun 18
United States 4,607.5 4,480.7 4,651.5 170.8 1,903.6 1,903.3 1,893.2 -10.1
Alabama 47.5 49.0 51.5 2.5 17.5 19.3 17.9 -1.4
Alaska 13.6 13.3 13.2 0.0 5.7 6.1 5.7 -0.4
Arizona 91.9 89.3 92.4 3.2 40.3 40.3 40.3 0.0
Arkansas 26.7 28.2 29.1 0.9 10.1 11.4 10.0 -1.4
California 532.9 514.7 530.1 15.3 248.3 244.4 237.9 -6.5
Colorado 116.7 113.0 116.0 3.1 53.8 51.9 50.3 -1.6
Connecticut 65.9 62.4 61.6 -0.8 24.2 26.1 22.3 -3.7
Delaware 15.9 16.5 17.3 0.8 6.1 6.6 6.0 -0.5
Florida 240.0 232.4 238.9 6.6 110.6 109.2 111.2 1.9
Georgia 145.3 137.3 146.9 9.7 57.0 54.9 59.0 4.1
Hawaii 19.7 20.5 19.9 -0.6 10.1 10.5 9.3 -1.2
Idaho 22.1 21.7 21.8 0.1 9.8 9.5 8.9 -0.6
Illinois 178.2 178.6 189.1 10.5 67.4 67.7 72.1 4.3
Indiana 78.7 75.8 83.7 7.8 28.6 28.6 31.2 2.6
Iowa 56.0 54.1 57.1 3.0 20.1 20.3 20.6 0.3
Kansas 37.6 35.0 37.6 2.5 13.6 13.2 13.6 0.3
Kentucky 42.4 44.1 46.4 2.2 16.3 17.1 16.3 -0.8
Louisiana 39.8 38.8 40.8 1.9 15.2 15.0 15.4 0.3
Maine 17.2 17.2 17.0 -0.2 6.9 7.3 6.6 -0.7
Maryland 98.3 87.0 94.1 7.2 35.8 31.8 34.1 2.3
Massachusetts 139.7 139.8 144.0 4.2 54.5 57.1 57.1 0.1
Michigan 137.9 127.0 136.2 9.2 54.3 50.6 53.6 3.0
Minnesota 129.5 128.0 130.8 2.9 51.2 51.7 50.3 -1.4
Mississippi 25.2 25.4 27.6 2.3 8.7 9.9 9.4 -0.5
Missouri 93.0 83.7 87.4 3.7 34.0 34.4 35.5 1.1
Montana 19.4 18.0 17.4 -0.6 8.1 7.9 6.5 -1.4
Nebraska 28.1 28.3 29.2 0.8 10.9 11.3 10.8 -0.6
Nevada 44.6 40.5 41.5 1.0 19.6 18.3 18.3 0.0
New Hampshire 23.7 21.6 22.1 0.5 9.8 8.9 8.6 -0.3
New Jersey 149.2 136.9 147.0 10.1 61.7 57.0 61.0 4.1
New Mexico 23.9 24.6 24.4 -0.2 9.4 10.3 9.0 -1.4
New York 276.0 275.0 273.2 -1.8 119.1 120.0 113.2 -6.9
North Carolina 131.5 127.5 134.6 7.1 53.8 52.6 54.9 2.3
North Dakota 15.8 16.2 16.8 0.6 6.3 6.4 6.1 -0.3
Ohio 165.3 148.3 157.5 9.1 66.0 59.8 62.8 3.0
Oklahoma 37.9 38.0 39.9 2.0 15.0 15.3 15.3 0.1
Oregon 70.6 69.2 68.4 -0.8 36.8 36.3 32.9 -3.4
Pennsylvania 197.1 188.0 206.4 18.4 73.9 72.3 79.6 7.3
Rhode Island 15.3 14.9 15.8 0.8 6.6 6.6 6.3 -0.4
South Carolina 59.7 54.6 60.1 5.5 23.7 22.0 25.3 3.3
South Dakota 11.7 13.1 13.8 0.7 4.6 5.0 4.7 -0.3
Tennessee 78.0 74.9 82.9 8.0 30.3 31.2 32.7 1.5
Texas 307.7 308.3 317.2 8.9 127.8 131.8 130.1 -1.7
Utah 45.4 46.9 48.0 1.1 17.6 18.5 17.7 -0.8
Vermont 10.5 11.1 11.7 0.7 4.6 4.9 4.9 0.0
Virginia 146.4 138.1 147.5 9.4 55.0 50.5 55.2 4.8
Washington 144.6 128.8 130.5 1.7 60.8 58.8 57.2 -1.7
West Virginia 18.3 18.2 20.1 1.9 6.8 6.9 7.0 0.2
Wisconsin 102.2 96.4 102.5 6.1 40.1 37.9 37.7 -0.1
Wyoming 8.1 8.2 8.7 0.5 3.0 3.2 3.0 -0.2
Source: The Conference Board
© 2018 The Conference Board. All rights reserved.
2. New ads are all unduplicated ads which did not appear during the previous reference period. An online help wanted
ad is counted as "New" only in the month it first appears.
M-O-M
Change
(Thousands)
1. Total ads are all unduplicated ads appearing during the reference period. This figure includes ads from the previous
months that have been reposted as well as new ads.
Table 3: State Total Ads and New Ads (Levels), Seasonally Adjusted
Total Ads1
(Thousands)
M-O-M
Change
(Thousands) New Ads2
(Thousands)
11
Unemployment Unemployed Total Ads Supply/
Rate2 (Thousands) (Thousands) Demand Rate
3
Location Jul-17 Jun-18 Jul-18 Jun-18 Jun-18 Jun-18 Jun-18
United States 2.87 2.76 2.87 4.0 6,564.00 4,480.7 1.46
Alabama 2.19 2.24 2.36 4.1 89.35 49.0 1.82
Alaska 3.74 3.68 3.66 7.1 25.70 13.3 1.94
Arizona 2.77 2.65 2.74 4.7 157.06 89.3 1.76
Arkansas 1.97 2.09 2.16 3.8 50.85 28.2 1.80
California 2.76 2.66 2.74 4.2 814.06 514.7 1.58
Colorado 3.89 3.67 3.77 2.7 84.08 113.0 0.74
Connecticut 3.44 3.29 3.25 4.4 83.98 62.4 1.35
Delaware 3.33 3.41 3.57 3.9 19.03 16.5 1.15
Florida 2.37 2.27 2.33 3.8 386.74 232.4 1.66
Georgia 2.87 2.66 2.85 4.1 210.61 137.3 1.53
Hawaii 2.88 2.98 2.89 2.1 14.16 20.5 0.69
Idaho 2.65 2.54 2.56 2.9 24.52 21.7 1.13
Illinois 2.75 2.75 2.91 4.3 275.75 178.6 1.54
Indiana 2.37 2.25 2.49 3.3 112.25 75.8 1.48
Iowa 3.33 3.22 3.40 2.7 44.91 54.1 0.83
Kansas 2.54 2.37 2.54 3.4 49.85 35.0 1.42
Kentucky 2.06 2.14 2.25 4.2 86.97 44.1 1.97
Louisiana 1.89 1.82 1.91 4.7 101.38 38.8 2.61
Maine 2.46 2.44 2.41 2.9 20.39 17.2 1.19
Maryland 3.05 2.69 2.91 4.3 138.58 87.0 1.59
Massachusetts 3.82 3.72 3.83 3.5 133.41 139.8 0.95
Michigan 2.82 2.59 2.77 4.5 218.54 127.0 1.72
Minnesota 4.22 4.11 4.20 3.1 95.33 128.0 0.74
Mississippi 1.97 1.98 2.16 4.7 60.62 25.4 2.39
Missouri 3.05 2.74 2.86 3.5 106.31 83.7 1.27
Montana 3.68 3.44 3.32 3.8 19.91 18.0 1.11
Nebraska 2.80 2.80 2.88 2.9 28.94 28.3 1.02
Nevada 3.05 2.71 2.78 4.7 70.00 40.5 1.73
New Hampshire 3.17 2.85 2.92 2.7 20.18 21.6 0.94
New Jersey 3.30 3.06 3.28 4.3 191.74 136.9 1.40
New Mexico 2.57 2.62 2.60 4.9 46.04 24.6 1.87
New York 2.84 2.84 2.83 4.5 430.47 275.0 1.57
North Carolina 2.66 2.55 2.69 4.2 209.55 127.5 1.64
North Dakota 3.80 3.94 4.10 2.6 10.64 16.2 0.66
Ohio 2.85 2.56 2.72 4.5 259.38 148.3 1.75
Oklahoma 2.07 2.04 2.15 3.9 72.16 38.0 1.90
Oregon 3.35 3.26 3.23 4.0 84.77 69.2 1.23
Pennsylvania 3.07 2.95 3.24 4.3 275.24 188.0 1.46
Rhode Island 2.77 2.67 2.82 4.3 24.00 14.9 1.61
South Carolina 2.58 2.36 2.60 3.8 87.08 54.6 1.59
South Dakota 2.56 2.85 3.00 3.2 14.83 13.1 1.13
Tennessee 2.44 2.31 2.55 3.5 113.69 74.9 1.52
Texas 2.27 2.23 2.30 4.0 557.78 308.3 1.81
Utah 2.90 2.95 3.02 3.0 48.39 46.9 1.03
Vermont 3.06 3.17 3.36 2.8 9.77 11.1 0.88
Virginia 3.39 3.18 3.39 3.2 137.73 138.1 1.00
Washington 3.87 3.43 3.47 4.7 176.84 128.8 1.37
West Virginia 2.35 2.32 2.57 5.3 41.98 18.2 2.30
Wisconsin 3.24 3.03 3.22 2.9 91.00 96.4 0.94
Wyoming 2.76 2.86 3.03 3.7 10.79 8.2 1.31
Source: The Conference Board
© 2018 The Conference Board. All rights reserved.
3. Supply/Demand rate is the number of Unemployed persons divided by the number of total ads and reflects the
latest month for which unemployment data is available.
2. Unemployment data are from the Bureau of Labor Statistics Current Population Statistics and Local Area
Unemployment Statistics programs.
Table 4: State Labor Supply/Labor Demand Indicators, Seasonally Adjusted
Total Ads Rate1
(Percent)
1. Total ads rate is calculated as a percent of the most currently available BLS civilian labor force data. Ad rates
represent the number of ads per 100 persons in the civilian labor force.
12
Location3 Jul-17 Jun-18 Jul-18 Jul-Jun 18 Jul-17 Jun-18 Jul-18 Jul-Jun 18
Birmingham, AL 13.0 12.8 13.7 0.9 4.7 5.2 4.9 -0.3
Phoenix, AZ 64.8 63.3 66.7 3.4 29.3 29.1 29.7 0.6
Tucson, AZ 12.0 10.9 11.7 0.7 5.1 4.6 5.0 0.4
Los Angeles, CA 161.6 152.7 161.0 8.3 75.9 74.3 75.3 1.0
Riverside, CA 30.9 29.6 31.6 1.9 13.8 13.5 14.4 0.9
Sacramento, CA 28.0 25.8 25.3 -0.5 13.8 12.2 12.0 -0.2
San Diego, CA 47.1 44.8 45.3 0.4 23.2 22.2 21.8 -0.4
San Francisco, CA 106.4 112.9 113.1 0.2 49.4 49.6 46.4 -3.2
San Jose, CA 54.0 58.1 58.0 -0.2 22.7 23.8 22.8 -1.0
Denver, CO 68.9 66.7 68.9 2.2 32.0 30.6 30.3 -0.3
Hartford, CT 26.5 24.8 25.9 1.1 9.7 10.3 9.9 -0.3
Washington, DC 142.1 137.2 144.0 6.8 53.4 51.8 55.1 3.2
Jacksonville, FL 18.5 16.7 18.3 1.6 8.8 8.1 8.6 0.4
Miami, FL 64.7 64.1 65.6 1.5 30.3 29.9 31.7 1.8
Orlando, FL 34.3 33.7 35.9 2.2 14.9 14.9 15.8 0.9
Tampa, FL 42.7 40.1 40.8 0.7 19.4 18.8 18.8 0.0
Atlanta, GA 98.6 92.5 98.9 6.4 38.4 37.7 40.2 2.5
Honolulu, HI 13.0 13.6 13.0 -0.6 7.3 7.1 6.3 -0.9
Chicago, IL 142.5 140.9 149.5 8.6 54.1 53.0 57.1 4.1
Indianapolis, IN 31.1 28.4 31.2 2.8 11.9 11.2 12.3 1.1
Louisville, KY 17.1 15.7 16.6 0.9 6.6 5.9 6.4 0.5
New Orleans, LA 15.0 14.5 14.3 -0.1 5.7 5.7 5.7 0.0
Baltimore, MD 52.8 46.5 50.0 3.5 19.4 17.7 18.5 0.9
Boston, MA 107.2 108.2 112.5 4.3 42.0 43.9 45.1 1.2
Detroit, MI 67.7 60.2 65.0 4.9 25.7 23.5 25.7 2.2
Minneapolis-St. Paul, MN 90.9 89.1 92.6 3.5 36.9 37.2 37.2 0.0
Kansas City, MO 40.0 35.8 38.8 3.0 14.7 14.4 15.7 1.3
St. Louis, MO 46.0 44.9 46.6 1.7 17.2 17.4 18.7 1.2
Las Vegas, NV 28.5 25.2 26.3 1.1 12.7 11.0 11.8 0.8
Buffalo, NY 16.4 16.2 16.1 -0.1 6.6 6.8 6.9 0.1
New York, NY 282.7 277.8 283.5 5.8 120.5 120.5 118.1 -2.5
Rochester, NY 13.9 14.1 13.7 -0.4 5.6 5.8 5.2 -0.6
Charlotte, NC 43.5 40.0 41.3 1.4 17.5 16.4 17.2 0.8
Cincinnati, OH 35.2 31.8 34.7 2.9 14.1 12.6 13.8 1.2
Cleveland, OH 31.4 27.7 29.7 2.0 12.0 10.6 11.4 0.8
Columbus, OH 36.1 31.7 33.8 2.1 15.2 13.4 14.9 1.5
Oklahoma City, OK 17.1 16.9 17.8 0.9 6.9 6.9 7.0 0.1
Portland, OR 45.5 42.1 41.9 -0.2 23.3 21.6 19.8 -1.8
Philadelphia, PA 98.0 94.8 102.6 7.8 37.6 36.8 40.1 3.3
Pittsburgh, PA 40.1 41.3 44.3 3.0 15.1 15.3 16.6 1.3
Providence, RI 20.3 19.6 20.3 0.7 8.5 8.5 8.1 -0.4
Memphis, TN 15.0 15.5 16.3 0.9 5.6 6.0 6.3 0.3
Nashville, TN 34.6 32.6 37.0 4.4 13.9 13.3 15.3 2.0
Austin, TX 37.1 39.8 39.4 -0.4 17.5 18.3 16.9 -1.4
Dallas, TX 105.7 97.6 103.4 5.8 42.6 40.9 43.2 2.2
Houston, TX 61.2 65.9 67.7 1.8 26.2 28.0 28.4 0.4
San Antonio, TX 27.8 25.9 26.9 1.0 11.6 11.0 11.5 0.4
Salt Lake City, UT 24.2 25.3 25.3 0.0 9.5 10.1 9.6 -0.6
Richmond, VA 21.1 19.3 20.8 1.5 9.1 8.3 8.9 0.7
Virginia Beach, VA 22.4 19.4 21.4 1.9 8.5 7.8 8.9 1.1
Seattle-Tacoma, WA 97.2 84.2 86.2 2.0 39.3 37.6 37.5 -0.1
Milwaukee, WI 32.8 28.9 31.3 2.4 12.7 11.3 11.8 0.5
Source: The Conference Board
3. Metropolitan areas use the 2015 OMB county-based MSA definitions.
© 2018 The Conference Board. All rights reserved.
2. New ads are all unduplicated ads which did not appear during the previous reference period. An online help wanted ad is
counted as "New" only in the month it first appears.
Table 5: MSA Total Ads and New Ads (Levels), Seasonally Adjusted
Total Ads1
(Thousands)
M-O-M
Change
(Thousands) New Ads2
(Thousands)
M-O-M
Change
(Thousands)
1. Total ads are all unduplicated ads appearing during the reference period. This figure includes ads from the previous months
that have been reposted as well as new ads.
13
Unemployment Unemployed Total Ads Supply/
Rate2 (Thousands) (Thousands) Demand Rate
3
Location4 Jul-17 Jun-18 Jul-18 May-18 May-18 May-18 May-18
Birmingham, AL 2.44 2.36 2.53 3.7 20.1 13.1 1.53
Phoenix, AZ 2.82 2.68 2.83 3.7 87.0 65.2 1.33
Tucson, AZ 2.53 2.27 2.42 4.0 19.3 11.4 1.70
Los Angeles, CA 2.40 2.26 2.38 4.0 272.0 155.7 1.75
Riverside, CA 1.53 1.46 1.56 4.2 84.9 31.4 2.71
Sacramento, CA 2.59 2.40 2.35 3.7 39.8 26.8 1.48
San Diego, CA 2.97 2.83 2.85 3.2 51.4 45.6 1.13
San Francisco, CA 4.14 4.40 4.41 2.7 68.0 108.1 0.63
San Jose, CA 5.05 5.39 5.38 2.6 28.3 59.0 0.48
Denver, CO 4.34 4.08 4.21 2.5 40.9 71.8 0.57
Hartford, CT 4.22 3.99 4.17 4.4 27.3 25.4 1.08
Washington, DC 4.19 4.01 4.20 3.3 113.3 142.5 0.79
Jacksonville, FL 2.44 2.15 2.35 3.3 26.0 17.4 1.49
Miami, FL 2.06 2.02 2.07 3.8 118.9 67.3 1.77
Orlando, FL 2.64 2.52 2.68 3.2 43.0 35.8 1.20
Tampa, FL 2.84 2.61 2.66 3.4 52.8 41.2 1.28
Atlanta, GA 3.25 2.99 3.20 3.7 113.1 93.7 1.21
Honolulu, HI 2.77 2.87 2.76 2.0 9.5 13.7 0.69
Chicago, IL 2.91 2.90 3.08 3.6 176.5 145.8 1.21
Indianapolis, IN 2.98 2.66 2.92 3.2 33.9 30.6 1.11
Louisville, KY 2.59 2.35 2.48 3.8 25.8 17.0 1.51
New Orleans, LA 2.51 2.39 2.37 4.5 27.0 14.6 1.84
Baltimore, MD 3.51 3.08 3.31 4.1 62.5 49.6 1.26
Boston, MA 3.97 3.87 4.02 3.1 87.9 108.4 0.81
Detroit, MI 3.21 2.84 3.07 4.4 93.7 63.9 1.47
Minneapolis-St. Paul, MN 4.57 4.42 4.59 2.7 53.8 92.9 0.58
Kansas City, MO 3.55 3.15 3.42 3.7 41.7 38.2 1.09
St. Louis, MO 3.15 3.05 3.17 3.5 52.0 47.0 1.11
Las Vegas, NV 2.66 2.29 2.39 4.7 51.4 27.3 1.88
Buffalo, NY 2.97 2.95 2.94 4.8 26.5 16.2 1.64
New York, NY 2.79 2.77 2.83 3.9 391.0 288.9 1.35
Rochester, NY 2.65 2.69 2.61 4.5 23.5 14.0 1.68
Charlotte, NC 3.31 2.98 3.08 3.7 49.0 41.9 1.17
Cincinnati, OH 3.17 2.84 3.10 3.8 43.0 33.4 1.29
Cleveland, OH 3.04 2.70 2.89 4.8 49.5 29.5 1.68
Columbus, OH 3.34 2.90 3.10 3.7 40.0 34.1 1.17
Oklahoma City, OK 2.56 2.47 2.60 3.6 24.7 17.1 1.44
Portland, OR 3.47 3.20 3.18 3.7 48.7 43.2 1.13
Philadelphia, PA 3.18 3.09 3.34 3.9 120.7 101.9 1.18
Pittsburgh, PA 3.34 3.47 3.72 3.9 46.8 43.3 1.08
Providence, RI 2.98 2.80 2.90 4.2 29.4 19.6 1.50
Memphis, TN 2.38 2.42 2.55 4.1 26.1 16.2 1.61
Nashville, TN 3.42 3.14 3.57 2.5 26.4 34.2 0.77
Austin, TX 3.22 3.35 3.32 3.0 35.2 39.2 0.90
Dallas, TX 2.79 2.50 2.65 3.6 139.3 103.6 1.35
Houston, TX 1.84 1.94 1.99 4.4 151.2 70.4 2.15
San Antonio, TX 2.39 2.18 2.26 3.4 40.0 27.2 1.47
Salt Lake City, UT 3.70 3.78 3.77 2.9 19.3 27.6 0.70
Richmond, VA 3.11 2.82 3.04 3.1 21.4 20.4 1.04
Virginia Beach, VA 2.63 2.28 2.51 3.3 27.7 20.4 1.36
Seattle-Tacoma, WA 4.71 4.01 4.11 3.9 82.2 87.0 0.94
Milwaukee, WI 3.94 3.46 3.75 3.0 24.7 29.9 0.83
Source: The Conference Board
2. Unemployment data are from the Bureau of Labor Statistics CPS and LAUS programs.
© 2018 The Conference Board. All rights reserved.
1. Total ads rate is calculated as a percent of the most currently available BLS civilian labor force data.
3. Supply/Demand rate is the number of Unemployed persons divided by the number of total ads and reflects the latest
month for which unemployment data is available.
4. The Conference Board uses the 2015 OMB county-based MSA definitions for its data whereas the Bureau of Labor
Statistics uses the OMB alternative NECTA (New England City and Town Areas) MSA definition. This will result in small
comparison differences for some metropolitan areas in New England states.
Table 6: MSA Labor Supply /Labor Demand Indicators, Seasonally Adjusted
Total Ads Rate1
(Percent)
14
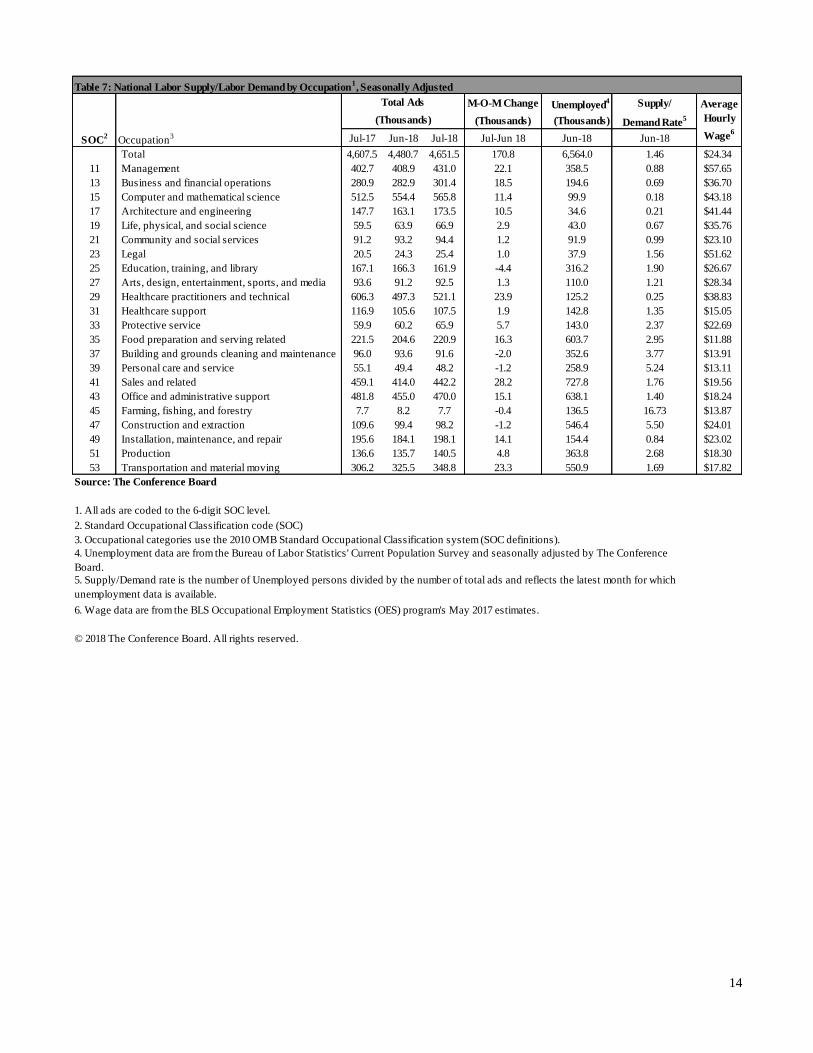
M-O-M Change Unemployed4 Supply/
(Thousands) (Thousands) Demand Rate5
SOC2
Occupation3 Jul-17 Jun-18 Jul-18 Jul-Jun 18 Jun-18 Jun-18
Total 4,607.5 4,480.7 4,651.5 170.8 6,564.0 1.46 $24.34
11 Management 402.7 408.9 431.0 22.1 358.5 0.88 $57.65
13 Business and financial operations 280.9 282.9 301.4 18.5 194.6 0.69 $36.70
15 Computer and mathematical science 512.5 554.4 565.8 11.4 99.9 0.18 $43.18
17 Architecture and engineering 147.7 163.1 173.5 10.5 34.6 0.21 $41.44
19 Life, physical, and social science 59.5 63.9 66.9 2.9 43.0 0.67 $35.76
21 Community and social services 91.2 93.2 94.4 1.2 91.9 0.99 $23.10
23 Legal 20.5 24.3 25.4 1.0 37.9 1.56 $51.62
25 Education, training, and library 167.1 166.3 161.9 -4.4 316.2 1.90 $26.67
27 Arts, design, entertainment, sports, and media 93.6 91.2 92.5 1.3 110.0 1.21 $28.34
29 Healthcare practitioners and technical 606.3 497.3 521.1 23.9 125.2 0.25 $38.83
31 Healthcare support 116.9 105.6 107.5 1.9 142.8 1.35 $15.05
33 Protective service 59.9 60.2 65.9 5.7 143.0 2.37 $22.69
35 Food preparation and serving related 221.5 204.6 220.9 16.3 603.7 2.95 $11.88
37 Building and grounds cleaning and maintenance 96.0 93.6 91.6 -2.0 352.6 3.77 $13.91
39 Personal care and service 55.1 49.4 48.2 -1.2 258.9 5.24 $13.11
41 Sales and related 459.1 414.0 442.2 28.2 727.8 1.76 $19.56
43 Office and administrative support 481.8 455.0 470.0 15.1 638.1 1.40 $18.24
45 Farming, fishing, and forestry 7.7 8.2 7.7 -0.4 136.5 16.73 $13.87
47 Construction and extraction 109.6 99.4 98.2 -1.2 546.4 5.50 $24.01
49 Installation, maintenance, and repair 195.6 184.1 198.1 14.1 154.4 0.84 $23.02
51 Production 136.6 135.7 140.5 4.8 363.8 2.68 $18.30
53 Transportation and material moving 306.2 325.5 348.8 23.3 550.9 1.69 $17.82
Source: The Conference Board
2. Standard Occupational Classification code (SOC)
© 2018 The Conference Board. All rights reserved.
Table 7: National Labor Supply/Labor Demand by Occupation1, Seasonally Adjusted
4. Unemployment data are from the Bureau of Labor Statistics' Current Population Survey and seasonally adjusted by The Conference
Board.
5. Supply/Demand rate is the number of Unemployed persons divided by the number of total ads and reflects the latest month for which
unemployment data is available.
6. Wage data are from the BLS Occupational Employment Statistics (OES) program's May 2017 estimates.
Total Ads Average
Hourly
Wage6
(Thousands)
1. All ads are coded to the 6-digit SOC level.
3. Occupational categories use the 2010 OMB Standard Occupational Classification system (SOC definitions).
15
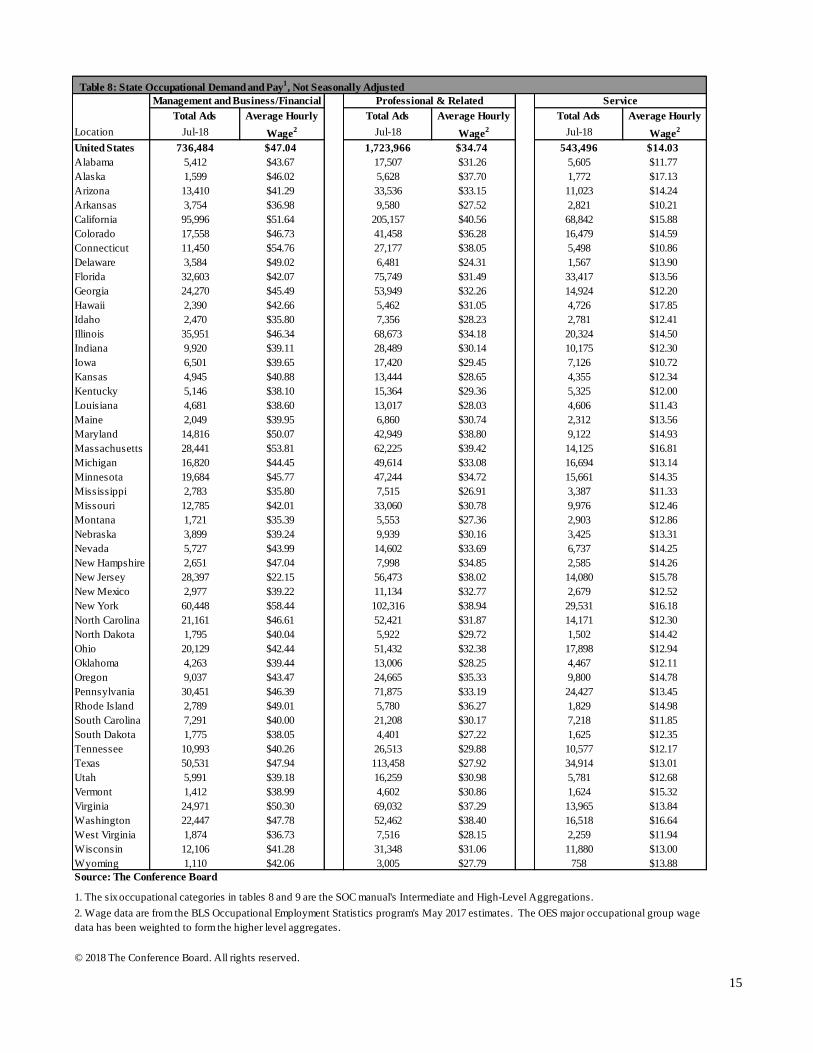
Total Ads Total Ads Total Ads
Location Jul-18 Jul-18 Jul-18
United States 736,484 $47.04 1,723,966 $34.74 543,496 $14.03
Alabama 5,412 $43.67 17,507 $31.26 5,605 $11.77
Alaska 1,599 $46.02 5,628 $37.70 1,772 $17.13
Arizona 13,410 $41.29 33,536 $33.15 11,023 $14.24
Arkansas 3,754 $36.98 9,580 $27.52 2,821 $10.21
California 95,996 $51.64 205,157 $40.56 68,842 $15.88
Colorado 17,558 $46.73 41,458 $36.28 16,479 $14.59
Connecticut 11,450 $54.76 27,177 $38.05 5,498 $10.86
Delaware 3,584 $49.02 6,481 $24.31 1,567 $13.90
Florida 32,603 $42.07 75,749 $31.49 33,417 $13.56
Georgia 24,270 $45.49 53,949 $32.26 14,924 $12.20
Hawaii 2,390 $42.66 5,462 $31.05 4,726 $17.85
Idaho 2,470 $35.80 7,356 $28.23 2,781 $12.41
Illinois 35,951 $46.34 68,673 $34.18 20,324 $14.50
Indiana 9,920 $39.11 28,489 $30.14 10,175 $12.30
Iowa 6,501 $39.65 17,420 $29.45 7,126 $10.72
Kansas 4,945 $40.88 13,444 $28.65 4,355 $12.34
Kentucky 5,146 $38.10 15,364 $29.36 5,325 $12.00
Louisiana 4,681 $38.60 13,017 $28.03 4,606 $11.43
Maine 2,049 $39.95 6,860 $30.74 2,312 $13.56
Maryland 14,816 $50.07 42,949 $38.80 9,122 $14.93
Massachusetts 28,441 $53.81 62,225 $39.42 14,125 $16.81
Michigan 16,820 $44.45 49,614 $33.08 16,694 $13.14
Minnesota 19,684 $45.77 47,244 $34.72 15,661 $14.35
Mississippi 2,783 $35.80 7,515 $26.91 3,387 $11.33
Missouri 12,785 $42.01 33,060 $30.78 9,976 $12.46
Montana 1,721 $35.39 5,553 $27.36 2,903 $12.86
Nebraska 3,899 $39.24 9,939 $30.16 3,425 $13.31
Nevada 5,727 $43.99 14,602 $33.69 6,737 $14.25
New Hampshire 2,651 $47.04 7,998 $34.85 2,585 $14.26
New Jersey 28,397 $22.15 56,473 $38.02 14,080 $15.78
New Mexico 2,977 $39.22 11,134 $32.77 2,679 $12.52
New York 60,448 $58.44 102,316 $38.94 29,531 $16.18
North Carolina 21,161 $46.61 52,421 $31.87 14,171 $12.30
North Dakota 1,795 $40.04 5,922 $29.72 1,502 $14.42
Ohio 20,129 $42.44 51,432 $32.38 17,898 $12.94
Oklahoma 4,263 $39.44 13,006 $28.25 4,467 $12.11
Oregon 9,037 $43.47 24,665 $35.33 9,800 $14.78
Pennsylvania 30,451 $46.39 71,875 $33.19 24,427 $13.45
Rhode Island 2,789 $49.01 5,780 $36.27 1,829 $14.98
South Carolina 7,291 $40.00 21,208 $30.17 7,218 $11.85
South Dakota 1,775 $38.05 4,401 $27.22 1,625 $12.35
Tennessee 10,993 $40.26 26,513 $29.88 10,577 $12.17
Texas 50,531 $47.94 113,458 $27.92 34,914 $13.01
Utah 5,991 $39.18 16,259 $30.98 5,781 $12.68
Vermont 1,412 $38.99 4,602 $30.86 1,624 $15.32
Virginia 24,971 $50.30 69,032 $37.29 13,965 $13.84
Washington 22,447 $47.78 52,462 $38.40 16,518 $16.64
West Virginia 1,874 $36.73 7,516 $28.15 2,259 $11.94
Wisconsin 12,106 $41.28 31,348 $31.06 11,880 $13.00
Wyoming 1,110 $42.06 3,005 $27.79 758 $13.88
Average Hourly
Wage2
Average Hourly
Wage2
Average Hourly
Wage2
2. Wage data are from the BLS Occupational Employment Statistics program's May 2017 estimates. The OES major occupational group wage
data has been weighted to form the higher level aggregates.
© 2018 The Conference Board. All rights reserved.
Source: The Conference Board
Table 8: State Occupational Demand and Pay1, Not Seasonally Adjusted
1. The six occupational categories in tables 8 and 9 are the SOC manual's Intermediate and High-Level Aggregations.
Management and Business/Financial Professional & Related Service
16
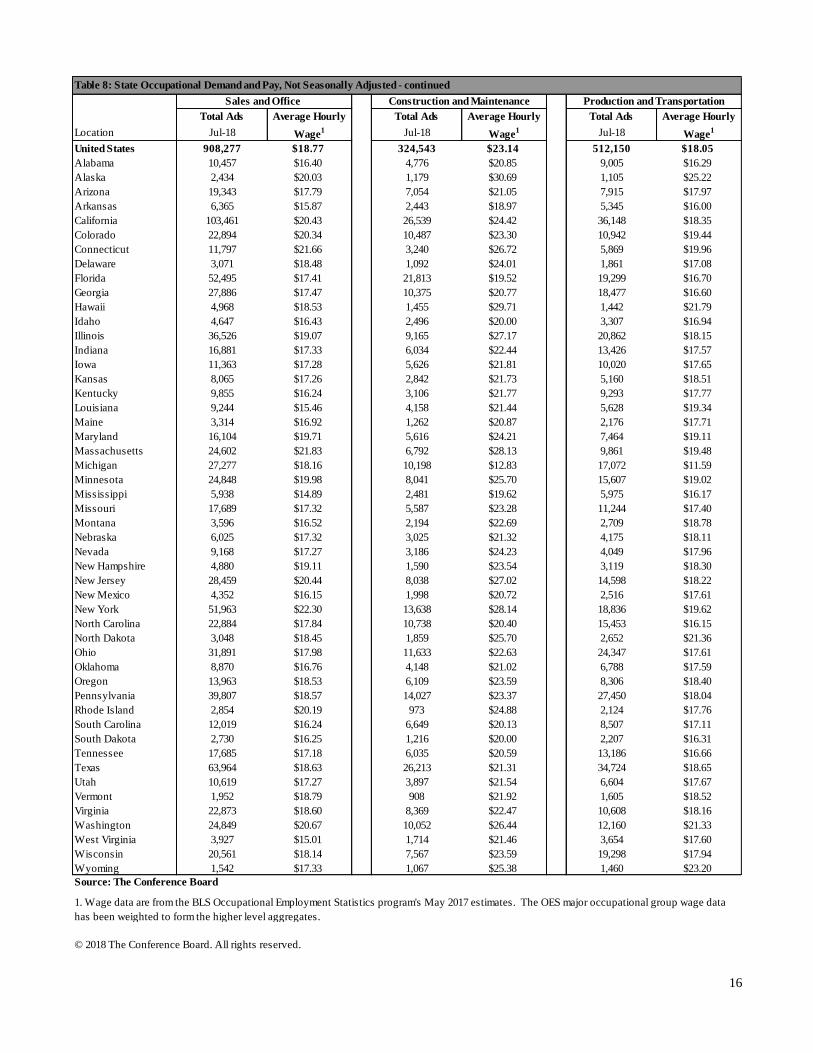
Total Ads Total Ads Total Ads
Location Jul-18 Jul-18 Jul-18
United States 908,277 $18.77 324,543 $23.14 512,150 $18.05
Alabama 10,457 $16.40 4,776 $20.85 9,005 $16.29
Alaska 2,434 $20.03 1,179 $30.69 1,105 $25.22
Arizona 19,343 $17.79 7,054 $21.05 7,915 $17.97
Arkansas 6,365 $15.87 2,443 $18.97 5,345 $16.00
California 103,461 $20.43 26,539 $24.42 36,148 $18.35
Colorado 22,894 $20.34 10,487 $23.30 10,942 $19.44
Connecticut 11,797 $21.66 3,240 $26.72 5,869 $19.96
Delaware 3,071 $18.48 1,092 $24.01 1,861 $17.08
Florida 52,495 $17.41 21,813 $19.52 19,299 $16.70
Georgia 27,886 $17.47 10,375 $20.77 18,477 $16.60
Hawaii 4,968 $18.53 1,455 $29.71 1,442 $21.79
Idaho 4,647 $16.43 2,496 $20.00 3,307 $16.94
Illinois 36,526 $19.07 9,165 $27.17 20,862 $18.15
Indiana 16,881 $17.33 6,034 $22.44 13,426 $17.57
Iowa 11,363 $17.28 5,626 $21.81 10,020 $17.65
Kansas 8,065 $17.26 2,842 $21.73 5,160 $18.51
Kentucky 9,855 $16.24 3,106 $21.77 9,293 $17.77
Louisiana 9,244 $15.46 4,158 $21.44 5,628 $19.34
Maine 3,314 $16.92 1,262 $20.87 2,176 $17.71
Maryland 16,104 $19.71 5,616 $24.21 7,464 $19.11
Massachusetts 24,602 $21.83 6,792 $28.13 9,861 $19.48
Michigan 27,277 $18.16 10,198 $12.83 17,072 $11.59
Minnesota 24,848 $19.98 8,041 $25.70 15,607 $19.02
Mississippi 5,938 $14.89 2,481 $19.62 5,975 $16.17
Missouri 17,689 $17.32 5,587 $23.28 11,244 $17.40
Montana 3,596 $16.52 2,194 $22.69 2,709 $18.78
Nebraska 6,025 $17.32 3,025 $21.32 4,175 $18.11
Nevada 9,168 $17.27 3,186 $24.23 4,049 $17.96
New Hampshire 4,880 $19.11 1,590 $23.54 3,119 $18.30
New Jersey 28,459 $20.44 8,038 $27.02 14,598 $18.22
New Mexico 4,352 $16.15 1,998 $20.72 2,516 $17.61
New York 51,963 $22.30 13,638 $28.14 18,836 $19.62
North Carolina 22,884 $17.84 10,738 $20.40 15,453 $16.15
North Dakota 3,048 $18.45 1,859 $25.70 2,652 $21.36
Ohio 31,891 $17.98 11,633 $22.63 24,347 $17.61
Oklahoma 8,870 $16.76 4,148 $21.02 6,788 $17.59
Oregon 13,963 $18.53 6,109 $23.59 8,306 $18.40
Pennsylvania 39,807 $18.57 14,027 $23.37 27,450 $18.04
Rhode Island 2,854 $20.19 973 $24.88 2,124 $17.76
South Carolina 12,019 $16.24 6,649 $20.13 8,507 $17.11
South Dakota 2,730 $16.25 1,216 $20.00 2,207 $16.31
Tennessee 17,685 $17.18 6,035 $20.59 13,186 $16.66
Texas 63,964 $18.63 26,213 $21.31 34,724 $18.65
Utah 10,619 $17.27 3,897 $21.54 6,604 $17.67
Vermont 1,952 $18.79 908 $21.92 1,605 $18.52
Virginia 22,873 $18.60 8,369 $22.47 10,608 $18.16
Washington 24,849 $20.67 10,052 $26.44 12,160 $21.33
West Virginia 3,927 $15.01 1,714 $21.46 3,654 $17.60
Wisconsin 20,561 $18.14 7,567 $23.59 19,298 $17.94
Wyoming 1,542 $17.33 1,067 $25.38 1,460 $23.20
1. Wage data are from the BLS Occupational Employment Statistics program's May 2017 estimates. The OES major occupational group wage data
has been weighted to form the higher level aggregates.
© 2018 The Conference Board. All rights reserved.
Table 8: State Occupational Demand and Pay, Not Seasonally Adjusted - continued
Production and TransportationConstruction and MaintenanceSales and Office
Average Hourly
Wage1
Average Hourly
Wage1
Average Hourly
Wage1
Source: The Conference Board
17
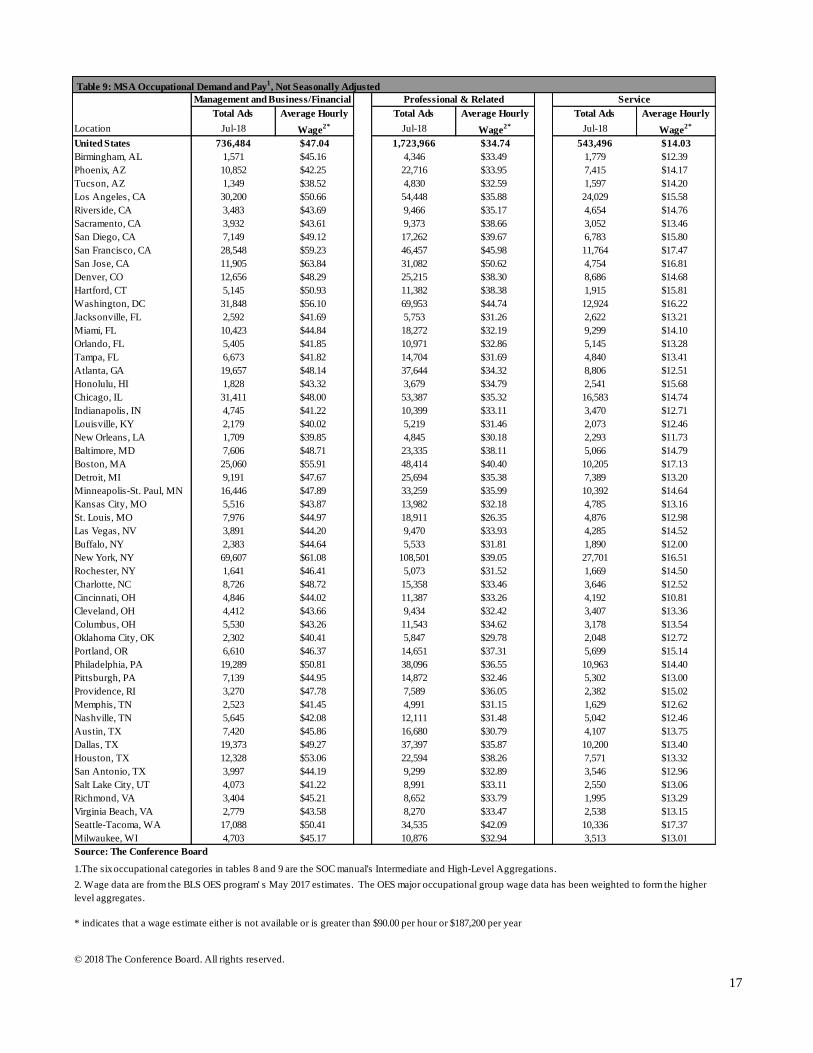
Total Ads Total Ads Total Ads
Location Jul-18 Jul-18 Jul-18
United States 736,484 $47.04 1,723,966 $34.74 543,496 $14.03
Birmingham, AL 1,571 $45.16 4,346 $33.49 1,779 $12.39
Phoenix, AZ 10,852 $42.25 22,716 $33.95 7,415 $14.17
Tucson, AZ 1,349 $38.52 4,830 $32.59 1,597 $14.20
Los Angeles, CA 30,200 $50.66 54,448 $35.88 24,029 $15.58
Riverside, CA 3,483 $43.69 9,466 $35.17 4,654 $14.76
Sacramento, CA 3,932 $43.61 9,373 $38.66 3,052 $13.46
San Diego, CA 7,149 $49.12 17,262 $39.67 6,783 $15.80
San Francisco, CA 28,548 $59.23 46,457 $45.98 11,764 $17.47
San Jose, CA 11,905 $63.84 31,082 $50.62 4,754 $16.81
Denver, CO 12,656 $48.29 25,215 $38.30 8,686 $14.68
Hartford, CT 5,145 $50.93 11,382 $38.38 1,915 $15.81
Washington, DC 31,848 $56.10 69,953 $44.74 12,924 $16.22
Jacksonville, FL 2,592 $41.69 5,753 $31.26 2,622 $13.21
Miami, FL 10,423 $44.84 18,272 $32.19 9,299 $14.10
Orlando, FL 5,405 $41.85 10,971 $32.86 5,145 $13.28
Tampa, FL 6,673 $41.82 14,704 $31.69 4,840 $13.41
Atlanta, GA 19,657 $48.14 37,644 $34.32 8,806 $12.51
Honolulu, HI 1,828 $43.32 3,679 $34.79 2,541 $15.68
Chicago, IL 31,411 $48.00 53,387 $35.32 16,583 $14.74
Indianapolis, IN 4,745 $41.22 10,399 $33.11 3,470 $12.71
Louisville, KY 2,179 $40.02 5,219 $31.46 2,073 $12.46
New Orleans, LA 1,709 $39.85 4,845 $30.18 2,293 $11.73
Baltimore, MD 7,606 $48.71 23,335 $38.11 5,066 $14.79
Boston, MA 25,060 $55.91 48,414 $40.40 10,205 $17.13
Detroit, MI 9,191 $47.67 25,694 $35.38 7,389 $13.20
Minneapolis-St. Paul, MN 16,446 $47.89 33,259 $35.99 10,392 $14.64
Kansas City, MO 5,516 $43.87 13,982 $32.18 4,785 $13.16
St. Louis, MO 7,976 $44.97 18,911 $26.35 4,876 $12.98
Las Vegas, NV 3,891 $44.20 9,470 $33.93 4,285 $14.52
Buffalo, NY 2,383 $44.64 5,533 $31.81 1,890 $12.00
New York, NY 69,607 $61.08 108,501 $39.05 27,701 $16.51
Rochester, NY 1,641 $46.41 5,073 $31.52 1,669 $14.50
Charlotte, NC 8,726 $48.72 15,358 $33.46 3,646 $12.52
Cincinnati, OH 4,846 $44.02 11,387 $33.26 4,192 $10.81
Cleveland, OH 4,412 $43.66 9,434 $32.42 3,407 $13.36
Columbus, OH 5,530 $43.26 11,543 $34.62 3,178 $13.54
Oklahoma City, OK 2,302 $40.41 5,847 $29.78 2,048 $12.72
Portland, OR 6,610 $46.37 14,651 $37.31 5,699 $15.14
Philadelphia, PA 19,289 $50.81 38,096 $36.55 10,963 $14.40
Pittsburgh, PA 7,139 $44.95 14,872 $32.46 5,302 $13.00
Providence, RI 3,270 $47.78 7,589 $36.05 2,382 $15.02
Memphis, TN 2,523 $41.45 4,991 $31.15 1,629 $12.62
Nashville, TN 5,645 $42.08 12,111 $31.48 5,042 $12.46
Austin, TX 7,420 $45.86 16,680 $30.79 4,107 $13.75
Dallas, TX 19,373 $49.27 37,397 $35.87 10,200 $13.40
Houston, TX 12,328 $53.06 22,594 $38.26 7,571 $13.32
San Antonio, TX 3,997 $44.19 9,299 $32.89 3,546 $12.96
Salt Lake City, UT 4,073 $41.22 8,991 $33.11 2,550 $13.06
Richmond, VA 3,404 $45.21 8,652 $33.79 1,995 $13.29
Virginia Beach, VA 2,779 $43.58 8,270 $33.47 2,538 $13.15
Seattle-Tacoma, WA 17,088 $50.41 34,535 $42.09 10,336 $17.37
Milwaukee, WI 4,703 $45.17 10,876 $32.94 3,513 $13.01
Source: The Conference Board
1.The six occupational categories in tables 8 and 9 are the SOC manual's Intermediate and High-Level Aggregations.
© 2018 The Conference Board. All rights reserved.
* indicates that a wage estimate either is not available or is greater than $90.00 per hour or $187,200 per year
2. Wage data are from the BLS OES program' s May 2017 estimates. The OES major occupational group wage data has been weighted to form the higher
level aggregates.
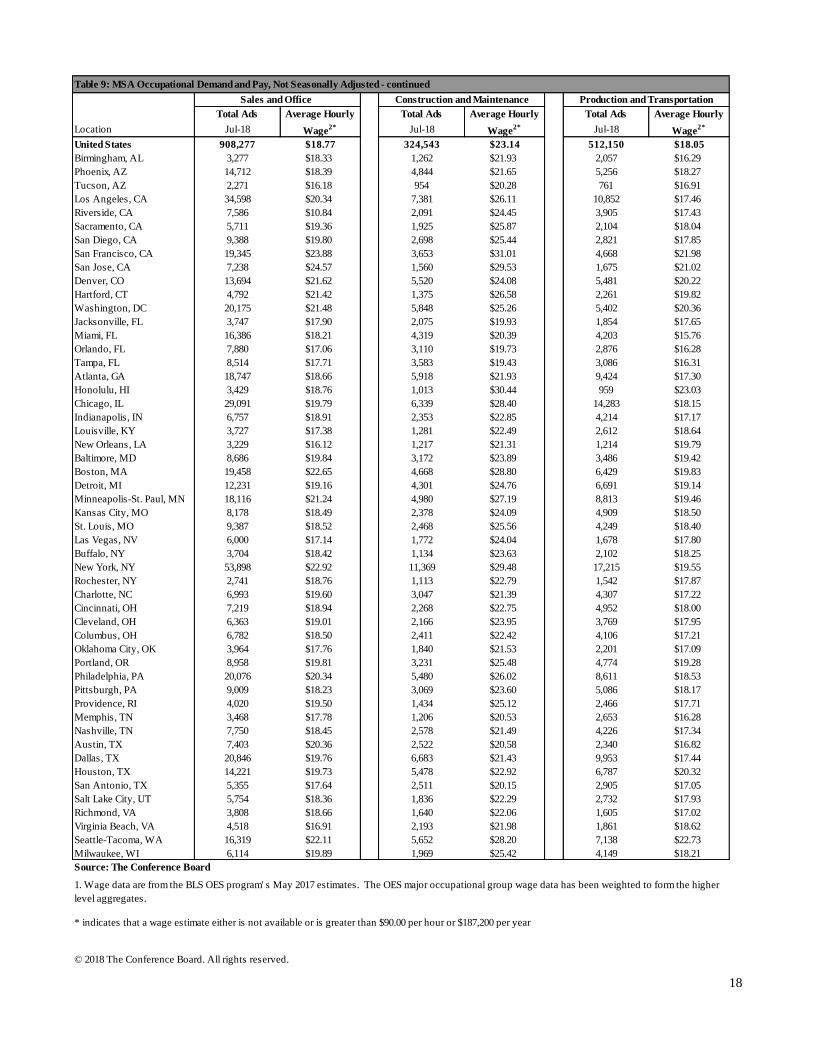
Table 9: MSA Occupational Demand and Pay1, Not Seasonally Adjusted
Management and Business/Financial ServiceProfessional & Related
Average Hourly
Wage2*
Average Hourly
Wage2*
Average Hourly
Wage2*
18
Total Ads Total Ads Total Ads
Location Jul-18 Jul-18 Jul-18
United States 908,277 $18.77 324,543 $23.14 512,150 $18.05
Birmingham, AL 3,277 $18.33 1,262 $21.93 2,057 $16.29
Phoenix, AZ 14,712 $18.39 4,844 $21.65 5,256 $18.27
Tucson, AZ 2,271 $16.18 954 $20.28 761 $16.91
Los Angeles, CA 34,598 $20.34 7,381 $26.11 10,852 $17.46
Riverside, CA 7,586 $10.84 2,091 $24.45 3,905 $17.43
Sacramento, CA 5,711 $19.36 1,925 $25.87 2,104 $18.04
San Diego, CA 9,388 $19.80 2,698 $25.44 2,821 $17.85
San Francisco, CA 19,345 $23.88 3,653 $31.01 4,668 $21.98
San Jose, CA 7,238 $24.57 1,560 $29.53 1,675 $21.02
Denver, CO 13,694 $21.62 5,520 $24.08 5,481 $20.22
Hartford, CT 4,792 $21.42 1,375 $26.58 2,261 $19.82
Washington, DC 20,175 $21.48 5,848 $25.26 5,402 $20.36
Jacksonville, FL 3,747 $17.90 2,075 $19.93 1,854 $17.65
Miami, FL 16,386 $18.21 4,319 $20.39 4,203 $15.76
Orlando, FL 7,880 $17.06 3,110 $19.73 2,876 $16.28
Tampa, FL 8,514 $17.71 3,583 $19.43 3,086 $16.31
Atlanta, GA 18,747 $18.66 5,918 $21.93 9,424 $17.30
Honolulu, HI 3,429 $18.76 1,013 $30.44 959 $23.03
Chicago, IL 29,091 $19.79 6,339 $28.40 14,283 $18.15
Indianapolis, IN 6,757 $18.91 2,353 $22.85 4,214 $17.17
Louisville, KY 3,727 $17.38 1,281 $22.49 2,612 $18.64
New Orleans, LA 3,229 $16.12 1,217 $21.31 1,214 $19.79
Baltimore, MD 8,686 $19.84 3,172 $23.89 3,486 $19.42
Boston, MA 19,458 $22.65 4,668 $28.80 6,429 $19.83
Detroit, MI 12,231 $19.16 4,301 $24.76 6,691 $19.14
Minneapolis-St. Paul, MN 18,116 $21.24 4,980 $27.19 8,813 $19.46
Kansas City, MO 8,178 $18.49 2,378 $24.09 4,909 $18.50
St. Louis, MO 9,387 $18.52 2,468 $25.56 4,249 $18.40
Las Vegas, NV 6,000 $17.14 1,772 $24.04 1,678 $17.80
Buffalo, NY 3,704 $18.42 1,134 $23.63 2,102 $18.25
New York, NY 53,898 $22.92 11,369 $29.48 17,215 $19.55
Rochester, NY 2,741 $18.76 1,113 $22.79 1,542 $17.87
Charlotte, NC 6,993 $19.60 3,047 $21.39 4,307 $17.22
Cincinnati, OH 7,219 $18.94 2,268 $22.75 4,952 $18.00
Cleveland, OH 6,363 $19.01 2,166 $23.95 3,769 $17.95
Columbus, OH 6,782 $18.50 2,411 $22.42 4,106 $17.21
Oklahoma City, OK 3,964 $17.76 1,840 $21.53 2,201 $17.09
Portland, OR 8,958 $19.81 3,231 $25.48 4,774 $19.28
Philadelphia, PA 20,076 $20.34 5,480 $26.02 8,611 $18.53
Pittsburgh, PA 9,009 $18.23 3,069 $23.60 5,086 $18.17
Providence, RI 4,020 $19.50 1,434 $25.12 2,466 $17.71
Memphis, TN 3,468 $17.78 1,206 $20.53 2,653 $16.28
Nashville, TN 7,750 $18.45 2,578 $21.49 4,226 $17.34
Austin, TX 7,403 $20.36 2,522 $20.58 2,340 $16.82
Dallas, TX 20,846 $19.76 6,683 $21.43 9,953 $17.44
Houston, TX 14,221 $19.73 5,478 $22.92 6,787 $20.32
San Antonio, TX 5,355 $17.64 2,511 $20.15 2,905 $17.05
Salt Lake City, UT 5,754 $18.36 1,836 $22.29 2,732 $17.93
Richmond, VA 3,808 $18.66 1,640 $22.06 1,605 $17.02
Virginia Beach, VA 4,518 $16.91 2,193 $21.98 1,861 $18.62
Seattle-Tacoma, WA 16,319 $22.11 5,652 $28.20 7,138 $22.73
Milwaukee, WI 6,114 $19.89 1,969 $25.42 4,149 $18.21
Source: The Conference Board
© 2018 The Conference Board. All rights reserved.
* indicates that a wage estimate either is not available or is greater than $90.00 per hour or $187,200 per year
1. Wage data are from the BLS OES program' s May 2017 estimates. The OES major occupational group wage data has been weighted to form the higher
level aggregates.
Table 9: MSA Occupational Demand and Pay, Not Seasonally Adjusted - continued
Sales and Office Construction and Maintenance Production and Transportation
Average Hourly
Wage2*
Average Hourly
Wage2*
Average Hourly
Wage2*
19
© The Conference Board 2018. All data contained in this press release are protected by United States and international copyright laws. The data
displayed are provided for informational purposes only and may only be accessed, reviewed, and/or used in accordance with, and the permission of, The
Conference Board consistent with a subscriber or license agreement and the Terms of Use displayed on our website at www.conference-board.org. The
data and analysis contained herein may not be used, redistributed, published, or posted by any means without express written permission from The
Conference Board. COPYRIGHT TERMS OF USE. All material in this press release and on Our Sites is protected by United States and international copyright laws. You must abide by all copyright notices and restrictions contained in Our Sites. You may not reproduce, distribute (in any form including over any local area or other network or service), display, perform, create derivative works of, sell, license, extract for use in a database, or otherwise use any materials (including computer programs and other code) in this press release or on Our Sites (collectively, “Site Material”), except that you may download Site Material in the form of one machine-readable copy that you will use only for personal, noncommercial purposes, and only if you do not alter Site Material or remove any trademark, copyright or other notice
displayed on the Site Material. If you are a subscriber to any of the services offered on Our Sites, you may be permitted to use Site Material, according to the terms of your subscription agreement.
TRADEMARKS. “THE CONFERENCE BOARD”, the TORCH LOGO, “THE CONFERENCE BOARD HELP WANTED ONLINE”, and any other
logos, indicia and trademarks featured in this press release or on Our Sites are trademarks owned by The Conference Board, Inc. in the United States and
other countries (“Our Trademarks”). You may not use Our Trademarks in connection with any product or service that does not belong to us nor in any
manner that is likely to cause confusion among users about whether The Conference Board is the source, sponsor, or endorser of the product or service,
nor in any manner that disparages or discredits us.
Violators of these rights will be prosecuted to the full extent of the law. Nothing herein shall restrict the use of the information by news journalists using
the information in a legitimate news publication or periodical.