news & information - sony.net · 1 no. 16-107e november 1, 2016 consolidated financial results...
TRANSCRIPT
1
No. 16-107E
November 1, 2016
Consolidated Financial Results for the Second Quarter Ended September 30, 2016
Tokyo, November 1, 2016 -- Sony Corporation today announced its consolidated financial results for the second quarter ended September 30, 2016 (July 1, 2016 to September 30, 2016). (Billions of yen, millions of U.S. dollars, except per share amounts)
Second Quarter ended September 30 2015 2016 Change in yen 2016*
Sales and operating revenue ¥1,892.7 ¥1,688.9 -10.8% $16,722 Operating income 88.0 45.7 -48.0 453 Income before income taxes 72.2 40.5 -43.9 401 Net income attributable to Sony Corporation’s
stockholders 33.6 4.8 -85.6 48 Net income attributable to Sony Corporation’s
stockholders per share of common stock: - Basic ¥26.64 ¥3.84 -85.6 $0.04 - Diluted 26.10 3.76 -85.6 0.04 * U.S. dollar amounts have been translated from yen, for convenience only, at the rate of 101 yen = 1 U.S. dollar, the approximate Tokyo
foreign exchange market rate as of September 30, 2016. All amounts are presented on the basis of Generally Accepted Accounting Principles in the U.S. (“U.S. GAAP”). Sony Corporation and its consolidated subsidiaries are together referred to as “Sony”. The average foreign exchange rates during the quarters ended September 30, 2015 and 2016 are presented below. Second Quarter ended September 30 2015 2016 Change
The average rate of yen 1 U.S. dollar ¥122.2 ¥102.4 19.3% (yen appreciation)
1 Euro 135.9 114.3 19.0 (yen appreciation) Consolidated Results for the Second Quarter Ended September 30, 2016 Sales and operating revenue (“Sales”) decreased by 10.8% compared to the same quarter of the previous fiscal year (“year-on-year”) to 1,688.9 billion yen (16,722 million U.S. dollars). This decrease was mainly due to the impact of foreign exchange rates. On a constant currency basis, sales were essentially flat year-on-year, due to a decrease in Mobile Communications (“MC”) segment sales reflecting a significant decrease in smartphone unit sales, substantially offset by an increase in revenues in the Financial Services segment due to an improvement in investment performance in the separate account at Sony Life Insurance Co., Ltd. (“Sony Life”), as well as an increase in sales in the Pictures segment. For further details about the impact of foreign exchange rate fluctuations on sales and operating income (loss), see Notes on page 10. Operating income decreased 42.3 billion yen year-on-year to 45.7 billion yen (453 million U.S. dollars). This significant decrease was mainly due to the deterioration of operating results in the Semiconductors and Components segments, partially offset by improvements in the Pictures and MC segments. Operating income in the current quarter includes a 32.8 billion yen (325 million U.S. dollars) impairment charge related to the planned transfer of the battery business recorded in the Components segment. In addition, 1.2
News & Information
1-7-1 Konan, Minato-ku Tokyo 108-0075 Japan

2
billion yen (11 million U.S. dollars) of net charges from the earthquakes in the Kumamoto region in 2016 (the “2016 Kumamoto Earthquakes”) were recorded in the Semiconductors segment. The charges from the earthquakes include 7.2 billion yen (71 million U.S. dollars) of repair costs for certain fixed assets and a loss on disposal of inventories that were directly damaged (the “Physical Damage”), as well as 1.2 billion yen (11 million U.S. dollars) of idle facility costs at manufacturing sites and other costs. The entire amount of the Physical Damage was offset by the recognition of probable insurance recoveries. During the current quarter, restructuring charges, net, increased 27.0 billion yen year-on-year to 32.6 billion yen (322 million U.S. dollars) primarily due to the above-mentioned impairment charge related to the planned transfer of the battery business. This amount is recorded as an operating expense included in the above-mentioned operating income. Equity in net income of affiliated companies, recorded within operating income, increased 0.2 billion yen year-on-year to 1.1 billion yen (11 million U.S. dollars). The net effect of other income and expenses improved 10.6 billion yen year-on-year to an expense of 5.2 billion yen (52 million U.S. dollars), primarily due to a year-on-year decrease in net foreign exchange loss. Income before income taxes decreased 31.7 billion yen year-on-year to 40.5 billion yen (401 million U.S. dollars). During the current quarter, Sony recorded 23.5 billion yen (232 million U.S. dollars) of income tax expense, resulting in an effective tax rate of 58.0% which exceeded the effective tax rate of 33.1% in the same quarter of the previous fiscal year. This higher effective tax rate was mainly due to the fact that Sony Corporation and its national tax filing group in Japan, which has established valuation allowances for deferred tax assets, recorded losses during the current quarter versus profits in the same quarter of the previous fiscal year. Net income attributable to Sony Corporation’s stockholders, which deducts net income attributable to noncontrolling interests, decreased 28.7 billion yen year-on-year to 4.8 billion yen (48 million U.S. dollars). Operating Performance Highlights by Business Segment “Sales and operating revenue” in each business segment represents sales and operating revenue recorded before intersegment transactions are eliminated. “Operating income (loss)” in each business segment represents operating income (loss) reported before intersegment transactions are eliminated and excludes unallocated corporate expenses.
Mobile Communications (MC) (Billions of yen, millions of U.S. dollars) Second Quarter ended September 30 2015 2016 Change in yen 2016 Sales and operating revenue ¥279.2 ¥168.8 -39.6% $1,671 Operating income (loss) (20.6) 3.7 - 37 Sales decreased 39.6% year-on-year (a 34% decrease on a constant currency basis) to 168.8 billion yen (1,671 million U.S. dollars). This significant decrease was mainly due to a reduction in mid-range smartphone unit sales, as well as a reduction in smartphone unit sales in unprofitable regions where downsizing measures were implemented during the previous fiscal year, partially offset by an improvement in the product mix of smartphones as a result of a concentration on high value-added models. Operating income of 3.7 billion yen (37 million U.S. dollars) was recorded, compared to an operating loss of 20.6 billion yen recorded in the same quarter of the previous fiscal year. Despite the effect of the above-mentioned decrease in sales, profitability improved significantly due to cost reductions, mainly resulting from the benefit of restructuring initiatives, an improvement in product mix, the positive impact of foreign exchange rates and a decrease in restructuring charges. During the current quarter, there was a 5.4 billion yen positive impact from foreign exchange rate fluctuations (net of the impact of foreign exchange hedging).

3
Game & Network Services (G&NS) (Billions of yen, millions of U.S. dollars) Second Quarter ended September 30 2015 2016 Change in yen 2016 Sales and operating revenue ¥360.7 ¥319.9 -11.3% $3,167
Operating income 23.9 19.0 -20.6 188 The G&NS segment includes the Hardware, Network, and Other categories. Hardware includes home and portable game consoles; Network includes network services relating to game, video and music content provided by Sony Interactive Entertainment; Other includes packaged software and peripheral devices. Sales decreased 11.3% year-on-year (a 2% increase on a constant currency basis) to 319.9 billion yen (3,167 million U.S. dollars). This significant decrease was primarily due to the impact of foreign exchange rates and the impact of a price reduction for PlayStation®4 (“PS4”) hardware, partially offset by an increase in PS4 software sales including sales through the network. Operating income decreased 4.9 billion yen year-on-year to 19.0 billion yen (188 million U.S. dollars). This decrease was primarily due to the effects of the price reduction for PS4 hardware as well as a decrease in PlayStation®3 software sales, partially offset by PS4 hardware cost reductions and the above-mentioned increase in PS4 software sales. During the current quarter, there was a 0.9 billion yen negative impact from foreign exchange rate fluctuations.
Imaging Products & Solutions (IP&S) (Billions of yen, millions of U.S. dollars) Second Quarter ended September 30 2015 2016 Change in yen 2016 Sales and operating revenue ¥180.9 ¥135.4 -25.2% $1,340 Operating income 23.1 14.9 -35.7 147 The IP&S segment includes the Still and Video Cameras as well as Other categories. Still and Video Cameras includes interchangeable lens cameras, compact digital cameras, consumer video cameras and video cameras for broadcast; Other includes display products such as projectors and medical equipment. Due to certain changes in Sony’s organizational structure, sales and operating revenue and operating income (loss) of the IP&S segment of the comparable prior period have been reclassified to conform to the current presentation. For details, please see Notes on page 10. Sales decreased 25.2% year-on-year (a 14% decrease on a constant currency basis) to 135.4 billion yen (1,340 million U.S. dollars). This significant decrease in sales was mainly due to lower sales of Still and Video Cameras, primarily reflecting a contraction of the market and the difficulty of procuring components due to the 2016 Kumamoto Earthquakes, as well as the impact of foreign exchange rates, partially offset by an improvement in the product mix of Still and Video Cameras, reflecting a shift to high value-added models. Operating income decreased 8.2 billion yen year-on-year to 14.9 billion yen (147 million U.S. dollars). This significant decrease was mainly due to the impact of the above-mentioned decrease in sales and the negative impact of foreign exchange rates, partially offset by such factors as the above-mentioned improvement in product mix and a reduction of fixed costs. During the current quarter, there was a 9.5 billion yen negative impact from foreign exchange rate fluctuations.

4
Home Entertainment & Sound (HE&S) (Billions of yen, millions of U.S. dollars) Second Quarter ended September 30
2015 2016 Change in yen 2016 Sales and operating revenue ¥289.1 ¥234.9 -18.7% $2,326 Operating income 15.8 17.6 +11.4 174 The HE&S segment includes the Televisions as well as Audio and Video categories. Televisions includes LCD televisions; Audio and Video includes Blu-ray DiscTM players and recorders, home audio, headphones and memory-based portable audio devices. Sales decreased 18.7% year-on-year (a 5% decrease on a constant currency basis) to 234.9 billion yen (2,326 million U.S. dollars). This was primarily due to the impact of foreign exchange rates and a decrease in home audio and video unit sales reflecting a contraction of the market. Operating income increased 1.8 billion yen year-on-year to 17.6 billion yen (174 million U.S. dollars). This increase was primarily due to an improvement in product mix reflecting a shift to high value-added models and cost reductions, partially offset by the negative impact of foreign exchange rates as well as the above-mentioned decrease in sales. During the current quarter, there was a 6.0 billion yen negative impact from foreign exchange rate fluctuations.
Semiconductors (Billions of yen, millions of U.S. dollars) Second Quarter ended September 30 2015 2016 Change in yen 2016 Sales and operating revenue ¥203.9 ¥193.7 -5.0% $1,918 Operating income (loss) 34.1 (4.2) - (41) The Semiconductors segment includes image sensors and camera modules. Due to certain changes in Sony’s organizational structure, sales and operating revenue and operating income (loss) of the former Devices segment of the comparable prior period have been reclassified to conform to the current presentation. For details, please see Notes on page 10. Sales decreased 5.0% year-on-year (a 12% increase on a constant currency basis) to 193.7 billion yen (1,918 million U.S. dollars). This decrease was primarily due to a decrease in sales of image sensors, reflecting the impact of foreign exchange rates, partially offset by an increase in the unit sales of image sensors for mobile products. Sales to external customers increased 1.1% year-on-year. Operating loss of 4.2 billion yen (41 million U.S. dollars) was recorded, compared to operating income of 34.1 billion yen recorded in the same quarter of the previous fiscal year. This significant deterioration was primarily due to the negative impact of foreign exchange rates and 9.4 billion yen (93 million U.S. dollars) in inventory write-downs of certain image sensors for mobile products, partially offset by the above-mentioned increase in the unit sales of image sensors for mobile products. Operating loss in the current quarter includes the above-mentioned net expense of 1.2 billion yen (11 million U.S. dollars) resulting from the 2016 Kumamoto Earthquakes. During the current quarter, there was a 19.7 billion yen negative impact from foreign exchange rate fluctuations.
Components (Billions of yen, millions of U.S. dollars) Second Quarter ended September 30 2015 2016 Change in yen 2016 Sales and operating revenue ¥61.2 ¥46.7 -23.7% $462 Operating loss (1.5) (36.6) - (363)
5
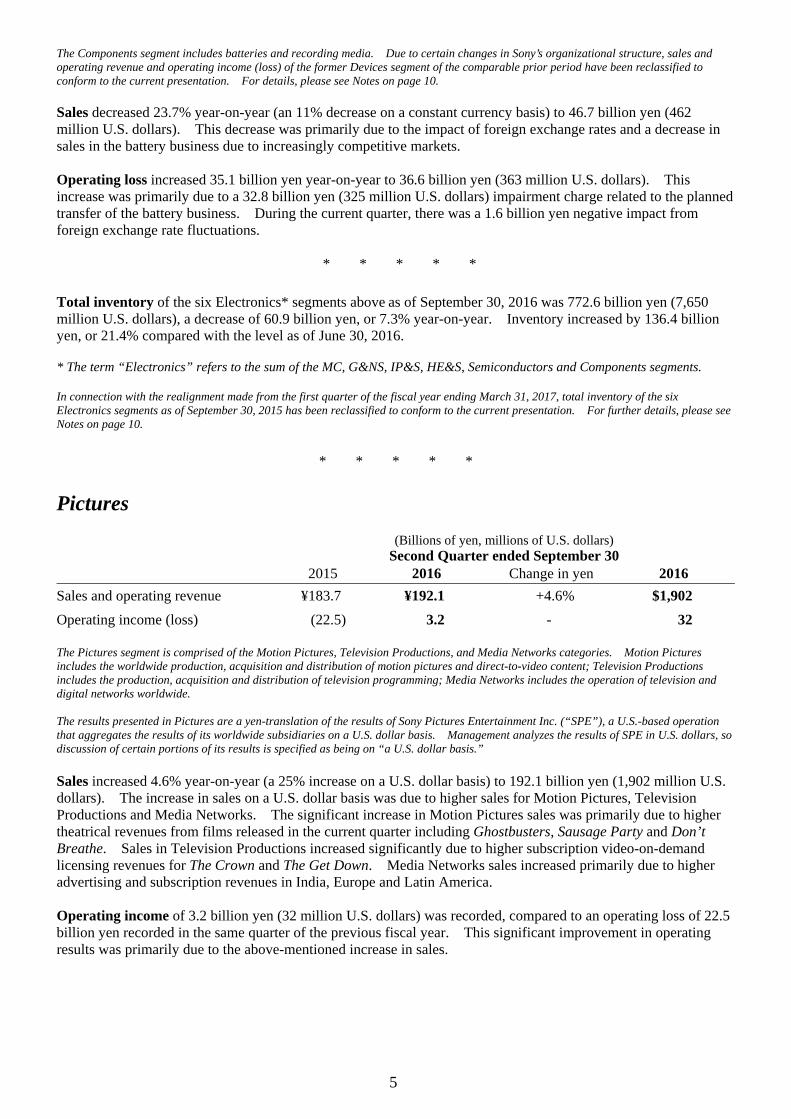
The Components segment includes batteries and recording media. Due to certain changes in Sony’s organizational structure, sales and operating revenue and operating income (loss) of the former Devices segment of the comparable prior period have been reclassified to conform to the current presentation. For details, please see Notes on page 10. Sales decreased 23.7% year-on-year (an 11% decrease on a constant currency basis) to 46.7 billion yen (462 million U.S. dollars). This decrease was primarily due to the impact of foreign exchange rates and a decrease in sales in the battery business due to increasingly competitive markets. Operating loss increased 35.1 billion yen year-on-year to 36.6 billion yen (363 million U.S. dollars). This increase was primarily due to a 32.8 billion yen (325 million U.S. dollars) impairment charge related to the planned transfer of the battery business. During the current quarter, there was a 1.6 billion yen negative impact from foreign exchange rate fluctuations.
* * * * * Total inventory of the six Electronics* segments above as of September 30, 2016 was 772.6 billion yen (7,650 million U.S. dollars), a decrease of 60.9 billion yen, or 7.3% year-on-year. Inventory increased by 136.4 billion yen, or 21.4% compared with the level as of June 30, 2016. * The term “Electronics” refers to the sum of the MC, G&NS, IP&S, HE&S, Semiconductors and Components segments. In connection with the realignment made from the first quarter of the fiscal year ending March 31, 2017, total inventory of the six Electronics segments as of September 30, 2015 has been reclassified to conform to the current presentation. For further details, please see Notes on page 10.
* * * * *
Pictures (Billions of yen, millions of U.S. dollars) Second Quarter ended September 30 2015 2016 Change in yen 2016 Sales and operating revenue ¥183.7 ¥192.1 +4.6% $1,902 Operating income (loss) (22.5) 3.2 - 32 The Pictures segment is comprised of the Motion Pictures, Television Productions, and Media Networks categories. Motion Pictures includes the worldwide production, acquisition and distribution of motion pictures and direct-to-video content; Television Productions includes the production, acquisition and distribution of television programming; Media Networks includes the operation of television and digital networks worldwide. The results presented in Pictures are a yen-translation of the results of Sony Pictures Entertainment Inc. (“SPE”), a U.S.-based operation that aggregates the results of its worldwide subsidiaries on a U.S. dollar basis. Management analyzes the results of SPE in U.S. dollars, so discussion of certain portions of its results is specified as being on “a U.S. dollar basis.” Sales increased 4.6% year-on-year (a 25% increase on a U.S. dollar basis) to 192.1 billion yen (1,902 million U.S. dollars). The increase in sales on a U.S. dollar basis was due to higher sales for Motion Pictures, Television Productions and Media Networks. The significant increase in Motion Pictures sales was primarily due to higher theatrical revenues from films released in the current quarter including Ghostbusters, Sausage Party and Don’t Breathe. Sales in Television Productions increased significantly due to higher subscription video-on-demand licensing revenues for The Crown and The Get Down. Media Networks sales increased primarily due to higher advertising and subscription revenues in India, Europe and Latin America. Operating income of 3.2 billion yen (32 million U.S. dollars) was recorded, compared to an operating loss of 22.5 billion yen recorded in the same quarter of the previous fiscal year. This significant improvement in operating results was primarily due to the above-mentioned increase in sales.
6
Music (Billions of yen, millions of U.S. dollars) Second Quarter ended September 30 2015 2016 Change in yen 2016 Sales and operating revenue ¥139.1 ¥150.2 +8.0% $1,487
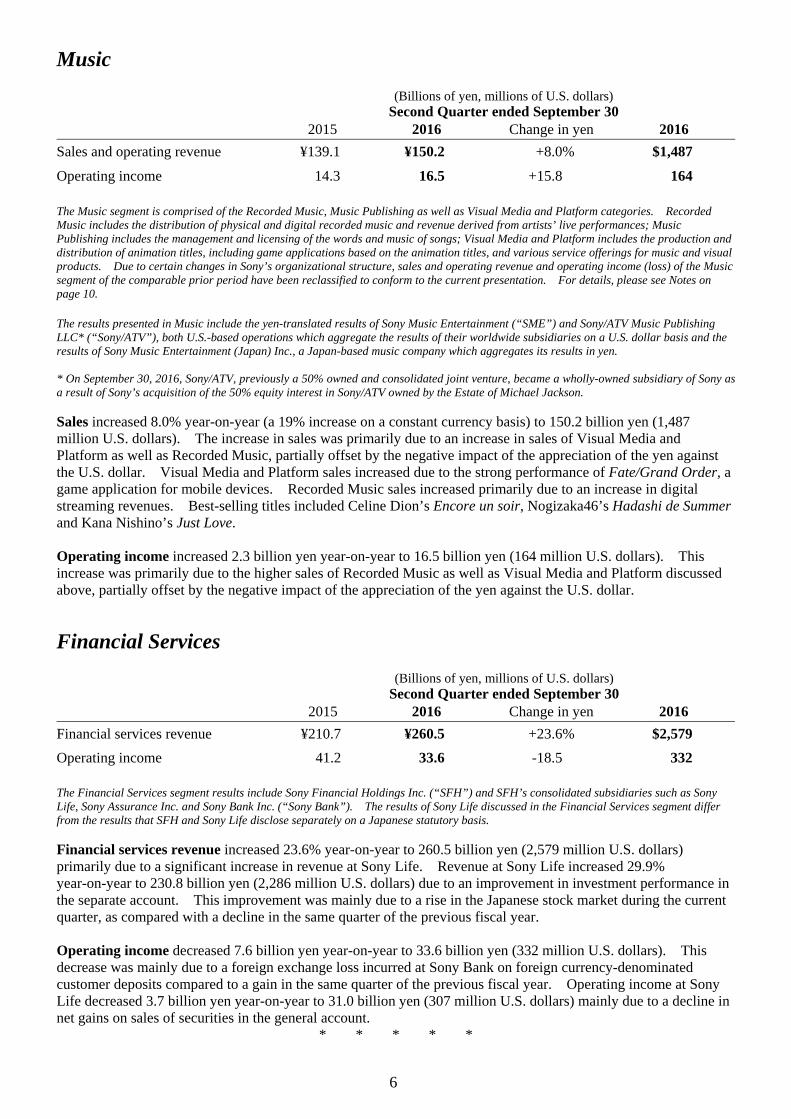
Operating income 14.3 16.5 +15.8 164 The Music segment is comprised of the Recorded Music, Music Publishing as well as Visual Media and Platform categories. Recorded Music includes the distribution of physical and digital recorded music and revenue derived from artists’ live performances; Music Publishing includes the management and licensing of the words and music of songs; Visual Media and Platform includes the production and distribution of animation titles, including game applications based on the animation titles, and various service offerings for music and visual products. Due to certain changes in Sony’s organizational structure, sales and operating revenue and operating income (loss) of the Music segment of the comparable prior period have been reclassified to conform to the current presentation. For details, please see Notes on page 10. The results presented in Music include the yen-translated results of Sony Music Entertainment (“SME”) and Sony/ATV Music Publishing LLC* (“Sony/ATV”), both U.S.-based operations which aggregate the results of their worldwide subsidiaries on a U.S. dollar basis and the results of Sony Music Entertainment (Japan) Inc., a Japan-based music company which aggregates its results in yen. * On September 30, 2016, Sony/ATV, previously a 50% owned and consolidated joint venture, became a wholly-owned subsidiary of Sony as a result of Sony’s acquisition of the 50% equity interest in Sony/ATV owned by the Estate of Michael Jackson. Sales increased 8.0% year-on-year (a 19% increase on a constant currency basis) to 150.2 billion yen (1,487 million U.S. dollars). The increase in sales was primarily due to an increase in sales of Visual Media and Platform as well as Recorded Music, partially offset by the negative impact of the appreciation of the yen against the U.S. dollar. Visual Media and Platform sales increased due to the strong performance of Fate/Grand Order, a game application for mobile devices. Recorded Music sales increased primarily due to an increase in digital streaming revenues. Best-selling titles included Celine Dion’s Encore un soir, Nogizaka46’s Hadashi de Summer and Kana Nishino’s Just Love. Operating income increased 2.3 billion yen year-on-year to 16.5 billion yen (164 million U.S. dollars). This increase was primarily due to the higher sales of Recorded Music as well as Visual Media and Platform discussed above, partially offset by the negative impact of the appreciation of the yen against the U.S. dollar.
Financial Services (Billions of yen, millions of U.S. dollars) Second Quarter ended September 30 2015 2016 Change in yen 2016 Financial services revenue ¥210.7 ¥260.5 +23.6% $2,579 Operating income 41.2 33.6 -18.5 332 The Financial Services segment results include Sony Financial Holdings Inc. (“SFH”) and SFH’s consolidated subsidiaries such as Sony Life, Sony Assurance Inc. and Sony Bank Inc. (“Sony Bank”). The results of Sony Life discussed in the Financial Services segment differ from the results that SFH and Sony Life disclose separately on a Japanese statutory basis. Financial services revenue increased 23.6% year-on-year to 260.5 billion yen (2,579 million U.S. dollars) primarily due to a significant increase in revenue at Sony Life. Revenue at Sony Life increased 29.9% year-on-year to 230.8 billion yen (2,286 million U.S. dollars) due to an improvement in investment performance in the separate account. This improvement was mainly due to a rise in the Japanese stock market during the current quarter, as compared with a decline in the same quarter of the previous fiscal year. Operating income decreased 7.6 billion yen year-on-year to 33.6 billion yen (332 million U.S. dollars). This decrease was mainly due to a foreign exchange loss incurred at Sony Bank on foreign currency-denominated customer deposits compared to a gain in the same quarter of the previous fiscal year. Operating income at Sony Life decreased 3.7 billion yen year-on-year to 31.0 billion yen (307 million U.S. dollars) mainly due to a decline in net gains on sales of securities in the general account.
* * * * *
7
Consolidated Results for the Six Months ended September 30, 2016 For Consolidated Statements of Income and Business Segment Information for the six months ended September 30, 2016 and 2015, please refer to pages F-3 and F-7 respectively. Sales for the six months ended September 30, 2016 (“the current six months”) decreased 10.8% year-on-year to 3,302.1 billion yen (32,695 million U.S. dollars). This decrease was primarily due to the impact of foreign exchange rates. On a constant currency basis, consolidated sales were essentially flat year-on-year, due to a significant decrease in sales of the MC segment, substantially offset by an increase in sales in the Pictures and G&NS segments. For further detail about sales on a constant currency basis, see Notes on page 10. During the current six months, the average rates of the yen were 105.3 yen against the U.S. dollar and 118.2 yen against the euro, which were 15.7% and 14.3% higher, respectively, as compared with the same period in the previous fiscal year. In the MC segment, sales decreased due to a significant decrease in smartphone unit sales in unprofitable regions mainly due to efforts to improve profitability. In the G&NS segment, sales were essentially flat year-on-year primarily due to the contribution of PS4 software sales including sales through the network, partially offset by the negative impact of foreign exchange rates. In the IP&S segment, sales decreased significantly due to lower sales of Still and Video Cameras, primarily reflecting the difficulty of procuring components due to the 2016 Kumamoto Earthquakes, as well as the impact of foreign exchange rates. In the HE&S segment, sales decreased primarily due to the impact of foreign exchange rates and a decrease in home audio and video unit sales reflecting a contraction of the market. In the Semiconductors segment, sales decreased significantly mainly due to the impact of foreign exchange rates. In the Components segment, sales decreased mainly due to a decrease in sales of the battery business and the impact of foreign exchange rates. In the Pictures segment, sales increased due to higher theatrical and television licensing revenues for Motion Pictures, higher subscription video-on-demand revenues for Television Productions and higher advertising and subscription revenues for Media Networks, partially offset by the negative impact of the appreciation of the yen against the U.S. dollar. In the Music segment, sales increased significantly primarily due to higher Visual Media and Platform sales as well as Recorded Music sales, partially offset by the negative impact of the appreciation of the yen against the U.S. dollar. In the Financial Services segment, revenue was essentially flat year-on-year. Operating income decreased 83.0 billion yen year-on-year to 101.9 billion yen (1,009 million U.S. dollars). This significant decrease was primarily due to a significant deterioration in the operating results in the Semiconductors and Component segments, partially offset by an improvement mainly in the MC and Pictures segments. Operating income in the current six months includes a 32.8 billion yen (325 million U.S. dollars) impairment charge related to the planned transfer of the battery business in the Components segment. Additionally, in the Semiconductors segment, a 23.9 billion yen (237 million U.S. dollars) impairment charge against long-lived assets, including an impairment charge against investments recorded in the current period, was recorded, resulting from the termination of the development and manufacturing of certain high-functionality camera modules for external sale, as well as net charges of 14.7 billion yen (146 million U.S. dollars) in expenses resulting from the 2016 Kumamoto Earthquakes. The expenses resulting from the 2016 Kumamoto Earthquakes include 14.0 billion yen (138 million U.S. dollars) of Physical Damage and 9.2 billion yen (91 million U.S. dollars) of idle facility costs at manufacturing sites. Of the Physical Damage, 8.5 billion yen (84 million U.S. dollars) was offset by the recognition of probable insurance recoveries. Operating income in the same period of the previous fiscal year included a 151 million U.S. dollar (18.1 billion yen) gain on the remeasurement to fair value of SME’s 51% equity interest in Orchard Media, Inc. (“The Orchard”), which had previously been accounted for under the equity method, as a result of SME increasing its ownership interest to 100%, recorded in the Music segment, as well as a gain of 12.3 billion yen from the sale of a part of the logistics business, in connection with the formation of a logistics joint venture, recorded in Corporate and elimination. In the MC segment, profitability improved significantly due to cost reductions resulting from the benefit of restructuring initiatives, an improvement in product mix, the positive impact of foreign exchange rates and a decrease in restructuring charges, partially offset by a decrease in sales. In the G&NS segment, operating income increased year-on-year primarily due to the contribution of increased PS4 software sales including sales through the network. In the IP&S segment, operating income decreased year-on-year due to the above-mentioned decrease in

8
sales and the impact of foreign exchange rates, partially offset by an improvement in the product mix of Still and Video Cameras, reflecting a shift to high value-added models. In the HE&S segment, operating income increased year-on-year primarily due to an improvement in product mix reflecting a shift to high value-added models and cost reductions. In the Semiconductors segment, operating results deteriorated significantly primarily due to the negative impact of exchange rates, the above-mentioned 23.9 billion yen (236 million U.S. dollars) impairment charge against long-lived assets relating to camera modules as well as the inclusion of 14.7 billion yen (146 million U.S. dollar) in net expenses relating to the 2016 Kumamoto Earthquakes, and a year-on-year increase in both inventory write-downs and expenses. In the Components segment, operating loss deteriorated significantly mainly due to the recording of the 32.8 billion yen (325 million U.S. dollars) impairment charge related to the planned transfer of the battery business. In the Pictures segment, operating results improved significantly primarily due to the above-mentioned increase in sales partially offset by higher worldwide theatrical marketing expenses. In the Music segment, operating income decreased significantly primarily due to the above-mentioned gain recorded in the same period of the previous fiscal year on the remeasurement of SME’s equity interest in The Orchard, as well as the negative impact of the appreciation of the yen against the U.S. dollar, partially offset by the impact of the increase in sales. In the Financial Services segment, operating income slightly decreased primarily due to a decline in net gains on sales of securities in the general account at Sony Life. During the current six months, restructuring charges, net, increased 18.6 billion yen year-on-year to 34.3 billion yen (340 million U.S. dollars), mainly due to the above-mentioned impairment charge related to the planned transfer of the battery business. This amount is recorded as an operating expense included in the above-mentioned operating income. Equity in net income of affiliated companies, recorded within operating income, decreased 1.0 billion yen year-on-year to 0.4 billion yen (4 million U.S. dollars). The net effect of other income and expenses was an expense of 4.4 billion yen (44 million U.S. dollars), compared to income of 26.0 billion yen in the same period of the previous fiscal year. This was primarily due to the absence of a 46.8 billion yen gain on the sale of certain shares of Olympus Corporation (“Olympus”), recorded in the same period of the previous fiscal year. Income before income taxes decreased 113.4 billion yen to 97.5 billion yen (966 million U.S. dollars). During the current six months, Sony recorded 44.0 billion yen (436 million U.S. dollars) of income tax expense, resulting in an effective tax rate of 45.1% which exceeded the effective tax rate of 30.2% in the same period of the previous fiscal year. This higher effective tax rate was mainly due to the fact that Sony Corporation and its national tax filing group in Japan, which has established valuation allowances for deferred tax assets, recorded losses during the current six months versus profits in the same period of the previous fiscal year. Net income attributable to Sony Corporation’s stockholders decreased 90.0 billion yen year-on-year to 26.0 billion yen (258 million U.S. dollars).
* * * * *
Cash Flows For Consolidated Statements of Cash Flows, charts showing Sony’s cash flow information for all segments, all segments excluding the Financial Services segment and the Financial Services segment alone, please refer to pages F-5 and F-17. Operating Activities: During the current six months, there was a net cash inflow of 81.5 billion yen (807 million U.S. dollars) from operating activities, an increase of 55.9 billion yen, or 219.0% year-on-year. For all segments excluding the Financial Services segment, there was a net cash outflow of 158.7 billion yen (1,571 million U.S. dollars), a decrease of 53.2 billion yen, or 25.1% year-on-year. This decrease was primarily due to an improvement in net income after taking into account non-cash adjustments (including depreciation and amortization, gain on sales of securities investments and other operating income (expense)). The Financial Services segment had a net cash inflow of 253.6 billion yen (2,510 million U.S. dollars), essentially flat year-on-year.

9
Investing Activities: During the current six months, Sony used 667.6 billion yen (6,610 million U.S. dollars) of net cash in investing activities, an increase of 210.6 billion yen, or 46.1% year-on-year. For all segments excluding the Financial Services segment, there was a net cash outflow of 200.1 billion yen (1,981 million U.S. dollars), an increase of 106.5 billion yen, or 113.9% year-on-year. The increase was mainly due to the absence of the cash inflow from the sales of certain shares of Olympus recorded in the same period of the previous fiscal year and an increase in fixed asset purchases. The Financial Services segment used 466.8 billion yen (4,622 million U.S. dollars) of net cash, an increase of 103.3 billion yen, or 28.4% year-on-year. This increase was mainly due to a year-on-year decrease in proceeds from sales or return of investments and collections of advances at Sony Life. In all segments excluding the Financial Services segment, net cash used in operating and investing activities combined*1 for the current six months was 358.8 billion yen (3,553 million U.S. dollars), an increase of 53.4 billion yen, or 17.5% year-on-year. Financing Activities: Net cash provided by financing activities during the current six months was 183.3 billion yen (1,814 million U.S. dollars), a decrease of 318.0 billion yen, or 63.4% year-on-year. For all segments excluding the Financial Services segment, there was a 5.9 billion yen (59 million U.S. dollars) net cash outflow, compared to a 324.8 billion yen net cash inflow in the same period of the previous fiscal year. During the current six months, there was a net cash outflow as Sony redeemed long-term debt and made a payment for the acquisition of the 50% equity interest in Sony/ATV, partially offset by Sony’s issuance of straight bonds. During the same period of the previous fiscal year, Sony issued new stock and convertible bonds. In the Financial Services segment, there was a 175.1 billion yen (1,734 million U.S. dollars) net cash inflow, an increase of 9.1 billion yen, or 5.5% year-on-year. This increase was primarily due to an increase in deposits from customers at Sony Bank, compared to a decrease in the same period of the previous fiscal year, partially offset by a year-on-year smaller increase in short-term borrowings at Sony Life. Total Cash and Cash Equivalents: Accounting for the above factors and the effect of fluctuations in foreign exchange rates, the total outstanding balance of cash and cash equivalents at September 30, 2016 was 525.2 billion yen (5,200 million U.S. dollars). Cash and cash equivalents of all segments excluding the Financial Services segment was 329.6 billion yen (3,264 million U.S. dollars) at September 30, 2016, a decrease of 422.6 billion yen, or 56.2% compared with the balance as of September 30, 2015, and a decrease of 420.3 billion yen, or 56.0% compared with the balance as of March 31, 2016. Sony believes that it continues to maintain sufficient liquidity through access to a total, translated into yen, of 502.2 billion yen (4,973 million U.S. dollars) of unused committed lines of credit with financial institutions in addition to the cash and cash equivalents balance at September 30, 2016. Within the Financial Services segment, the outstanding balance of cash and cash equivalents was 195.5 billion yen (1,936 million U.S. dollars) at September 30, 2016, a decrease of 62.4 billion yen, or 24.2% compared with the balance as of September 30, 2015, and a decrease of 38.2 billion yen, or 16.3% compared with the balance as of March 31, 2016. *1 Sony has included the information for cash flow from operating and investing activities combined, excluding the Financial Services segment’s
activities, as Sony’s management frequently monitors this financial measure, and believes this non-U.S. GAAP measurement is important for use in evaluating Sony’s ability to generate cash to maintain liquidity and fund debt principal and dividend payments from business activities other than its Financial Services segment. This information is derived from the reconciliations prepared in the Condensed Statements of Cash Flows on page F-17. This information and the separate condensed presentations shown below are not required or prepared in accordance with U.S. GAAP. The Financial Services segment’s cash flow is excluded from the measure because SFH, which constitutes a majority of the Financial Services segment, is a separate publicly traded entity in Japan with a significant minority interest and it, as well as its subsidiaries, secure liquidity on their own. This measure may not be comparable to those of other companies. This measure has limitations because it does not represent residual cash flows available for discretionary expenditures principally due to the fact that the measure does not deduct the principal payments required for debt service. Therefore, Sony believes it is important to view this measure as supplemental to its entire statement of cash flows and together with Sony’s disclosures regarding investments, available credit facilities and overall liquidity.
10
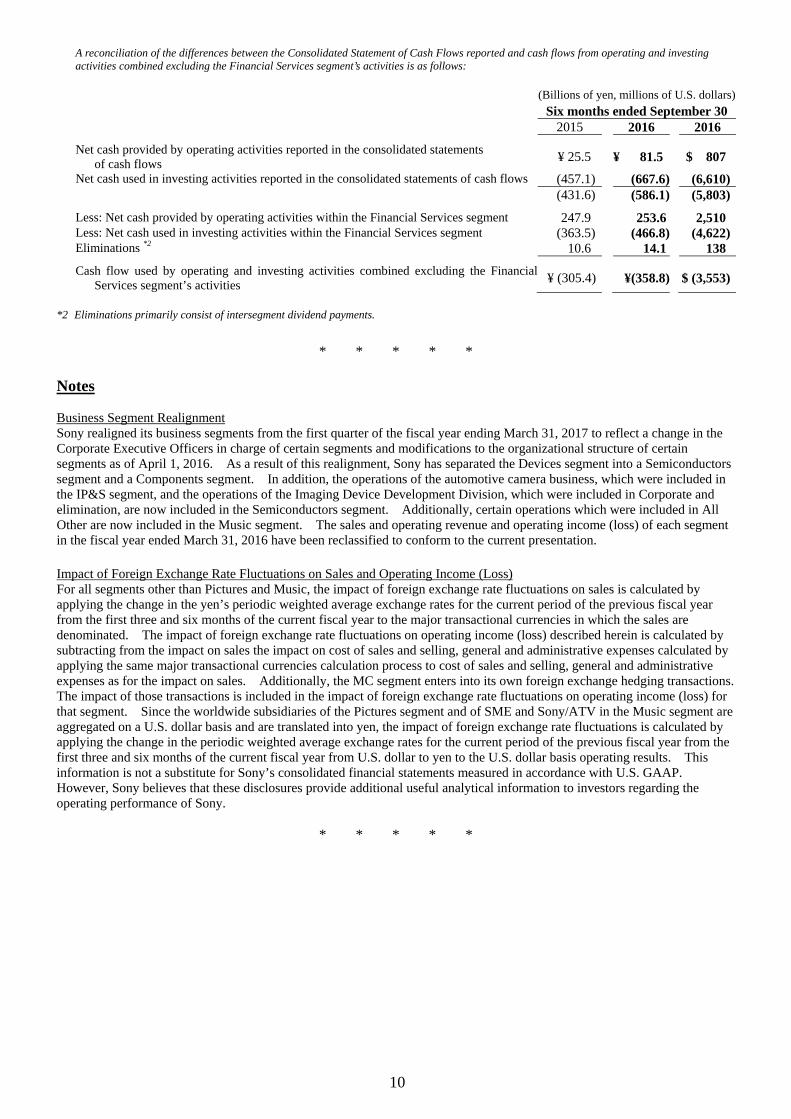
A reconciliation of the differences between the Consolidated Statement of Cash Flows reported and cash flows from operating and investing activities combined excluding the Financial Services segment’s activities is as follows: (Billions of yen, millions of U.S. dollars) Six months ended September 30 2015 2016 2016
Net cash provided by operating activities reported in the consolidated statements of cash flows ¥ 25.5 ¥ 81.5 $ 807
Net cash used in investing activities reported in the consolidated statements of cash flows (457.1) (667.6) (6,610) (431.6) (586.1) (5,803)
Less: Net cash provided by operating activities within the Financial Services segment 247.9 253.6 2,510Less: Net cash used in investing activities within the Financial Services segment (363.5) (466.8) (4,622)Eliminations *2 10.6 14.1 138
Cash flow used by operating and investing activities combined excluding the FinancialServices segment’s activities ¥ (305.4) ¥(358.8) $ (3,553)
*2 Eliminations primarily consist of intersegment dividend payments.
* * * * *
Notes Business Segment Realignment Sony realigned its business segments from the first quarter of the fiscal year ending March 31, 2017 to reflect a change in the Corporate Executive Officers in charge of certain segments and modifications to the organizational structure of certain segments as of April 1, 2016. As a result of this realignment, Sony has separated the Devices segment into a Semiconductors segment and a Components segment. In addition, the operations of the automotive camera business, which were included in the IP&S segment, and the operations of the Imaging Device Development Division, which were included in Corporate and elimination, are now included in the Semiconductors segment. Additionally, certain operations which were included in All Other are now included in the Music segment. The sales and operating revenue and operating income (loss) of each segment in the fiscal year ended March 31, 2016 have been reclassified to conform to the current presentation. Impact of Foreign Exchange Rate Fluctuations on Sales and Operating Income (Loss) For all segments other than Pictures and Music, the impact of foreign exchange rate fluctuations on sales is calculated by applying the change in the yen’s periodic weighted average exchange rates for the current period of the previous fiscal year from the first three and six months of the current fiscal year to the major transactional currencies in which the sales are denominated. The impact of foreign exchange rate fluctuations on operating income (loss) described herein is calculated by subtracting from the impact on sales the impact on cost of sales and selling, general and administrative expenses calculated by applying the same major transactional currencies calculation process to cost of sales and selling, general and administrative expenses as for the impact on sales. Additionally, the MC segment enters into its own foreign exchange hedging transactions. The impact of those transactions is included in the impact of foreign exchange rate fluctuations on operating income (loss) for that segment. Since the worldwide subsidiaries of the Pictures segment and of SME and Sony/ATV in the Music segment are aggregated on a U.S. dollar basis and are translated into yen, the impact of foreign exchange rate fluctuations is calculated by applying the change in the periodic weighted average exchange rates for the current period of the previous fiscal year from the first three and six months of the current fiscal year from U.S. dollar to yen to the U.S. dollar basis operating results. This information is not a substitute for Sony’s consolidated financial statements measured in accordance with U.S. GAAP. However, Sony believes that these disclosures provide additional useful analytical information to investors regarding the operating performance of Sony.
* * * * *
11
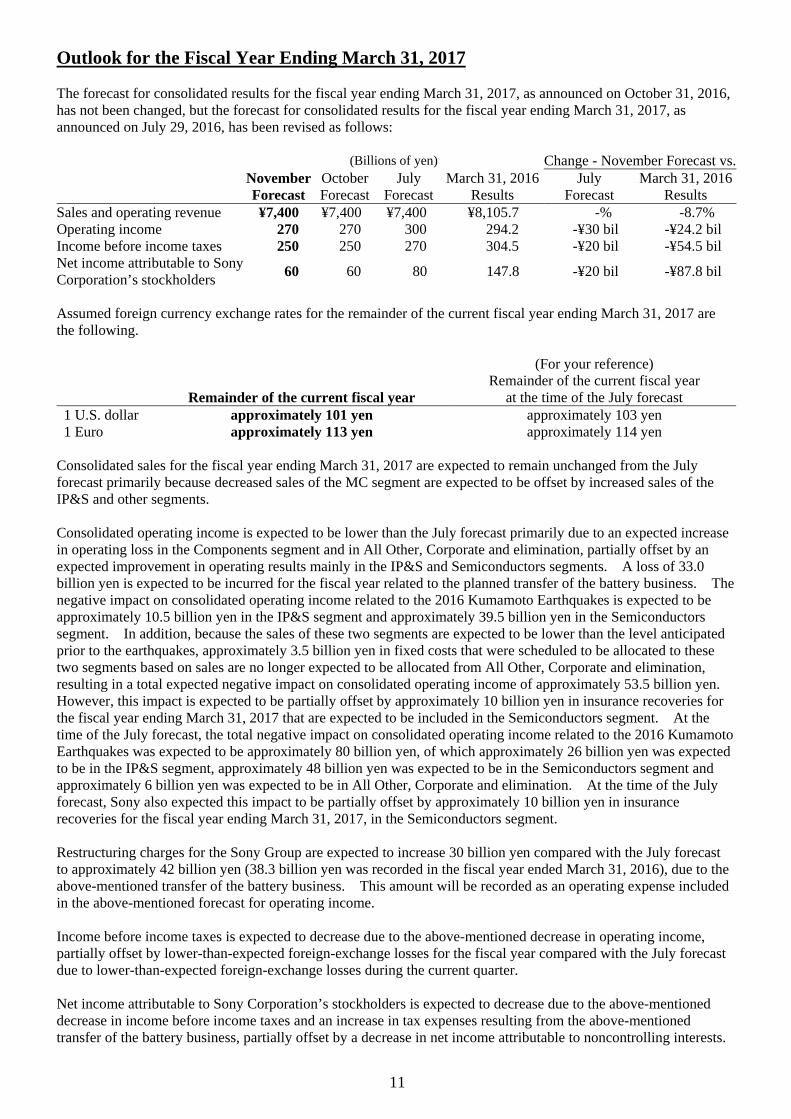
Outlook for the Fiscal Year Ending March 31, 2017 The forecast for consolidated results for the fiscal year ending March 31, 2017, as announced on October 31, 2016, has not been changed, but the forecast for consolidated results for the fiscal year ending March 31, 2017, as announced on July 29, 2016, has been revised as follows:
(Billions of yen) Change - November Forecast vs. November
Forecast OctoberForecast
July Forecast
March 31, 2016Results
July Forecast
March 31, 2016Results
Sales and operating revenue ¥7,400 ¥7,400 ¥7,400 ¥8,105.7 -% -8.7% Operating income 270 270 300 294.2 -¥30 bil -¥24.2 bil Income before income taxes 250 250 270 304.5 -¥20 bil -¥54.5 bil Net income attributable to Sony Corporation’s stockholders 60 60 80 147.8 -¥20 bil -¥87.8 bil
Assumed foreign currency exchange rates for the remainder of the current fiscal year ending March 31, 2017 are the following.
Remainder of the current fiscal year
(For your reference) Remainder of the current fiscal year
at the time of the July forecast 1 U.S. dollar approximately 101 yen approximately 103 yen 1 Euro approximately 113 yen approximately 114 yen
Consolidated sales for the fiscal year ending March 31, 2017 are expected to remain unchanged from the July forecast primarily because decreased sales of the MC segment are expected to be offset by increased sales of the IP&S and other segments. Consolidated operating income is expected to be lower than the July forecast primarily due to an expected increase in operating loss in the Components segment and in All Other, Corporate and elimination, partially offset by an expected improvement in operating results mainly in the IP&S and Semiconductors segments. A loss of 33.0 billion yen is expected to be incurred for the fiscal year related to the planned transfer of the battery business. The negative impact on consolidated operating income related to the 2016 Kumamoto Earthquakes is expected to be approximately 10.5 billion yen in the IP&S segment and approximately 39.5 billion yen in the Semiconductors segment. In addition, because the sales of these two segments are expected to be lower than the level anticipated prior to the earthquakes, approximately 3.5 billion yen in fixed costs that were scheduled to be allocated to these two segments based on sales are no longer expected to be allocated from All Other, Corporate and elimination, resulting in a total expected negative impact on consolidated operating income of approximately 53.5 billion yen. However, this impact is expected to be partially offset by approximately 10 billion yen in insurance recoveries for the fiscal year ending March 31, 2017 that are expected to be included in the Semiconductors segment. At the time of the July forecast, the total negative impact on consolidated operating income related to the 2016 Kumamoto Earthquakes was expected to be approximately 80 billion yen, of which approximately 26 billion yen was expected to be in the IP&S segment, approximately 48 billion yen was expected to be in the Semiconductors segment and approximately 6 billion yen was expected to be in All Other, Corporate and elimination. At the time of the July forecast, Sony also expected this impact to be partially offset by approximately 10 billion yen in insurance recoveries for the fiscal year ending March 31, 2017, in the Semiconductors segment. Restructuring charges for the Sony Group are expected to increase 30 billion yen compared with the July forecast to approximately 42 billion yen (38.3 billion yen was recorded in the fiscal year ended March 31, 2016), due to the above-mentioned transfer of the battery business. This amount will be recorded as an operating expense included in the above-mentioned forecast for operating income. Income before income taxes is expected to decrease due to the above-mentioned decrease in operating income, partially offset by lower-than-expected foreign-exchange losses for the fiscal year compared with the July forecast due to lower-than-expected foreign-exchange losses during the current quarter. Net income attributable to Sony Corporation’s stockholders is expected to decrease due to the above-mentioned decrease in income before income taxes and an increase in tax expenses resulting from the above-mentioned transfer of the battery business, partially offset by a decrease in net income attributable to noncontrolling interests.
12
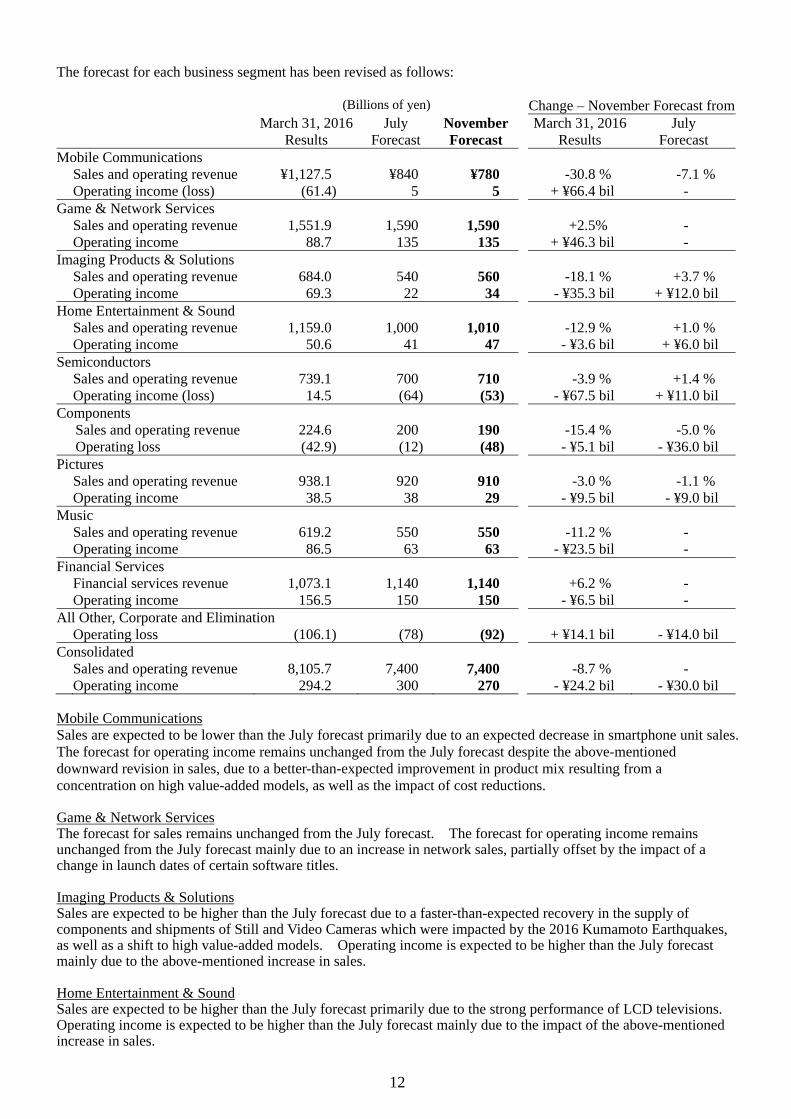
The forecast for each business segment has been revised as follows: (Billions of yen) Change – November Forecast from March 31, 2016
Results July
Forecast NovemberForecast
March 31, 2016 Results
July Forecast
Mobile Communications Sales and operating revenue ¥1,127.5 ¥840 ¥780 -30.8 % -7.1 % Operating income (loss) (61.4) 5 5 + ¥66.4 bil - Game & Network Services Sales and operating revenue 1,551.9 1,590 1,590 +2.5% - Operating income 88.7 135 135 + ¥46.3 bil - Imaging Products & Solutions Sales and operating revenue 684.0 540 560 -18.1 % +3.7 % Operating income 69.3 22 34 - ¥35.3 bil + ¥12.0 bil Home Entertainment & Sound Sales and operating revenue 1,159.0 1,000 1,010 -12.9 % +1.0 % Operating income 50.6 41 47 - ¥3.6 bil + ¥6.0 bil Semiconductors Sales and operating revenue 739.1 700 710 -3.9 % +1.4 % Operating income (loss) 14.5 (64) (53) - ¥67.5 bil + ¥11.0 bil Components
Sales and operating revenue 224.6 200 190 -15.4 % -5.0 % Operating loss (42.9) (12) (48) - ¥5.1 bil - ¥36.0 bil
Pictures Sales and operating revenue 938.1 920 910 -3.0 % -1.1 % Operating income 38.5 38 29 - ¥9.5 bil - ¥9.0 bil Music Sales and operating revenue 619.2 550 550 -11.2 % - Operating income 86.5 63 63 - ¥23.5 bil - Financial Services Financial services revenue 1,073.1 1,140 1,140 +6.2 % - Operating income 156.5 150 150 - ¥6.5 bil - All Other, Corporate and Elimination Operating loss (106.1) (78) (92) + ¥14.1 bil - ¥14.0 bil Consolidated Sales and operating revenue 8,105.7 7,400 7,400 -8.7 % - Operating income 294.2 300 270 - ¥24.2 bil - ¥30.0 bil Mobile Communications Sales are expected to be lower than the July forecast primarily due to an expected decrease in smartphone unit sales. The forecast for operating income remains unchanged from the July forecast despite the above-mentioned downward revision in sales, due to a better-than-expected improvement in product mix resulting from a concentration on high value-added models, as well as the impact of cost reductions. Game & Network Services The forecast for sales remains unchanged from the July forecast. The forecast for operating income remains unchanged from the July forecast mainly due to an increase in network sales, partially offset by the impact of a change in launch dates of certain software titles. Imaging Products & Solutions Sales are expected to be higher than the July forecast due to a faster-than-expected recovery in the supply of components and shipments of Still and Video Cameras which were impacted by the 2016 Kumamoto Earthquakes, as well as a shift to high value-added models. Operating income is expected to be higher than the July forecast mainly due to the above-mentioned increase in sales. Home Entertainment & Sound Sales are expected to be higher than the July forecast primarily due to the strong performance of LCD televisions. Operating income is expected to be higher than the July forecast mainly due to the impact of the above-mentioned increase in sales.
13
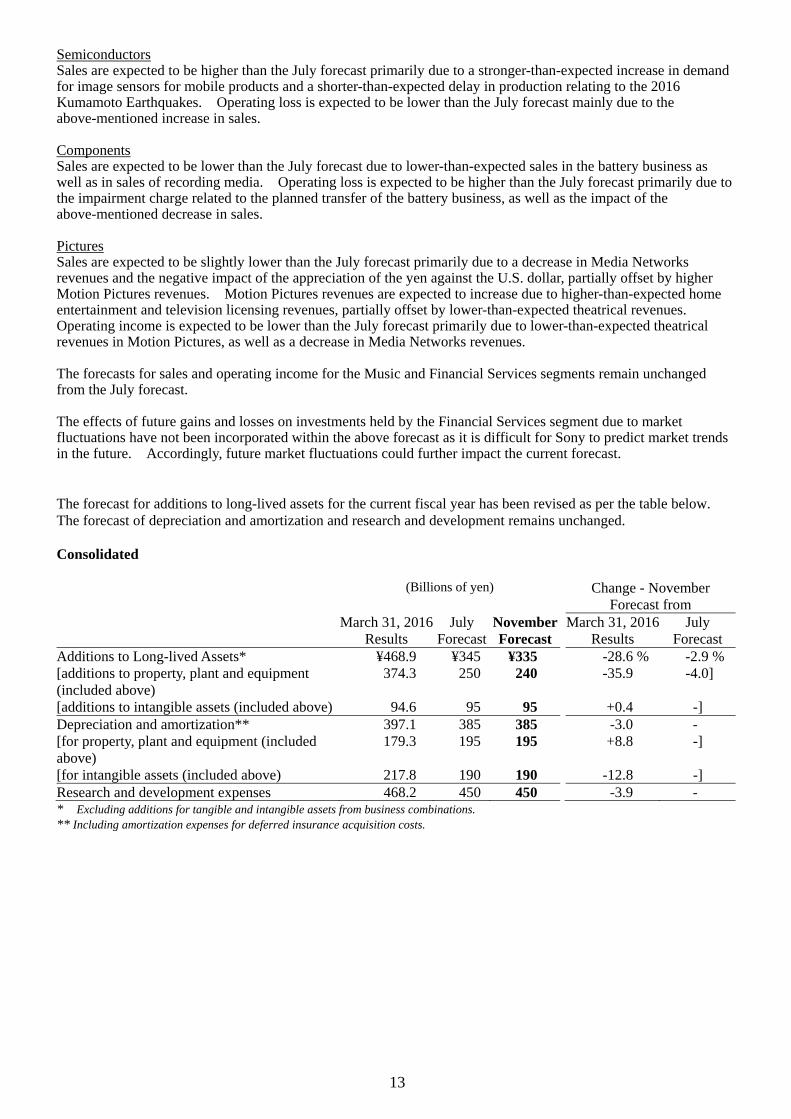
Semiconductors Sales are expected to be higher than the July forecast primarily due to a stronger-than-expected increase in demand for image sensors for mobile products and a shorter-than-expected delay in production relating to the 2016 Kumamoto Earthquakes. Operating loss is expected to be lower than the July forecast mainly due to the above-mentioned increase in sales. Components Sales are expected to be lower than the July forecast due to lower-than-expected sales in the battery business as well as in sales of recording media. Operating loss is expected to be higher than the July forecast primarily due to the impairment charge related to the planned transfer of the battery business, as well as the impact of the above-mentioned decrease in sales. Pictures Sales are expected to be slightly lower than the July forecast primarily due to a decrease in Media Networks revenues and the negative impact of the appreciation of the yen against the U.S. dollar, partially offset by higher Motion Pictures revenues. Motion Pictures revenues are expected to increase due to higher-than-expected home entertainment and television licensing revenues, partially offset by lower-than-expected theatrical revenues. Operating income is expected to be lower than the July forecast primarily due to lower-than-expected theatrical revenues in Motion Pictures, as well as a decrease in Media Networks revenues. The forecasts for sales and operating income for the Music and Financial Services segments remain unchanged from the July forecast. The effects of future gains and losses on investments held by the Financial Services segment due to market fluctuations have not been incorporated within the above forecast as it is difficult for Sony to predict market trends in the future. Accordingly, future market fluctuations could further impact the current forecast. The forecast for additions to long-lived assets for the current fiscal year has been revised as per the table below. The forecast of depreciation and amortization and research and development remains unchanged. Consolidated (Billions of yen) Change - November
Forecast from March 31, 2016
Results July
ForecastNovemberForecast
March 31, 2016 Results
July Forecast
Additions to Long-lived Assets* ¥468.9 ¥345 ¥335 -28.6 % -2.9 %[additions to property, plant and equipment (included above)
374.3 250 240 -35.9 -4.0]
[additions to intangible assets (included above) 94.6 95 95 +0.4 -] Depreciation and amortization** 397.1 385 385 -3.0 - [for property, plant and equipment (included above)
179.3 195 195 +8.8 -]
[for intangible assets (included above) 217.8 190 190 -12.8 -] Research and development expenses 468.2 450 450 -3.9 - * Excluding additions for tangible and intangible assets from business combinations. ** Including amortization expenses for deferred insurance acquisition costs.
14
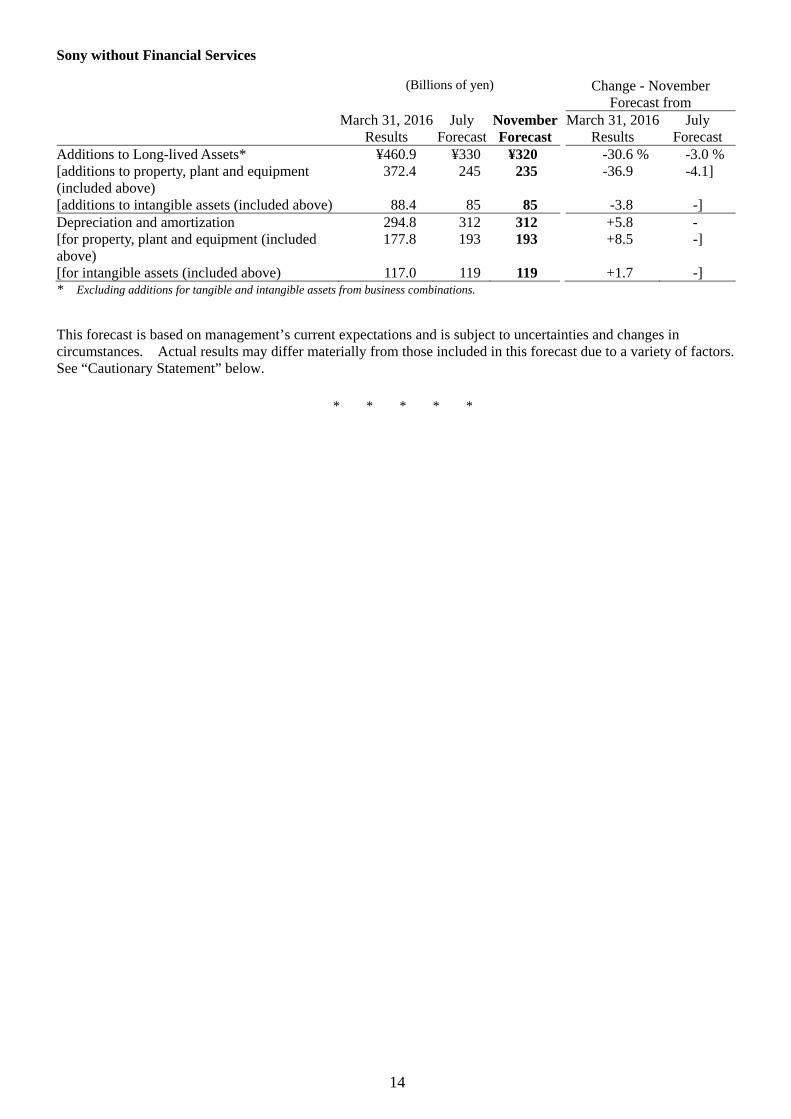
Sony without Financial Services (Billions of yen) Change - November
Forecast from March 31, 2016
Results July
ForecastNovemberForecast
March 31, 2016 Results
July Forecast
Additions to Long-lived Assets* ¥460.9 ¥330 ¥320 -30.6 % -3.0 %[additions to property, plant and equipment (included above)
372.4 245 235 -36.9 -4.1]
[additions to intangible assets (included above) 88.4 85 85 -3.8 -] Depreciation and amortization 294.8 312 312 +5.8 - [for property, plant and equipment (included above)
177.8 193 193 +8.5 -]
[for intangible assets (included above) 117.0 119 119 +1.7 -] * Excluding additions for tangible and intangible assets from business combinations. This forecast is based on management’s current expectations and is subject to uncertainties and changes in circumstances. Actual results may differ materially from those included in this forecast due to a variety of factors. See “Cautionary Statement” below.
* * * * *
15
Cautionary Statement
Statements made in this release with respect to Sony’s current plans, estimates, strategies and beliefs and other statements that are not historical facts are forward-looking statements about the future performance of Sony. Forward-looking statements include, but are not limited to, those statements using words such as “believe,” “expect,” “plans,” “strategy,” “prospects,” “forecast,” “estimate,” “project,” “anticipate,” “aim,” “intend,” “seek,” “may,” “might,” “could” or “should,” and words of similar meaning in connection with a discussion of future operations, financial performance, events or conditions. From time to time, oral or written forward-looking statements may also be included in other materials released to the public. These statements are based on management’s assumptions, judgments and beliefs in light of the information currently available to it. Sony cautions investors that a number of important risks and uncertainties could cause actual results to differ materially from those discussed in the forward-looking statements, and therefore investors should not place undue reliance on them. Investors also should not rely on any obligation of Sony to update or revise any forward-looking statements, whether as a result of new information, future events or otherwise. Sony disclaims any such obligation. Risks and uncertainties that might affect Sony include, but are not limited to: (i) the global economic environment in which Sony operates and the economic conditions in Sony’s markets, particularly levels of
consumer spending; (ii) foreign exchange rates, particularly between the yen and the U.S. dollar, the euro and other currencies in which Sony makes significant
sales and incurs production costs, or in which Sony’s assets and liabilities are denominated; (iii) Sony’s ability to continue to design and develop and win acceptance of, as well as achieve sufficient cost reductions for, its products
and services, including televisions, game and network platforms and smartphones, which are offered in highly competitive markets characterized by severe price competition and continual new product and service introductions, rapid development in technology and subjective and changing consumer preferences;
(iv) Sony’s ability and timing to recoup large-scale investments required for technology development and production capacity; (v) Sony’s ability to implement successful business restructuring and transformation efforts under changing market conditions; (vi) Sony’s ability to implement successful hardware, software, and content integration strategies for all segments excluding the Financial
Services segment, and to develop and implement successful sales and distribution strategies in light of the Internet and other technological developments;
(vii) Sony’s continued ability to devote sufficient resources to research and development and, with respect to capital expenditures, to prioritize investments correctly (particularly in the electronics businesses);
(viii) Sony’s ability to maintain product quality and customers’ satisfaction with its existing products and services; (ix) the effectiveness of Sony’s strategies and their execution, including but not limited to the success of Sony’s acquisitions, joint ventures
and other strategic investments; (x) significant volatility and disruption in the global financial markets or a ratings downgrade; (xi) Sony’s ability to forecast demands, manage timely procurement and control inventories; (xii) the outcome of pending and/or future legal and/or regulatory proceedings; (xiii) shifts in customer demand for financial services such as life insurance and Sony’s ability to conduct successful asset liability
management in the Financial Services segment; (xiv) the impact of changes in interest rates and unfavorable conditions or developments (including market fluctuations or volatility) in the
Japanese equity markets on the revenue and operating income of the Financial Services segment; (xv) Sony’s ability to anticipate and manage cybersecurity risk, including the risk of unauthorized access to Sony’s business information,
potential business disruptions or financial losses; and (xvi) risks related to catastrophic disasters or similar events. Risks and uncertainties also include the impact of any future events with material adverse impact. Investor Relations Contacts:
Tokyo New York London Atsuko Murakami Justin Hill Toshiyuki Takahashi +81-(0)3-6748-2111 +1-212-833-6722 +44-(0)1932-816-000
IR home page: https://www.sony.net/IR/ Presentation slides: https://www.sony.net/SonyInfo/IR/library/er.html

F-1
(Unaudited)Consolidated Financial StatementsConsolidated Balance Sheets
Current assets:Cash and cash equivalents \ 983,612 \ 525,181 \ -458,431 $ 5,200 Marketable securities 946,397 925,304 -21,093 9,161 Notes and accounts receivable, trade 926,375 992,120 +65,745 9,823 Allowance for doubtful accounts and sales returns (72,783) (50,110) +22,673 (496)Inventories 683,146 862,412 +179,266 8,539 Other receivables 206,058 274,015 +67,957 2,713 Deferred income taxes 40,940 50,205 +9,265 497 Prepaid expenses and other current assets 482,982 484,475 +1,493 4,797 Total current assets 4,196,727 4,063,602 -133,125 40,234
Film costs 301,228 320,936 +19,708 3,178 Investments and advances:
Affiliated companies 164,874 157,347 -7,527 1,558 Securities investments and other 9,069,209 9,491,540 +422,331 93,976
9,234,083 9,648,887 +414,804 95,534 Property, plant and equipment:
Land 121,707 117,238 -4,469 1,161 Buildings 655,379 633,558 -21,821 6,273 Machinery and equipment 1,795,991 1,796,196 +205 17,784 Construction in progress 69,286 50,818 -18,468 503
2,642,363 2,597,810 -44,553 25,721 Less-Accumulated depreciation 1,821,545 1,836,893 +15,348 18,187
820,818 760,917 -59,901 7,534 Other assets:
Intangibles, net 615,754 566,140 -49,614 5,605 Goodwill 606,290 564,803 -41,487 5,592 Deferred insurance acquisition costs 511,834 518,581 +6,747 5,134 Deferred income taxes 97,639 97,137 -502 962 Other 289,017 263,368 -25,649 2,607
2,120,534 2,010,029 -110,505 19,900 Total assets \ 16,673,390 \ 16,804,371 \ +130,981 $ 166,380
Current liabilities:Short-term borrowings \ 149,272 \ 268,597 \ +119,325 $ 2,659 Current portion of long-term debt 187,668 143,281 -44,387 1,419 Notes and accounts payable, trade 550,964 736,590 +185,626 7,293 Accounts payable, other and accrued expenses 1,367,115 1,178,353 -188,762 11,667 Accrued income and other taxes 88,865 122,139 +33,274 1,209 Deposits from customers in the banking business 1,912,673 1,980,935 +68,262 19,613 Other 574,193 483,244 -90,949 4,785 Total current liabilities 4,830,750 4,913,139 +82,389 48,645
Long-term debt 556,605 654,908 +98,303 6,484 Accrued pension and severance costs 462,384 442,813 -19,571 4,384 Deferred income taxes 450,926 435,996 -14,930 4,317 Future insurance policy benefits and other 4,509,215 4,692,263 +183,048 46,458 Policyholders’ account in the life insurance business 2,401,320 2,437,418 +36,098 24,133 Other 330,302 288,912 -41,390 2,861 Total liabilities 13,541,502 13,865,449 +323,947 137,282 Redeemable noncontrolling interest 7,478 7,452 -26 74 Equity:Sony Corporation’s stockholders’ equity:
Common stock 858,867 859,784 +917 8,513 Additional paid-in capital 1,325,719 1,267,878 -57,841 12,553 Retained earnings 936,331 949,715 +13,384 9,403 Accumulated other comprehensive income (653,318) (763,007) -109,689 (7,555)Treasury stock, at cost (4,259) (4,267) -8 (42)
2,463,340 2,310,103 -153,237 22,872 Noncontrolling interests 661,070 621,367 -39,703 6,152 Total equity 3,124,410 2,931,470 -192,940 29,024 Total liabilities and equity \ 16,673,390 \ 16,804,371 \ +130,981 $ 166,380
2016March 31, 2016
LIABILITIES AND EQUITY
ASSETS 2016 2016
(Millions of yen, millions of U.S. dollars)March 31 September 30 Change from September 30

F-2
Consolidated Statements of Income
Sales and operating revenue:Net sales \ 1,663,614 \ 1,411,918 $ 13,979 Financial services revenue 209,035 258,703 2,561 Other operating revenue 20,091 18,327 182
1,892,740 1,688,948 -10.8 % 16,722
Costs and expenses:Cost of sales 1,228,226 1,049,268 10,389 Selling, general and administrative 418,308 338,347 3,350 Financial services expenses 167,076 225,166 2,229 Other operating (income) expense, net (7,945) 31,568 312
1,805,665 1,644,349 -8.9 16,280
Equity in net income of affiliated companies 943 1,148 +21.7 11
Operating income 88,018 45,747 -48.0 453
Other income:Interest and dividends 3,664 2,130 21 Gain on sale of securities investments, net 795 - -Other 539 687 7
4,998 2,817 -43.6 28
Other expenses:Interest 6,581 4,352 43 Foreign exchange loss, net 12,602 2,425 24 Other 1,639 1,267 13
20,822 8,044 -61.4 80
Income before income taxes 72,194 40,520 -43.9 401
Income taxes 23,866 23,500 232
Net income 48,328 17,020 -64.8 169
Less - Net income attributable to noncontrolling interests 14,775 12,178 121
Net income attributable to Sony Corporation’s stockholders \ 33,553 \ 4,842 -85.6 % $ 48
Per share data:Net income attributable to Sony Corporation’s stockholders — Basic \ 26.64 \ 3.84 -85.6 % $ 0.04 — Diluted 26.10 3.76 -85.6 0.04
Net income \ 48,328 \ 17,020 -64.8 % $ 169
Other comprehensive income, net of tax –Unrealized losses on securities (10,800) (37,726) (374)Unrealized gains (losses) on derivative instruments (1,105) 405 4 Pension liability adjustment 705 2,821 28 Foreign currency translation adjustments (39,508) (16,065) (159)
Total comprehensive loss (2,380) (33,545) - (332)
Less - Comprehensive income (loss) attributable to noncontrolling interests 12,910 (5,845) (58)
Comprehensive loss attributable to Sony Corporation’s stockholders \ (15,290) \ (27,700) - % $ (274)
Consolidated Statements of Comprehensive Income(Millions of yen, millions of U.S. dollars)Three months ended September 30
2015 2016 Change from 2015 2016
(Millions of yen, millions of U.S. dollars, except per share amounts)Three months ended September 30
2015 2016 2016Change from 2015
F-3
Consolidated Statements of Income
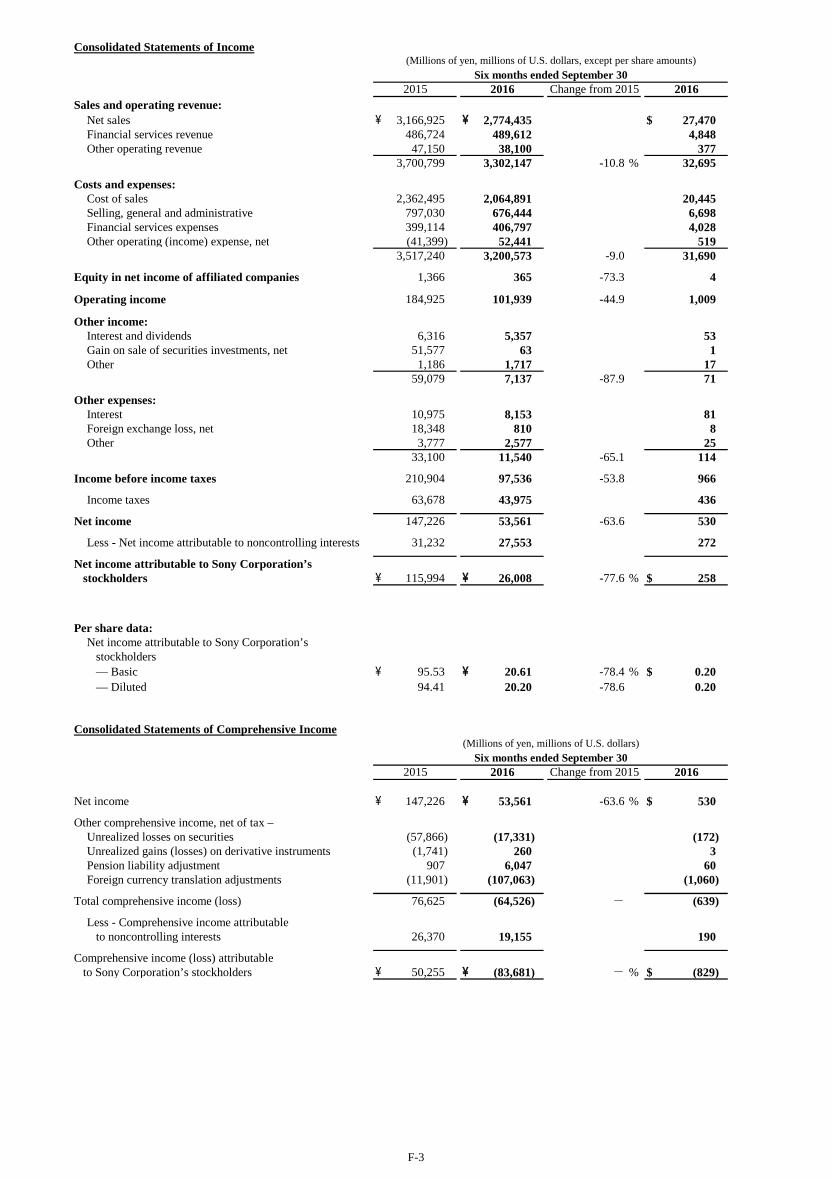
Sales and operating revenue:Net sales \ 3,166,925 \ 2,774,435 $ 27,470 Financial services revenue 486,724 489,612 4,848 Other operating revenue 47,150 38,100 377
3,700,799 3,302,147 -10.8 % 32,695
Costs and expenses:Cost of sales 2,362,495 2,064,891 20,445 Selling, general and administrative 797,030 676,444 6,698 Financial services expenses 399,114 406,797 4,028 Other operating (income) expense, net (41,399) 52,441 519
3,517,240 3,200,573 -9.0 31,690
Equity in net income of affiliated companies 1,366 365 -73.3 4
Operating income 184,925 101,939 -44.9 1,009
Other income:Interest and dividends 6,316 5,357 53 Gain on sale of securities investments, net 51,577 63 1 Other 1,186 1,717 17
59,079 7,137 -87.9 71
Other expenses:Interest 10,975 8,153 81 Foreign exchange loss, net 18,348 810 8 Other 3,777 2,577 25
33,100 11,540 -65.1 114
Income before income taxes 210,904 97,536 -53.8 966
Income taxes 63,678 43,975 436
Net income 147,226 53,561 -63.6 530
Less - Net income attributable to noncontrolling interests 31,232 27,553 272
Net income attributable to Sony Corporation’s stockholders \ 115,994 \ 26,008 -77.6 % $ 258
Per share data:Net income attributable to Sony Corporation’s stockholders — Basic \ 95.53 \ 20.61 -78.4 % $ 0.20 — Diluted 94.41 20.20 -78.6 0.20
Net income \ 147,226 \ 53,561 -63.6 % $ 530
Other comprehensive income, net of tax –Unrealized losses on securities (57,866) (17,331) (172)Unrealized gains (losses) on derivative instruments (1,741) 260 3 Pension liability adjustment 907 6,047 60 Foreign currency translation adjustments (11,901) (107,063) (1,060)
Total comprehensive income (loss) 76,625 (64,526) - (639)
Less - Comprehensive income attributable to noncontrolling interests 26,370 19,155 190
Comprehensive income (loss) attributable to Sony Corporation’s stockholders \ 50,255 \ (83,681) - % $ (829)
Consolidated Statements of Comprehensive Income(Millions of yen, millions of U.S. dollars)
Six months ended September 302015 2016 Change from 2015 2016
(Millions of yen, millions of U.S. dollars, except per share amounts)Six months ended September 30
2015 2016 Change from 2015 2016

F-4
Supplemental equity and comprehensive income information
Balance at March 31, 2015 \ 2,317,077 \ 611,392 \ 2,928,469 Issuance of new shares 301,708 - 301,708 Exercise of stock acquisition rights 1,260 - 1,260 Stock based compensation 586 - 586
Comprehensive income:Net income 115,994 31,232 147,226 Other comprehensive income, net of tax –
Unrealized losses on securities (52,865) (5,001) (57,866)Unrealized losses on derivative instruments (1,741) - (1,741)Pension liability adjustment 904 3 907 Foreign currency translation adjustments (12,037) 136 (11,901)
Total comprehensive income 50,255 26,370 76,625
Dividends declared (12,612) (18,655) (31,267)Transactions with noncontrolling interests shareholders and other (13,927) 2,548 (11,379)Balance at September 30, 2015 \ 2,644,347 \ 621,655 \ 3,266,002
Balance at March 31, 2016 \ 2,463,340 \ 661,070 \ 3,124,410 Exercise of stock acquisition rights 1,834 - 1,834 Stock based compensation 833 - 833
Comprehensive income:Net income 26,008 27,553 53,561 Other comprehensive income, net of tax –
Unrealized losses on securities (11,430) (5,901) (17,331)Unrealized gains on derivative instruments 260 - 260 Pension liability adjustment 5,959 88 6,047 Foreign currency translation adjustments (104,478) (2,585) (107,063)
Total comprehensive income (loss) (83,681) 19,155 (64,526)
Dividends declared (12,625) (16,434) (29,059)Transactions with noncontrolling interests shareholders and other (59,598) (42,424) (102,022)Balance at September 30, 2016 \ 2,310,103 \ 621,367 \ 2,931,470
Balance at March 31, 2016 $ 24,390 $ 6,545 $ 30,935 Exercise of stock acquisition rights 18 - 18 Stock based compensation 8 - 8
Comprehensive income:Net income 258 272 530 Other comprehensive income, net of tax –
Unrealized losses on securities (114) (58) (172)Unrealized gains on derivative instruments 3 - 3 Pension liability adjustment 59 1 60 Foreign currency translation adjustments (1,035) (25) (1,060)
Total comprehensive income (loss) (829) 190 (639)
Dividends declared (125) (163) (288)Transactions with noncontrolling interests shareholders and other (590) (420) (1,010)Balance at September 30, 2016 $ 22,872 $ 6,152 $ 29,024
(Millions of yen, millions of U.S. dollars)Sony Corporation’sstockholders’ equity
Noncontrollinginterests Total equity
Sony Corporation’sstockholders’ equity
Noncontrollinginterests Total equity
In September 2016, Sony obtained full ownership of its U.S.-based music publishing subsidiary by acquiring the 50% interest in the subsidiary held bya third-party investor. The aggregate cash consideration paid to the third-party investor was 750 million U.S. dollars, including 17 million U.S. dollarsof distributions to which the subsidiary previously committed. The difference between cash consideration paid and the decrease in the carrying amountof the noncontrolling interests was recognized as a decrease to additional paid-in capital of 70,642 million yen.
F-5
Consolidated Statements of Cash Flows
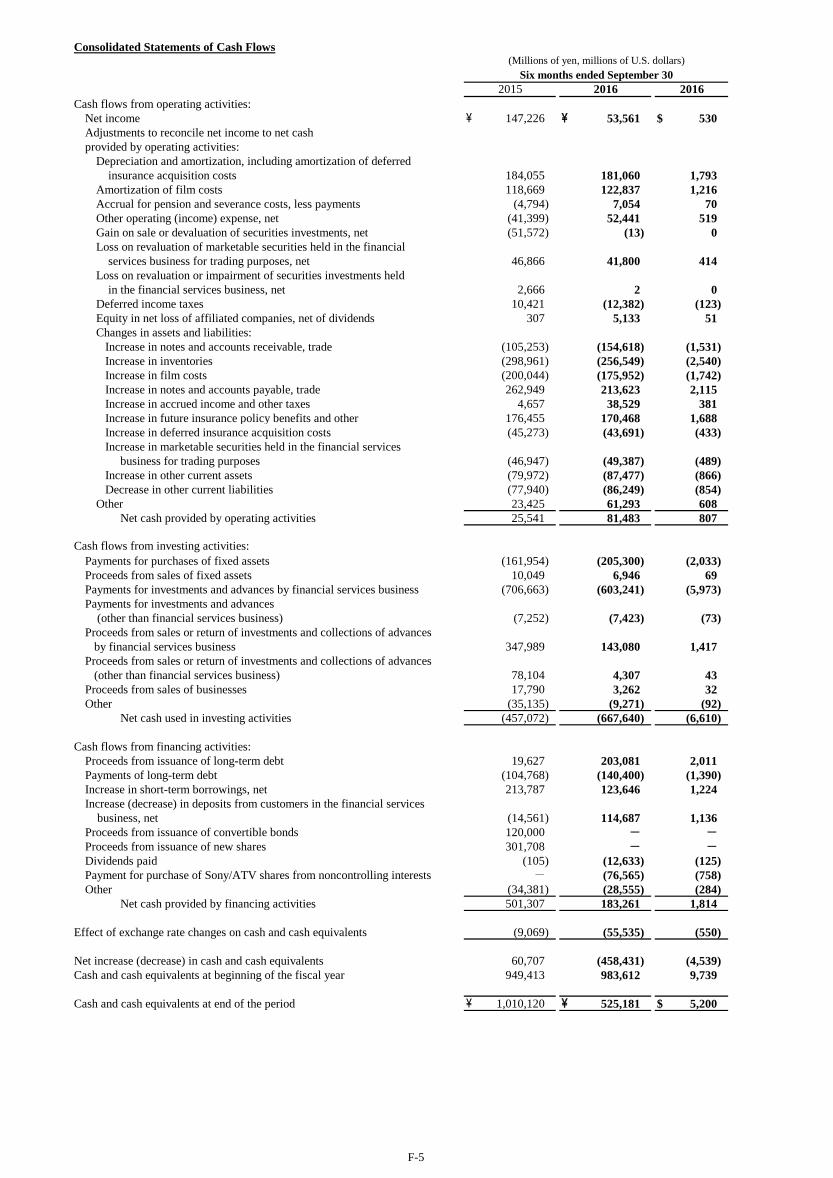
Cash flows from operating activities:Net income \ 147,226 \ 53,561 $ 530 Adjustments to reconcile net income to net cashprovided by operating activities:
Depreciation and amortization, including amortization of deferred insurance acquisition costs 184,055 181,060 1,793 Amortization of film costs 118,669 122,837 1,216 Accrual for pension and severance costs, less payments (4,794) 7,054 70 Other operating (income) expense, net (41,399) 52,441 519 Gain on sale or devaluation of securities investments, net (51,572) (13) 0Loss on revaluation of marketable securities held in the financial services business for trading purposes, net 46,866 41,800 414 Loss on revaluation or impairment of securities investments held in the financial services business, net 2,666 2 0Deferred income taxes 10,421 (12,382) (123) Equity in net loss of affiliated companies, net of dividends 307 5,133 51 Changes in assets and liabilities: Increase in notes and accounts receivable, trade (105,253) (154,618) (1,531) Increase in inventories (298,961) (256,549) (2,540) Increase in film costs (200,044) (175,952) (1,742) Increase in notes and accounts payable, trade 262,949 213,623 2,115 Increase in accrued income and other taxes 4,657 38,529 381 Increase in future insurance policy benefits and other 176,455 170,468 1,688 Increase in deferred insurance acquisition costs (45,273) (43,691) (433) Increase in marketable securities held in the financial services business for trading purposes (46,947) (49,387) (489) Increase in other current assets (79,972) (87,477) (866) Decrease in other current liabilities (77,940) (86,249) (854) Other 23,425 61,293 608 Net cash provided by operating activities 25,541 81,483 807
Cash flows from investing activities:Payments for purchases of fixed assets (161,954) (205,300) (2,033) Proceeds from sales of fixed assets 10,049 6,946 69 Payments for investments and advances by financial services business (706,663) (603,241) (5,973) Payments for investments and advances (other than financial services business) (7,252) (7,423) (73) Proceeds from sales or return of investments and collections of advances by financial services business 347,989 143,080 1,417 Proceeds from sales or return of investments and collections of advances (other than financial services business) 78,104 4,307 43 Proceeds from sales of businesses 17,790 3,262 32 Other (35,135) (9,271) (92)
Net cash used in investing activities (457,072) (667,640) (6,610)
Cash flows from financing activities:Proceeds from issuance of long-term debt 19,627 203,081 2,011 Payments of long-term debt (104,768) (140,400) (1,390) Increase in short-term borrowings, net 213,787 123,646 1,224 Increase (decrease) in deposits from customers in the financial services business, net (14,561) 114,687 1,136 Proceeds from issuance of convertible bonds 120,000 - - Proceeds from issuance of new shares 301,708 - - Dividends paid (105) (12,633) (125) Payment for purchase of Sony/ATV shares from noncontrolling interests - (76,565) (758) Other (34,381) (28,555) (284)
Net cash provided by financing activities 501,307 183,261 1,814
Effect of exchange rate changes on cash and cash equivalents (9,069) (55,535) (550)
Net increase (decrease) in cash and cash equivalents 60,707 (458,431) (4,539) Cash and cash equivalents at beginning of the fiscal year 949,413 983,612 9,739
Cash and cash equivalents at end of the period \ 1,010,120 \ 525,181 $ 5,200
(Millions of yen, millions of U.S. dollars)
2015 2016 2016Six months ended September 30

F-6
Business Segment Information
Sales and operating revenueMobile Communications
Customers \ 278,279 \ 166,814 -40.1 % $ 1,652 Intersegment 946 1,956 19 Total 279,225 168,770 -39.6 1,671
Game & Network ServicesCustomers 341,082 304,848 -10.6 3,018 Intersegment 19,600 15,032 149 Total 360,682 319,880 -11.3 3,167
Imaging Products & SolutionsCustomers 179,070 134,037 -25.1 1,327 Intersegment 1,849 1,335 13 Total 180,919 135,372 -25.2 1,340
Home Entertainment & SoundCustomers 288,201 233,901 -18.8 2,316 Intersegment 864 976 10 Total 289,065 234,877 -18.7 2,326
SemiconductorsCustomers 159,321 161,038 +1.1 1,594 Intersegment 44,536 32,710 324 Total 203,857 193,748 -5.0 1,918
ComponentsCustomers 51,405 39,566 -23.0 392 Intersegment 9,751 7,094 70 Total 61,156 46,660 -23.7 462
PicturesCustomers 183,586 192,026 +4.6 1,901 Intersegment 156 86 1 Total 183,742 192,112 +4.6 1,902
MusicCustomers 135,458 146,629 +8.2 1,452 Intersegment 3,592 3,582 35 Total 139,050 150,211 +8.0 1,487
Financial ServicesCustomers 209,035 258,703 +23.8 2,561 Intersegment 1,697 1,807 18 Total 210,732 260,510 +23.6 2,579
All OtherCustomers 60,930 42,173 -30.8 418 Intersegment 23,380 16,491 163 Total 84,310 58,664 -30.4 581
Corporate and elimination (99,998) (71,856) - (711)Consolidated total \ 1,892,740 \ 1,688,948 -10.8 % $ 16,722
Mobile Communications \ (20,601) \ 3,698 - % $ 37 Game & Network Services 23,920 18,992 -20.6 188 Imaging Products & Solutions 23,095 14,860 -35.7 147 Home Entertainment & Sound 15,763 17,556 +11.4 174 Semiconductors 34,061 (4,184) - (41)Components (1,498) (36,639) - (363)Pictures (22,466) 3,207 - 32 Music 14,261 16,515 +15.8 164 Financial Services 41,175 33,563 -18.5 332 All Other 3,057 4,246 +38.9 42 Total 110,767 71,814 -35.2 712 Corporate and elimination (22,749) (26,067) - (259)Consolidated total \ 88,018 \ 45,747 -48.0 % $ 453
(Millions of yen, millions of U.S. dollars)Three months ended September 30
2015 2016 Change 2016
The 2015 segment disclosure above has been reclassified to reflect the change in the business segment classification discussed in Note 5.Operating income (loss) is sales and operating revenue less costs and expenses, and includes equity in net income (loss) of affiliated companies.Corporate and elimination includes headquarters restructuring costs, and certain other corporate expenses, including the amortization of certainintellectual property assets such as the cross-licensing of intangible assets acquired from Ericsson at the time of the Sony Mobile Communicationsacquisition, which are not allocated to segments.Pursuant to a separation of Sony’s businesses into distinct subsidiaries and a realignment of corporate functions, beginning from the fiscal yearending March 31, 2017, a change has been made to the method of calculating the amount of corporate costs allocated to each business segment andthe amount of royalties paid by each business segment for brand and patent utilization. As a result of this change, an increase in corporate income of3,787 million yen is included in the Corporate and elimination for the three months ended September 30, 2016. Conversely, an increase (decrease)in expenses totaling the same amount is included in each of the following business segments: 591 million yen in the MC segment, (2,672) millionyen in the G&NS segment, 826 million yen in the IP&S segment, 2,653 million yen in the HE&S segment, 885 million yen in the Semiconductorssegment, 340 million yen in the Components segment, 607 million yen in the Pictures segment and 557 million yen in the Music segment. There isno change to the Financial Services segment. These changes have no impact on consolidated operating income.
Game & Network Services (“G&NS”) intersegment amounts primarily consist of transactions with All Other.Semiconductors intersegment amounts primarily consist of transactions with the Mobile Communications (“MC”) segment, the G&NS segment andthe Imaging Products & Solutions (“IP&S”) segment.All Other intersegment amounts primarily consist of transactions with the Pictures segment, the Music segment and the G&NS segment.Corporate and elimination includes certain brand and patent royalty income.
(Millions of yen, millions of U.S. dollars)Three months ended September 30
Operating income (loss) 2015 2016 Change 2016

F-7
Business Segment Information
Sales and operating revenueMobile Communications
Customers \ 557,815 \ 351,682 -37.0 % $ 3,482 Intersegment 1,934 3,011 30 Total 559,749 354,693 -36.6 3,512
Game & Network ServicesCustomers 606,980 615,616 +1.4 6,095 Intersegment 42,291 34,643 343 Total 649,271 650,259 +0.2 6,438
Imaging Products & SolutionsCustomers 342,584 254,402 -25.7 2,519 Intersegment 3,082 3,196 31 Total 345,666 257,598 -25.5 2,550
Home Entertainment & SoundCustomers 540,688 468,816 -13.3 4,642 Intersegment 1,526 1,980 19 Total 542,214 470,796 -13.2 4,661
SemiconductorsCustomers 309,827 279,311 -9.8 2,765 Intersegment 81,395 58,867 583 Total 391,222 338,178 -13.6 3,348
ComponentsCustomers 100,412 77,407 -22.9 766 Intersegment 17,830 13,389 133 Total 118,242 90,796 -23.2 899
PicturesCustomers 355,006 375,149 +5.7 3,714 Intersegment 285 280 3 Total 355,291 375,429 +5.7 3,717
MusicCustomers 262,781 285,038 +8.5 2,822 Intersegment 6,803 7,077 70 Total 269,584 292,115 +8.4 2,892
Financial ServicesCustomers 486,724 489,612 +0.6 4,848 Intersegment 3,394 3,617 35 Total 490,118 493,229 +0.6 4,883
All OtherCustomers 119,297 89,214 -25.2 883 Intersegment 42,246 29,645 294 Total 161,543 118,859 -26.4 1,177
Corporate and elimination (182,101) (139,805) - (1,382)Consolidated total \ 3,700,799 \ 3,302,147 -10.8 % $ 32,695
Mobile Communications \ (43,525) \ 4,113 - % $ 41 Game & Network Services 43,379 63,023 +45.3 624 Imaging Products & Solutions 40,826 22,366 -45.2 221 Home Entertainment & Sound 26,686 37,797 +41.6 374 Semiconductors 66,785 (47,733) - (473)Components (3,796) (41,374) - (410)Pictures (34,153) (7,433) - (74)Music 45,876 32,391 -29.4 321 Financial Services 87,147 82,110 -5.8 813 All Other 1,095 2,236 +104.2 22 Total 230,320 147,496 -36.0 1,459 Corporate and elimination (45,395) (45,557) - (450)Consolidated total \ 184,925 \ 101,939 -44.9 % $ 1,009 The 2015 segment disclosure above has been reclassified to reflect the change in the business segment classification discussed in Note 5.Operating income (loss) is sales and operating revenue less costs and expenses, and includes equity in net income (loss) of affiliated companies.Corporate and elimination includes headquarters restructuring costs, and certain other corporate expenses, including the amortization of certainintellectual property assets such as the cross-licensing of intangible assets acquired from Ericsson at the time of the Sony Mobile Communicationsacquisition, which are not allocated to segments.Pursuant to a separation of Sony’s businesses into distinct subsidiaries and a realignment of corporate functions, beginning from the fiscal yearending March 31, 2017, a change has been made to the method of calculating the amount of corporate costs allocated to each business segment andthe amount of royalties paid by each business segment for brand and patent utilization. As a result of this change, an increase in corporate income of10,290 million yen is included in the Corporate and elimination for the six months ended September 30, 2016. Conversely, an increase (decrease) inexpenses totaling the same amount is included in each of the following business segments: 1,244 million yen in the MC segment, (2,700) million yenin the G&NS segment, 1,642 million yen in the IP&S segment, 5,550 million yen in the HE&S segment, 1,657 million yen in the Semiconductorssegment, 663 million yen in the Components segment, 1,247 million yen in the Pictures segment and 987 million yen in the Music segment. Thereis no change to the Financial Services segment. These changes have no impact on consolidated operating income.
(Millions of yen, millions of U.S. dollars)
2015 2016 Change 2016Six months ended September 30
The G&NS intersegment amounts primarily consist of transactions with All Other.Semiconductors intersegment amounts primarily consist of transactions with the MC segment, the G&NS segment and the IP&S segment.All Other intersegment amounts primarily consist of transactions with the Pictures segment, the Music segment and the G&NS segment.Corporate and elimination includes certain brand and patent royalty income.
(Millions of yen, millions of U.S. dollars)Six months ended September 30
Operating income (loss) 2015 2016 Change 2016
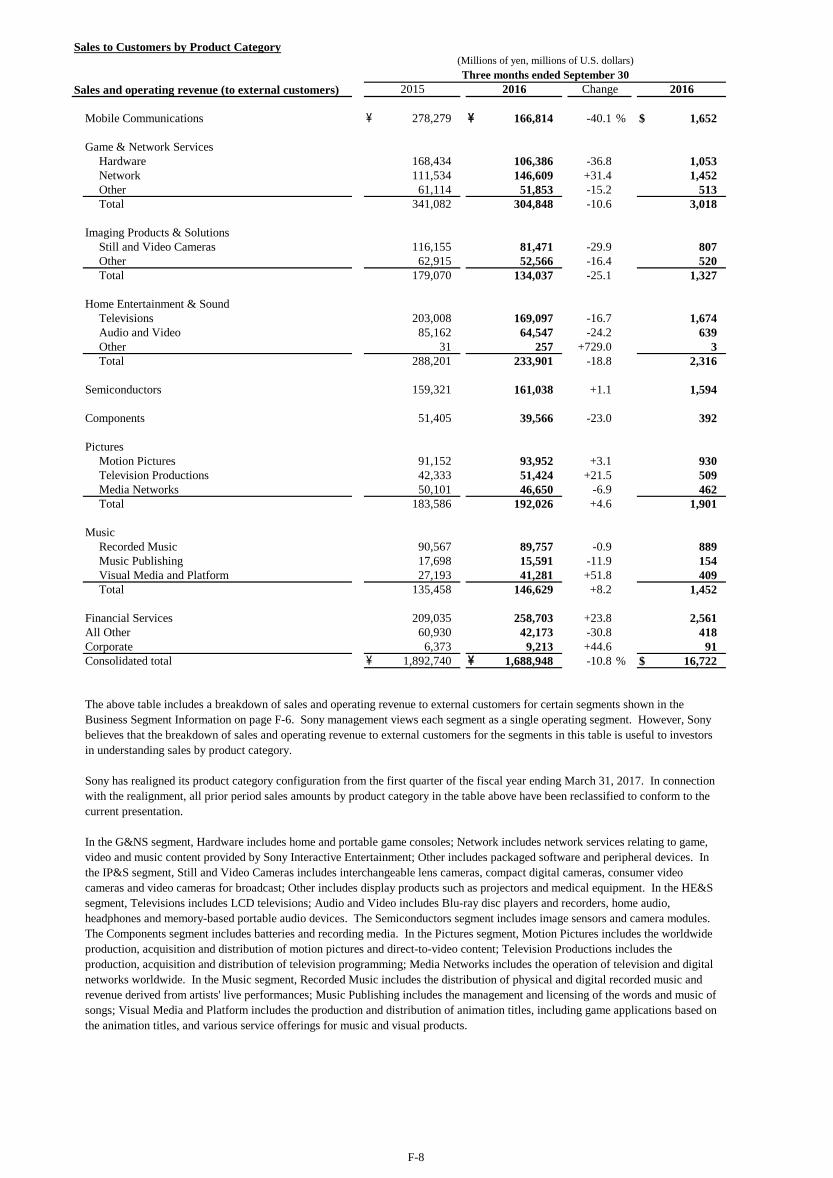
F-8
Sales to Customers by Product Category
Sales and operating revenue (to external customers)
Mobile Communications \ 278,279 \ 166,814 -40.1 % $ 1,652
Game & Network ServicesHardware 168,434 106,386 -36.8 1,053 Network 111,534 146,609 +31.4 1,452 Other 61,114 51,853 -15.2 513 Total 341,082 304,848 -10.6 3,018
Imaging Products & SolutionsStill and Video Cameras 116,155 81,471 -29.9 807 Other 62,915 52,566 -16.4 520 Total 179,070 134,037 -25.1 1,327
Home Entertainment & SoundTelevisions 203,008 169,097 -16.7 1,674 Audio and Video 85,162 64,547 -24.2 639 Other 31 257 +729.0 3 Total 288,201 233,901 -18.8 2,316
Semiconductors 159,321 161,038 +1.1 1,594
Components 51,405 39,566 -23.0 392
PicturesMotion Pictures 91,152 93,952 +3.1 930 Television Productions 42,333 51,424 +21.5 509 Media Networks 50,101 46,650 -6.9 462 Total 183,586 192,026 +4.6 1,901
MusicRecorded Music 90,567 89,757 -0.9 889 Music Publishing 17,698 15,591 -11.9 154 Visual Media and Platform 27,193 41,281 +51.8 409 Total 135,458 146,629 +8.2 1,452
Financial Services 209,035 258,703 +23.8 2,561 All Other 60,930 42,173 -30.8 418 Corporate 6,373 9,213 +44.6 91 Consolidated total \ 1,892,740 \ 1,688,948 -10.8 % $ 16,722
The above table includes a breakdown of sales and operating revenue to external customers for certain segments shown in theBusiness Segment Information on page F-6. Sony management views each segment as a single operating segment. However, Sonybelieves that the breakdown of sales and operating revenue to external customers for the segments in this table is useful to investorsin understanding sales by product category.
Sony has realigned its product category configuration from the first quarter of the fiscal year ending March 31, 2017. In connectionwith the realignment, all prior period sales amounts by product category in the table above have been reclassified to conform to thecurrent presentation.
In the G&NS segment, Hardware includes home and portable game consoles; Network includes network services relating to game,video and music content provided by Sony Interactive Entertainment; Other includes packaged software and peripheral devices. Inthe IP&S segment, Still and Video Cameras includes interchangeable lens cameras, compact digital cameras, consumer videocameras and video cameras for broadcast; Other includes display products such as projectors and medical equipment. In the HE&Ssegment, Televisions includes LCD televisions; Audio and Video includes Blu-ray disc players and recorders, home audio,headphones and memory-based portable audio devices. The Semiconductors segment includes image sensors and camera modules.The Components segment includes batteries and recording media. In the Pictures segment, Motion Pictures includes the worldwideproduction, acquisition and distribution of motion pictures and direct-to-video content; Television Productions includes theproduction, acquisition and distribution of television programming; Media Networks includes the operation of television and digitalnetworks worldwide. In the Music segment, Recorded Music includes the distribution of physical and digital recorded music andrevenue derived from artists' live performances; Music Publishing includes the management and licensing of the words and music ofsongs; Visual Media and Platform includes the production and distribution of animation titles, including game applications based onthe animation titles, and various service offerings for music and visual products.
(Millions of yen, millions of U.S. dollars)
2015 2016 Change 2016Three months ended September 30

F-9
Sales to Customers by Product Category
Sales and operating revenue (to external customers)
Mobile Communications \ 557,815 \ 351,682 -37.0 % $ 3,482
Game & Network ServicesHardware 297,899 225,551 -24.3 2,233 Network 217,335 292,167 +34.4 2,893 Other 91,746 97,898 +6.7 969 Total 606,980 615,616 +1.4 6,095
Imaging Products & SolutionsStill and Video Cameras 226,205 157,000 -30.6 1,554 Other 116,379 97,402 -16.3 965 Total 342,584 254,402 -25.7 2,519
Home Entertainment & SoundTelevisions 371,928 335,390 -9.8 3,321 Audio and Video 166,473 132,854 -20.2 1,315 Other 2,287 572 -75.0 6 Total 540,688 468,816 -13.3 4,642
Semiconductors 309,827 279,311 -9.8 2,765
Components 100,412 77,407 -22.9 766
PicturesMotion Pictures 149,327 169,274 +13.4 1,676 Television Productions 93,308 95,617 +2.5 947 Media Networks 112,371 110,258 -1.9 1,091 Total 355,006 375,149 +5.7 3,714
MusicRecorded Music 179,895 179,463 -0.2 1,777 Music Publishing 35,542 31,242 -12.1 309 Visual Media and Platform 47,344 74,333 +57.0 736 Total 262,781 285,038 +8.5 2,822
Financial Services 486,724 489,612 +0.6 4,848 All Other 119,297 89,214 -25.2 883 Corporate 18,685 15,900 -14.9 159 Consolidated total \ 3,700,799 \ 3,302,147 -10.8 % $ 32,695
The above table includes a breakdown of sales and operating revenue to external customers for certain segments shown in theBusiness Segment Information on page F-7. Sony management views each segment as a single operating segment. However, Sonybelieves that the breakdown of sales and operating revenue to external customers for the segments in this table is useful to investorsin understanding sales by product category.
Sony has realigned its product category configuration from the first quarter of the fiscal year ending March 31, 2017. In connectionwith the realignment, all prior period sales amounts by product category in the table above have been reclassified to conform to thecurrent presentation.
In the G&NS segment, Hardware includes home and portable game consoles; Network includes network services relating to game,video and music content provided by Sony Interactive Entertainment; Other includes packaged software and peripheral devices. Inthe IP&S segment, Still and Video Cameras includes interchangeable lens cameras, compact digital cameras, consumer videocameras and video cameras for broadcast; Other includes display products such as projectors and medical equipment. In the HE&Ssegment, Televisions includes LCD televisions; Audio and Video includes Blu-ray disc players and recorders, home audio,headphones and memory-based portable audio devices. The Semiconductors segment includes image sensors and camera modules.The Components segment includes batteries and recording media. In the Pictures segment, Motion Pictures includes the worldwideproduction, acquisition and distribution of motion pictures and direct-to-video content; Television Productions includes theproduction, acquisition and distribution of television programming; Media Networks includes the operation of television and digitalnetworks worldwide. In the Music segment, Recorded Music includes the distribution of physical and digital recorded music andrevenue derived from artists' live performances; Music Publishing includes the management and licensing of the words and music ofsongs; Visual Media and Platform includes the production and distribution of animation titles, including game applications based onthe animation titles, and various service offerings for music and visual products.
(Millions of yen, millions of U.S. dollars)
2015 2016 Change 2016Six months ended September 30

F-10
Other Items
Mobile Communications \ 6,011 \ 4,776 -20.5 % $ 47 Game & Network Services 4,507 6,630 +47.1 66 Imaging Products & Solutions 6,907 6,130 -11.2 61 Home Entertainment & Sound 5,806 4,617 -20.5 46 Semiconductors 24,825 26,071 +5.0 258 Components 2,705 678 -74.9 7 Pictures 5,471 4,747 -13.2 47 Music 4,624 3,686 -20.3 36 Financial Services, including deferred insurance acquisition costs 24,044 17,988 -25.2 178 All Other 1,548 1,210 -21.8 12 Total 86,448 76,533 -11.5 758 Corporate 10,586 10,970 +3.6 108 Consolidated total \ 97,034 \ 87,503 -9.8 % $ 866
Mobile Communications \ 4,033 \ 225 \ 4,258 Game & Network Services - - -Imaging Products & Solutions 16 - 16 Home Entertainment & Sound 5 - 5 Semiconductors 34 - 34 Components - - -Pictures 121 - 121 Music 258 - 258 Financial Services - - -All Other and Corporate 774 139 913 Consolidated total \ 5,241 \ 364 \ 5,605
Mobile Communications \ (295) \ 121 \ (174)Game & Network Services (104) - (104)Imaging Products & Solutions 10 - 10 Home Entertainment & Sound 1 - 1 Semiconductors - - -Components 32,833 - 32,833 Pictures 56 4 60 Music 708 - 708 Financial Services - - -All Other and Corporate (758) - (758)Consolidated total \ 32,451 \ 125 \ 32,576
Mobile Communications $ (3) $ 1 $ (2)Game & Network Services (1) - (1)Imaging Products & Solutions - - -Home Entertainment & Sound - - -Semiconductor - - -Components 325 - 325 Pictures 1 - 1 Music 7 - 7 Financial Services - - -All Other and Corporate (8) - (8)Consolidated total $ 321 $ 1 $ 322
(Millions of yen, millions of U.S. dollars)
(Millions of yen, millions of U.S. dollars)
Depreciation and amortization 2015 2016 2016ChangeThree months ended September 30
Restructuring charges and associated depreciation
Total netrestructuring
charges
Depreciationassociated with
restructuredassets
Total
Depreciation associated with restructured assets as used in the context of the disclosures regarding restructuring activities refers to the increase indepreciation expense caused by revising the useful life and the salvage value of depreciable fixed assets under an approved restructuring plan. Anyimpairment of the assets is recognized immediately in the period it is identified.
Three months ended September 30, 2016
Three months ended September 30, 2016
Restructuring charges and associated depreciation
Total netrestructuring
charges
Depreciationassociated with
restructuredassets
Three months ended September 30, 2015
Restructuring charges and associated depreciation
Total netrestructuring
charges
Depreciationassociated with
restructuredassets
Total
Total
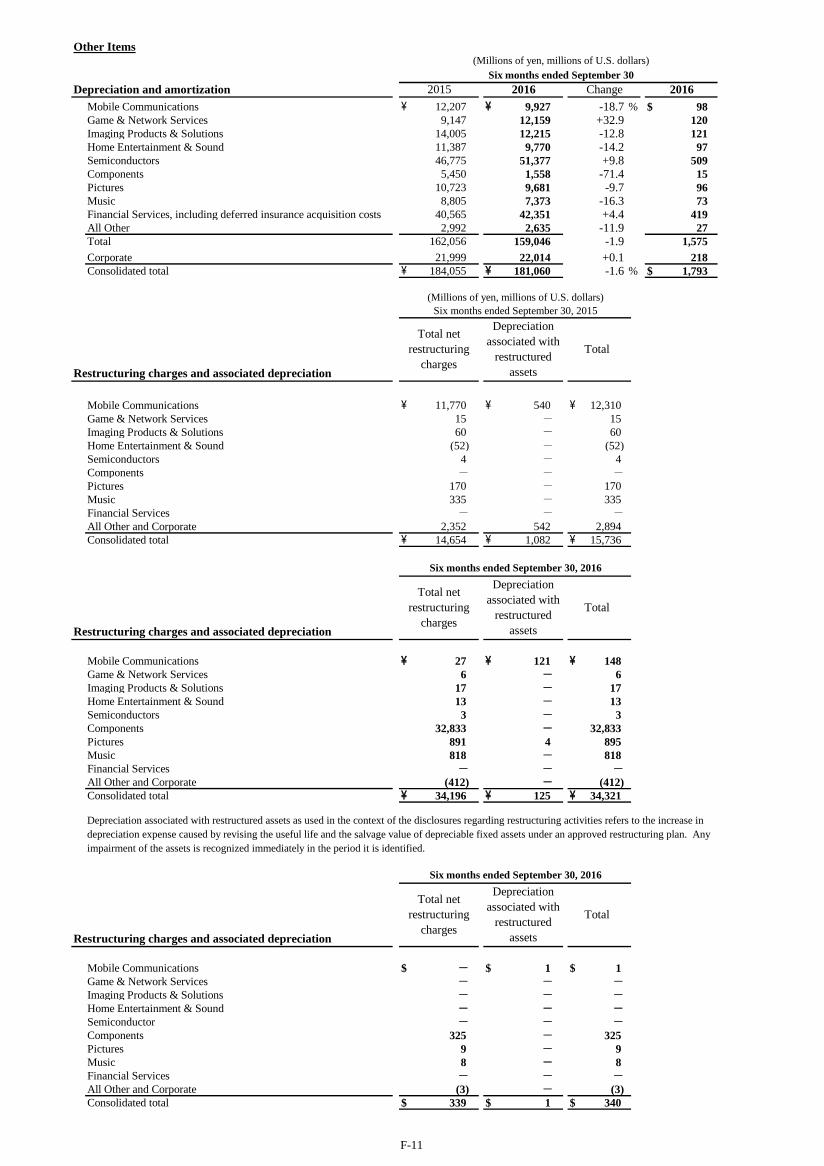
F-11
Other Items
Mobile Communications \ 12,207 \ 9,927 -18.7 % $ 98 Game & Network Services 9,147 12,159 +32.9 120 Imaging Products & Solutions 14,005 12,215 -12.8 121 Home Entertainment & Sound 11,387 9,770 -14.2 97 Semiconductors 46,775 51,377 +9.8 509 Components 5,450 1,558 -71.4 15 Pictures 10,723 9,681 -9.7 96 Music 8,805 7,373 -16.3 73 Financial Services, including deferred insurance acquisition costs 40,565 42,351 +4.4 419 All Other 2,992 2,635 -11.9 27 Total 162,056 159,046 -1.9 1,575 Corporate 21,999 22,014 +0.1 218 Consolidated total \ 184,055 \ 181,060 -1.6 % $ 1,793
Mobile Communications \ 11,770 \ 540 \ 12,310 Game & Network Services 15 - 15 Imaging Products & Solutions 60 - 60 Home Entertainment & Sound (52) - (52)Semiconductors 4 - 4 Components - - -Pictures 170 - 170 Music 335 - 335 Financial Services - - -All Other and Corporate 2,352 542 2,894 Consolidated total \ 14,654 \ 1,082 \ 15,736
Mobile Communications \ 27 \ 121 \ 148 Game & Network Services 6 - 6 Imaging Products & Solutions 17 - 17 Home Entertainment & Sound 13 - 13 Semiconductors 3 - 3 Components 32,833 - 32,833 Pictures 891 4 895 Music 818 - 818 Financial Services - - -All Other and Corporate (412) - (412)Consolidated total \ 34,196 \ 125 \ 34,321
Mobile Communications $ - $ 1 $ 1 Game & Network Services - - -Imaging Products & Solutions - - -Home Entertainment & Sound - - -Semiconductor - - -Components 325 - 325 Pictures 9 - 9 Music 8 - 8 Financial Services - - -All Other and Corporate (3) - (3)Consolidated total $ 339 $ 1 $ 340
Six months ended September 30, 2016
Restructuring charges and associated depreciation
Total netrestructuring
charges
Depreciationassociated with
restructuredassets
Total
Depreciation associated with restructured assets as used in the context of the disclosures regarding restructuring activities refers to the increase indepreciation expense caused by revising the useful life and the salvage value of depreciable fixed assets under an approved restructuring plan. Anyimpairment of the assets is recognized immediately in the period it is identified.
(Millions of yen, millions of U.S. dollars)Six months ended September 30, 2015
Restructuring charges and associated depreciation
Total netrestructuring
charges
Depreciationassociated with
restructuredassets
Total
Six months ended September 30, 2016
Restructuring charges and associated depreciation
Total netrestructuring
charges
Depreciationassociated with
restructuredassets
Total
(Millions of yen, millions of U.S. dollars)
Depreciation and amortization 2015 2016 Change 2016Six months ended September 30

F-12
Geographic Information
Sales and operating revenue (to external customers)Japan \ 495,531 \ 543,231 +9.6 % $ 5,379 United States 393,618 362,158 -8.0 3,586 Europe 435,179 343,478 -21.1 3,401 China 150,595 130,994 -13.0 1,297 Asia-Pacific 237,662 201,205 -15.3 1,992 Other Areas 180,155 107,882 -40.1 1,067 Total \ 1,892,740 \ 1,688,948 -10.8 % $ 16,722
Sales and operating revenue (to external customers)Japan \ 1,057,112 \ 1,054,642 -0.2 % $ 10,442 United States 746,011 715,772 -4.1 7,087 Europe 802,884 688,995 -14.2 6,822 China 281,296 240,067 -14.7 2,377 Asia-Pacific 476,609 392,875 -17.6 3,890 Other Areas 336,887 209,796 -37.7 2,077 Total \ 3,700,799 \ 3,302,147 -10.8 % $ 32,695
Geographic Information shows sales and operating revenue recognized by location of customers.Major countries and areas in each geographic segment excluding Japan, United States and China are as follows:
(1) Europe: United Kingdom, France, Germany, Russia, Spain and Sweden(2) Asia-Pacific: India, South Korea and Oceania(3) Other Areas: The Middle East/Africa, Brazil, Mexico and Canada
(Millions of yen, millions of U.S. dollars)
2015 2016 Change 2016Three months ended September 30
2015 2016 Change 2016Six months ended September 30

F-13
Condensed Financial Services Financial Statements
Condensed Balance Sheets
Financial Services
Current assets:Cash and cash equivalents \ 233,701 \ 195,537 $ 1,936 Marketable securities 943,195 921,998 9,129 Other 151,248 164,211 1,626
1,328,144 1,281,746 12,691
Investments and advances 9,004,981 9,446,807 93,533 Property, plant and equipment 18,047 22,013 218 Other assets:
Deferred insurance acquisition costs 511,834 518,581 5,134 Other 52,523 53,202 526
564,357 571,783 5,660 Total assets \ 10,915,529 \ 11,322,349 $ 112,102
Current liabilities:Short-term borrowings \ 93,398 \ 177,487 $ 1,757 Deposits from customers in the banking business 1,912,673 1,980,935 19,613 Other 203,161 211,138 2,090
2,209,232 2,369,560 23,460
Long-term debt 34,567 35,523 352 Future insurance policy benefits and other 4,509,215 4,692,263 46,458 Policyholders’ account in the life insurance business 2,401,320 2,437,418 24,133 Other 374,359 372,720 3,690
Total liabilities 9,528,693 9,907,484 98,093
Equity:Stockholders’ equity of Financial Services 1,385,515 1,415,199 14,012 Noncontrolling interests 1,321 (334) (3)
Total equity 1,386,836 1,414,865 14,009 Total liabilities and equity \ 10,915,529 \ 11,322,349 $ 112,102
The results of the Financial Services segment are included in Sony’s consolidated financial statements. The following schedulesshow unaudited condensed financial statements for the Financial Services segment and all other segments excluding FinancialServices. These presentations are not in accordance with accounting principles generally accepted in the United States of America(“U.S. GAAP”), which is used by Sony to prepare its consolidated financial statements. However, because the Financial Servicessegment is different in nature from Sony’s other segments, Sony believes that a comparative presentation may be useful inunderstanding and analyzing Sony’s consolidated financial statements. Transactions between the Financial Services segment andSony without the Financial Services segment, including noncontrolling interests, are included in those respective presentations, theneliminated in the consolidated figures shown below.
(Millions of yen, millions of U.S. dollars)
ASSETS
LIABILITIES AND EQUITY
2016 2016 2016March 31 September 30

F-14
Current assets:Cash and cash equivalents \ 749,911 \ 329,644 $ 3,264 Marketable securities 3,202 3,306 32 Notes and accounts receivable, trade 847,788 935,992 9,267 Other 1,272,710 1,516,930 15,020
2,873,611 2,785,872 27,583 Film costs 301,228 320,936 3,178 Investments and advances 309,184 281,416 2,786 Investments in Financial Services, at cost 111,476 126,493 1,252 Property, plant and equipment 801,485 737,618 7,304 Other assets 1,559,646 1,441,989 14,276
Total assets \ 5,956,630 \ 5,694,324 $ 56,379
Current liabilities:Short-term borrowings \ 243,543 \ 234,392 $ 2,321 Notes and accounts payable, trade 550,964 736,590 7,293 Other 1,832,039 1,576,612 15,610
2,626,546 2,547,594 25,224 Long-term debt 525,507 623,127 6,170 Accrued pension and severance costs 433,302 412,599 4,085 Other 462,319 408,026 4,039
Total liabilities 4,047,674 3,991,346 39,518 Redeemable noncontrolling interest 7,478 7,452 74 Equity:Stockholders’ equity of Sony without Financial Services 1,796,891 1,612,137 15,962 Noncontrolling interests 104,587 83,389 825
Total equity 1,901,478 1,695,526 16,787 Total liabilities and equity \ 5,956,630 \ 5,694,324 $ 56,379
Current assets:Cash and cash equivalents \ 983,612 \ 525,181 $ 5,200 Marketable securities 946,397 925,304 9,161 Notes and accounts receivable, trade 853,592 942,010 9,327 Other 1,413,126 1,671,107 16,546
4,196,727 4,063,602 40,234 Film costs 301,228 320,936 3,178 Investments and advances 9,234,083 9,648,887 95,534 Property, plant and equipment 820,818 760,917 7,534 Other assets:
Deferred insurance acquisition costs 511,834 518,581 5,134 Other 1,608,700 1,491,448 14,766
2,120,534 2,010,029 19,900 Total assets \ 16,673,390 \ 16,804,371 $ 166,380
Current liabilities:Short-term borrowings \ 336,940 \ 411,878 $ 4,078 Notes and accounts payable, trade 550,964 736,590 7,293 Deposits from customers in the banking business 1,912,673 1,980,935 19,613 Other 2,030,173 1,783,736 17,661
4,830,750 4,913,139 48,645 Long-term debt 556,605 654,908 6,484 Accrued pension and severance costs 462,384 442,813 4,384 Future insurance policy benefits and other 4,509,215 4,692,263 46,458 Policyholders’ account in the life insurance business 2,401,320 2,437,418 24,133 Other 781,228 724,908 7,178
Total liabilities 13,541,502 13,865,449 137,282 Redeemable noncontrolling interest 7,478 7,452 74 Equity:Sony Corporation’s stockholders’ equity 2,463,340 2,310,103 22,872 Noncontrolling interests 661,070 621,367 6,152
Total equity 3,124,410 2,931,470 29,024 Total liabilities and equity \ 16,673,390 \ 16,804,371 $ 166,380
2016
(Millions of yen, millions of U.S. dollars)
2016 2016 2016March 31
March 31(Millions of yen, millions of U.S. dollars)
September 302016 2016
September 30Sony without Financial Services
ASSETS
LIABILITIES AND EQUITY
ASSETS
LIABILITIES AND EQUITY
Consolidated

F-15
Condensed Statements of Income
Financial services revenue \ 210,732 \ 260,510 +23.6 % $ 2,579 Financial services expenses 168,775 227,032 +34.5 2,248 Equity in net income (loss) of affiliated companies (782) 85 - 1 Operating income 41,175 33,563 -18.5 332 Other income (expenses), net - - - -Income before income taxes 41,175 33,563 -18.5 332 Income taxes and other 12,199 9,989 -18.1 99 Net income of Financial Services \ 28,976 \ 23,574 -18.6 % $ 233
Net sales and operating revenue \ 1,685,275 \ 1,432,037 -15.0 % $ 14,179 Costs and expenses 1,640,158 1,420,916 -13.4 14,068 Equity in net income of affiliated companies 1,725 1,063 -38.4 10 Operating income 46,842 12,184 -74.0 121 Other income (expenses), net (15,824) (5,227) - (52)Income before income taxes 31,018 6,957 -77.6 69 Income taxes and other 14,829 16,604 +12.0 165 Net income (loss) of Sony without Financial Services \ 16,189 \ (9,647) - % $ (96)
Financial services revenue \ 209,035 \ 258,703 +23.8 % $ 2,561 Net sales and operating revenue 1,683,705 1,430,245 -15.1 14,161
1,892,740 1,688,948 -10.8 16,722 Costs and expenses 1,805,665 1,644,349 -8.9 16,280 Equity in net income of affiliated companies 943 1,148 +21.7 11 Operating income 88,018 45,747 -48.0 453 Other income (expenses), net (15,824) (5,227) - (52)Income before income taxes 72,194 40,520 -43.9 401 Income taxes and other 38,641 35,678 -7.7 353 Net income attributable to Sony Corporation’s stockholders \ 33,553 \ 4,842 -85.6 % $ 48
(Millions of yen, millions of U.S. dollars)Three months ended September 30
2016
(Millions of yen, millions of U.S. dollars)
(Millions of yen, millions of U.S. dollars)Three months ended September 30
Change 2016
Change
Three months ended September 30
Consolidated 2015 2016 Change 2016
Sony without Financial Services 2015 2016
Financial Services 2015 2016
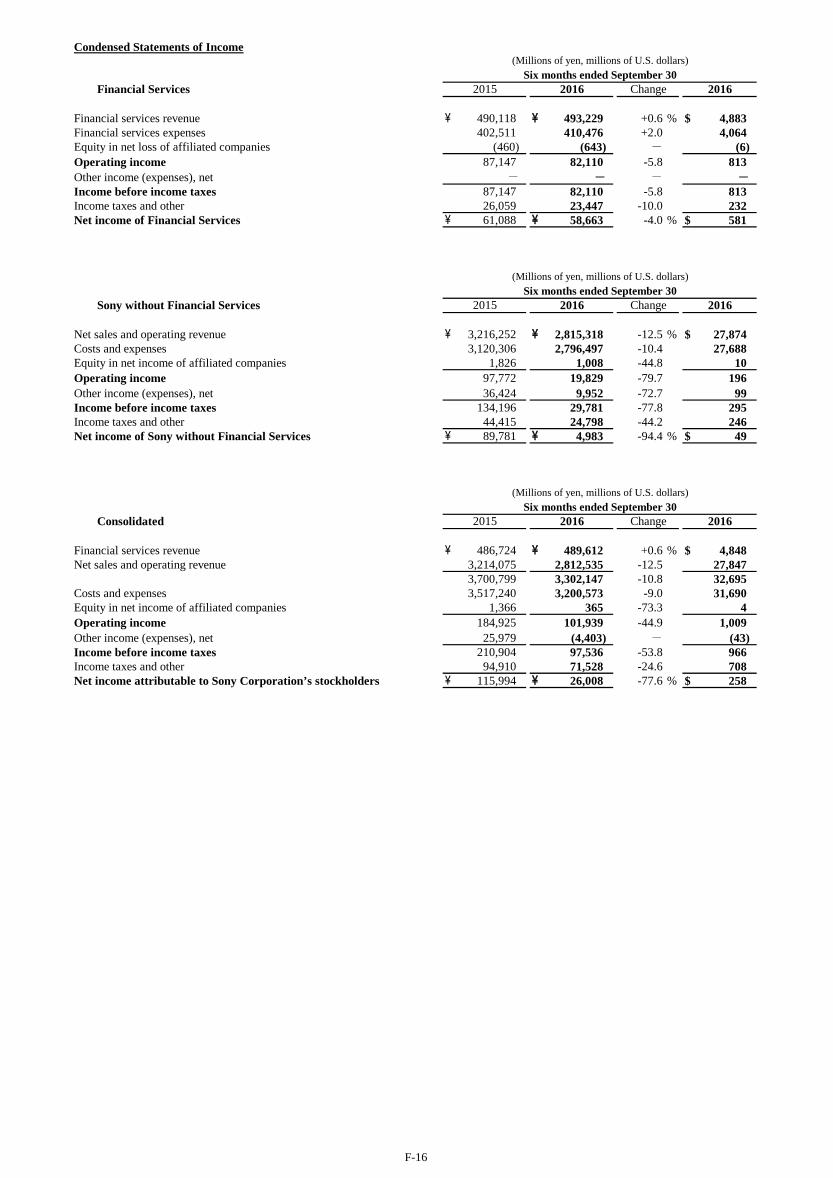
F-16
Condensed Statements of Income
Financial services revenue \ 490,118 \ 493,229 +0.6 % $ 4,883 Financial services expenses 402,511 410,476 +2.0 4,064 Equity in net loss of affiliated companies (460) (643) - (6)Operating income 87,147 82,110 -5.8 813 Other income (expenses), net - - - -Income before income taxes 87,147 82,110 -5.8 813 Income taxes and other 26,059 23,447 -10.0 232 Net income of Financial Services \ 61,088 \ 58,663 -4.0 % $ 581
Net sales and operating revenue \ 3,216,252 \ 2,815,318 -12.5 % $ 27,874 Costs and expenses 3,120,306 2,796,497 -10.4 27,688 Equity in net income of affiliated companies 1,826 1,008 -44.8 10 Operating income 97,772 19,829 -79.7 196 Other income (expenses), net 36,424 9,952 -72.7 99 Income before income taxes 134,196 29,781 -77.8 295 Income taxes and other 44,415 24,798 -44.2 246 Net income of Sony without Financial Services \ 89,781 \ 4,983 -94.4 % $ 49
Financial services revenue \ 486,724 \ 489,612 +0.6 % $ 4,848 Net sales and operating revenue 3,214,075 2,812,535 -12.5 27,847
3,700,799 3,302,147 -10.8 32,695 Costs and expenses 3,517,240 3,200,573 -9.0 31,690 Equity in net income of affiliated companies 1,366 365 -73.3 4 Operating income 184,925 101,939 -44.9 1,009 Other income (expenses), net 25,979 (4,403) - (43)Income before income taxes 210,904 97,536 -53.8 966 Income taxes and other 94,910 71,528 -24.6 708 Net income attributable to Sony Corporation’s stockholders \ 115,994 \ 26,008 -77.6 % $ 258
(Millions of yen, millions of U.S. dollars)Six months ended September 30
Consolidated 2015 2016 Change 2016
(Millions of yen, millions of U.S. dollars)Six months ended September 30
Sony without Financial Services 2015 2016 Change 2016
(Millions of yen, millions of U.S. dollars)
Financial Services 2015 2016 Change 2016Six months ended September 30
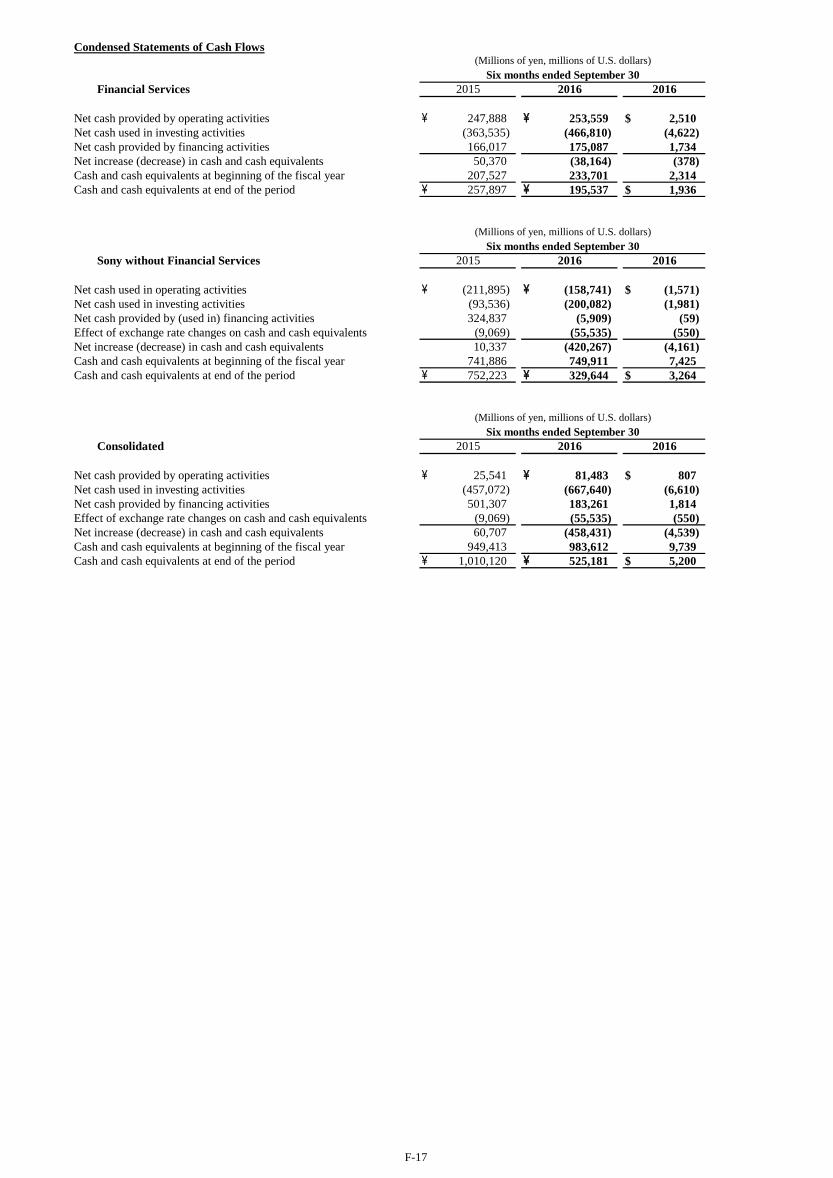
F-17
Condensed Statements of Cash Flows
Net cash provided by operating activities \ 247,888 \ 253,559 $ 2,510 Net cash used in investing activities (363,535) (466,810) (4,622)Net cash provided by financing activities 166,017 175,087 1,734 Net increase (decrease) in cash and cash equivalents 50,370 (38,164) (378)Cash and cash equivalents at beginning of the fiscal year 207,527 233,701 2,314 Cash and cash equivalents at end of the period \ 257,897 \ 195,537 $ 1,936
Net cash used in operating activities \ (211,895) \ (158,741) $ (1,571)Net cash used in investing activities (93,536) (200,082) (1,981)Net cash provided by (used in) financing activities 324,837 (5,909) (59)Effect of exchange rate changes on cash and cash equivalents (9,069) (55,535) (550)Net increase (decrease) in cash and cash equivalents 10,337 (420,267) (4,161)Cash and cash equivalents at beginning of the fiscal year 741,886 749,911 7,425 Cash and cash equivalents at end of the period \ 752,223 \ 329,644 $ 3,264
Net cash provided by operating activities \ 25,541 \ 81,483 $ 807 Net cash used in investing activities (457,072) (667,640) (6,610)Net cash provided by financing activities 501,307 183,261 1,814 Effect of exchange rate changes on cash and cash equivalents (9,069) (55,535) (550)Net increase (decrease) in cash and cash equivalents 60,707 (458,431) (4,539)Cash and cash equivalents at beginning of the fiscal year 949,413 983,612 9,739 Cash and cash equivalents at end of the period \ 1,010,120 \ 525,181 $ 5,200
(Millions of yen, millions of U.S. dollars)Six months ended September 30
(Millions of yen, millions of U.S. dollars)
2016 2016Six months ended September 30
Consolidated
2016
2015 2016 2016
20162015
Financial Services
Six months ended September 30(Millions of yen, millions of U.S. dollars)
2015
Sony without Financial Services
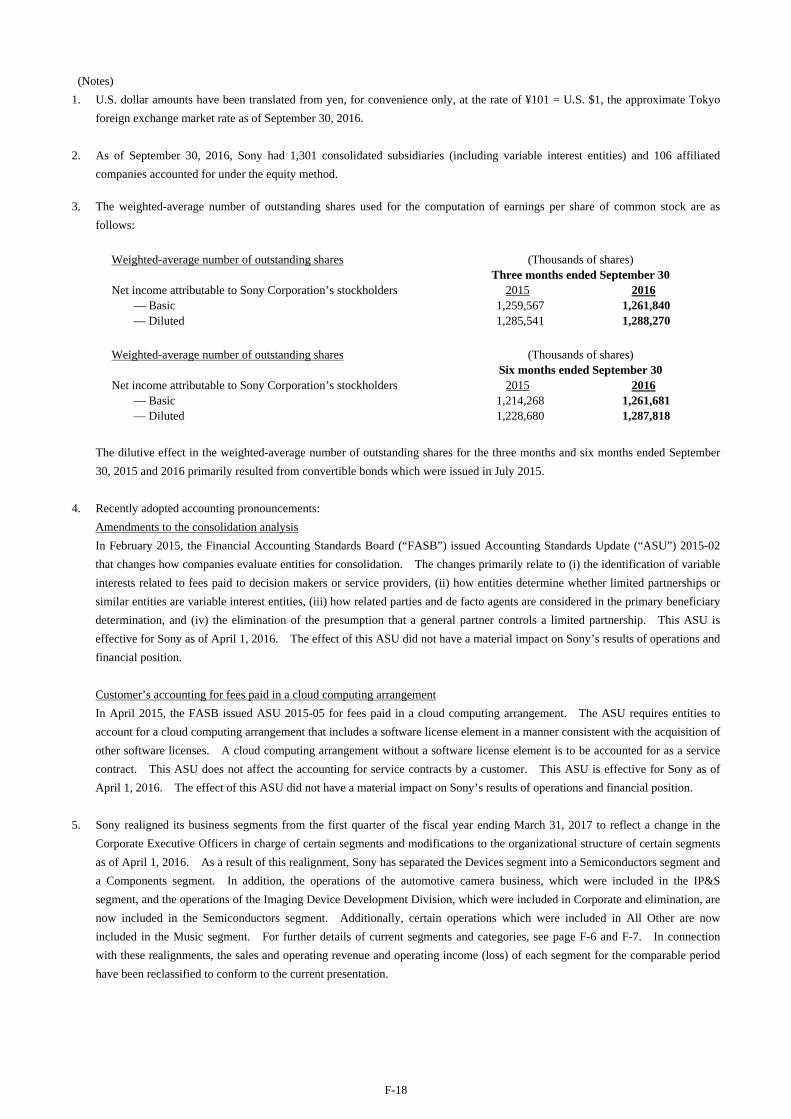
F-18
(Notes) 1. U.S. dollar amounts have been translated from yen, for convenience only, at the rate of ¥101 = U.S. $1, the approximate Tokyo
foreign exchange market rate as of September 30, 2016. 2. As of September 30, 2016, Sony had 1,301 consolidated subsidiaries (including variable interest entities) and 106 affiliated
companies accounted for under the equity method.
3. The weighted-average number of outstanding shares used for the computation of earnings per share of common stock are as follows:
Weighted-average number of outstanding shares (Thousands of shares) Three months ended September 30 Net income attributable to Sony Corporation’s stockholders 2015 2016
— Basic 1,259,567 1,261,840 — Diluted 1,285,541 1,288,270
Weighted-average number of outstanding shares (Thousands of shares) Six months ended September 30 Net income attributable to Sony Corporation’s stockholders 2015 2016
— Basic 1,214,268 1,261,681 — Diluted 1,228,680 1,287,818
The dilutive effect in the weighted-average number of outstanding shares for the three months and six months ended September 30, 2015 and 2016 primarily resulted from convertible bonds which were issued in July 2015.
4. Recently adopted accounting pronouncements: Amendments to the consolidation analysis In February 2015, the Financial Accounting Standards Board (“FASB”) issued Accounting Standards Update (“ASU”) 2015-02 that changes how companies evaluate entities for consolidation. The changes primarily relate to (i) the identification of variable interests related to fees paid to decision makers or service providers, (ii) how entities determine whether limited partnerships or similar entities are variable interest entities, (iii) how related parties and de facto agents are considered in the primary beneficiary determination, and (iv) the elimination of the presumption that a general partner controls a limited partnership. This ASU is effective for Sony as of April 1, 2016. The effect of this ASU did not have a material impact on Sony’s results of operations and financial position. Customer’s accounting for fees paid in a cloud computing arrangement In April 2015, the FASB issued ASU 2015-05 for fees paid in a cloud computing arrangement. The ASU requires entities to account for a cloud computing arrangement that includes a software license element in a manner consistent with the acquisition of other software licenses. A cloud computing arrangement without a software license element is to be accounted for as a service contract. This ASU does not affect the accounting for service contracts by a customer. This ASU is effective for Sony as of April 1, 2016. The effect of this ASU did not have a material impact on Sony’s results of operations and financial position.
5. Sony realigned its business segments from the first quarter of the fiscal year ending March 31, 2017 to reflect a change in the Corporate Executive Officers in charge of certain segments and modifications to the organizational structure of certain segments as of April 1, 2016. As a result of this realignment, Sony has separated the Devices segment into a Semiconductors segment and a Components segment. In addition, the operations of the automotive camera business, which were included in the IP&S segment, and the operations of the Imaging Device Development Division, which were included in Corporate and elimination, are now included in the Semiconductors segment. Additionally, certain operations which were included in All Other are now included in the Music segment. For further details of current segments and categories, see page F-6 and F-7. In connection with these realignments, the sales and operating revenue and operating income (loss) of each segment for the comparable period have been reclassified to conform to the current presentation.

F-19
6. Sony estimates the annual effective tax rate ("ETR") derived from a projected annual net income before taxes and calculates the interim period income tax provision based on the year-to-date income tax provision computed by applying the ETR to the year-to-date net income before taxes at the end of each interim period. The income tax provision based on the ETR reflects anticipated income tax credits and net operating loss carryforwards; however, it excludes the income tax provision related to significant unusual or extraordinary transactions. Such income tax provision is separately reported from the provision based on the ETR in the interim period in which it occurs.
7. Certain reclassifications of the financial statements and accompanying footnotes for the three and six months ended September 30, 2015 have been made to conform to the presentation for the three and six months ended September 30, 2016.
Other Consolidated Financial Data
(Millions of yen, millions of U.S. dollars) Three months ended September 30 2015 2016 2016 Additions to Long-lived Assets* ¥ 115,841 ¥ 69,307 $ 686 (Property, plant and equipment) (98,580) (47,054) (466) (Intangible assets) (17,261) (22,253) (220) Depreciation and amortization expenses** 97,034 87,503 866 (Property, plant and equipment) (44,455) (41,993) (416) (Intangible assets) (52,579) (45,510) (450) Research and development expenses 114,269 106,157 1,051
(Millions of yen, millions of U.S. dollars) Six months ended September 30 2015 2016 2016 Additions to Long-lived Assets* ¥ 209,602 ¥ 135,328 $ 1,340 (Property, plant and equipment) (176,065) (96,440) (955) (Intangible assets) (33,537) (38,888) (385) Depreciation and amortization expenses** 184,055 181,060 1,793 (Property, plant and equipment) (86,386) (84,454) (836) (Intangible assets) (97,669) (96,606) (957) Research and development expenses 225,580 216,335 2,142
* Excluding additions for tangible and intangible assets from business combinations. ** Including amortization expenses for deferred insurance acquisition costs.
Subsequent events On October 31, 2016, Sony Corporation and Murata Manufacturing Co., Ltd. signed a binding definitive agreement to transfer the Sony Group's battery business to the Murata Group ("Transfer"). Sony and Murata are aiming to complete the Transfer by early April 2017, subject to required regulatory approvals and other conditions. The price of the Transfer is approximately 17,500 million yen. The transfer proceeds are subject to the finalization of certain post-closing conditions and adjustments. Sony classified certain assets and liabilities related to the battery business as held for sale and, as a result of the fair value valuation, recorded impairment losses of 32,833 million yen in other operating expense, net in the consolidated statements of income for both the three and six months ended September 30, 2016.