new zealand international education snapshot: 2014 … · new zealand international education...
TRANSCRIPT

New Zealand International Education Snapshot: 2014 January–August Report
1 | P a g e
Snapshot Report cover:
NEW ZEALAND INTERNATIONAL EDUCATION SNAPSHOT
2014 JANUARY–AUGUST REPORT

New Zealand International Education Snapshot: 2014 January–August Report
2 | P a g e
Introduction – building a sustainable industry
The strong performance of New Zealand’s international education industry throughout 2014 has
consolidated its place as a vital contributor to the country’s export-led economic growth and our
international connectedness.
With the growth we are seeing across most parts of the sector, the industry has rebounded from the
major setbacks of the global financial crisis and the Christchurch earthquakes. To have achieved that
milestone by now is no small achievement.
The benefits are not just short-term, showing up in current economic indicators. The international
connections that the education industry builds for New Zealand are invaluable. The students who
study in New Zealand each year form lifetime friendships, networks and affinities that will stay with
them – and benefit New Zealand – throughout their careers.
We need, however, to be certain that the sector has the ability to keep growing and contributing to
New Zealand. The challenge is not just to ensure continued growth in 2015, but to ensure a long-
term, sustainable industry.
The global market for international education is intensely competitive, and growing more so. New
Zealand has built a strong brand based on the quality of our education and the overall New Zealand
experience. New Zealand education providers know they must continue to focus on quality, while
being innovate and flexible to stay competitive – whether their services are delivered on-line, in the
New Zealand environment or in a classroom on the other side of the world.
That means maintaining and growing the many areas where New Zealand is already performing well
in the highly competitive international education sector. It also means developing the new services,
products and markets that will be critical to success in the future. It’s not a case of either-or; we
have to keep performing today while prudently exploring tomorrow’s opportunities.
Grant McPherson
Chief Executive
Education New Zealand

New Zealand International Education Snapshot: 2014 January–August Report
3 | P a g e
3 | P a g e
3 | P a g e
3 | P a g e

New Zealand International Education Snapshot: 2014 January–August Report
4 | P a g e
4 | P a g e

New Zealand International Education Snapshot: 2014 January–August Report
5 | P a g e
5 | P a g e

New Zealand International Education Snapshot: 2014 January–August Report
6 | P a g e
6 | P a g e

New Zealand International Education Snapshot: 2014 January–August Report
7 | P a g e
7 | P a g e

New Zealand International Education Snapshot: 2014 January–August Report
8 | P a g e
Key trends for January–August 2014:
New Zealand’s international education industry continues to grow at record levels.
The January–August period of 2014 (Trimesters 1 & 2) saw an overall increase of 12%
(10,093) in international student enrolments when compared to the same period in 2013.
It is estimated that the value of New Zealand’s international education industry has
increased by $258m, with the industry now valued at $2.85 billion1, when compared to the
2012/13 evaluation.
It is estimated that the international education industry now supports 30,230 jobs in the
New Zealand economy, an increase of 7.3% (2,060) since 20122.
Tuition fee income for full fee-paying students grew by 13% ($83m), when compared to the
same period in 2013. While all sectors experienced tuition fee income growth, the ITP and
PTE (excluding the English Language sector) sectors saw the most significant growth ↑16%
($13.8m) and ↑35% ($40.3m).
Trimesters 1 & 2 saw strong growth from priority markets: China ↑12% (2,978), India ↑60%
(5,863), and Indonesia ↑22% (141).
There were record high levels of:
- Postgraduate level enrolments in the publicly funded tertiary sector ↑11% (1,192).
This growth was driven by Masters level enrolments ↑18% (448) and Doctoral level
enrolments ↑9% (316) - Secondary school sector enrolments ↑3% (401)
- Regional growth:
Auckland ↑15% (7,411)
Bay of Plenty ↑15% (445)
Waikato ↑7% (332) Southland ↑20% (179)
Trimesters 1 & 2 saw Canterbury region international student enrolments return close to 2011
levels, up 17% (1,109) on 2013.
1 Infometrics, The Interim Economic Impact of International Education 2014/15 2 Infometrics, The Interim Economic Impact of International Education 2014/15

New Zealand International Education Snapshot: 2014 January–August Report
9 | P a g e
This report provides a snapshot of the trends in New Zealand’s international education industry for the
2014 year to date. The report utilises information from the Export Education Levy, Single Data Return (SDR) and student visa statistics. It builds on four reports released previously: January–April 2013, January–August 2013, full year report for 2013, and January–April 2014.
Overview:
Building on the strongest first semester (T1) on record, the January–August 2014 (T1 & T2) period sees a continuation of this record level growth. With the exception of the intermediate school and wānanga sectors, the international education industry experienced the strongest T1 & T2 period on record, with the secondary school, PTE and ITP sectors having experienced record high enrolment numbers.
At the end of August 2014, there were 93,137 international students enrolled at a New Zealand education provider3. January–August 2014 saw an overall increase of 12% (10,093) in international student enrolments when compared to the same period in 2013.
The growth in international students is estimated to equate to a $258m increase to the New Zealand economy since the 2012 valuation, increasing the economic value of the international education industry to $2.85 billion4. This increase is estimated to have created an additional 2,060 jobs now totalling 30,230 jobs5.
3 This includes offshore students enrolled in a formal qualification at a university, ITP, wānanga, and government funded private training establishment (PTE). It also includes students enrolled in a non-formal qualification at a non-government funded PTE. See Appendix 1 for the breakdown and definition of international students used in this report. 4 Infometrics, The Interim Economic Impact of International Education 2014/15
5 This includes 22,176 direct and 8,055 indirect jobs
Figure 1: The number of international students in the New Zealand international education industry, 2010 - 2014
-
5,000
10,000
15,000
20,000
25,000
30,000
Primary schools(incl Intermediate)
Secondary ITP University PTEs (excl ELS) ELS
Nu
mb
er o
f en
rolm
ents
2010 2011 2012 2013 2014
Figure 1: The number of international students in the New Zealand international education
industry, 2010 - 2014

New Zealand International Education Snapshot: 2014 January–August Report
10 | P a g e
The record growth in enrolments in 2014 is also being experienced at a regional level, with Auckland (↑15%), Waikato (↑7%), Bay of Plenty (↑15%), and Southland (↑20%) when compared to 2013.
After experiencing notable declines post-Canterbury earthquakes, the Canterbury region is now experiencing strong growth. The Canterbury region saw a 17% (1,109) increase in international students, making it the second largest region of growth after Auckland, when compared to the same period in 20136.
There has been a notable shift in the number of international students increasingly enrolling in postgraduate studies, with postgraduate enrolment numbers also hitting record levels. Tertiary enrolments at postgraduate level have increased from 22% in 2010 to 26% in 2014.
Along with traditional markets such as China and India, there has been record level growth from emerging markets. France, Chile and Norway are few of the emerging markets that have experienced record level enrolments.
With first time student visa approvals at record levels, New Zealand is gaining profile and momentum in the global international education industry as a quality study destination. The development and industry launch of New Zealand’s “Think New” education brand and the delivery of global digital marketing campaigns utilising the new brand has been a key catalyst for the rise in awareness and active consideration of New Zealand by international students.
The on-going efforts to develop strategic partnerships with key stakeholders, along with developing business opportunities offshore and increasing media and promotional activities is expected to ensure the continuing growth of the international education industry contributing to the economic, social and cultural progress of New Zealand.
The future challenge for the industry will be to manage and sustain the growth experienced in T1 & T2. While T1 & T2 has seen specific markets, sectors and regions experience rapid growth, the on-going focus of Education New Zealand and the industry is to ensure that New Zealand continues to attract high quality students. As the industry experiences this growth, the purpose continues to be delivering high quality experiences and qualifications to international students.
6 In terms of absolute numbers.
All Sectors School Universities ITP
PTE
(excluding
ELS)
ELS Total PTE Total
% change in
student numbers1% 4% 16% 33% 6% 21% 12%
Total change 201 1,030 1,699 6,386 784 7,170 10,093
% change in
tuition income9% 6% 16% 35% 13% 31% 13%
Total change in
tuition income
($m)
$7.2 $17.7 $13.8 $40.3 $3.9 $44.2 $83

New Zealand International Education Snapshot: 2014 January–August Report
11 | P a g e
Analysis:
There were four key themes that emerged from the January to August period: - Growth in value - Regional growth - Growth in priority markets - Growth of emerging markets
Growth in value:
Education New Zealand (ENZ) commissioned Infometrics to conduct an interim evaluation of New Zealand’s international education industry in November 20147. The need for interim evaluation was driven by the strong growth in international students experienced in T1 & T2.
Total gross spending by international students is estimated to have risen by 10% ($250m) since 2012 to $2.75 billion8. This is estimated to lead to a 7% (2,060) increase in jobs created or supported by the growth in international students, now contributing to 30,230 jobs in the New Zealand economy.
While Chinese students continue to account for the largest proportion of the total economic value of the industry, growth in economic value is largely the result of growing Indian student numbers. The value of the Indian market grew by 72% ($181m) in the economic value, now totalling $433m.
The ITP sector was the fastest growing sector experiencing a 25% ($77m) increase in economic value, now valued at $381m. This growth sees the ITP sector now the third largest economic contributor to the international education industry (up two places behind the university and ITP sectors). The university sector saw the biggest growth in absolute value ↑11% ($102m), now valued
at $1bn, The PTE sector (excluding the ELS sector) also experienced strong growth ↑11% ($66m)
now valued at $649m. The secondary school sector saw a flat result ↓1% ($3m) and the primary
school sector experienced a 17% decline ($9m). These declines were driven by a continuing decrease in Korean students.
Regional growth:
Along with record level growth in Auckland ↑15% (7,411 student enrolments), there was notable growth in the regions in T1 & T2. Canterbury experienced the biggest growth outside of Auckland, up 17% (1,109). This increase was driven by the PTE, ITP and secondary school sectors ↑42% (819),
↑18% (153), and ↑11% (137) respectively.
While enrolment numbers have not recovered to pre-earthquake levels, T1 & T2 saw the highest enrolments numbers for Canterbury since the earthquakes. This growth sees an increased $36m in economic contribution to the regional economy when compared to 2012, with the Canterbury international education industry totalling over $230m. Stakeholder feedback indicates that the four year ENZ programme of work underpinned by government’s $5m investment in supporting industry recovery in the region is highly valued and seen as effective. The Christchurch Industry Support Programme finishes on 30 June 2015.
7 The Interim Economic Impact of International Education 2014/15 Report assumes a forecasted full-year result of 107,000 international
students. The full report can be found here: http://www.enz.govt.nz/markets-research/latest-research 8 This excludes the estimated $104m from Export Services – last evaluated in 2012/13.

New Zealand International Education Snapshot: 2014 January–August Report
12 | P a g e
The Bay of Plenty experienced record high level enrolments with a 15% (445 student enrolments) increase in student numbers in T1 & T2. This growth was driven by the ITP and PTE sectors, ↑25%
(221) and ↑10% (128). This region appears to be developing products to meet new demand, as there
has been a notable trend in enrolments at postgraduate level in ITPs. There were 120 enrolments at Honours degrees/postgraduate certificates and Masters level, this is the first year on record for enrolments at this level. As a participant in ENZ’s Regional Partnership Programme it is pleasing to
see early positive outcomes from this region.
The Waikato region saw strong growth ↑7% (332 student enrolments), making T1 & T2 2014 the
strongest on record. This growth was driven by the ITP and PTE sectors, ↑16% (149) and ↑17%
(155). The university sector stabilised after four years of consecutive declines in student enrolment with a flat result in T1 & T2.
Growth in priority markets:
There has been notable growth from China, India and Indonesia. Growth in these priority markets represents a successful 18 months of increased presence in-market, promotional activities, media coverage and other activities leveraging off the back of the launch of the Think New brand in 2013.
There has been a 12% (2,978 student enrolments) increase in Chinese students enrolling in New Zealand providers, with strong growth experienced in all sectors. University sector enrolments increased by 14% (1,153); this was driven by growth in Masters level enrolments specifically ↑39%
(409) on 2013.
The growth is attributed to a series of activities in-market over the past 18 months, including increased ENZ presence in Guangzhou and Shanghai, promotion and awareness raising activities, and development of closer government, agent, and industry ties. ENZ also launched the Odds on Campaign late in 2013, which promoted New Zealand as a study destination. This campaign reached over 73 million students.
New Zealand has experienced strong growth from India in T1 & T2 ↑60% (5,863 student enrolments), when compared to the same period in 2013. This growth has provided crucial stability for the industry during a period where mature markets, such as Korea and Malaysia, are experiencing declines. The PTE sector has benefited the most from these gains. Between 2011–2013 the PTE sector experienced an average of a 6% (-1,220) decline per annum in total enrolments, however T1 & T2 2014 results see PTE sector growth of 33% (6,386) on 2013.
Along with the November 2013 work right changes, an increase in momentum over the past 18 months in-market has also been attributed to growth in Indian students. This encompassed an intensive integrated marketing and communications campaign to amplify messaging about New Zealand as a quality education destination and partner of value. This was done through targeted activities including the strong promotion of ENZ’s “Think New” brand, the use of Stephen Fleming as an education brand ambassador to raise New Zealand’s profile, media familiarisation visits hosted in New Zealand providing an on-going series of stories about New Zealand education in India, and the launch of scholarships to attract level seven and above students has ensured continued energy in-market. The future focus of ENZ is to ensure that there is sustainable and targeted growth for all sectors from the Indian market.
Indonesia has experienced relatively strong growth in T1 & T2 2014 ↑22% (141 student enrolments). Since 2011 this market has grown on average 10% (49) per annum and has seen an additional 148 students between 2011 and 2013; however this growth has almost been equalled in T1 & T2 2014
New Zealand International Education Snapshot: 2014 January–August Report
13 | P a g e
alone. While all sectors have experienced growth from Indonesia, the majority of the increase has been experienced in the university sector ↑22 (68). Postgraduate level studies have seen the biggest
growth specifically in Masters and Doctoral level studies, ↑51% (27) and ↑29% (24). While ENZ has increased presence its in-market over the past 12 months, interest in New Zealand as a study destination is increasing with record level attendance at student recruitment fairs.
While the growth from priority markets has been crucial in the re-building the industry, the future focus for the industry will be to sustain growth in high quality students, while delivering high quality experiences and world-class qualifications.
Growth of emerging markets:
While there has been notable growth in priority markets, there have been positive shifts within emerging markets. These shifts are showing signs of diversification within New Zealand’s
international education portfolio. Brazil, Colombia, and the Philippines are a few of the markets that have seen strong growth.
Brazilian international student enrolments increased by 12% (239 student enrolments) during T1 & T2 2014. This growth was driven by the university sector, experiencing a 214% (122) increase. These positive gains are coming off the back of increased presence in-market. ENZ and New Zealand providers attended student recruitment fairs in March 2014 in Brazil which saw record level attendees, with over 16,000 students attending. ENZ has been working closely with our NZ Inc partners and industry to develop strategic partnerships with Brazilian agents, tertiary institutions and government agencies.
Sector summary:
Primary school sector:
Between 2010 and 2013 the primary school sector experienced a relatively significant decline in student numbers, declining by an average of 10% per annum. This decline was specifically driven by the Korean market, declining an average of 21% per annum during 2010–2013.
January to August 2014 saw the sector stabilise and show early signs of growth, ↑2% (20 enrolments) on 2013. The sector experienced an 11% ($465,200) increase in tuition fee revenue, when compared to the same period in 2013.
This growth is driven by China ↑81% (132 enrolments) and Thailand ↑33% (15), despite the continued decline from Korea ↓15% (-99). When removing Korean students from the overall numbers, the underlying trend is a 19% (119) increase in enrolments.
The international student body in the primary school sector has been experiencing a notable shift. In 2010 Korean students made up 74% of all international students in the primary school sector, compared to 2014 where only 43% are Korean. Though overall numbers are lower than 2010, the reduction in Korean students has been offset by growth in Chinese students now representing 23% of the student body, compared to 4% in 2010. Figure 2 below illustrates the impact of the declining Korean market on overall enrolments and the positive impact of the growth from the Chinese market.

New Zealand International Education Snapshot: 2014 January–August Report
14 | P a g e
The Bay of Plenty saw strong growth, ↑32% (34), however declines from the Otago region ↓22% (-12) offset much of this growth. All other major regions remained relatively flat on 2013. The regional growth in the primary school sector compliments ENZ’s work with 11 regions across New Zealand through its Regional Partnership Programme with the major thrust being the development and implementation of regional international education growth strategies for all sectors.
Intermediate school sector:
This sector has experienced a 25% (220) decline in student enrolments during T1 & T2, when compared to the same period in 2013.This was driven by a 32% (204) decline in Korean students. Figure 3 illustrates the impact of the Korean market on overall enrolments.
The decline in the intermediate school sector was concentrated in Auckland (26%, -175), where 73% of intermediate international students enrol. Despite this decline, the sector experienced a 2% ($41,000) increase in tuition fee income.
Figure 3: International student trends in the intermediate school sector, 2010 - 2014
-
200
400
600
800
1,000
1,200
1,400
1,600
1,800
2,000
2010 2011 2012 2013 2014
Nu
mb
er o
f st
ud
ents
Total China Korea Japan
Figure 2: International student trends in the primary school sector, 2010 - 2014
-
200
400
600
800
1,000
1,200
2010 2011 2012 2013 2014
Nu
mb
er o
f st
ud
en
ts
China Korea Total
New Zealand International Education Snapshot: 2014 January–August Report
15 | P a g e
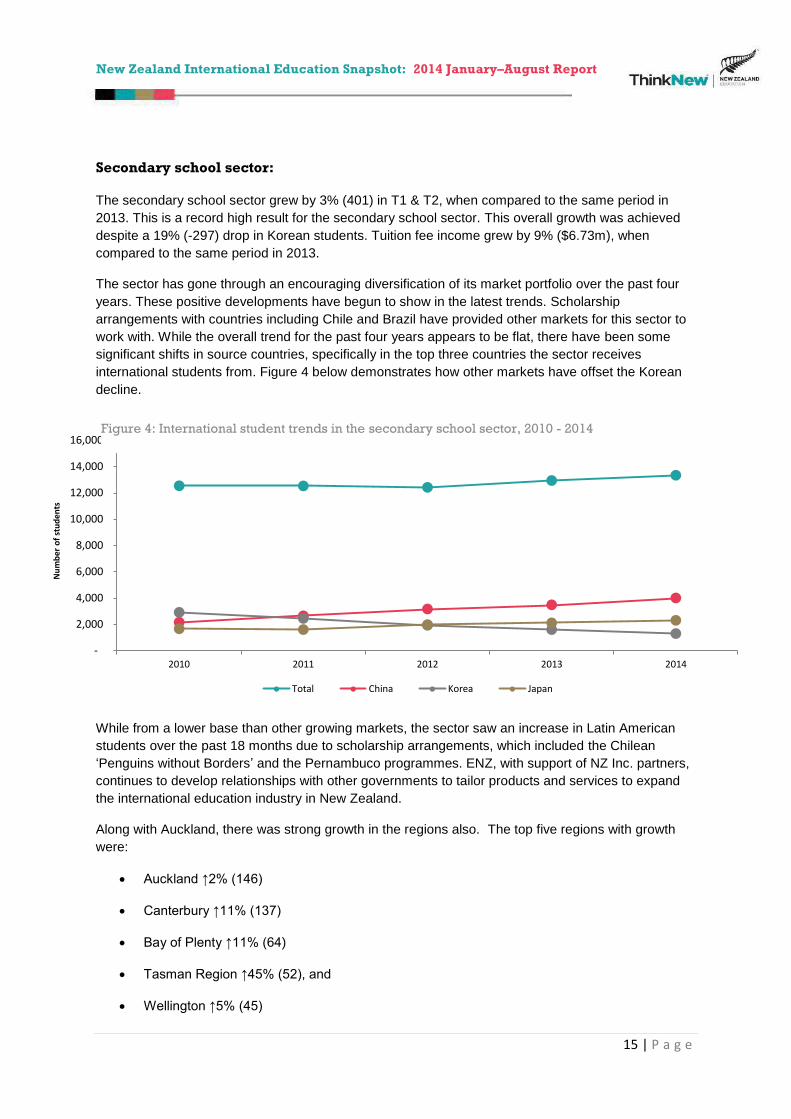
Secondary school sector:
The secondary school sector grew by 3% (401) in T1 & T2, when compared to the same period in 2013. This is a record high result for the secondary school sector. This overall growth was achieved despite a 19% (-297) drop in Korean students. Tuition fee income grew by 9% ($6.73m), when compared to the same period in 2013.
The sector has gone through an encouraging diversification of its market portfolio over the past four years. These positive developments have begun to show in the latest trends. Scholarship arrangements with countries including Chile and Brazil have provided other markets for this sector to work with. While the overall trend for the past four years appears to be flat, there have been some significant shifts in source countries, specifically in the top three countries the sector receives international students from. Figure 4 below demonstrates how other markets have offset the Korean decline.
While from a lower base than other growing markets, the sector saw an increase in Latin American students over the past 18 months due to scholarship arrangements, which included the Chilean ‘Penguins without Borders’ and the Pernambuco programmes. ENZ, with support of NZ Inc. partners, continues to develop relationships with other governments to tailor products and services to expand the international education industry in New Zealand.
Along with Auckland, there was strong growth in the regions also. The top five regions with growth were:
Auckland ↑2% (146)
Canterbury ↑11% (137)
Bay of Plenty ↑11% (64)
Tasman Region ↑45% (52), and
Wellington ↑5% (45)
-
2,000
4,000
6,000
8,000
10,000
12,000
14,000
16,000
2010 2011 2012 2013 2014
Nu
mb
er o
f st
ud
ents
Total China Korea Japan
Figure 4: International student trends in the secondary school sector, 2010 - 2014

New Zealand International Education Snapshot: 2014 January–August Report
16 | P a g e
Growth in Canterbury saw student numbers close to returning to pre-earthquake levels, and is the highest it has been since the earthquakes. Otago and the Manawatu-Wangnui regions experienced the biggest declines, down 8% (-60) and 9% (-46), respectively.
ENZ’s work with the school sector, including primary and intermediate schools, is currently focused on the establishment of a Schools International Education Business Association and a number of sector collaborative business model pilots around New Zealand.
Institutes of technology and polytechnics:
The ITP sector experienced record level enrolments numbers with a 16% (1,699 student enrolments) increase in T1 & T2, when compared to the same period in 2013. The ITP sector saw strong growth in tuition fee income ↑16% ($13.8m), when compared to the same period in 2013. This growth was driven by Chinese and Indian students ↑21% (842) and 30% (754). Figure 5 below shows how relatively flat the sector has been for the previous four years when compared to the strong growth in 2014.
The majority of ITP sector growth from the Chinese market has been at Bachelors level, ↑31% (532). Indian enrolments in certificates/diplomas 5 – 7 has recovered after four consecutive years of declines, experiencing a 39% (330) increase on 2013. This growth sees enrolments return to 2011 levels, however not to 2010 levels which was the peak. There has also been significant growth at honours/postgraduate certificate level ↑63% (139).
The biggest growth occurred at the undergraduate level, which grew by 15% (508). This growth sees the highest level of enrolments at undergraduate level in the ITP sector on record. Postgraduate qualifications have seen a significant rise in enrolments ↑33% (658).
The most popular subjects to see growth were Business and Management ↑30% (1,120 enrolments),
Accountancy ↑36% (474) and Language and Literature ↑16% (351). At the Graduate and Postgraduate level, there has been growth in Business Management, Computer Science, Information Systems, and Banking and Finance.
Trends in the ITP sector are showing signs of market and product diversification. The sector is expanding from being a vocationally focused sector to offering qualifications to meet the growing
-
2,000
4,000
6,000
8,000
10,000
12,000
14,000
2010 2011 2012 2013 2014
Nu
mb
er o
f en
rolm
ents
Total China India
Figure 5: International student trends in the ITP sector, 2010 - 2014
New Zealand International Education Snapshot: 2014 January–August Report
17 | P a g e
demand in subjects that offer transferable skills, such as Finance, Information Systems and Language and Literature.
Along with diversification of markets and products, ENZ continues to work with providers/groups that are interested in diversifying their delivery models by supporting providers on pursuing large scale commercial offshore delivery opportunities. ENZ is also working with the sector on developing a strong ITP / vocational education story to complement the New Zealand Education Story and Think New brand.
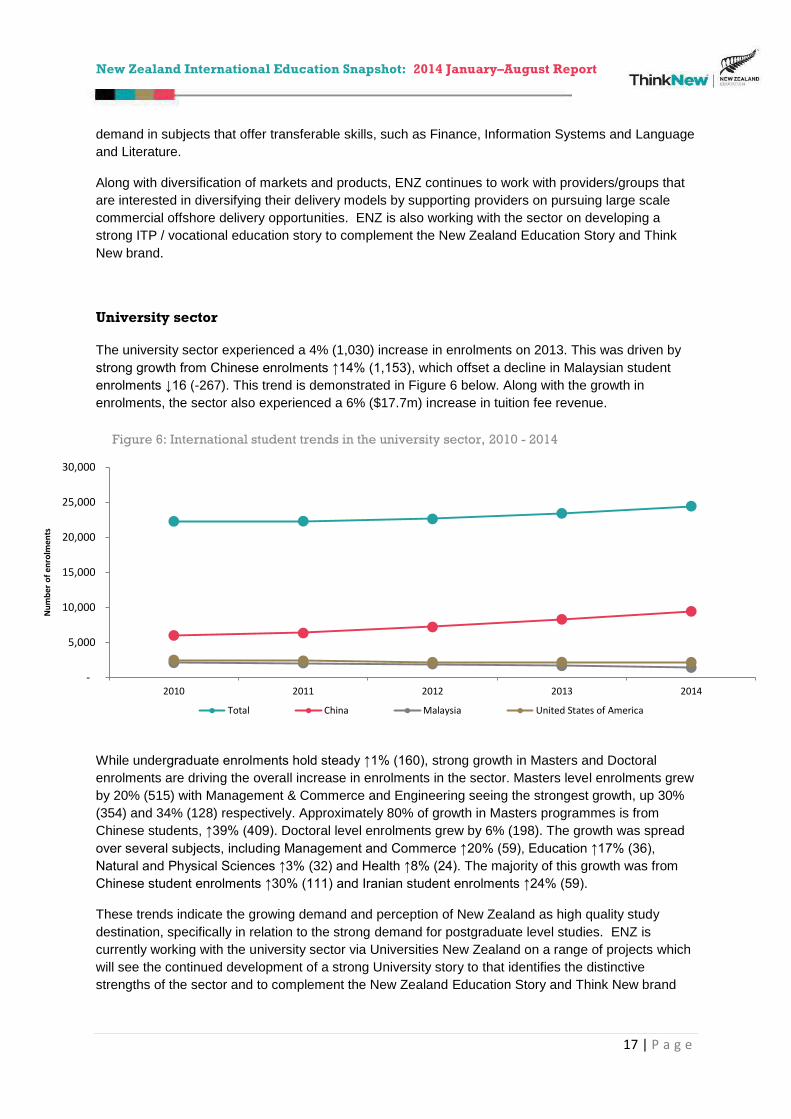
University sector
The university sector experienced a 4% (1,030) increase in enrolments on 2013. This was driven by strong growth from Chinese enrolments ↑14% (1,153), which offset a decline in Malaysian student enrolments ↓16 (-267). This trend is demonstrated in Figure 6 below. Along with the growth in enrolments, the sector also experienced a 6% ($17.7m) increase in tuition fee revenue.
While undergraduate enrolments hold steady ↑1% (160), strong growth in Masters and Doctoral enrolments are driving the overall increase in enrolments in the sector. Masters level enrolments grew by 20% (515) with Management & Commerce and Engineering seeing the strongest growth, up 30% (354) and 34% (128) respectively. Approximately 80% of growth in Masters programmes is from Chinese students, ↑39% (409). Doctoral level enrolments grew by 6% (198). The growth was spread over several subjects, including Management and Commerce ↑20% (59), Education ↑17% (36),
Natural and Physical Sciences ↑3% (32) and Health ↑8% (24). The majority of this growth was from Chinese student enrolments ↑30% (111) and Iranian student enrolments ↑24% (59).
These trends indicate the growing demand and perception of New Zealand as high quality study destination, specifically in relation to the strong demand for postgraduate level studies. ENZ is currently working with the university sector via Universities New Zealand on a range of projects which will see the continued development of a strong University story to that identifies the distinctive strengths of the sector and to complement the New Zealand Education Story and Think New brand
-
5,000
10,000
15,000
20,000
25,000
30,000
2010 2011 2012 2013 2014
Nu
mb
er o
f en
rolm
ents
Total China Malaysia United States of America
Figure 6: International student trends in the university sector, 2010 - 2014

New Zealand International Education Snapshot: 2014 January–August Report
18 | P a g e
English Language sector
The English Language sector (ELS) experienced 6% (784) growth in enrolments in T1 & T2 2014, when compared to the same period in 2013. This is a positive result as it sees a three year trend of declining student numbers reverse. This growth was driven by Thailand ↑61% (436) and China ↑6%
(121). This growth sees a 13% ($3.9m) increase in tuition fee revenue also.
PTE sector (excluding ELS sector):
After two consecutive years of declines, the PTE sector has experienced strong growth ↑33% (6,386)
on 2013. This increase has been driven by growth in Indian student enrolments up 86% (5,118). This growth resulted in a 35% ($40.3m) increase in tuition fee revenue for the sector. This is the biggest growth experienced by any sector. Figure 8 below illustrates the correlation between the growth of Indian students and the growth of the sector in 2014.
-
5,000
10,000
15,000
20,000
25,000
2010 2011 2012 2013 2014
Nu
mb
er o
f st
ud
ents
Total Japan China Korea
-
5,000
10,000
15,000
20,000
25,000
30,000
2010 2011 2012 2013 2014
Nu
mb
er o
f st
ud
en
ts
Total India China Korea
Figure 7: International student trends in the ELS sector, 2010 - 2014
Figure 8: International student trends in the PTE sector (excluding ELS), 2010 - 2014

New Zealand International Education Snapshot: 2014 January–August Report
19 | P a g e
Recent changes to work rights settings has complimented and increased the attractiveness of New Zealand’s educational offerings for international students and in particular the PTE sector. ENZ
continues to work with the industry and other NZ Inc. agencies to identify further opportunities to increase attractiveness of New Zealand via refining policy settings.
Competitor trends:
Australian student enrolment trends:
Between January–August 2014 student enrolments increased by 12% (53,646 enrolments). The biggest increases were driven by the English Language sector ↑22% (17,844) and the Higher
Education sector ↑8% (18,373).
The biggest market increases came from India, Viet Nam, and Brazil ↑28% (11,585 enrolments), ↑20% (4,362), and ↑28% (4,034).While traditional markets such as China continued to grow ↑8%
(10,247), much of the growth appeared to be driven by emerging markets such as Nepal ↑30%
(3,600), the Philippines ↑24% (1,785) and Italy ↑41% (1,696).
USA enrolment trends
Overall international tertiary student numbers for 2013/2014 were at record levels ↑8% (66,408 students) when compared to 2012/2013. Of this growth, over 80% came from three markets; China ↑17% (38,842), Saudi Arabia ↑21% (9,353) and India ↑6% (5,919). The China and Saudi Arabian growth continues strong increases seen in 2012/2013, however the Indian growth is a reversal of a three year trend of declining numbers, with reports suggesting that the growth from India will continue into the 2014/2015 academic year9.
There were declines in student numbers from traditional markets: Korea (↓4%), Taiwan (↓3%) and
Japan (↓1%).
The growth in international students sees a 12% increase in economic value for the USA international education industry and economy, now contributing $26.8bn, when compared to the previous academic year. This growth sees an 8.5% increase in jobs created, now totalling 340,000 jobs
created10.
9 http://www.business-standard.com/article/current-affairs/indian-students-studying-in-the-us-rise-by-28-114111800442_1.html 10http://www.nafsa.org/Explore_International_Education/Impact/Data_And_Statistics/The_International_Student_Economic_Value_Tool/

New Zealand International Education Snapshot: 2014 January–August Report
20 | P a g e
Outlook:
Student visa trends are a strong indicator of whether international students are entering, remaining or leaving New Zealand to study in the interim period where student enrolment data is unavailable. Student visa results for the August–November period saw strong growth, indicating a strong full-year result for 2014.
Total student visa results for August to November sees a 27% (5,267) increase in total student visa approvals. This growth is driven by India ↑72% (2,569), China ↑21% (1,227), ASEAN ↑22% (449) and
Latin America ↑74% (340). First time student visas increased by 45% (4,015) during this period also.
This result sees record level first time student visa approvals for the second and third quarter calendar year.
-
2,000
4,000
6,000
8,000
10,000
12,000
14,000
Q1 Q2 Q3 Q4
Nu
mb
er o
f fi
rst
tim
e st
ud
ent
visa
s ap
pro
ved
Overall: Total first time student visas approved quarterly 2009 - 2014
2009 2010 2011 2012 2013 2014

New Zealand International Education Snapshot: 2014 January–August Report
21 | P a g e
Future trends:
The global international education industry appears to be experiencing an increase in demand for international education, with competitor countries such as Australia, Canada and Germany also experiencing an increase in international student numbers.
The changing and complex international environment presents new challenges and opportunities, with the emergence of new markets such as the Philippines, Brazil and Chile, and changing modes of delivery. These include in-market delivery, online delivery and new qualifications such as the taught Masters degrees which tend to have high demand due to the length and quality of the courses.
In order to sustain the growth experienced in 2014 so far, New Zealand’s international education industry will need to focus on continuing to take advantage of the changing environment. Education New Zealand is working with the New Zealand education industry through the strategic roadmaps process to implement key projects designed to enhance growth prospects for the industry into the future.
New Zealand’s international presence continues to strengthen with Education New Zealand’s on-going focus on developing relationships and business prospects in-market. The November 2013 launch of the New Zealand Story, New Zealand Education Story and ‘Think New’ international education brand was crucial in supporting New Zealand’s presence in the global international education industry.
These factors, along with recent work rights changes, have begun to show strong results for New Zealand’s international education industry for 2014. It is estimated that, based on student visa results
for January to November 2014, the year end of 2014 will continue to see an increase in international student numbers and in the value of the industry.

New Zealand International Education Snapshot: 2014 January–August Report
22 | P a g e
Appendix 1: Definition and breakdown of an international student:
As part of the Economic Impact of International Education 2012/2013 study, Education New Zealand (ENZ) revised its definition of international students to align with international standards. ENZ defines international students as students who are non-residents of New Zealand who:
have entered into New Zealand expressly with the intention to study, or
have enrolled in a New Zealand provider offshore, where the educational programme is delivered in-market.
Along with full fee-paying students, the following categories have been included when measuring the economic value and performance of international education industry11:
international PhD students
exchange students
NZ AID students
foreign research post graduate students
offshore and onshore students
Data source and breakdown:
Data source Sector 2013 2014 Change on
2013 % change
Formal qualifications: Onshore and offshore:
SDR
University 23,410 24,440 1,030 4%
ITP 10,823 12,522 1,699 16%
Wānanga 13 6 - 7 -54%
SDR-PTE 9,492 11,642 2,150 23%
Full fee-paying and exchange students
Primary 1,283 1,303 20 2%
Intermediate 895 675 - 220 -25%
Secondary 12,940 13,341 401 3%
Export Education Levy: includes Subsidiaries
Non-SDR PTE 9,995 14,231 4,236 42%
English language 14,193 14,977 784 6%
Total 83,044 93,137 10,093 12%
Combined sub-sectors
Schools 15,118 15,319 201 1%
PTEs (incl ELS) 33,680 40,850 7,170 21%
11 These categories are considered to be domestic students under the Education Act 1989.