new york mortgage trust inc - corpdocs.msci.comcorpdocs.msci.com/annual/ar_2014_106633.pdf · new...
TRANSCRIPT
NEW YORK MORTGAGE TRUST INC
FORM 10-K(Annual Report)
Filed 02/27/15 for the Period Ending 12/31/14
Address 275 MADISON AVENUE
NEW YORK, NY 10016Telephone (212) 792-0107
CIK 0001273685Symbol NYMT
SIC Code 6798 - Real Estate Investment TrustsIndustry Real Estate Operations
Sector ServicesFiscal Year 12/31
http://www.edgar-online.com© Copyright 2015, EDGAR Online, Inc. All Rights Reserved.
Distribution and use of this document restricted under EDGAR Online, Inc. Terms of Use.
UNITED STATES
SECURITIES AND EXCHANGE COMMISSION
Washington, D.C. 20549
___________________
FORM 10-K
___________________
Commission File Number 001-32216
NEW YORK MORTGAGE TRUST, INC .
(Exact name of registrant as specified in its charter)
275 Madison Avenue, New York, NY 10016
(Address of principal executive office) (Zip Code) (212) 792-0107
(Registrant’s telephone number, including area code) Securities registered pursuant to Section 12(b) of the Act:
Securities registered pursuant to Section 12(g) of the Act: None
Indicate by check mark if the registrant is a well-known seasoned issuer, as defined in Rule 405 of the Securities Act.
Yes � No �
Indicate by check mark if the registrant is not required to file reports pursuant to Section 13 or Section 15(d) of the Act. Yes � No �
Indicate by check mark whether the registrant (1) has filed all reports required to be filed by Section 13 or 15(d) of the Securities Exchange
Act of 1934 during the preceding 12 months (or for such shorter period that the registrant was required to file such reports), and (2) has been subject to such filing requirements for the past 90 days. Yes � No �
Indicate by check mark whether the registrant has submitted electronically and posted on its corporate Web site, if any, every Interactive Data File required to be submitted and posted pursuant to Rule 405 of Regulation S-T (§ 232.405 of this chapter) during the preceding 12 months (or for such shorter period that the registrant was required to submit and post such files). Yes � No �
Indicate by check mark if disclosure of delinquent filers pursuant to Item 405 of Regulation S-K (§ 229.405 of this chapter) is not contained herein, and will not be contained, to the best of registrant’s knowledge, in definitive proxy or information statements incorporated by reference in Part III of this Form 10-K or any amendment to this Form 10-K. �
� ANNUAL REPORT PURSUANT TO SECTION 13 OR 15(d) OF THE SECURITIES EXCHANGE ACT OF 1934 For the Fis cal Year Ended December 31, 201 4
� TRANSITION REPORT PURSUANT TO SECTION 13 OR 15(d) OF THE SECURITIES EXCHANGE ACT OF 1934 For the Transition Period From ____________ to ____________
Maryland 47-0934168 (State or other jurisdiction of
incorporation or organization) (I.R.S. Employer
Identification No.)
Title of Each Class Name of Each Exchange on Which Registered Common Stock, par value $0.01 per share NASDAQ Stock Market
7.75% Series B Cumulative Redeemable Preferred Stock, par value $0.01 per share, $25.00 Liquidation Preference
NASDAQ Stock Market


Indicate by check mark whether the registrant is a large accelerated filer, an accelerated filer, a non-accelerated filer or a smaller reporting
company. See definitions of “large accelerated filer,” “accelerated filer” and “smaller reporting company” in Rule 12b-2 of the Exchange Act. (check one):
Large Accelerated Filer � Accelerated Filer � Non-Accelerated Filer � Smaller Reporting Company�
Indicate by check mark whether the registrant is a shell company (as defined in Rule 12b-2 of the Exchange Act). Yes � No � The aggregate market value of voting stock held by non-affiliates of the registrant as of June 30, 2014 was $704,607,266 . The number of shares of the registrant’s common stock, par value $.01 per share, outstanding on February 20, 2015 was 105,292,065.
2

DOCUMENTS INCORPORATED BY REFERENCE
Document
Where Incorporated
Part III, Items 10-14 1. Portions of the Registrant's Definitive Proxy Statement relating to its 2015 Annual Meeting of Stockholders scheduled for May 2015 to be filed with the Securities and Exchange Commission by no later than April 30, 2015.
3
NEW YORK MORTGAGE TRUST, INC.
FORM 10-K
For the Fiscal Year Ended December 31, 2014
TABLE OF CONTENTS
PART I Item 1. Business 5 Item 1A. Risk Factors 16 Item 1B. Unresolved Staff Comments 40 Item 2. Properties 40 Item 3. Legal Proceedings 40 Item 4. Mine Safety Disclosures 40
PART II Item 5. Market For Registrant’s Common Equity, Related Stockholder Matters and Issuer Purchases of Equity Securities 41 Item 6. Selected Financial Data 43 Item 7. Management’s Discussion and Analysis of Financial Condition and Results of Operations 44 Item 7A. Quantitative and Qualitative Disclosures About Market Risk 70 Item 8. Financial Statements and Supplementary Data 74 Item 9. Changes in and Disagreements with Accountants on Accounting and Financial Disclosure 74 Item 9A. Controls and Procedures 74 Item 9B. Other Information 74
PART III Item 10. Directors and Executive Officers of the Registrant and Corporate Governance 75 Item 11. Executive Compensation 75 Item 12. Security Ownership of Certain Beneficial Owners and Management and Related Stockholder Matters 75 Item 13. Certain Relationships and Related Party Transactions and Director Independence 75 Item 14. Principal Accounting Fees and Services 75
PART IV Item 15. Exhibits, Financial Statement Schedules 76
4
PART I Item 1. BUSINESS
In this Annual Report on Form 10-K we refer to New York Mortgage Trust, Inc., together with its consolidated subsidiaries, as “we,” “us,”“Company,” or “our,” unless we specifically state otherwise or the context indicates otherwise. We refer to our wholly-owned taxable REIT subsidiaries as “TRSs” and our wholly-owned qualified REIT subsidiaries as “QRSs.” In addition, the following defines certain of the commonly used terms in this report: “RMBS” refers to residential mortgage-backed securities comprised of adjustable-rate, hybrid adjustable-rate, fixed-rate, interest only and inverse interest only, and principal only securities; “Agency RMBS” refers to RMBS representing interests in or obligations backed by pools of mortgage loans issued or guaranteed by a federally chartered corporation (“GSE”), such as the Federal National Mortgage Association (“Fannie Mae”) or the Federal Home Loan Mortgage Corporation (“Freddie Mac”), or an agency of the U.S. government, such as the Government National Mortgage Association (“Ginnie Mae”); “Agency ARMs” refers to Agency RMBS comprised of adjustable-rate and hybrid adjustable-rate RMBS; “non-Agency RMBS” refers to RMBS backed by prime jumbo and Alternative A-paper (“Alt-A”) residential mortgage loans; “IOs” refers collectively to interest only and inverse interest only mortgage-backed securities that represent the right to the interest component of the cash flow from a pool of mortgage loans; “Agency IOs” refers to IOs that represent the right to the interest components of the cash flow from a pool of residential mortgage loans issued or guaranteed by a GSE or an agency of the U.S. government; “POs” refers to mortgage-backed securities that represent the right to the principal component of the cash flow from a pool of mortgage loans; “ARMs” refers to adjustable-rate residential mortgage loans; “prime ARM loans” and “residential securitized loans” each refer to prime credit quality residential ARM loans (“prime ARM loans”) held in securitization trusts; “distressed residential loans” refers to pool s of performing and re-performing, fixed-rate and adjustable-rate, fully amortizing, interest-only and balloon, seasoned mortgage loans secured by first liens on one- to four-family properties ; “ CMBS” refers to commercial mortgage-backed securities comprised of commercial mortgage pass-through securities, as well as IO or PO securities that represent the right to a specific component of the cash flow from a pool of commercial mortgage loans; “multi-family CMBS” refers to CMBS backed by commercial mortgage loans on multi-family properties ; “CDOs” refers to collateralized debt obligations; “CLO” refers to collateralized loan obligation; “Consolidated K-Series” refers six separate Freddie Mac- sponsored multi-family loan K-Series securitizations, of which we, or one of our special purpose entities, or SPEs, own the first loss PO securities and certain IO securities ; “Variable Interest Entity or VIE” refers to an entity in which equity investors do not have the characteristics of a controlling financial interest or do not have sufficient equity at risk for the entity to finance its activities without additional subordinated financial support from other parties ; and “Consolidated VIEs” refers to VIEs where the Company is the primary beneficiary, as it has both the power to direct the activities that most significantly impact the economic performance of the VIE and a right to receive benefits or absorb losses of the entity that could be potentially significant to the VIE. General
We are a real estate investment trust, or REIT, in the business of acquiring, investing in, financing and managing primarily mortgage-related assets and financial assets. Our objective is to manage a portfolio of investments that will deliver stable distributions to our stockholders over diverse economic conditions. We intend to achieve this objective through a combination of net interest margin and net realized capital gains from our investment portfolio. Our portfolio includes certain credit sensitive assets and investments sourced from distressed markets in recent years that create the potential for capital gains, as well as more traditional types of mortgage-related investments that generate interest income.
We were formed in 2003 and commenced operations as a vertically integrated mortgage origination and portfolio investment manager in 2004
upon the completion of our initial public offering. Since exiting the mortgage origination business in 2007, we built a diversified investment portfolio that includes elements of interest rate and credit risk, which we believe is best suited to deliver stable cash flows over various economic cycles.
Under our investment strategy, our targeted assets currently include residential mortgage loans, including distressed residential loans, multi-
family CMBS, mezzanine loans to and preferred equity investments in owners of multi-family properties, equity and debt securities issued by entities that invest in commercial real estate-related debt investments and Agency RMBS. Subject to maintaining our qualification as a REIT, we also may opportunistically acquire and manage various other types of mortgage-related and financial assets that we believe will compensate us appropriately for the risks associated with them, including, without limitation, non-Agency RMBS (which may include IOs and POs), collateralized mortgage obligations and securities issued by newly originated residential securitizations, including credit sensitive securities from these securitizations.
We strive to maintain and achieve a balanced and diverse funding mix to finance our assets and operations. We rely primarily on a combination of short-term borrowings, such as repurchase agreements with terms typically of 30 days (and, in some cases up to one year), and longer term structured financings, such as securitization and re-securitization transactions, with terms longer than one year.
5
We internally manage a certain portion of our portfolio, including Agency ARMs, Agency fixed-rate RMBS, non-Agency RMBS, CLOs and
residential securitized loans. In addition, as part of our investment strategy, we also contract with certain external investment managers to manage specific asset types targeted by us. We are a party to separate investment management agreements with Headlands Asset Management, LLC, or Headlands, RiverBanc, LLC, or RiverBanc, and The Midway Group, L.P., or Midway, with Headlands providing investment management services with respect to our investments in certain distressed residential loans, RiverBanc providing investment management services with respect to our investments in multi-family CMBS and certain commercial real estate-related debt investments, and Midway providing investment management services with respect to our investments in Agency IOs.
We completed three public equity offerings in 2014, generating aggregate net proceeds to us of approximately $296.5 million, expanding our
stockholders’ equity from $480.7 million at December 31, 2013 to $817.9 million at December 31, 2014. The expansion of our equity capital base over the course of the last three fiscal years has increased our scale and, we believe, our access to larger and more attractive investment and financing opportunities, as evidenced by the purchase of distressed residential loans in December 2014 having an unpaid principal balance of $367.6 million at the closing date for an aggregate purchase price of $328.4 million, including accrued interest.
We have elected to be taxed as a REIT and have complied, and intend to continue to comply, with the provisions of the Internal Revenue Code of 1986, as amended (the “Internal Revenue Code”), with respect thereto. Accordingly, we do not expect to be subject to federal income tax on our REIT taxable income that we currently distribute to our stockholders if certain asset, income and ownership tests and recordkeeping requirements are fulfilled. Even if we maintain our qualification as a REIT, we expect to be subject to some federal, state and local taxes on our income generated in our TRSs.
The financial information requirements required under this Item 1 may be found in our consolidated financial statements beginning on page
F-1 of this Annual Report. Our Investment Strategy
We intend to continue our strategy of building a residential portfolio that includes elements of both interest rate and credit risk by focusing our investments on (i) “credit residential” assets, which we define as residential mortgage loans, including distressed residential loans, multi-family CMBS and other commercial real estate-related debt investments such as mezzanine loans to and preferred equity investments in owners of multi-family properties, equity and debt securities issued by entities that invest in commercial real estate-related debt investments, (ii) leveraged Agency RMBS, which we expect will include Agency ARMs, Agency fixed-rate and Agency IOs, and (iii) the opportunistic acquisition of other types of mortgage-related and financial assets that meet our investment criteria. At the same time we pursue these targeted assets, we will continue to actively manage our existing assets, which include the credit residential assets and leveraged Agency RMBS referred to above as well as CLOs, residential securitized loans and non-Agency RMBS.
Prior to deploying capital to any of our targeted asset classes or determining to liquidate or dispose any of our investments, our management team will consider, among other things, the amount and nature of anticipated cash flows from the asset, our ability to finance or borrow against the asset and the terms of such financing, the related capital requirements, the credit risk related to the asset or the underlying collateral, prepayment risk, liquidity, the costs of financing, hedging, and managing the asset, relative value, expected future interest rate volatility and future expected changes to credit spreads. Consistent with our strategy to produce returns through a combination of net interest margin and net realized capital gains, we will seek, from time to time, to sell certain assets within our portfolio when we believe the combination of realized gains on an asset and reinvestment potential for the related sale proceeds are consistent with our long-term return objectives.
Our investment strategy does not, subject to our continued compliance with applicable REIT tax requirements and the maintenance of our
exemption from the Investment Company Act of 1940, as amended (the “Investment Company Act”), limit the amount of our capital that may be invested in any of these investments or in any particular class or type of assets. Thus, our future investments may include asset types different from the targeted or other assets described in this report. The investment and capital allocation decisions of our company and our external managers depend on prevailing market conditions and other factors and may change over time in response to opportunities available in different economic and capital market environments. As a result, we cannot predict the percentage of our capital that will be invested in any particular investment at any given time.
For more information regarding our portfolio as of December 31, 2014, see Item 7 - “Management’s Discussion and Analysis of Financial
Condition and Results of Operations” of this Annual Report.
6
Investments in Credit Residential Assets We seek to identify credit sensitive assets primarily relating to residential housing from which we can extract value through a combination of
current yield and/or capital appreciation. Our portfolio of credit residential assets is currently comprised of residential mortgage loans, including distressed residential loans, multi-family CMBS, mezzanine loans to and preferred equity investments in owners of multi-family properties and equity and debt investments issued by entities that invest in commercial real estate-related debt investments. Our portfolio also includes distressed residential mortgage loans held in securitization trusts and prime ARM loans held in securitization trusts (also referred to as residential securitized loans).
The distressed residential loans in our current portfolio have been acquired, in each case, as a pool of distressed residential loans sold by a
financial institution. During the year ended December 31, 2014, we acquired multiple pools of distressed residential mortgage loans having an estimated aggregate market value of approximately $400.9 million at the time of their respective acquisitions. This includes a pool of distressed residential loans acquired in December 2014 having an unpaid principal balance and carrying value of approximately $367.2 million and $327.4 million, respectively as of December 31, 2014. These distressed residential mortgage loans generally consist of performing and re-performing, fixed-and adjustable-rate, fully-amortizing, interest-only and balloon, seasoned mortgage loans secured by first liens on one- to four-family properties. The loans were purchased at a discount to the aggregate principal amount outstanding, which we believe will provide us with adequate credit protection and an opportunity to modify the loan and achieve an attractive yield. These distressed residential mortgage loans are sourced and managed by Headlands.
Our portfolio of multi-family CMBS is comprised of (i) fixed rate PO securities issued from the first loss tranche, or “first loss,” of certain
multi-family K-series securitizations sponsored by Freddie Mac and (ii) certain IO securities issued by these securitizations. Our investments in these privately placed first loss PO securities generally represent approximately 7.5% of the overall securitization which typically totals approximately $1.0 billion in multi-family residential loans consisting of 70 to 100 individual properties diversified across a wide geographic footprint. These first loss securities are typically backed by balloon non-recourse mortgage loans that provide for the payment of principal at maturity date, which is typically seven to ten years. Moreover, each first loss piece of multi-family CMBS in our portfolio is, in most cases, the most junior tranche of security issued by the securitization, meaning it will absorb all losses in the securitization prior to other more senior tranches being exposed to loss. As a result, each of the first loss securities in our portfolio has been purchased, upon completion of a credit analysis and due diligence by our external manager and after consultation with and approval of our senior management, at a significant discount to its then-current par value, which we believe provides us with adequate protection against projected losses. In addition, as the owner of the first loss piece, the Company, through RiverBanc, has the right to participate in the workout of any distressed property in the securitization. We believe this right will allow the Company to mitigate or reduce any possible loss associated with the distressed property. The Company also invests in IO securities from a number of the same multi-family securitizations from which we acquired our first loss PO investments. These IO securities are stripped off the entire securitization allowing the Company to receive cashflows over the life of the multi-family loans backing the securitization. These investments range from 10 to 17 basis points and the underlying notional amount approximates $1.0 billion each. We may in the future invest in more senior tranches of multi-family CMBS, which may include some form of leverage, if we believe the risk-adjusted returns for such assets are attractive. In addition, we may acquire multi-family CMBS from private originators of, or investors in, mortgage loans, including non-financial institutions and other entities. With respect to the multi-family CMBS owned by us, all of the loans that back the respective securitizations have been underwritten to Freddie Mac underwriting guidelines and standards; however, our securities are not guaranteed by Freddie Mac.
We invest in other commercial real estate-related investments, such as the origination or acquisition of mezzanine loans to and preferred equity investments in owners of multi-family properties, with a primary focus on conventional apartments, cooperative housing associations, student housing and other related property types in increments as low as $1 million secured by properties valued at $10 million or greater. A mezzanine loan is a loan made to a property owner that is subordinate to mortgage debt and is typically secured by a pledge of the borrower’s ownership interests in the property and/or direct or indirect entities that own the property. A preferred equity investment typically takes the form of an equity investment in the special purpose entity (“SPE”) that owns the property and is structured such that the preferred equity investor will receive cash distributions from the SPE in seniority to a more junior class of equity. These preferred equity interests may be subordinate to other forms of mortgage or property-level debt. We also may participate in structured investments such as the acquisition of seasoned or distressed commercial loan portfolios. We also invest in equity and debt securities of entities that invest in commercial real estate-related debt investments and joint ventures focused on multi-family properties.
The prime ARM loans held in securitization trusts, which we refer to as “residential mortgage loans held in securitization trusts” in our
consolidated financial statements, are loans that primarily were originated by our discontinued mortgage lending business, and to a lesser extent purchased from third parties, that we securitized in 2005. These loans are substantially prime, full documentation, interest-only hybrid ARMs on residential properties and are all first lien mortgages. We maintain the ownership trust certificates, or equity, of these securitizations, which includes rights to excess interest, if any, and also take an active role in managing delinquencies and default risk related to the loans.
7

Investments in Agency RMBS We intend to achieve more stable cash flows on our collective investments in Agency RMBS across various market cycles, including, various
interest rate, yield curve and prepayment cycles, primarily through investments in Agency ARMs, Agency fixed-rate RMBS and Agency IOs. Our Agency ARMs consist of whole pool pass-through certificates, the principal and interest of which are guaranteed by Fannie Mae or Freddie Mac, which are backed by ARMs or hybrid ARMs. Our current portfolio of Agency ARMs has interest reset periods ranging from 10 years to less than three months.
Our Agency RMBS also consist of fixed-rate whole pool pass-through certificates, the principal and interest of which are guaranteed by
Fannie Mae or Freddie Mac, which are primarily backed by 15-year residential fixed rate mortgage loans with lesser amounts invested in 20-year residential fixed-rate mortgage loans. The majority of these securities have coupons ranging from 2.5% to 3.5%.
Agency IOs are securities that represent the right to receive the interest portion of the cash flow from a pool of mortgage loans issued or
guaranteed by Fannie Mae, Freddie Mac or Ginnie Mae. Agency IOs allow us to make a direct investment in borrower prepayment trends in the current market environment. However, Agency IOs also introduce increased risk as these securities have no underlying principal cash flows, which will cause them to underperform in high prepayment environments as future interest payments will be reduced as a direct result of prepayments. In a rising interest rate environment, the value of an Agency IO generally tends to increase as their expected average life increases and prepayments decrease. Our investments in Agency IOs and related hedging and borrowing activities are managed by Midway. We sometimes refer to these investments and related hedging and borrowing activities as our Agency IO strategy or our Agency IO portfolio.
It should be noted that the guarantee provided by the GSEs on Agency RMBS issued by them does not protect us from prepayment risk and
that the payments on Agency IOs are not guaranteed by Fannie Mae, Freddie Mac or Ginnie Mae. Moreover all of our Agency RMBS (including Agency IOs) are at risk to new or modified government-sponsored homeowner stimulus programs that may induce unpredictable and excessively high prepayment speeds resulting in accelerated premium amortization and reduced net interest margin, both of which could materially adversely affect our business, financial condition and results of operations.
Our Financing Strategy
We strive to maintain and achieve a balanced and diverse funding mix to finance our assets and operations. To achieve this, we rely primarily
on a combination of short-term borrowings under repurchase agreements, and structured financings, including securitized debt, CDOs and long term subordinated debt. The Company's policy for leverage is based on the type of asset, underlying collateral and overall market conditions, with the intent of obtaining more permanent, longer-term financing for our more illiquid assets, such as our credit sensitive first loss multi-family CMBS and distressed residential loans. Currently, we target maximum leverage ratios for callable or short-term financings of 8 to 1, in the case of Agency RMBS (other than Agency IOs), and 2 to 1, in the case of Agency IOs. We may utilize short term financing on other asset classes with leverage ratios driven by the nature of the underlying asset as well as current market conditions.
As of December 31, 2014, our overall leverage ratio, including our short-term financings, such as repurchase agreements, and longer-term
financings, such as securitized debt and subordinated debt (excluding the CDOs issued by the Consolidated K-Series and our residential CDOs), divided by stockholders’ equity, was approximately 1.4 to 1. Our leverage ratio on our short term financings or callable debt was approximately 1.1 to 1. In each case, there may be occasional short-term increases or decreases in the amount of leverage used due to significant market events, and we may change our leverage strategy at any time. We monitor all at risk or short term borrowings to ensure that we have adequate liquidity to satisfy margin calls and liquidity covenant requirements.
We primarily rely on repurchase agreements to fund our Agency RMBS portfolio. Repurchase agreements provide us with short-term
borrowings (typically 30 days) that bear interest rates that are linked to the London Interbank Offered Rate (“LIBOR”), a short term market interest rate used to determine short term loan rates. Pursuant to these repurchase agreements, the financial institution that serves as a counterparty will generally agree to provide us with financing based on the market value of the securities that we pledge as collateral, less a “haircut.” Market value of the collateral represents the price of such collateral obtained from generally recognized sources or most recent closing bid quotation from such source plus accrued income. Our repurchase agreements may require us to deposit additional collateral pursuant to a margin call if the market value of our pledged collateral declines as a result of market conditions or due to principal repayments on the mortgages underlying our pledged securities. Interest rates and haircuts will depend on the underlying collateral pledged.
8
With respect to our investments in multi-family CMBS, other commercial mortgage debt-related investments and distressed residential loans,
we intend to finance our investment in these assets through working capital and, subject to market conditions, both short-term and long-term borrowings. Our financings may include repurchase agreement borrowings with terms of one year or less, or longer term structured debt financing, such as longer-term repurchase agreement financing and securitized debt where the assets we intend to finance are contributed to an SPE and serve as collateral for the financing. We engage in longer-term financings for the primary purpose of obtaining longer-term non-recourse financing on these assets. As of December 31, 2014, our multi-family CMBS amounting to approximately $235.3 million and distressed residential mortgage loans amounting to approximately $221.6 million are financed by some form of securitized debt.
In December 2014, the Company entered into a master repurchase agreement with a one-year term to fund a portion of the purchase price of a
pool distressed residential loans with an unpaid principal balance at December 31, 2014 of approximately $367.2 million. Pursuant to the terms for these financings, our ability to access the cash flows generated by the assets serving as collateral may be significantly limited and we may be unable to sell or otherwise transfer or dispose of or modify such assets until the financing has matured. In addition, we have provided a guarantee with respect to certain terms of some of the longer-term debt incurred by our subsidiaries, including the master repurchase agreement with a one-year term, and we may provide a similar guarantee in connection with future financings.
At December 31, 2014, we finance our prime ARM loans held in securitization trusts with approximately $145.5 million of residential CDOs
that were issued in securitization transactions we completed in 2005. For more information regarding our outstanding borrowings and debt instruments at December 31, 2014, see Item 7 - “Management’s
Discussion and Analysis of Financial Condition and Results of Operations” of this Annual Report. Our Hedging Strategy
We intend to use hedging instruments in conjunction with our investment portfolio to reduce or mitigate risks associated with changes in interest rates, mortgage spreads, yield curve shapes and market volatility. These hedging instruments may include interest rate swaps, interest rate swaptions, interest rate futures and options on interest rate futures, mortgage derivatives such as forward-settling purchases and sales of Agency RMBS where the underlying pools of mortgage loans are “To-Be-Announced,” or TBAs, and U.S. Treasuries.
We use interest rate swaps and Euro-dollar futures to hedge interest rate repricing mismatches between certain of our investments and the related borrowings. For example, the interest coupon reset period on our Agency RMBS is typically greater than the repricing period for the related liabilities, which is usually 30 days. We typically would use interest rate swaps or Euro-dollar futures to extend the liability repricing date to more closely approximate the related asset.
We commonly use TBA transactions to hedge interest rate and market risks associated with our Agency IOs. Pursuant to our TBA transactions, we agree to purchase or sell, for future delivery, Agency RMBS with interest terms and certain types of underlying collateral, but the particular Agency RMBS to be delivered or received, as applicable, is not identified until shortly before the TBA settlement date. We typically do not take delivery of TBAs but, rather, settle with our trading counterparties on a net basis. By utilizing TBA transactions, we expect to reduce changes in portfolio values due to changes in interest rates. Although TBAs are liquid and have quoted market prices and represent the most actively traded class of RMBS, the use of TBAs exposes us to increased market value risk. We typically conduct TBA and other interest rate futures hedging transactions through one of our TRSs.
In connection with our hedging strategy, we, together with our external managers, utilize a model based risk analysis system to assist in projecting portfolio performances over a variety of different interest rates and market scenarios, such as shifts in interest rates, changes in prepayments and other factors impacting the valuations of our assets and liabilities. However, given the uncertainties related to prepayment rates, it is not possible to perfectly lock-in a spread between the earnings asset yield and the related cost of borrowings. Moreover, the cash flows and market values of certain types of structured Agency RMBS, such as the IOs we invest in, are more sensitive to prepayment risks than other Agency RMBS. Nonetheless, through active management and the use of evaluative stress scenarios, we believe that we can mitigate a significant amount of both value and earnings volatility. Our External Managers
The Midway Group, L.P. A portion of our Agency RMBS portfolio comprised of Agency IOs is externally managed and advised by Midway pursuant to an investment
management agreement between Midway and us (as amended, the “Midway Management Agreement”). Midway was founded in 2000 by Mr. Robert Sherak, a mortgage industry veteran with more than 25 years’ experience, to serve as investment manager to the Midway Market Neutral Fund LLC, a private investment fund. Midway has been managing a hedged portfolio of mortgage-related securities for over 10 years.
9
Midway is responsible for administering the business activities and day-to-day operations of our investments in Agency IOs and certain
derivative instruments. These responsibilities include arranging and coordinating the purchase and sale of various investment assets and the financing and hedging associated with such assets, with direct oversight from our management team. Midway also may invest from time to time in, among other things, Agency RMBS consisting of pass-through certificates, CMOs, and POs and non-agency RMBS (which may include IOs and POs), although they have made no such investments on our behalf since being engaged as an external manager. As part of its investment process, we expect that Midway will analyze significant amounts of data regarding the historical performance of mortgage-related securities transactions and collateral over various market cycles.
Midway has established portfolio management resources for the investment assets described above and an established infrastructure
supporting those resources. We expect that we will benefit from Midway’s highly analytical investment processes, broad-based deal flow, extensive relationships in the financial community and operational expertise. Moreover, since its founding, we believe Midway has developed strong relationships with a wide range of dealers and other market participants that provide Midway access to a broad range of trading opportunities and market information.
As of December 31, 2014, we had allocated approximately $107.5 million of capital to investments managed by Midway. The Midway Management Agreement
We entered into an investment management agreement with Midway on February 11, 2011, as amended on March 9, 2012 and April 1, 2014.
The Midway Management Agreement currently operates under a one-year term that is automatically renewed for successive one-year terms unless a termination notice is delivered by either party to the other party at least six months prior to the end of the then current term. Pursuant to the Midway Management Agreement, Midway implements our Agency IO investment strategy and related hedging and borrowing activities and has complete discretion and authority to manage these assets and related hedging and borrowing activities, subject to compliance with the written investment guidelines included in the Midway Management Agreement and the other terms and conditions of the Midway Management Agreement, including our authority to direct Midway to modify its investment strategy for purposes of maintaining our qualification as a REIT and exemption from the Investment Company Act.
The following table summarizes the fees that we pay to Midway pursuant to the Midway Management Agreement. We will reimburse Midway for all transaction costs and expenses incurred in connection with the management and administration of the assets and liabilities that they manage on our behalf.
Type Description Base management fee Payable monthly in arrears in a cash amount equal to the product of (i) 1.50% per annum of our invested capital in
the assets managed by Midway as of the last business day of the previous month, multiplied by (ii) 1/12th. Incentive fee Midway will be entitled to a quarterly incentive fee (the “Midway Incentive Fee”) that is calculated quarterly and
paid quarterly in arrears. The Midway Incentive Fee is subject to a high water mark equal to an 11% return on our invested capital in assets managed by Midway (the “High Water Mark”), and shall be payable in an amount equal to the excess, if any, of 35% of the dollar amount by which adjusted net income (as defined below) attributable to the assets managed by Midway, on a quarterly basis and before accounting for the Midway Incentive Fee, exceeds an annual 12.5% rate of return on invested capital (the “Hurdle Rate”), after adjusting for any carried over shortfall from previous quarters. The return rate for each quarter (the “Calculation Period”) shall be determined by dividing (i) the adjusted net income for the Calculation Period by (ii) the weighted average of our invested capital in assets managed by Midway during the Calculation Period. Upon mutual agreement of the parties to the Midway Management Agreement, a portion of each Midway Incentive Fee payable to Midway may be paid in shares of our common stock. Adjusted net income is defined as net income (loss) calculated in accordance with generally accepted accounting principles in the United States (“GAAP”), including any unrealized gains and losses, after giving effect to certain expenses. All securities managed for us by Midway will be valued in accordance with GAAP. Unlike the Hurdle Rate, which is calculated on a three month basis, the High Water Mark is calculated on a calendar 12 month basis, and will reset every 24 months. The High Water Mark will be a static dollar figure that Midway will be required to recoup, to the extent there is a deficit in the prior High Water Mark calculation period before it is eligible again to receive a Midway Incentive Fee.
Equity Compensation In addition to the base management and incentive fees provided for in the Midway Management Agreement, we
issued 213,980 shares of restricted stock to Midway in March 2012 that vested annually in one-third increments beginning on December 31, 2012. As of December 31, 2014, all of the restricted shares issued to Midway had vested in full.

10
Although the assets and invested capital managed by Midway are held in an account that is wholly owned by our company, we may only
redeem invested capital in an amount equal to the lesser of 10% of our invested capital managed by Midway or $10 million as of the last calendar day of the month upon not less than 75 days written notice, subject to our authority to direct Midway to modify its investment strategy for purposes of maintaining our qualification as a REIT and exemption from the Investment Company Act. Pursuant to the terms of the Midway Management Agreement, we are only permitted to make one such redemption request in any 75-day period.
RiverBanc LLC
In April 2011, we formed a relationship with RiverBanc, a privately owned investment management and specialty finance company founded
by Kevin Donlon, for the purpose of investing in multi-family CMBS, such as Freddie Mac Multifamily Loan Securitization K-Series’ assets, and other commercial real estate-related debt investments, such as mezzanine loans to and preferred equity investments in owners of multi-family properties. Pursuant to an investment management agreement between RiverBanc and us. RiverBanc sources, structures and manages our investments in these asset classes. We also have invested approximately $36.6 million in equity and debt securities issued by entity that is externally managed by RiverBanc. As of December 31, 2014, we owned 20% equity interest in RiverBanc.
RiverBanc Management Agreement
On March 13, 2013, we entered into an amended and restated management agreement with RB Commercial Mortgage LLC, our wholly-owned subsidiary, and RiverBanc (as amended, the “RiverBanc Management Agreement”). The RiverBanc Management Agreement, which replaces the prior management agreement between RiverBanc and RB Commercial Mortgage LLC, has a term that expired on December 31, 2014 and is subject to automatic annual one-year renewals thereafter.
Pursuant to the terms of the RiverBanc Management Agreement, RiverBanc will receive a monthly base management fee in arrears in a cash
amount equal to the product of (i) 1.50% per annum of “Equity” as of the last business day of the previous month, multiplied by (ii) 1/12th. For purposes of the RiverBanc Management Agreement, Equity is defined as “Assets” minus “Debt,” where Assets is defined as the aggregate net carrying value (in accordance with GAAP) of those assets of our company managed by RiverBanc (specifically excluding (i) any unrealized gains or losses that have impacted net carrying value as reported in our financial statements prepared in accordance with GAAP, regardless of whether such items are included in other comprehensive income or loss or in net income, and (ii) one-time events pursuant to changes in GAAP, and certain non-cash items not otherwise described above, in each case, as mutually agreed between RiverBanc and us) and Debt is defined as the greater of (1) the net carrying value (in accordance with GAAP, excluding adjustments for unrealized gains or losses) of all third-party debt or liabilities secured by the Assets and (2) prior to termination of the RiverBanc Management Agreement, zero, or following termination of the RiverBanc Management Agreement, an amount equal to 50% of Assets. In addition, RiverBanc will be entitled to an incentive fee that is calculated quarterly and paid in cash in arrears. The incentive fee is based upon the average Equity during the fiscal quarter, subject to a high water mark equal to a 9% return on Equity, and shall be payable in an amount equal to 35% of the dollar amount by which adjusted net income (as defined in the RiverBanc Management Agreement) attributable to the Assets, before accounting for any incentive fees payable to RiverBanc, exceeds an annualized 12% rate of return on such average Equity (provided, however, that the applicable percentage for calculation of the incentive fee on any incremental return in excess of 21% shall be reduced to 20% from 35%). Any incentive fee paid for the fourth fiscal quarter of each year under the agreement is calculated based on the incentive fee earned during the calendar twelve-month period less the aggregate incentive fees paid for the first three quarters during the period.
We may terminate the RiverBanc Management Agreement or elect not to renew the agreement, subject to certain conditions and subject, in
certain cases, to paying a termination fee equal to the product of (A) 24 and (B) the monthly base management fee earned by RiverBanc during the month immediately preceding the month in which the termination occurs. In the event we terminate the RiverBanc Management Agreement for any reason (other than for “cause”), RiverBanc has, subject to certain conditions, a right of first refusal to purchase from us the assets managed by them.
11
Headlands Asset Management LLC The Company engages Headlands to manage and advise us with respect to the distressed residential mortgage loans acquired by us.
Headlands sourced and performed due-diligence procedures on the pools of distressed residential mortgage loans acquired by us and manages the servicing, modification and final disposition or resolution of the loans, which can range from modifying a mortgage loan balance, interest rate or payment to selling the underlying real estate asset.
Headlands was founded on May 2008 as an investment manager focused on purchasing, servicing and managing all aspects of a portfolio of
residential mortgage loans. Headlands Management Agreements We are a party to multiple investment management agreements with Headlands. As part of our financing strategy, we have transferred a
portion of our distressed residential mortgage loans to certain SPEs, which are treated as consolidated subsidiaries of the Company, for the purpose of securitizing the loans. Each investment management agreement by and between Headlands, the Company and any consolidated subsidiary of the Company (the “Securitization Subsidiaries”), provides that Headlands serves as the asset manager of distressed residential mortgage loans owned by the Company or by its Securitization Subsidiaries. Each investment management agreement has a term that will expire upon the sale or other liquidation of all mortgage loans held by the Securitization Subsidiaries.
Pursuant to the terms of each investment management agreement, Headlands will receive a monthly base management fee payable on the
tenth business day of each month in a cash amount equal to the product of (i) 1.50% per annum of assets under management (“AUM”) as of the first day of each such month, multiplied by (ii) 1/12 , where AUM is defined as the net asset value of the mortgage loans being managed by Headlands plus any “subsequent collateral account balance” (as defined in the investment management agreement). In addition, Headlands will be entitled to an incentive fee that is calculated quarterly, but is not payable until the notes issued by such Securitization Subsidiary as part of the securitization transaction have been retired in full. The incentive fee is based upon the weighted average AUM during the fiscal quarter and shall be payable in an amount equal to 35% of the dollar amount by which the Securitization Subsidiary’s taxable income (before accounting for any incentive fees earned by Headlands and interest on the notes) exceeds an annualized 12% rate of return on such weighted average AUM (provided, however, that the applicable percentage for calculation of the incentive fee on any incremental return in excess of 22% shall be reduced by the amount of any subordinate servicing fees). The parties will recalculate the annual incentive fee earned by Headlands after the fourth fiscal quarter of each year and will adjust any payments owed or required to be remitted based on such annual calculation.
Headlands may terminate any of the investment management agreements at any time upon not less than 60 days’ notice; provided, however,
that, subject to certain exceptions, it may not terminate an agreement or resign prior to the time such notes issued by the respective Securitization Subsidiary have been retired. We may terminate an investment management agreement in the event of an uncured violation of the agreement or any bankruptcy, insolvency or liquidation proceedings in respect of Headlands. Neither Headlands nor the Securitization Subsidiaries will incur a termination fee upon termination of any of the investment management agreements. We have agreed to guarantee the payment of the base management fees and expenses payable to Headlands by the Securitization Subsidiaries.
Conflicts of Interest with Our External Managers; Equitable Allocation of Opportunities
Each of Midway, RiverBanc and Headlands manages, and is expected to continue to manage, other client accounts with similar or overlapping investment strategies. In connection with the services provided to those accounts, these managers may be compensated more favorably than for the services provided under our external management agreements, and such discrepancies in compensation may affect the level of service provided to us by our external managers. Moreover, each of our external managers may have an economic interest in the accounts they manage or the investments they propose. In addition, we have in the recent past engaged in certain co-investment opportunities with an external manager or one of its affiliates and we may participate in future co-investment opportunities with our external managers or their affiliates. In these cases, it is possible that our interests and the interests of our external managers will not always be aligned and this could result in decisions that are not in the best interests of our company.
Each of Midway and RiverBanc has agreed that, when making investment allocation decisions between us and its other client accounts, it
will, in the case of RiverBanc, allocate investments in a fair and equitable manner and, in the case of Midway, seek to allocate investment opportunities on an equitable basis and in a manner it believes is in the best interests of its relevant accounts. Since certain of our targeted assets are typically available only in specified quantities and since certain of these targeted assets will also be targeted assets for other accounts managed by or associated with our external managers, our external managers may not be able to buy as much of certain assets as required to satisfy the needs of all of its clients’ or associated accounts. In these cases, we understand that the allocation procedures and policies of our external managers would typically allocate such assets to multiple accounts in proportion to, among other things, the objectives, strategy, and stage of development or needs of each account. Moreover, the investment allocation policies of Midway may permit departure from proportional allocation when the total allocation would result in an inefficiently small amount of the security being purchased for an account. Although we believe that each of our external managers will seek to allocate investment opportunities in a manner which it believes to be in the best interests of all accounts involved and will seek to allocate, on an equitable basis, investment opportunities believed to be appropriate for us and the other accounts it manages or is associated with, there can be no assurance that a particular investment opportunity will be allocated in any particular manner.
th

12
Midway is authorized to follow broad investment guidelines in determining which assets it will invest in. Although our Board of Directors
will ultimately determine when and how much capital to allocate to assets managed by Midway, we generally will not approve transactions in advance of their execution. As a result, because Midway has great latitude to determine the types of assets it may decide are proper investments for us, there can be no assurance that we would otherwise approve of these investments individually or that they will be successful. Meanwhile, RiverBanc has complete discretion and authority to manage assets on our behalf subject to investment guidelines approved by our Board of Directors. However, our Board of Directors may elect to change the investment guidelines or waive them for various investments. In addition to conducting periodic reviews, we will rely primarily on information provided to us by our external managers. Finally, our external managers may use complex investment strategies and may engage in complex transactions on our behalf which may be difficult or impossible to unwind.
Pursuant to the terms of the Midway Management Agreement, we may only redeem invested capital in an amount equal to the lesser of 10%
of the invested capital in assets managed by Midway or $10 million as of the last calendar day of the month upon not less than 75 days written notice, subject to our authority to direct Midway to modify its investment strategy for purposes of maintaining our qualification as a REIT and exemption from the Investment Company Act, and we are only permitted to make one such redemption request in any 75-day period. In the event of a significant market event or shock, we may be unable to effect a redemption of invested capital in greater amounts or at a greater rate unless we obtain the consent of Midway. Because a reduction of invested capital would reduce the base management fee under the Midway Management Agreement, Midway may be less inclined to consent to such redemptions.
None of our external managers is obligated to dedicate any specific personnel exclusively to us, nor are they or their personnel obligated to
dedicate any specific portion of their time to the management of our business. As a result, we cannot provide any assurances regarding the amount of time our external managers will dedicate to the management of our business. Moreover, each of our external managers has significant responsibilities for other investment vehicles and may not always be able to devote sufficient time to the management of our business. Consequently, we may not receive the level of support and assistance that we otherwise might receive if such services were provided internally by us.
Certain Federal Income Tax Considerations and Our Status as a REIT
We have elected to be taxed as a REIT under Sections 856-860 of the Internal Revenue Code for federal income tax purposes, commencing with our taxable year ended December 31, 2004, and we believe that our current and proposed method of operation will enable us to continue to qualify as a REIT for our taxable year ending December 31, 2015 and thereafter. Accordingly, the net interest income we earn on our assets is generally not subject to federal income tax as long as we distribute at least 90% of our REIT taxable income in the form of a dividend to our stockholders each year and comply with various other requirements. Taxable income generated by TRSs is subject to regular corporate income tax.
The benefit of REIT tax status is a tax treatment that avoids “double taxation,” or taxation at both the corporate and stockholder levels, that
generally applies to distributions by a corporation to its stockholders. Failure to qualify as a REIT would subject us to federal income tax (including any applicable minimum tax) on our taxable income at regular corporate rates and distributions to our stockholders would not be deductible by us.
Summary Requirements for Qualification Organizational Requirements
A REIT is a corporation, trust, or association that meets each of the following requirements:
1) It is managed by one or more trustees or directors.
2) Its beneficial ownership is evidenced by transferable shares, or by transferable certificates of beneficial interest.
3) It would be taxable as a domestic corporation, but for the REIT provisions of the federal income tax laws.
4) It is neither a financial institution nor an insurance company subject to special provisions of the federal income tax laws.
5) At least 100 persons are beneficial owners of its shares or ownership certificates.
6) Not more than 50% in value of its outstanding shares or ownership certificates is owned, directly or indirectly, by five or fewer individuals, which the federal income tax laws define to include certain entities, during the last half of any taxable year.
7) It elects to be a REIT, or has made such election for a previous taxable year, and satisfies all relevant filing and other administrative requirements established by the IRS that must be met to elect and maintain REIT status.
8) It meets certain other qualification tests, described below, regarding the nature of its income and assets.

13
We must meet requirements 1 through 4 during our entire taxable year and must meet requirement 5 during at least 335 days of a taxable
year of 12 months, or during a proportionate part of a taxable year of less than 12 months.
Qualified REIT Subsidiaries . A corporation that is a QRS is not treated as a corporation separate from its parent REIT. All assets, liabilities, and items of income, deduction, and credit of a “QRS” are treated as assets, liabilities, and items of income, deduction, and credit of the REIT. A “QRS” is a corporation, all of the capital stock of which is owned by the REIT. Thus, in applying the requirements described herein, any “QRS” that we own will be ignored, and all assets, liabilities, and items of income, deduction, and credit of such subsidiary will be treated as our assets, liabilities, and items of income, deduction, and credit.
Taxable REIT Subsidiaries . A REIT is permitted to own up to 100% of the stock of one or more TRSs. A TRS is a fully taxable corporation that may earn income that would not be qualifying income if earned directly by the parent REIT. Overall, no more than 25% of the value of a REIT’s assets may consist of stock or securities of one or more TRSs.
A TRS will pay income tax at regular corporate rates on any income that it earns. In addition, the TRS rules limit the deductibility of interest paid or accrued by a TRS to its parent REIT to assure that the TRS is subject to an appropriate level of corporate taxation. We have elected for each of Hypotheca Capital, LLC, New York Mortgage Funding, LLC, NYMT Residential Tax, LLC, NYMT Residential Tax 2013 - RP1, LLC, NYMT Residential Tax 2013 - RP2, LLC and NYMT Residential Tax 2013 - RP3, LLC to be treated as TRSs. Our TRSs are subject to corporate income tax on their taxable income.
Qualified REIT Assets . On the last day of each calendar quarter, at least 75% of the value of our assets (which includes any assets held
through a QRS must consist of qualified REIT assets — primarily real estate, mortgage loans secured by real estate, and certain mortgage-backed securities (“Qualified REIT Assets”), government securities, cash, and cash items. We believe that substantially all of our assets are and will continue to be Qualified REIT Assets. On the last day of each calendar quarter, of the assets not included in the foregoing 75% asset test, the value of securities that we hold issued by any one issuer may not exceed 5% in value of our total assets and we may not own more than 10% of the voting power or value of any one issuer’s outstanding securities (with an exception for securities of a QRS or of a TRS). In addition, the aggregate value of our securities in TRSs cannot exceed 25% of our total assets. We monitor the purchase and holding of our assets for purposes of the above asset tests and seek to manage our portfolio to comply at all times with such tests.
We may from time to time hold, through one or more TRSs, assets that, if we held them directly, could generate income that would have an adverse effect on our qualification as a REIT or on certain classes of our stockholders.
Gross Income Tests
We must meet the following separate income-based tests each year:
1. The 75% Test. At least 75% of our gross income for the taxable year must be derived from Qualified REIT Assets. Such income includes interest (other than interest based in whole or in part on the income or profits of any person) on obligations secured by mortgages on real property, rents from real property, gains from the sale of Qualified REIT Assets, and qualified temporary investment income or interests in real property. The investments that we have made and intend to continue to make will give rise primarily to mortgage interest qualifying under the 75% income test.
2. The 95% Test. At least 95% of our gross income for the taxable year must be derived from the sources that are qualifying for
purposes of the 75% test, and from dividends, interest or gains from the sale or disposition of stock or other assets that are not dealer property.
14

Distributions
We must distribute to our stockholders on a pro rata basis each year an amount equal to at least (i) 90% of our taxable income before
deduction of dividends paid and excluding net capital gain, plus (ii) 90% of the excess of the net income from foreclosure property over the tax imposed on such income by the Internal Revenue Code, less (iii) any “excess non-cash income.” We have made and intend to continue to make distributions to our stockholders in sufficient amounts to meet the distribution requirement for REIT qualification. Competition
Our success depends, in large part, on our ability to acquire assets at favorable spreads over our borrowing costs. When we invest in mortgage-backed securities, mortgage loans and other investment assets, we compete with other REITs, investment banking firms, savings and loan associations, insurance companies, mutual funds, hedge funds, pension funds, banks and other financial institutions and other entities that invest in the same types of assets. Corporate Offices and Personnel
We were formed as a Maryland corporation in 2003. Our corporate headquarters are located at 275 Madison Avenue, Suite 3200, New York, New York, 10016 and our telephone number is (212) 792-0107. As of December 31, 2014, we employed seven full-time employees. Access to our Periodic SEC Reports and Other Corporate Information
Our internet website address is www.nymtrust.com. We make available free of charge, through our internet website, our annual report on Form 10-K, our quarterly reports on Form 10-Q, current reports on Form 8-K and any amendments thereto that we file or furnish pursuant to Section 13(a) or 15(d) of the Securities Exchange Act of 1934, as amended, or Exchange Act, as soon as reasonably practicable after we electronically file such material with, or furnish it to, the SEC. Our Corporate Governance Guidelines and Code of Business Conduct and Ethics and the charters of our Audit, Compensation and Nominating and Corporate Governance Committees are also available on our website and are available in print to any stockholder upon request in writing to New York Mortgage Trust, Inc., c/o Secretary, 275 Madison Avenue, Suite 3200, New York, New York, 10016. Information on our website is neither part of nor incorporated into this Annual Report on Form 10-K.
15

CAUTIONARY NOTE REGARDING FORWARD-LOOKING STATEMENT S
When used in this Annual Report on Form 10-K, in future filings with the SEC or in press releases or other written or oral communications,
statements which are not historical in nature, including those containing words such as “believe,” “expect,” “anticipate,” “estimate,” “plan,”“continue,” “intend,” “should,” “would,” “could,” “goal,” “objective,” “will,” “may” or similar expressions, are intended to identify “forward-looking statements” within the meaning of Section 27A of the Securities Act of 1933, as amended, and Section 21E of the Exchange Act, and, as such, may involve known and unknown risks, uncertainties and assumptions.
Forward-looking statements are based on our beliefs, assumptions and expectations of our future performance, taking into account all information currently available to us. These beliefs, assumptions and expectations are subject to risks and uncertainties and can change as a result of many possible events or factors, not all of which are known to us. If a change occurs, our business, financial condition, liquidity and results of operations may vary materially from those expressed in our forward-looking statements. The following factors are examples of those that could cause actual results to vary from our forward-looking statements: changes in interest rates and the market value of our securities; changes in credit spreads; the impact of the downgrade of the long-term credit ratings of the U.S., Fannie Mae, Freddie Mac, and Ginnie Mae; market volatility; changes in the prepayment rates on the mortgage loans underlying our investment securities; increased rates of default and/or decreased recovery rates on our assets; our ability to borrow to finance our assets and the terms thereof; changes in governmental laws, regulations, or policies affecting our business; changes to our relationships with our external managers; our ability to maintain our qualification as a REIT for federal tax purposes; our ability to maintain our exemption from registration under the Investment Company Act; and risks associated with investing in real estate assets, including changes in business conditions and the general economy. These and other risks, uncertainties and factors, including the risk factors described in Item 1A – “Risk Factors”elsewhere in this Annual Report on Form 10-K, as updated by those risks described in our subsequent filings under the Exchange Act, could cause our actual results to differ materially from those projected in any forward-looking statements we make. All forward-looking statements speak only as of the date on which they are made. New risks and uncertainties arise over time and it is not possible to predict those events or how they may affect us. Except as required by law, we are not obligated to, and do not intend to, update or revise any forward-looking statements, whether as a result of new information, future events or otherwise. Item 1A. RISK FACTORS Set forth below are the risks that we believe are material to stockholders and prospective investors. You should carefully consider the following risk factors and the various other factors identified in or incorporated by reference into any other documents filed by us with the SEC in evaluating our company and our business. The risks discussed herein can adversely affect our business, liquidity, operating results, prospects, and financial condition. These risks could cause the market price of our securities to decline. The risk factors described below are not the only risks that may affect us. Additional risks and uncertainties not presently known to us, or not presently deemed material by us, also may adversely affect our business, liquidity, operating results, prospects, and financial condition. Risks Related to Our Business and Our Company Declines in the market values of assets in our investment portfolio may adversely affect periodic reported results and credit availability, which may reduce earnings and, in turn, cash available for distribution to our stockholders.
The market value of the interest-bearing assets in which we invest and any related hedging instruments may move inversely with changes in interest rates. We anticipate that increases in interest rates will generally tend to decrease our net income and the market value of our interest-bearing assets. A significant percentage of the securities within our investment portfolio are classified for accounting purposes as “available for sale.” Changes in the market values of trading securities will be reflected in earnings and changes in the market values of available for sale securities will be reflected in stockholders’ equity. As a result, a decline in market values of certain of our investment securities may reduce the book value of our assets. Moreover, if the decline in market value of an available for sale security is other than temporary, such decline will reduce earnings.
A decline in the market value of our interest-bearing assets may adversely affect us, particularly in instances where we have borrowed money based on the market value of those assets. If the market value of those assets declines, the lender may require us to post additional collateral to support the loan, which would reduce our liquidity and limit our ability to leverage our assets. In addition, if we are, or anticipate being, unable to post the additional collateral, we would have to sell the assets at a time when we might not otherwise choose to do so. In the event that we do not have sufficient liquidity to meet such requirements, lending institutions may accelerate indebtedness, increase interest rates and terminate our ability to borrow, any of which could result in a rapid deterioration of our financial condition and cash available for distribution to our stockholders. Moreover, if we liquidate the assets at prices lower than the amortized cost of such assets, we will incur losses.
16

The market values of our investments may also decline without any general increase in interest rates for a number of reasons, such as
increases in defaults, actual or perceived increases in voluntary prepayments for those investments that we have that are subject to prepayment risk, and widening of credit spreads. If the market values of our investments were to decline for any reason, the value of your investment could also decline. Changes in laws and regulations affecting the relationship between Fannie Mae and Freddie Mac and the U.S. government may adversely affect our business.
Payments on the Agency RMBS (excluding Agency IOs) in which we invest are guaranteed by Fannie Mae, Freddie Mac and Ginnie Mae. Fannie Mae and Freddie Mac are government sponsored enterprises, or "GSEs," but their guarantees are not backed by the full faith and credit of the United States. As broadly publicized, Fannie Mae and Freddie Mac have experienced significant losses in recent years, causing the U.S. Government to place Fannie Mae and Freddie Mac under federal conservatorship and to inject significant capital in these businesses. Questions regarding the continued viability of Fannie Mae and Freddie Mac, as currently structured, including the guarantees that back the RMBS issued by them, and the U.S. Government’s participation in the U.S. residential mortgage market through the GSEs, continue to persist. In February 2011, the U.S. Department of the Treasury along with the U.S. Department Housing and Urban Development released a much-awaited report titled “ Reforming America’s Housing Finance Market ”, which outlines recommendations for reforming the U.S. housing system, including reducing the roles of Fannie Mae and Freddie Mac and transforming the government’s involvement in the housing market and its relationship to Fannie Mae and Freddie Mac. In February 2012, the Federal Housing Finance Agency, or FHFA, released its “Strategic Plan for Enterprise Conservatorships,” which set forth three goals for the next phase of the Fannie Mae and Freddie Mac conservatorships, which include (i) build a new infrastructure for the secondary mortgage market, (ii) gradually reduce Fannie Mae and Freddie Mac’s presence in the marketplace while simplifying and shrinking their operations, and (iii) maintaining foreclosure prevention activities and credit availability for new and refinanced mortgages. In March 2013, the FHFA announced that it was creating a new entity as it reduces the roles of Fannie Mae and Freddie Mac that may serve as a foundational element of the mortgage market of the future. Since the FHFA first released its strategic plan, there have been a number of other housing finance reform proposals introduced, both from industry groups and by the U.S. Congress. One of the proposed bills to receive serious consideration is the “Housing Finance Reform and Taxpayer Protection Act of 2013.” This proposed legislation, among other things, would eliminate Freddie Mac and Fannie Mae and replace them with a new agency which would provide a financial guarantee that would only be tapped after private institutions and investors stepped in. During the second quarter of 2014, the proposed bill failed to make it out of the Senate Banking Committee for a full vote. It remains unclear whether this or any other proposals will become law or, should a proposal become law, if or how the enacted law will differ from the current draft of the bill.
As discussed above, each of Fannie Mae, Freddie Mac and Ginnie Mae could be dissolved and the U.S. Government could determine to stop providing liquidity support of any kind to the mortgage market. If Fannie Mae, Freddie Mac or Ginnie Mae were eliminated, or their structures were to change radically or the U.S. Government significantly reduced its support for any or all of them, we may be unable or significantly limited in our ability to acquire Agency RMBS, which would drastically reduce the amount and type of Agency RMBS available for purchase which, in turn, could materially adversely affect our ability to maintain our exclusion from regulation as an investment company under the Investment Company Act. Moreover, any changes to the nature of the guarantees provided by, or laws affecting, Fannie Mae, Freddie Mac and Ginnie Mae could materially adversely affect the credit quality of the guarantees, could increase the risk of loss on purchases of Agency RMBS issued by these GSEs and could have broad adverse market implications for the Agency RMBS they currently guarantee and the mortgage industry generally. Any action that affects the credit quality of the guarantees provided by Fannie Mae, Freddie Mac and Ginnie Mae could materially adversely affect the value of the Agency RMBS and other residential mortgage-related assets that we own or seek to acquire.
In addition, we rely on our Agency RMBS as collateral for our financings under the repurchase agreements that we have entered into. Any
decline in their value, or perceived market uncertainty about their value, would make it more difficult for us to obtain financing on our Agency RMBS on acceptable terms or at all, or to maintain compliance with the terms of any financing transactions. Difficult conditions in the mortgage and residential and commercial real estate markets have caused and may cause us to experience losses and these conditions may persist for the foreseeable future.
Our business is materially affected by conditions in the residential mortgage market, the residential and commercial real estate market, the financial markets and the economy generally. Furthermore, because a significant portion of our current assets and our targeted assets are credit sensitive, we believe the risks associated with our investments will be more acute during periods of economic slowdown or recession, especially if these periods are accompanied by declining real estate values and defaults. Continued concerns about the health of the global economy generally and the residential and commercial mortgage markets specifically, as well as inflation, energy costs, sovereign debt and geopolitical issues and the availability and cost of credit have contributed to increased volatility and diminished expectations for the economy and markets going forward. The residential and commercial mortgage markets were adversely affected by changes in the lending landscape during the financial market crisis of 2008, the severity of which was largely unanticipated by the markets, and there is no assurance that these markets will return to prior levels or that they will not worsen again.
17
In addition, an economic slowdown, delayed recovery or general disruption in the mortgage markets may result in decreased demand for
residential and commercial property, which would likely further compress homeownership rates and place additional pressure on home price performance, while forcing commercial property owners to lower rents on properties with excess supply. We believe there is a strong correlation between home price growth rates and mortgage loan delinquencies. Moreover, to the extent that a property owner has fewer tenants or receives lower rents, such property owners will generate less cash flow on their properties, which increases significantly the likelihood that such property owners will default on their debt service obligations. If the borrowers of our mortgage loans, or the loans underlying certain of our investment securities, default, we may incur losses on those loans or investment securities. Any sustained period of increased payment delinquencies, foreclosures or losses could adversely affect both our net interest income and our ability to acquire our targeted assets in the future on favorable terms or at all. The further deterioration of the mortgage markets, the residential or commercial real estate markets, the financial markets and the economy generally may result in a decline in the market value of our investments or cause us to experience losses related to our assets, which may adversely affect our results of operations, the availability and cost of credit and our ability to make distributions to our stockholders. Interest rate mismatches between the interest-earning assets held in our investment portfolio and the borrowings used to fund the purchases of those assets may reduce our net income or result in a loss during periods of changing interest rates.
Certain of the assets held in our investment portfolio have a fixed coupon rate, generally for a significant period, and in some cases, for the average maturity of the asset. At the same time, our repurchase agreements and certain other borrowings typically provide for a payment reset period of 30 days or less. In addition, the average maturity of our borrowings generally will be shorter than the average maturity of the securities and loans currently in our portfolio and certain other targeted assets in which we seek to invest. Historically, we have used swap agreements as a means for attempting to fix the cost of certain of our liabilities over a period of time; however, these agreements will generally not be sufficient to match the cost of all our liabilities against all of our investments. In the event we experience unexpectedly high or low prepayment rates on RMBS or other mortgage-related assets, our strategy for matching our assets with our liabilities is more likely to be unsuccessful which may result in reduced earnings or losses and reduced cash available for distribution to our stockholders.
In addition, the RMBS and residential mortgage loans we invest in may be comprised of, ARMs that are subject to periodic and lifetime interest rate caps. Periodic interest rate caps limit the amount an interest rate can increase during any given period. Lifetime interest rate caps limit the amount an interest rate can increase over the life of the security or loan. Our borrowings typically are not subject to similar restrictions. Accordingly, in a period of rapidly increasing interest rates, the interest rates paid on our borrowings could increase without limitation while interest rate caps could limit the interest rates on the Agency ARMs or residential mortgage loans comprised of ARMs in our portfolio. This problem is magnified for securities backed by, or residential mortgage loans comprised of, ARMs and hybrid ARMs that are not fully indexed. Further, certain securities backed by, or residential mortgage loans comprised of, ARMs and hybrid ARMs may be subject to periodic payment caps that result in a portion of the interest being deferred and added to the principal outstanding. As a result, the payments we receive on Agency ARMs backed by, or residential mortgage loans comprised of, ARMs and hybrid ARMs may be lower than the related debt service costs. These factors could have a material adverse effect on our business, financial condition and results of operations and our ability to make distributions to our stockholders.
Interest rate fluctuations will also cause variances in the yield curve, which may reduce our net income. The relationship between short-term and longer-term interest rates is often referred to as the “yield curve.” If short-term interest rates rise disproportionately relative to longer-term interest rates (a flattening of the yield curve), our borrowing costs may increase more rapidly than the interest income earned on our interest-earning assets. For example, because the Agency RMBS in our investment portfolio typically bear interest based on longer-term rates while our borrowings typically bear interest based on short-term rates, a flattening of the yield curve would tend to decrease our net income and the market value of these securities. Additionally, to the extent cash flows from investments that return scheduled and unscheduled principal are reinvested, the spread between the yields of the new investments and available borrowing rates may decline, which would likely decrease our net income. It is also possible that short-term interest rates may exceed longer-term interest rates (a yield curve inversion), in which event our borrowing costs may exceed our interest income and we could incur significant operating losses.
18
Mortgage loan modification programs and future legislative action may adversely affect the value of, and the returns on, our targeted assets.
The U.S. Government, through the U.S. Treasury, the Federal Housing Administration, or FHA, and the Federal Deposit Insurance Corporation, or “FDIC," commenced implementation of programs designed to provide homeowners with assistance in avoiding residential or commercial mortgage loan foreclosures, including the Home Affordable Modification Program, or “HAMP,” which provides homeowners with assistance in avoiding residential mortgage loan foreclosures, the Hope for Homeowners Program, or “H4H Program,” which allows certain distressed borrowers to refinance their mortgages into FHA-insured loans in order to avoid residential mortgage loan foreclosures, and the Home Affordable Refinance Program, or “HARP,” which allows borrowers who are current on their mortgage payments to refinance and reduce their monthly mortgage payments at loan-to-value ratios up to 125% without new mortgage insurance. The programs may involve, among other things, the modification of mortgage loans to reduce the principal amount of the loans or the rate of interest payable on the loans, or to extend the payment terms of the loans.
Loan modification and refinance programs may adversely affect the performance of Agency RMBS, non-Agency RMBS and residential mortgage loans owned by us. Residential distressed mortgage loans and non-Agency RMBS are particularly sensitive to loan modification and refinance programs, as a significant number of loan modifications with respect to a given security or pool of loans, including those related to principal forgiveness and coupon reduction, could negatively impact the realized yields and cash flows on such investments. In addition, it is also likely that loan modifications would result in increased prepayments on some RMBS and residential mortgage loans.
The U.S. Congress and various state and local legislatures have considered in the past, and in the future may adopt, legislation, which, among other provisions, would permit limited assignee liability for certain violations in the mortgage loan origination process, and would allow judicial modification of loan principal in the event of personal bankruptcy. We cannot predict whether or in what form the U.S. Congress or the various state and local legislatures may enact legislation affecting our business or whether any such legislation will require us to change our practices or make changes in our portfolio in the future. These changes, if required, could materially adversely affect our business, results of operations and financial condition and our ability to make distributions to our stockholders, particularly if we make such changes in response to new or amended laws, regulations or ordinances in any state where we acquire a significant portion of our mortgage loans, or if such changes result in us being held responsible for any violations in the mortgage loan origination process. These loan modification programs, future legislative or regulatory actions, including possible amendments to the bankruptcy laws, which result in the modification of outstanding residential mortgage loans, as well as changes in the requirements necessary to qualify for refinancing mortgage loans with Fannie Mae, Freddie Mac or Ginnie Mae, may adversely affect the value of, and the returns on, our assets which, in turn, could materially adversely affect our business, financial condition and results of operations and our ability to make distributions to our stockholders. Prepayment rates can change, adversely affecting the performance of our assets.
The frequency at which prepayments (including both voluntary prepayments by the borrowers and liquidations due to defaults and foreclosures) occur on the residential mortgage loans we own and those that underlie our RMBS is difficult to predict and is affected by a variety of factors, including the prevailing level of interest rates as well as economic, demographic, tax, social, legal, legislative and other factors. Generally, borrowers tend to prepay their mortgages when prevailing mortgage rates fall below the interest rates on their mortgage loans.
In general, “premium” securities (securities whose market values exceed their principal or par amounts) are adversely affected by faster-than-
anticipated prepayments because the above-market coupon that such premium securities carry will be earned for a shorter period of time. Generally, “discount” securities (securities whose principal or par amounts exceed their market values) are adversely affected by slower-than-anticipated prepayments. Since many RMBS will be discount securities when interest rates are high, and will be premium securities when interest rates are low, these RMBS may be adversely affected by changes in prepayments in any interest rate environment. Although we estimate prepayment rates to determine the effective yield of our assets and valuations, these estimates are not precise and prepayment rates do not necessarily change in a predictable manner as a function of interest rate changes
The adverse effects of prepayments may impact us in various ways. First, particular investments, such as IOs, may experience outright losses
in an environment of faster actual or anticipated prepayments. Second, particular investments may under-perform relative to any hedges that we may have constructed for these assets, resulting in a loss to us. In particular, prepayments (at par) may limit the potential upside of many RMBS to their principal or par amounts, whereas their corresponding hedges often have the potential for unlimited loss. Furthermore, to the extent that faster prepayment rates are due to lower interest rates, the principal payments received from prepayments will tend to be reinvested in lower-yielding assets, which may reduce our income in the long run. Therefore, if actual prepayment rates differ from anticipated prepayment rates, our business, financial condition and results of operations and ability to make distributions to our stockholders could be materially adversely affected.
19

Some of the commercial real estate loans we may originate or invest in may allow the borrower to make prepayments without incurring a
prepayment penalty and some may include provisions allowing the borrower to extend the term of the loan beyond the originally scheduled maturity. Because the decision to prepay or extend a commercial loan is typically controlled by the borrower, we may not accurately anticipate the timing of these events, which could affect the earnings and cash flows we anticipate and could impact our ability to finance these assets. Increased levels of prepayments on the mortgages underlying structured mortgage-backed securities, particularly IOs, might decrease net interest income or result in a net loss, which could materially adversely affect our business, financial condition and results of operations and our ability to pay distributions to our stockholders.
When we acquire structured mortgage-backed securities, such as IOs, we anticipate that the underlying mortgages will prepay at a projected
rate, generating an expected yield. When the prepayment rates on the mortgages underlying these securities are higher than expected, our returns on those securities may be materially adversely affected. For example, the value of our Agency IOs is extremely sensitive to prepayments because holders of these securities do not have the right to receive any principal payments on the underlying mortgages. Agency IOs currently comprise a significant percentage of our interest earning assets. As a result, increased levels of prepayments on our Agency IOs will negatively impact our net interest income and may result in a loss. Certain actions by the U.S. Federal Reserve could materially adversely affect our business, financial condition and results of operations and our ability to pay dividends to our stockholders.
On September 21, 2011, the U.S. Federal Reserve, or Federal Reserve, announced "Operation Twist," a program by which it purchased, by the end of December 2012, more than $650 billion of U.S. Treasury securities with remaining maturities between six and 30 years and sold an equal amount of U.S. Treasury securities with remaining maturities of three years or less. Operation Twist expired in December 2012. In addition, on September 13, 2012, the Federal Reserve announced a third round of quantitative easing, or "QE3," which was further expanded in December 2012. QE3 was part of the Federal Reserve’s accommodative monetary policy that was designed to keep long-term interest rates at low levels. QE3 involved the purchase by the Federal Reserve of an additional $40 billion of Agency RMBS and an additional $45 million of longer-term U.S. Treasury securities per month until key economic indicators show sufficient signs of improvement.
In December 2013, given indications that the U.S. economy had improved sufficiently, the Federal Reserve announced that it would reduce the pace of its purchases of longer-term U.S. Treasury securities to $40 billion per month and its purchases of Agency RMBS to $35 billion per month and that it will likely reduce the pace of asset purchases in further measured steps to be announced at future meetings. The Federal Reserve maintained it's announced pace for reducing purchases under QE3 and according, in October 2014, QE3 ended. Should the U.S. economy begin to indicate signs of deterioration, the Federal Reserve could decide to restart an asset purchase program or institute other measures designed to reduce interest rates. These measures could lead to a flattening in the yield curve, and increased prepayment rates (resulting from lower long-term interest rates, including mortgage rates), and a narrowing of our net interest margin. The modification or termination by the Federal Reserve of any of its programs could materially adversely affect our business, financial condition and results of operations, and our ability to make distributions to our stockholders. Our investments include high yield or subordinated and lower rated securities that have greater risks of loss than other investments, which could adversely affect our business, financial condition and cash available for dividends.
We own and seek to acquire higher yielding or subordinated or lower rated securities, including subordinated tranches of CMBS or non-Agency RMBS, which involve a higher degree of risk than other investments. Numerous factors may affect a company’s ability to repay its high yield or subordinated securities, including the failure to meet its business plan, a downturn in its industry or negative economic conditions. These securities may not be secured by mortgages or liens on assets. Our right to payment and security interest with respect to such securities may be subordinated to the payment rights and security interests of the senior lender. Therefore, we may be limited in our ability to enforce our rights to collect these loans and to recover any of the loan balance through a foreclosure of collateral. Our efforts to manage credit risks may fail.
Despite our efforts to manage credit risk, there are many aspects of credit risk that we cannot control. Our credit policies and procedures may not be successful in limiting future delinquencies, defaults, and losses, or they may not be cost effective. Our underwriting reviews may not be effective. Loan servicing companies may not cooperate with our loss mitigation efforts or those efforts may be ineffective. Service providers to securitizations, such as trustees, loans servicers, bond insurance providers, and custodians, may not perform in a manner that promotes our interests. Delay of foreclosures could delay resolution and increase ultimate loss severities, as a result.
20

The value of the properties collateralizing or underlying the loans or securities we own may decline. The frequency of default and the loss
severity on loans upon default may be greater than we anticipate. Interest-only loans, negative amortization loans, adjustable-rate loans, larger balance loans, reduced documentation loans, subprime loans, alt-a loans, second lien loans, loans in certain locations, and loans or investments that are partially collateralized by non-real estate assets may have increased risks and severity of loss. If property securing or underlying loans become real estate owned as a result of foreclosure, we bear the risk of not being able to sell the property and recovering our investment and of being exposed to the risks attendant to the ownership of real property. If we underestimate the loss-adjusted yields of our investments in credit sensitive assets, we may experience losses.
We and our managers expect to value our investments in many credit sensitive assets, including, but not limited to multi-family CMBS, based on loss-adjusted yields, taking into account estimated future losses on the mortgage loans that we are investing in or that are included in a particular securitization, and the estimated impact of these losses on expected future cash flows. Our loss estimates may not prove accurate, as actual results may vary from our estimates. In the event that we underestimate the losses relative to the price we pay for a particular investment, we may experience material losses with respect to such investment. We invest in CMBS that are subordinate to more senior securities issued by the applicable securitization, which entails certain risks.
We currently own and intend to continue to purchase principal only multi-family CMBS that represent the first loss tranche of a multi-family mortgage loan securitization. These first loss principal only securities are subject to the first risk of loss if any losses are realized on the underlying mortgage loans in the securitization. We also own and intend to continue to purchase interest only securities issued by multi-family mortgage loan securitizations. However, these interest only CMBS typically only receive payments of interest to the extent that there are funds available in the securitization to make the payments. CMBS generally entitle the holders thereof to receive payments that depend primarily on the cash flow from a specified pool of commercial or multi-family mortgage loans. Consequently, the CMBS, and in particular, first loss principal only CMBS, will be adversely affected by payment defaults, delinquencies and losses on the underlying mortgage loans, each of which could have a material adverse effect on our cash flows and results of operations. Residential mortgage loans, including subprime residential mortgage loans and non-performing , sub-performing and re-performing residential mortgage loans, are subject to increased risks.
We acquire and manage residential whole mortgage loans, including loans sourced from distressed markets. Residential mortgage loans, including non-performing, sub-performing and re-performing mortgage loans as well as subprime mortgage loans, are subject to increased risks of loss. Unlike Agency RMBS, the residential mortgage loans we invest in generally are not guaranteed by the federal government or any GSE. Additionally, by directly acquiring residential mortgage loans, we do not receive the structural credit enhancements that benefit senior tranches of RMBS. A residential whole mortgage loan is directly exposed to losses resulting from default. Therefore, the value of the underlying property, the creditworthiness and financial position of the borrower and the priority and enforceability of the lien will significantly impact the value of such mortgage. In the event of a foreclosure, we may assume direct ownership of the underlying real estate. The liquidation proceeds upon sale of such real estate may not be sufficient to recover our cost basis in the loan, and any costs or delays involved in the foreclosure or liquidation process may increase losses.
Residential whole mortgage loans are also subject to "special hazard" risk (property damage caused by hazards, such as earthquakes or environmental hazards, not covered by standard property insurance policies), and to bankruptcy risk (reduction in a borrower's mortgage debt by a bankruptcy court). In addition, claims may be assessed against us on account of our position as a mortgage holder or property owner, including assignee liability, responsibility for tax payments, environmental hazards and other liabilities. In some cases, these liabilities may be "recourse liabilities" or may otherwise lead to losses in excess of the purchase price of the related mortgage or property.
Our targeted assets currently include distressed residential loans that we acquire from third parties, typically at a discount. Distressed residential loans sell at a discount because they may constitute riskier investments than those selling at or above par value. The distressed residential loans we invest in may be distressed because a borrower may have defaulted thereupon, because the borrower is or has been in the past delinquent on paying all or a portion of his obligation under the loan or because the loan may otherwise contain credit quality that is considered to be poor. The likelihood of full recovery of a distressed loan’s principal and contractual interest is less than that for loans trading at or above par value. Although we typically expect to receive less than the principal amount or face value of the distressed residential loans that we purchase, the return that we in fact receive thereupon may be less than our investment in such loans due to the failure of the loans to perform or reperform. An economic downturn would exacerbate the risks of the recovery of the full value of the loan or the cost of our investment therein.
21

If we sell or transfer any whole mortgage loans to a third party, including a securitization entity, we may be required to repurchase such loans or indemnify such third party if we breach representations and warranties.
When we sell or transfer any whole mortgage loans to a third party, including a securitization entity, we generally are required to make customary representations and warranties about such loans to the third party. Our residential mortgage loan sale agreements and terms of any securitizations into which we sell or transfer loans will generally require us to repurchase or substitute loans in the event we breach a representation or warranty given to the loan purchaser or securitization. In addition, we may be required to repurchase loans as a result of borrower fraud or in the event of early payment default on a mortgage loan. The remedies available to a purchaser of mortgage loans are generally broader than those available to us against an originating broker or correspondent. Repurchased loans are typically worth only a fraction of the original price. Significant repurchase activity could materially adversely affect our business, financial condition and results of operations and our ability to pay dividends to our shareholders. The commercial mortgage loans we may originate or acquire and the mortgage loans underlying our CMBS investments are subject to the ability of the commercial property owner to generate net income from operating the property as well as the risks of delinquency and foreclosure.
Commercial mortgage loans are secured by multi-family or commercial property and are subject to risks of delinquency and foreclosure, and risk of loss that may be greater than similar risks associated with loans made on the security of single-family residential property. The ability of a borrower to repay a loan secured by an income-producing property typically is dependent primarily upon the successful operation of such property rather than upon the existence of independent income or assets of the borrower. If the net operating income of the property is reduced, the borrower's ability to repay the loan may be impaired. Net operating income of an income-producing property can be adversely affected by, among other things,
In the event of any default under a mortgage loan held directly by us, we will bear a risk of loss to the extent of any deficiency between the
value of the collateral and the outstanding principal and accrued interest of the mortgage loan, and any such losses could have a material adverse effect on our cash flow from operations and our ability to make distributions to our stockholders.
In the event of the bankruptcy of a mortgage loan borrower, the mortgage loan to such borrower will be deemed to be secured only to the extent of the value of the underlying collateral at the time of bankruptcy (as determined by the bankruptcy court), and the lien securing the mortgage loan will be subject to the avoidance powers of the bankruptcy trustee or debtor-in-possession to the extent the lien is unenforceable under state law. Foreclosure of a mortgage loan can be an expensive and lengthy process, which could have a substantial negative effect on our anticipated return on the foreclosed mortgage loan.
● tenant mix;
● success of tenant businesses;
● property management decisions;
● property location, condition, and design;
● new construction of competitive properties;
● changes in laws that increase operating expenses or limit rents that may be charged;
● changes in national, regional or local economic conditions and/or specific industry segments, including the credit and securitization
markets;
● declines in regional or local real estate values;
● declines in regional or local rental or occupancy rates;
● increases in interest rates, real estate tax rates, and other operating expenses;
● costs of remediation and liabilities associated with environmental conditions;
● the potential for uninsured or underinsured property losses;
● changes in governmental laws and regulations, including fiscal policies, zoning ordinances and environmental legislation and the related
costs of compliance; and
● acts of God, terrorist attacks, social unrest, and civil disturbances.
22

The preferred equity investments or mezzanine loan assets that we may acquire or originate will involve greater risks of loss than senior loans secured by income-producing properties.
We may acquire or originate mezzanine loans, which take the form of subordinated loans secured by second mortgages on the underlying property or loans secured by a pledge of the ownership interests of either the entity owning the property or a pledge of the ownership interests of the entity that owns the interest in the entity owning the property. We also may make preferred equity investments in the entity that owns the property. These types of assets involve a higher degree of risk than long-term senior mortgage lending secured by income-producing real property, because the loan may become unsecured or our equity investment may be effectively extinguished as a result of foreclosure by the senior lender. In addition, mezzanine loans and preferred equity investments are often used to achieve a very high leverage on large commercial projects, resulting in less equity in the property and increasing the risk of loss of principal or investment. If a borrower defaults on our mezzanine loan or debt senior to our loan, or in the event of a borrower bankruptcy, our mezzanine loan or preferred equity investment will be satisfied only after the senior debt, in case of a mezzanine loan, or all senior and subordinated debt, in case of a preferred equity investment, is paid in full. Where senior debt exists, the presence of intercreditor arrangements may limit our ability to amend our loan documents, assign our loans, accept prepayments, exercise our remedies or control decisions made in bankruptcy proceedings relating to borrowers or preferred equity investors. As a result, we may not recover some or all of our investment, which could result in significant losses. We have acquired and may acquire in the future non-Agency RMBS collateralized by subprime and Alt A mortgage loans, which are not guaranteed by any government-sponsored entity or agency and are subject to increased risks.
We have acquired and may acquire in the future non-Agency RMBS, which are backed by residential real estate property but, in contrast to Agency RMBS, their principal and interest are not guaranteed by a GSE such as Fannie Mae or Freddie Mac. We may acquire non-Agency RMBS backed by collateral pools of mortgage loans that have been originated using underwriting standards that are less restrictive than those used in underwriting “prime mortgage loans” and “Alt A mortgage loans.” These lower standards, which include mortgage loans made to borrowers having imperfect or impaired credit histories, mortgage loans where the amount of the loan at origination is 80% or more of the value of the mortgage property, mortgage loans made to borrowers with low credit scores, mortgage loans made to borrowers who have other debt that represents a large portion of their income and mortgage loans made to borrowers whose income is not required to be disclosed or verified, subject us to increased risk of loss on our investment. To the extent that due diligence is conducted on potential assets, such due diligence may not reveal all of the risks associated with such assets and may not reveal other weaknesses in such assets, which could lead to losses.
Before acquiring certain assets, such as whole mortgage loans, CMBS or other mortgage-related or other fixed income assets, we or the external manager responsible for the acquisition and management of such asset may decide to conduct (either directly or using third parties) certain due diligence. Such due diligence may include (i) an assessment of the strengths and weaknesses of the asset’s credit profile, (ii) a review of all or merely a subset of the documentation related to the asset, or (iii) other reviews that we or the external manager may deem appropriate to conduct. There can be no assurance that we or the external manager will conduct any specific level of due diligence, or that, among other things, the due diligence process will uncover all relevant facts or that any purchase will be successful, which could result in losses on these assets, which, in turn, could adversely affect our business, financial condition and results of operations and our ability to make distributions to our stockholders. Our real estate assets are subject to risks particular to real property.
We own real estate and assets secured by real estate, and may in the future acquire more real estate, either through direct acquisitions or upon a default of mortgage loans. Real estate assets are subject to various risks, including:
The occurrence of any of the foregoing or similar events may reduce our return from an affected property or asset and, consequently,
materially adversely affect our business, financial condition and results of operations and our ability to make distributions to our stockholders.
● acts of God, including earthquakes, floods and other natural disasters, which may result in uninsured losses;
● acts of war or terrorism, including the consequences of terrorist attacks, such as those that occurred on September 11, 2001;
● adverse changes in national and local economic and market conditions; and
● changes in governmental laws and regulations, fiscal policies and zoning ordinances and the related costs of compliance with laws and regulations, fiscal policies and ordinances;
23
The lack of liquidity in certain of our assets may adversely affect our business.
A portion of the securities or loans we own or acquire may be subject to legal, contractual and other restrictions on resale or will otherwise be less liquid than publicly-traded securities. For example, a portion of our multi-family CMBS is held by a securitization trust and may not be sold or transferred until the note issued by the securitization trust matures or is repaid. Similarly, any transfer of our investment in the equity and debt securities of an entity externally managed by RiverBanc requires prior consent of the Board and certain preferred equity interests in that entity. The illiquidity of certain of our assets may make it difficult for us to sell such assets if the need or desire arises. In addition, if we are required to liquidate all or a portion of our portfolio quickly, we may realize significantly less than the value at which we have previously recorded our assets. As a result, our ability to vary our portfolio in response to changes in economic and other conditions may be relatively limited, which could adversely affect our results of operations and financial condition. Our Level 2 portfolio investments are recorded at fair value based on market quotations from pricing services and broker/dealers. Our Level 3 investments are recorded at fair value utilizing internal valuation models. The value of our common stock could be adversely affected if our determinations regarding the fair value of these investments were materially higher than the values that we ultimately realize upon their disposal.
All of our current portfolio investments are, and some of our future portfolio investments will be, in the form of securities or other investments that are not publicly traded. The fair value of securities and other investments that are not publicly traded may not be readily determinable. We currently value and will continue to value these investments on a quarterly-basis at fair value as determined by our management based on market quotations from pricing services and brokers/dealers and/or internal valuation models. Because such quotations and valuations are inherently uncertain, they may fluctuate over short periods of time and are based on estimates, therefore our determinations of fair value may differ materially from the values that would have been used if a public market for these securities existed. The value of our common stock could be adversely affected if our determinations regarding the fair value of these investments were materially higher than the values that we ultimately realize upon their disposal. Our adoption of fair value option accounting could result in income statement volatility, which in turn, could cause significant market price and trading volume fluctuations for our securities.
We have determined that certain securitization trusts that issued certain of our multi-family CMBS or securitized debt were variable interest entities, or VIEs, of which we are the primary beneficiary, and elected the fair value option on the assets and liabilities held within those securitization trusts. As a result, we are required to consolidate the underlying multi-family loan or securities, as applicable, related debt, interest income and interest expense of those securitization trusts in our financial statements, although our actual investments in these securitization trusts generally represent a small percentage of the total assets of the trusts. Prior to the year ended December 31, 2012, we historically accounted for the multi-family CMBS in our investment portfolio through accumulated other comprehensive income, pursuant to which unrealized gains and losses on those multi-family CMBS were reflected as an adjustment to stockholders’ equity. However, the fair value option requires that changes in valuations in the assets and liabilities of those VIEs of which we are the primary beneficiary, such as the Consolidated K-Series, be reflected through our earnings. As we acquire additional multi-family CMBS assets in the future that are similar in structure and form to the Consolidated K-Series’ assets or securitize investment securities owned by us, we may be required to consolidate the assets and liabilities of the issuing or securitization trust and would expect to elect the fair value option for those assets. Because of this, our earnings may experience greater volatility in the future as a decline in the fair value of the assets of any VIE that we consolidate in our financial statements could reduce both our earnings and stockholders' equity, which in turn, could cause significant market price and trading volume fluctuations for our securities. Failure to procure adequate funding and capital would adversely affect our results and may, in turn, negatively affect the value of our common stock and our ability to distribute cash to our stockholders.
We depend upon the availability of adequate funding and capital for our operations. To maintain our status as a REIT, we are required to distribute at least 90% of our REIT taxable income annually, determined without regard to the deduction for dividends paid and excluding net capital gain, to our stockholders and therefore are not able to retain our earnings for new investments. We cannot assure you that any, or sufficient, funding or capital will be available to us in the future on terms that are acceptable to us. In the event that we cannot obtain sufficient funding and capital on acceptable terms, there may be a negative impact on the value of our common stock and our ability to make distributions to our stockholders, and you may lose part or all of your investment.
24

Competition may prevent us from acquiring assets on favorable terms or at all, which could have a material adverse effect on our business, financial condition and results of operations.
We operate in a highly competitive market for investment opportunities. Our net income largely depends on our ability to acquire our targeted assets at favorable spreads over our borrowing costs. In acquiring our targeted assets, we compete with other REITs, investment banking firms, savings and loan associations, banks, insurance companies, mutual funds, other lenders and other entities that purchase mortgage-related assets, many of which have greater financial resources than us. Additionally, many of our potential competitors are not subject to REIT tax compliance or required to maintain an exemption from the Investment Company Act. As a result, we may not in the future be able to acquire sufficient quantities of our targeted assets at favorable spreads over our borrowing costs, which could have a material adverse effect on our business, financial condition, results of operations and ability to make distributions to our stockholders. Lack of diversification in the number of assets we acquire would increase our dependence on relatively few individual assets.
Our management objectives and policies do not place a limit on the size or the amount of capital used to support, or the exposure to (by any other measure), any individual asset or any group of assets with similar characteristics or risks. In addition, because we are a relatively small company, we may be unable to sufficiently deploy capital into a number of assets or asset groups. As a result, our portfolio may be concentrated in a small number of assets or may be otherwise undiversified, increasing the risk of loss and the magnitude of potential losses to us and our stockholders if one or more of these assets perform poorly. We may change our investment strategy, hedging strategy and asset allocation and operational and management policies without stockholder consent, which may result in the purchase of riskier assets and materially adversely affect our business, financial condition and results of operations and our ability to make distributions to our stockholders.
We may change our investment strategy, hedging strategy and asset allocation and operational and management policies at any time without the consent of our stockholders, which could result in our purchasing assets or entering into hedging transactions that are different from, and possibly riskier than, the assets and hedging transactions described in this report. A change in our investment strategy or hedging strategy may increase our exposure to real estate values, interest rates, prepayment rates, credit risk and other factors. A change in our asset allocation could result in us purchasing assets in classes different from those described in this report. Our Board of Directors determines our operational policies and may amend or revise our policies, including those with respect to our acquisitions, growth, operations, indebtedness, capitalization and distributions or approve transactions that deviate from these policies without a vote of, or notice to, our stockholders. In addition, certain of our external managers have great latitude in making investment and hedging decisions on our behalf. Changes in our investment strategy, hedging strategy and asset allocation and operational and management policies could materially adversely affect our business, financial condition and results of operations and ability to make distributions to our stockholders. Our senior management and our external managers will utilize analytical models and data in connection with the valuation of certain of our assets, and any incorrect, misleading or incomplete information used in connection therewith would subject us to potential risks.
Given the complexity of certain of our target assets, such as Agency IOs and multi-family CMBS, our senior management team and our
external managers must rely heavily on analytical models and information and data supplied by third parties. Models and data will be used to value potential target assets, potential credit risks and reserves and also in connection with hedging our acquisitions. In the event models and data prove to be incorrect, misleading or incomplete, any decisions made in reliance thereon expose us to potential risks. In connection with our operating and investment activity, we rely on third parties, including our external managers, to perform certain services, comply with applicable laws and regulations, and carry out contractual covenants and terms, the failure of which by any of these third parties may adversely impact our business and financial results.
In connection with our business of acquiring and holding loans, engaging in securitization transactions, and investing in third-party issued securities, we rely on third party service providers, including our external managers, to perform certain services, comply with applicable laws and regulations, and carry out contractual covenants and terms. As a result, we are subject to the risks associated with a third party’s failure to perform, including failure to perform due to reasons such as fraud, negligence, errors, miscalculations, or insolvency.
25

We may be affected by deficiencies in foreclosure practices of third parties, as well as related delays in the foreclosure process.
One of the biggest risks overhanging the RMBS market has been uncertainty around the timing and ability of servicers to foreclose on defaulted loans, so that they can liquidate the underlying properties and ultimately pass the liquidation proceeds through to RMBS holders. Given the magnitude of the housing crisis, and in response to the well-publicized failures of many servicers to follow proper foreclosure procedures (such as involving "robo-signing"), mortgage servicers are being held to much higher foreclosure-related documentation standards than they previously were. However, because many mortgages have been transferred and assigned multiple times (and by means of varying assignment procedures) throughout the origination, warehouse, and securitization processes, mortgage servicers are generally having much more difficulty furnishing the requisite documentation to initiate or complete foreclosures. This leads to stalled or suspended foreclosure proceedings, and ultimately additional foreclosure-related costs. Foreclosure-related delays also tend to increase ultimate loan loss severities as a result of property deterioration, amplified legal and other costs, and other factors. Many factors delaying foreclosure, such as borrower lawsuits and judicial backlog and scrutiny, are outside of a servicer's control and have delayed, and will likely continue to delay, foreclosure processing in both judicial states (where foreclosures require court involvement) and non-judicial states. The extension of foreclosure timelines also increases the inventory backlog of distressed homes on the market and creates greater uncertainty about housing prices. The concerns about deficiencies in foreclosure practices of servicers and related delays in the foreclosure process may impact our loss assumptions and affect the values of, and our returns on, our investments in RMBS and residential mortgage loans. We could be subject to liability for potential violations of predatory lending laws, which could materially adversely affect our business, financial condition and results of operations, and our ability to pay dividends to our stockholders.
Residential mortgage loan originators and servicers are required to comply with various federal, state and local laws and regulations, including anti-predatory lending laws and laws and regulations imposing certain restrictions on requirements on high cost loans. Failure of residential mortgage loan originators or servicers to comply with these laws, to the extent any of their residential mortgage loans become part of our investment portfolio, could subject us, as an assignee or purchaser of the related residential mortgage loans, to monetary penalties and could result in the borrowers rescinding the affected residential mortgage loans. Lawsuits have been brought in various states making claims against assignees or purchasers of high cost loans for violations of state law. Named defendants in these cases have included numerous participants within the secondary mortgage market. If the loans are found to have been originated in violation of predatory or abusive lending laws, we could incur losses that would materially adversely affect our business. We are highly dependent on information systems and system failures could significantly disrupt our business, which may, in turn, materially adversely affect our business, financial condition and results of operations and our ability to make distributions to our stockholders.
Our business is highly dependent on communications and information systems. Any failure or interruption of our systems could cause delays or other problems in our securities trading activities which could materially adversely affect our business, financial condition and results of operations and our ability to make distributions to our stockholders. The occurrence of cyber-incidents, or a deficiency in our cybersecurity or in those of any of our third party service providers, could negatively impact our business by causing a disruption to our operations, a compromise or corruption of our confidential information or damage to our business relationships or reputation, all of which could negatively impact our business and results of operations.
A cyber incident is considered to be any adverse event that threatens the confidentiality, integrity, or availability of our information resources or the information resources of our third party service providers. More specifically, a cyber-incident is an intentional attack or an unintentional event that can include gaining unauthorized access to systems to disrupt operations, corrupt data, or steal confidential information. As our reliance on technology has increased, so have the risks posed to our systems, both internal and those we have outsourced. The primary risks that could directly result from the occurrence of a cyber-incident include operational interruption and private data exposure. We have implemented processes, procedures and controls to help mitigate these risks, but these measures, as well as our increased awareness of a risk of a cyber-incident, do not guarantee that our business and results of operations will not be negatively impacted by such an incident. Actions of the U.S. Government to stabilize or reform the financial markets may not achieve the intended effect and may adversely affect our business.
In response to the financial issues affecting the banking system and financial markets and going concern threats to commercial banks, investment banks and other financial institutions, the Emergency Economic Stabilization Act (or EESA), was enacted by the U.S. Congress in 2008. Although this action and others implemented in response to the financial crisis appear to have stabilized the banking system and financial markets, there can be no assurance that the EESA or any other U.S. Government actions will have a long-term beneficial impact on the financial markets. To the extent such actions do not function as intended over the longer term, our business may not ultimately receive the anticipated positive impact from the legislation and such result may have broad adverse market implications.
26
In July 2010, the U.S. Congress enacted the Dodd-Frank Wall Street Reform and Consumer Protection Act, or the Dodd-Frank Act, in part to
impose significant investment restrictions and capital requirements on banking entities and other organizations that are significant to U.S. financial markets. For instance, the Dodd-Frank Act seeks to reform the asset-backed securitization market (including the mortgage-backed securities market) by requiring the retention of a portion of the credit risk inherent in the pool of securitized assets and by imposing additional registration and disclosure requirements. Certain of the new requirements and restrictions exempt Agency RMBS, other government issued or guaranteed securities, or other securities. Nonetheless, the Dodd-Frank Act also imposes significant regulatory restrictions on the origination and securitization of residential mortgage loans. The Dodd-Frank Act also created a new regulator, the Consumer Financial Protection Bureau (or the CFPB), which oversees many of the core laws which regulate the mortgage industry, including among others the Real Estate Settlement Procedures Act and the Truth in Lending Act. While the full impact of the Dodd-Frank Act and the role of the CFPB cannot be assessed until all implementing regulations are released, the Dodd-Frank Act's extensive requirements may have a significant effect on the financial markets, and may affect the availability or terms of financing from our lender counterparties and the availability or terms of mortgage-backed securities, both of which may have an adverse effect on our financial condition and results of operations.
In addition, the U.S. Government, Federal Reserve, U.S. Treasury, the SEC and other governmental and regulatory bodies have taken or are considering taking other actions that impact the mortgage industry and financial markets. We cannot predict whether or when such actions may occur or what effect, if any such actions could have on our business, results of operations and financial condition.
The downgrade of the U.S.'s and certain European countries' or certain European financial institutions’ credit ratings, any future downgrades of the U.S.'s and certain European countries' or certain European financial institutions’ credit ratings and the failure to resolve issues related to U.S. fiscal and debt policies may materially adversely affect our business, liquidity, financial condition and results of operations.
U.S. debt ceiling and budget deficit concerns in recent years have increased the possibility of credit-rating downgrades or economic slowdowns in the U.S. Although U.S. lawmakers passed legislation to raise the federal debt ceiling in 2011, Standard & Poor's Ratings Services lowered its long-term sovereign credit rating on the U.S. from “AAA” to “AA+” in August 2011. The impact of any further downgrades to the U.S. Government's sovereign credit rating or its perceived creditworthiness could adversely affect the U.S. and global financial markets and economic conditions. If the U.S.'s credit rating were downgraded it would likely impact the credit risk associated with Agency RMBS in our portfolio. A downgrade of the U.S. Government's credit rating or a default by the U.S. Government to satisfy its debt obligations likely would create broader financial turmoil and uncertainty, which would weigh heavily on the global banking system and these developments could cause interest rates and borrowing costs to rise and a reduction in the availability of credit, which may negatively impact the value of the assets in our portfolio, our net income, liquidity and our ability to finance our assets on favorable terms.
In addition, as economic uncertainty in Europe continues, the financial condition and stability of many European financial institutions remains
at risk. Some of these financial institutions have U.S. banking subsidiaries that serve as financing or hedging counterparties to us. Any future downgrade of the credit ratings of these European financial institutions would result in greater counterparty default risk and could materially adversely affect our business, liquidity, access to financing and results of operations
27

Risk Related to Our Debt Financing and Hedging Our access to financing sources, which may not be available on favorable terms, or at all, may be limited, and this may materially adversely affect our business, financial condition and results of operations and our ability to make distributions to our stockholders.
We depend upon the availability of adequate capital and financing sources on acceptable terms to fund our operations. However, as previously discussed, the capital and credit markets have experienced unprecedented levels of volatility and disruption in recent years that has generally caused a reduction of available credit. Continued volatility or disruption in the credit markets or a downturn in the global economy could materially adversely affect one or more of our lenders and could cause one or more of our lenders to be unwilling or unable to provide us with financing, or to increase the costs of that financing, or to become insolvent. Although we finance some of our assets with longer-term structured financing having terms of three years or more, we rely heavily on access to short-term borrowings, primarily in the form of repurchase agreements, to finance our investments. We are currently party to repurchase agreements of a short duration and there can be no assurance that we will be able to roll over or re-set these borrowings on favorable terms, if at all. In the event we are unable to roll over or re-set our repurchase agreement borrowings, it may be more difficult for us to obtain debt financing on favorable terms or at all. In addition, if regulatory capital requirements imposed on our lenders change, they may be required to limit, or increase the cost of, financing they provide to us. In general, this could potentially increase our financing costs and reduce our liquidity or require us to sell assets at an inopportune time or price. Under current market conditions, securitizations are generally unavailable or limited, which has also limited borrowings under warehouse facilities and other credit facilities that are intended to be refinanced by such securitizations. Consequently, depending on market conditions at the relevant time, we may have to rely on additional equity issuances to meet our capital and financing needs, which may be dilutive to our stockholders, or we may have to rely on less efficient forms of debt financing that restrict our operations or consume a larger portion of our cash flow from operations, thereby reducing funds available for our operations, future business opportunities, cash distributions to our stockholders and other purposes. We cannot assure you that we will have access to such equity or debt capital on favorable terms (including, without limitation, cost and term) at the desired times, or at all, which may cause us to curtail our investment activities and/or dispose of assets, which could materially adversely affect our business, financial condition and results of operations and our ability to make distributions to our stockholders.
We may incur increased borrowing costs related to repurchase agreements and that would adversely affect our profitability.
Currently, a significant portion of our borrowings are collateralized borrowings in the form of repurchase agreements. If the interest rates on these agreements increase at a rate higher than the increase in rates payable on our investments, our profitability would be adversely affected.
Our borrowing costs under repurchase agreements generally correspond to short-term interest rates such as LIBOR or a short-term Treasury index, plus or minus a margin. The margins on these borrowings over or under short-term interest rates may vary depending upon a number of factors, including, without limitation:
● the movement of interest rates;
● the availability of financing in the market; and
● the value and liquidity of our mortgage-related assets.
28

During 2008 and 2009, many repurchase agreement lenders required higher levels of collateral than they had required in the past to support
repurchase agreements collateralized by RMBS. Although these collateral requirements have been reduced to more appropriate levels, we cannot assure you that they will not again experience a dramatic increase. If the interest rates, lending margins or collateral requirements under our short-term borrowings, including repurchase agreements, increase, or if lenders impose other onerous terms to obtain this type of financing, our results of operations will be adversely affected. The repurchase agreements that we use to finance our investments may require us to provide additional collateral, which could reduce our liquidity and harm our financial condition.
We intend to use repurchase agreements to finance certain of our investments, primarily RMBS. If the market value of the loans or securities pledged or sold by us to a funding source decline in value, we may be required by the lending institution to provide additional collateral or pay down a portion of the funds advanced, but we may not have the funds available to do so. Posting additional collateral to support our repurchase agreements will reduce our liquidity and limit our ability to leverage our assets. In the event we do not have sufficient liquidity to meet such requirements, lending institutions can accelerate our indebtedness, increase our borrowing rates, liquidate our collateral at inopportune times and terminate our ability to borrow. This could result in a rapid deterioration of our financial condition and possibly require us to file for protection under the U.S. Bankruptcy Code.
We intend to leverage our equity, which will exacerbate any losses we incur on our current and future investments and may reduce cash available for distribution to our stockholders.
We intend to leverage our equity through borrowings, generally through the use of repurchase agreements and other short-term borrowings or through longer-term structured debt, such as CDOs and other forms of securitized debt. We may, in the future, utilize other forms of borrowing. The amount of leverage we incur varies depending on the asset type, our ability to obtain borrowings, the cost of the debt and our lenders’ estimates of the value of our portfolio’s cash flow. The return on our investments and cash available for distribution to our stockholders may be reduced to the extent that changes in market conditions cause the cost of our financing to increase relative to the income that can be derived from the assets we hold in our investment portfolio. Further, the leverage on our equity may exacerbate any losses we incur.
Our debt service payments will reduce the net income available for distribution to our stockholders. We may not be able to meet our debt
service obligations and, to the extent that we cannot, we risk the loss of some or all of our assets to sale to satisfy our debt obligations. A decrease in the value of the assets may lead to margin calls under our repurchase agreements which we will have to satisfy. Significant decreases in asset valuation, could lead to increased margin calls, and we may not have the funds available to satisfy any such margin calls. Although we have established target leverage amounts for many of our assets, there is no established limitation, other than may be required by our financing arrangements, on our leverage ratio or on the aggregate amount of our borrowings. If we are unable to leverage our equity to the extent we currently anticipate, the returns on certain of our assets could be diminished, which may limit or eliminate our ability to make distributions to our stockholders.
If we are limited in our ability to leverage our assets to the extent we currently anticipate, the returns on these assets may be harmed. A key element of our strategy is our use of leverage to increase the size of our portfolio in an attempt to enhance our returns. Our repurchase agreements are not currently committed facilities, meaning that the counterparties to these agreements may at any time choose to restrict or eliminate our future access to the facilities and we have no other committed credit facilities through which we may leverage our equity. If we are unable to leverage our equity to the extent we currently anticipate, the returns on our portfolio could be diminished, which may limit or eliminate our ability to make distributions to our stockholders.
29
We directly or indirectly utilize non-recourse securitizations and recourse structured financings and such structures expose us to risks that could result in losses to us.
We sometimes utilize non-recourse securitizations of our investments in mortgage loans or CMBS to the extent consistent with the maintenance of our REIT qualification and exemption from the Investment Company Act of 1940, as amended, in order to generate cash for funding new investments and/or to leverage existing assets. In most instances, this involves us transferring loans or CMBS owned by us to a SPE in exchange for cash and typically the ownership certificate or residual interest in the entity. In some sale transactions, we also retain a subordinated interest in the loans or CMBS sold, such as a B-note. The securitization or other structured financing of our portfolio investments might magnify our exposure to losses on those portfolio investments because the subordinated interest we retain in the loans or CMBS sold would be subordinate to the senior interest in the loans or CMBS sold, and we would, therefore, absorb all of the losses sustained with respect to a loan sold before the owners of the senior interest experience any losses. Under the terms of these financings, which generally have terms of three to ten years, we may agree to receive no cash flows from the assets transferred to the SPE until the debt issued by the special purpose entity has matured or been repaid. We cannot be assured that we will be able to access the securitization markets in the future, or be able to do so at favorable rates. The inability to consummate longer term financing for the credit sensitive assets in our portfolio could require us to seek other forms of potentially less attractive financing or to liquidate assets at an inopportune time or price, which could adversely affect our performance and our ability to grow our business.
In addition, under the terms of the securitization or structured financing, we may have limited or no ability to sell, transfer or replace the
assets transferred to the SPE, which could have a material adverse effect on our ability to sell the assets opportunistically or during periods when our liquidity is constrained or to refinance the assets. Finally, we have in the past and may in the future guarantee certain terms or conditions of these financings, including the payment of principal and interest on the debt issued by the SPE, the cash flows for which are typically derived from the assets transferred to the entity. If a SPE defaults on its obligations and we have guaranteed the satisfaction of that obligation, we may be materially adversely affected. If a counterparty to our repurchase transactions defaults on its obligation to resell the underlying security back to us at the end of the transaction term or if we default on our obligations under the repurchase agreement, we may incur losses.
When we engage in repurchase transactions, we generally sell RMBS, CMBS, mortgage loans or certain other assets to lenders (i.e., repurchase agreement counterparties) and receive cash from the lenders. The lenders are obligated to resell the same security or asset back to us at the end of the term of the transaction. Because the cash we receive from the lender when we initially sell the security or asset to the lender is less than the value of that security or asset (this difference is referred to as the “haircut”), if the lender defaults on its obligation to resell the same security or asset back to us we would incur a loss on the transaction equal to the amount of the haircut (assuming there was no change in the value of the security). Certain of the assets that we pledge as collateral, including Agency IOs, CLOs and distressed residential loans are currently subject to significant haircuts. Further, if we default on one of our obligations under a repurchase transaction, the lender can terminate the transaction and cease entering into any other repurchase transactions with us. Our repurchase agreements contain cross-default provisions, so that if a default occurs under any one agreement, the lenders under our other agreements could also declare a default. Any losses we incur on our repurchase transactions could adversely affect our earnings and thus our cash available for distribution to our stockholders. Our use of repurchase agreements to borrow funds may give our lenders greater rights in the event that either we or a lender files for bankruptcy.
Our borrowings under repurchase agreements may qualify for special treatment under the bankruptcy code, giving our lenders the ability to avoid the automatic stay provisions of the bankruptcy code and to take possession of and liquidate our collateral under the repurchase agreements without delay in the event that we file for bankruptcy. Furthermore, the special treatment of repurchase agreements under the bankruptcy code may make it difficult for us to recover our pledged assets in the event that a lender files for bankruptcy. Thus, the use of repurchase agreements exposes our pledged assets to risk in the event of a bankruptcy filing by either a lender or us. Our liquidity may be adversely affected by margin calls under our repurchase agreements because we are dependent in part on the lenders' valuation of the collateral securing the financing.
Each of these repurchase agreements allows the lender, to varying degrees, to revalue the collateral to values that the lender considers to reflect market value. If a lender determines that the value of the collateral has decreased, it may initiate a margin call requiring us to post additional collateral to cover the decrease. When we are subject to such a margin call, we must provide the lender with additional collateral or repay a portion of the outstanding borrowings with minimal notice. Any such margin call could harm our liquidity, results of operation and financial condition. Additionally, in order to obtain cash to satisfy a margin call, we may be required to liquidate assets at a disadvantageous time, which could cause it to incur further losses and adversely affect our results of operations and financial condition.
30
Adoption of the Basel III standards and other proposed supplementary regulatory standards may negatively impact our access to financing or affect the terms of our future financing arrangements.
In response to various financial crises and the volatility of financial markets, the Basel Committee on Banking Supervision adopted the Basel III standards several years ago. The final package of Basel III reforms was approved by the G20 leaders in November 2010. U.S. regulators have elected to implement substantially all of the Basel III standard, which could cause an increase in capital requirements for, and could place constraints on, the financial institutions from which we borrow. Financial institutions will have until 2019 to fully comply with the Basel III standards.
In 2014, U.S. regulators finalized rules that provide for enhanced supplementary leverage ratio standards, which impose capital requirements more stringent than those of the Basel III standards for the most systematically significant banking organizations in the U.S. Adoption and implementation of the Basel III standards and the supplemental regulatory standards that are currently being implemented by U.S. regulators may negatively impact our access to financing, particularly repurchase agreement financing for Agency RMBS, or affect the terms of our future financing arrangements. Hedging against credit events and interest rate changes and other risks may materially adversely affect our business, financial condition and results of operations and our ability to make distributions to our stockholders.
Subject to compliance with the requirements to qualify as a REIT, we engage in certain hedging transactions to limit our exposure to changes in interest rates and therefore may expose ourselves to risks associated with such transactions. We may utilize instruments such as interest rate swaps, caps, collars and floors and Eurodollar and U.S. Treasury futures to seek to hedge the interest rate risk associated with our portfolio. Hedging against a decline in the values of our portfolio positions does not eliminate the possibility of fluctuations in the values of such positions or prevent losses if the values of such positions decline. However, we may establish other hedging positions designed to gain from those same developments, thereby offsetting the decline in the value of such portfolio positions. Such hedging transactions may also limit the opportunity for gain if the values of the portfolio positions should increase. Moreover, at any point in time we may choose not to hedge all or a portion of these risks, and we generally will not hedge those risks that we believe are appropriate for us to take at such time, or that we believe would be impractical or prohibitively expensive to hedge.
Even if we do choose to hedge certain risks, for a variety of reasons we generally will not seek to establish a perfect correlation between our
hedging instruments and the risks being hedged. Any such imperfect correlation may prevent us from achieving the intended hedge and expose us to risk of loss. Our hedging activity will vary in scope based on the composition of our portfolio, our market views, and changing market conditions, including the level and volatility of interest rates. When we do choose to hedge, hedging may fail to protect or could materially adversely affect us because, among other things:
For these and other reasons, our hedging activity may materially adversely affect our business, financial condition and results of operations
and our ability to make distributions to our stockholders.
● either we or our external managers may fail to correctly assess the degree of correlation between the performance of the instruments used in
the hedging strategy and the performance of the assets in the portfolio being hedged;
● either we or our external managers may fail to recalculate, re-adjust and execute hedges in an efficient and timely manner;
● the hedging transactions may actually result in poorer over-all performance for us than if we had not engaged in the hedging transactions;
● credit hedging can be expensive, particularly when the market is forecasting future credit deterioration and when markets are more illiquid;
● interest rate hedging can be expensive, particularly during periods of volatile interest rates;
● available hedges may not correspond directly with the risks for which protection is sought;
● the durations of the hedges may not match the durations of the related assets or liabilities being hedged;
● many hedges are structured as over-the-counter contracts with counterparties whose creditworthiness is not guaranteed, raising the
possibility that the hedging counterparty may default on their payment obligations; and
● to the extent that the creditworthiness of a hedging counterparty deteriorates, it may be difficult or impossible to terminate or assign any
hedging transactions with such counterparty.
31
Hedging instruments and other derivatives may not, in many cases, be traded on regulated exchanges, or guaranteed or regulated by any U.S. or foreign governmental authorities and involve risks and costs that could result in material losses.
Hedging instruments and other derivatives involve risk because they may not, in many cases, be traded on regulated exchanges and may not be guaranteed or regulated by any U.S. or foreign governmental authorities. Consequently, for these instruments, there are no requirements with respect to record keeping, financial responsibility or segregation of customer funds and compliance with applicable statutory and commodity and other regulatory requirements and, depending on the identity of the counterparty, applicable international requirements. We are restricted from dealing with any particular counterparty or from concentrating any or all of our transactions with one counterparty. The business failure of a hedging counterparty with whom we enter into a hedging transaction will most likely result in a default under the hedging agreement. Default by a party with whom we enter into a hedging transaction may result in losses and may force us to re-initiate similar hedges with other counterparties at the then-prevailing market levels. Generally we will seek to reserve the right to terminate our hedging transactions upon a counterparty’s insolvency, but absent an actual insolvency, we may not be able to terminate a hedging transaction without the consent of the hedging counterparty, and we may not be able to assign or otherwise dispose of a hedging transaction to another counterparty without the consent of both the original hedging counterparty and the potential assignee. If we terminate a hedging transaction, we may not be able to enter into a replacement contract in order to cover our risk. There can be no assurance that a liquid secondary market will exist for hedging instruments purchased or sold, and therefore we may be required to maintain any hedging position until exercise or expiration, which could materially adversely affect our business, financial condition and results of operations.
The CFTC and certain commodity exchanges have established limits referred to as speculative position limits or position limits on the maximum net long or net short position which any person or group of persons may hold or control in particular futures and options. Limits on trading in options contracts also have been established by the various options exchanges. It is possible that trading decisions may have to be modified and that positions held may have to be liquidated in order to avoid exceeding such limits. Such modification or liquidation, if required, could materially adversely affect our business, financial condition and results of operation and our ability to make distributions to our stockholders. Certain of our hedging instruments are regulated by the CFTC and such regulations may cause us to incur increased compliance costs.
From time to time, we enter into interest rate swaps and other derivative instruments on corporate indices to hedge risks associated with our portfolio. Entities entering into such swaps are exposed to credit losses in the event of non-performance by counterparties to these transactions. Effective October 12, 2012, the CFTC issued new rules regarding such swaps under the authority granted to it pursuant to the Dodd-Frank Act. Although the new rules do not directly affect the negotiations and terms of individual hedging transactions between counterparties, they do require that since September 9, 2013, these swap transactions be cleared through registered derivatives clearing organizations, or swap execution facilities, through standardized documents under which each swap counterparty transfers its position to another entity, In this arrangement, the centralized clearinghouse effectively becomes the counterparty to each side of the swap. It is the intent of the Dodd-Frank Act that the clearing of swaps in this manner is designed to avoid concentration of swap risk in any single entity by spreading and centralizing the risk in the clearinghouse and its members. In addition to greater initial and periodic margin (collateral) requirements and additional transaction fees both by the swap execution facility and the clearinghouse, the swap transactions are now subjected to greater regulation by both the CFTC and the SEC. These additional fees, costs, margin requirements, documentation, and regulation could adversely affect our business and results of operations.
Additionally, for all swaps we entered into prior to September 9, 2013, we are not required to clear them through the central clearinghouse and these swaps are still subject to the risks of nonperformance by any of the individual counterparties with whom we entered into these transactions. Our delayed delivery transactions, including TBAs, subject us to certain risks, including price risks and counterparty risks.
We purchase a significant portion of our Agency RMBS through delayed delivery transactions, including TBAs. In a delayed delivery transaction, we enter into a forward purchase agreement with a counterparty to purchase either (i) an identified Agency RMBS, or (ii) a to-be-issued (or “to-be-announced”) Agency RMBS with certain terms. As with any forward purchase contract, the value of the underlying Agency RMBS may decrease between the contract date and the settlement date. Furthermore, a transaction counterparty may fail to deliver the underlying Agency RMBS at the settlement date. If any of the above risks were to occur, our financial condition and results of operations may be materially adversely affected.
32
Risks Related to Our Agreements with Our External Managers We are dependent on certain of our external managers and certain of their key personnel and may not find a suitable replacement if they terminate their respective management agreements with us or such key personnel are no longer available to us.
We historically were organized as a self-advised company that acquired, originated, sold and managed its assets; however, as we modified our business strategy and the targeted assets we seek to acquire in response to changing market conditions, we began to outsource the management of certain targeted asset classes for which we had limited internal resources or experience. We presently utilize three external managers to manage certain of our assets and investment strategies. Each of our external managers, in some manner, identifies, evaluates, negotiates, structures, closes and monitors certain investments on our behalf. In each case, we have engaged these third parties because of the expertise of certain key personnel of our external managers. The departure of any of the senior officers of our external managers, or of a significant number of investment professionals or principals of our external managers, could have a material adverse effect on our ability to achieve our investment objectives. We are subject to the risk that our external managers will terminate their respective management agreement with us or that we may deem it necessary to terminate such agreement or prevent certain individuals from performing services for us, and that no suitable replacement will be found to manage certain of our assets and investment strategies on a timely basis or at all. Pursuant to our management agreements, our external managers are entitled to receive a management fee that is payable regardless of the performance of the assets under their management.
We will pay each of our external managers substantial base management fees, based on our invested capital (as such term is defined in the respective management agreements), regardless of the performance of the assets under their management. The external managers’ entitlement in many cases to non-performance based compensation may reduce its incentive to devote the time and effort of its professionals to seeking profitable investment opportunities for our company, which could result in the under-performance of assets under their management and negatively affect our ability to pay distributions to our stockholders or to achieve capital appreciation. Pursuant to the terms of our management agreements, our external managers are generally entitled to receive an incentive fee, which may induce them to make certain investments, including speculative or high risk investments.
In addition to the base management fees payable to our external managers, our external managers are generally entitled to receive incentive compensation based, in part, upon the achievement of targeted levels of net income. In evaluating investments and other management strategies, the opportunity to earn incentive compensation based on net income may lead our external managers to place undue emphasis on the maximization of net income at the expense of other criteria, such as preservation of capital, maintaining liquidity and/or management of interest rate, credit or market risks, in order to achieve higher incentive compensation. Investments with higher yield potential are generally riskier or more speculative. In addition, Midway has broad discretion regarding the types of investments it will make pursuant to its management agreement with us. This could result in increased risk to the value of our assets under the management of our external managers. We compete with our external managers’ other clients for access to them.
Each of our external managers manages, and is expected to continue to manage, other client accounts with similar or overlapping investment strategies. In connection with the services provided to those accounts, these managers may be compensated more favorably than for the services provided under our external management agreements, and such discrepancies in compensation may affect the level of service provided to us by our external managers. Moreover, each of our external managers may have an economic interest in the accounts they manage or the investments they propose. As a result, we will compete with these other accounts and interests for access to our external managers and the benefits derived from those relationships. For the same reasons, the personnel of our external managers may be unable to dedicate a substantial portion of their time managing our investments to the extent they manage or are associated with any future investment vehicles not related to us. There are conflicts of interest in our relationships with our external managers, which could result in decisions that are not in the best interests of our stockholders.
We may acquire or sell assets in which an external manager or its affiliates have or may have an interest, or we may participate in co-investment opportunities with our external managers or their affiliates. In these cases, it is possible that our interests and the interests of our external managers will not always be aligned and this could result in decisions that are not in the best interests of our company. Similarly, our external managers or its affiliates may acquire or sell assets in which we have or may have an interest. Although such acquisitions or dispositions may present conflicts of interest, we nonetheless may pursue and consummate such transactions. Additionally, we may engage in transactions directly with our external managers or their affiliates, including the purchase and sale of all or a portion of a targeted asset.
33

Acquisitions made for entities with similar objectives may be different from those made on our behalf. Our external managers may have
economic interests in or other relationships with others in whose obligations or securities we may acquire. In particular, such persons may make and/or hold an investment in securities that we acquire that may be pari passu, senior or junior in ranking to our interest in the securities or in which partners, security holders, officers, directors, agents or employees of such persons serve on boards of directors or otherwise have ongoing relationships. Each of such ownership and other relationships may result in securities laws restrictions on transactions in such securities and otherwise create conflicts of interest. In such instances, the external managers may, in their sole discretion, make recommendations and decisions regarding such securities for other entities that may be the same as or different from those made with respect to securities acquired by us and may take actions (or omit to take actions) in the context of these other economic interests or relationships, the consequences of which may be adverse to our interests.
The key personnel of our external managers and its affiliates devote as much time to us as our external managers deem appropriate, however,
these individuals may have conflicts in allocating their time and services among us and their other accounts and investment vehicles. During turbulent conditions in the mortgage industry, distress in the credit markets or other times when we will need focused support and assistance from our external managers, other entities for which our external managers serve as manager, or their accounts, will likewise require greater focus and attention, placing the resources of our external managers in high demand. In such situations, we may not receive the necessary support and assistance we require or would otherwise receive if we were internally managed.
We, directly or through our external managers, may obtain confidential information about the companies or securities in which we have
invested or may invest. If we do possess confidential information about such companies or securities, there may be restrictions on our ability to dispose of, increase the amount of, or otherwise take action with respect to the securities of such companies. Our external managers’ management of other accounts could create a conflict of interest to the extent such external manager is aware of material non-public information concerning potential investment decisions and this in turn could impact our ability to make necessary investment decisions. Any limitations that develop as a result of our access to confidential information could therefore materially adversely affect our business, financial condition and results of operations and our ability to make distributions to our stockholders.
There are limitations on our ability to withdraw invested capital from the account managed by Midway and our inability to withdraw our invested capital when necessary may materially adversely affect our business, financial condition and results of operations and our ability to make distributions to our stockholders.
Pursuant to the terms of the Midway Management Agreement, we may only redeem invested capital in an amount equal to the lesser of 10% of the invested capital in the account managed by Midway or $10 million as of the last calendar day of the month upon not less than 75 days written notice, subject to our authority to direct Midway to modify its investment strategy for purposes of maintaining our qualification as a REIT and exemption from the Investment Company Act. In addition, we are only permitted to make one such redemption request in any 75-day period. In the event of a significant market event or shock, we may be unable to effect a redemption of invested capital in greater amounts or at a greater rate unless we obtain the consent of Midway. Moreover, because a reduction of invested capital would reduce the base management fee under the Midway Management Agreement, Midway may be less inclined to consent to such redemptions. If we are unable to withdraw invested capital as needed to meet our obligations in the future, our business and financial condition could be materially adversely affected. Termination of our external management agreements may be difficult and costly.
Termination of the RiverBanc Management Agreement without cause is subject to several conditions which may make such a termination difficult and costly. The RiverBanc Management Agreement provides that we may only terminate RiverBanc without cause and not be obligated to pay a termination fee unless we realize a negative 15% return on the assets managed for us by RiverBanc. Moreover, except as described in the preceding sentence, we cannot terminate RiverBanc without cause until expiration of the initial term and then only upon providing 180 days advance notice and subject to the payment of a termination fee equal to the product of (A) 24 and (B) the base management fee earned by RiverBanc during the one month period immediately preceding the termination date. Thus, in the event we elect not to renew the RiverBanc Management Agreement for any reason other than cause or as otherwise described in this paragraph, we will be required to pay this termination fee. In addition, the RiverBanc Management Agreement provides RiverBanc with an exclusive right of first refusal to purchase any of our assets managed by it subject to certain exceptions, in the event we terminate them for any reason. This provision could result in our loss of assets that our earnings are dependent upon or may cause us to sell assets prior to our recovery of lost value. These provisions may increase the effective cost to us of terminating the RiverBanc Management Agreement, thereby adversely affecting our ability to terminate RiverBanc without cause.
34

Pursuant to the Midway Management Agreement, in the event we determine to terminate the Midway Management Agreement at any time in
the future, Midway has the right to liquidate the assets it manages on our behalf in its sole discretion. Moreover, as discussed above, there are certain restrictions on our ability to redeem invested capital under the Midway Management Agreement. As a result, we may have little control over the liquidation of any of our assets that are managed by Midway or the timing of the full redemption of our invested capital, which may make it more difficult to terminate our agreement with Midway and could have a material adverse effect on our business, financial condition and results of operations. Risks Related to an Investment in Our Capital Stock The market price and trading volume of our stock may be volatile.
The market price of our stock is highly volatile and subject to wide fluctuations. In addition, the trading volume in our stock may fluctuate and cause significant price variations to occur. Some of the factors that could result in fluctuations in the price or trading volume of our stock include, among other things: actual or anticipated changes in our current or future financial performance; actual or anticipated changes in our current or future dividend yield; changes in market interest rates and general market and economic conditions. We cannot assure you that the market price of our stock will not fluctuate or decline significantly. We have not established a minimum dividend payment level for our common stockholders and there are no assurances of our ability to pay dividends to common or preferred stockholders in the future.
We intend to pay quarterly dividends and to make distributions to our common stockholders in amounts such that all or substantially all of our taxable income in each year, subject to certain adjustments, is distributed. This, along with other factors, should enable us to qualify for the tax benefits accorded to a REIT under the Internal Revenue Code. We have not established a minimum dividend payment level for our common stockholders and our ability to pay dividends may be harmed by the risk factors described herein. From July 2007 until April 2008, our Board of Directors elected to suspend the payment of quarterly dividends on our common stock. Our Board’s decision reflected our focus on the elimination of operating losses through the sale of our mortgage lending business and the conservation of capital to build future earnings from our portfolio management operations. All distributions to our common stockholders will be made at the discretion of our Board of Directors and will depend on our earnings, our financial condition, maintenance of our REIT status and such other factors as our Board of Directors may deem relevant from time to time. There are no assurances of our ability to pay dividends to our common or preferred stockholders in the future at the current rate or at all.
Future offerings of debt securities, which would rank senior to our common stock and preferred stock upon our liquidation, and future offerings of equity securities, which would dilute our existing stockholders and may be senior to our common stock for the purposes of dividend and liquidating distributions, may adversely affect the market price of our common stock.
In the future, we may attempt to increase our capital resources by making offerings of debt or additional offerings of equity securities, including commercial paper, medium-term notes, senior or subordinated notes and classes of preferred stock or common stock. Upon liquidation, holders of our debt securities and lenders with respect to other borrowings will receive a distribution of our available assets prior to the holders of our preferred stock and common stock, with holders of our preferred stock having priority over holders of our common stock. Additional equity offerings may dilute the holdings of our existing stockholders or reduce the market price of our common stock, or both. Because our decision to issue securities in any future offering will depend on market conditions and other factors beyond our control, we cannot predict or estimate the amount, timing or nature of our future offerings. Thus, holders of our common stock bear the risk of our future offerings reducing the market price of our common stock and diluting their stock holdings in us. Future sales of our stock could have an adverse effect on the price of our stock.
We cannot predict the effect, if any, of future sales of our stock, or the availability of shares for future sales, on the market price of our common or preferred stock. Sales of substantial amounts of stock, or the perception that such sales could occur, may adversely affect prevailing market prices for our common or preferred stock.
Your interest in us may be diluted if we issue additional shares.
Current stockholders of our company do not have preemptive rights to any common stock issued by us in the future. Therefore, our stockholders may experience dilution of their equity investment if we sell additional common stock in the future, sell securities that are convertible into common stock or issue shares of common stock or options exercisable for shares of common stock. In addition, we could sell securities at a price less than our then-current book value per share.
35

Investing in our securities may involve a high degree of risk.
The investments we make in accordance with our investment strategy may result in a high degree of risk, volatility or loss of principal than alternative investment options. Our investments may be highly speculative and aggressive, and therefore, an investment in our securities may not be suitable for someone with lower risk tolerance. Risks Related to Our Company, Structure and Change in Control Provisions Our directors have approved broad investment guidelines for us and do not approve each investment we make.
Our external managers are generally authorized to follow broad investment guidelines in determining which assets we will invest in. Although our Board of Directors will ultimately determine when and how much capital to allocate to our investment strategies, we generally will not, with certain exceptions, approve transactions in advance of their execution by these managers. In addition, in conducting periodic reviews, we will rely primarily on information provided to us by our external managers. Complicating matters further, our external managers may use complex investment strategies and transactions, which may be difficult or impossible to unwind. As a result, because our external managers have great latitude to determine the types of assets it may decide are proper investments for us, there can be no assurance that we would otherwise approve of these investments individually or that they will be successful. We are dependent on certain key personnel.
We are a small company and are substantially dependent upon the efforts of our Chief Executive Officer and President, Steven R. Mumma, and certain key individuals employed by our external managers. The loss of Mr. Mumma or any key personnel of our Company or our external manager or their services could have a material adverse effect on our operations. Certain provisions of Maryland law and our charter and bylaws could hinder, delay or prevent a change in control which could have an adverse effect on the value of our securities.
Certain provisions of Maryland law, our charter and our bylaws may have the effect of delaying, deferring or preventing transactions that involve an actual or threatened change in control. These provisions include the following, among others:
Although our Board of Directors has adopted a resolution exempting us from application of the Maryland Business Combination Act and our
bylaws provide that we are not subject to the Maryland Control Share Acquisition Act, our Board of Directors may elect to make the “business combination” statute and “control share” statute applicable to us at any time and may do so without stockholder approval.
● our charter provides that, subject to the rights of one or more classes or series of preferred stock to elect one or more directors, a director may be removed with or without cause only by the affirmative vote of holders of at least two-thirds of all votes entitled to be cast by our stockholders generally in the election of directors;
● our bylaws provide that only our Board of Directors shall have the authority to amend our bylaws;
● under our charter, our Board of Directors has authority to issue preferred stock from time to time, in one or more series and to establish the terms, preferences and rights of any such series, all without the approval of our stockholders;
● the Maryland Business Combination Act; and
● the Maryland Control Share Acquisition Act.
36
Maintenance of our Investment Company Act exemption imposes limits on our operations.
We have conducted and intend to continue to conduct our operations so as not to become regulated as an investment company under the Investment Company Act. We believe that there are a number of exclusions under the Investment Company Act that are applicable to us. To maintain the exclusion, the assets that we acquire are limited by the provisions of the Investment Company Act and the rules and regulations promulgated under the Investment Company Act. On August 31, 2011, the SEC published a concept release entitled “Companies Engaged in the Business of Acquiring Mortgages and Mortgage Related Instruments” (Investment Company Act Rel. No. 29778). This release suggests that the SEC may modify the exemption relied upon by companies similar to us that invest in mortgage loans and mortgage-backed securities. If the SEC acts to narrow the availability of, or if we otherwise fail to qualify for, our exclusion, we could, among other things, be required either (a) to change the manner in which we conduct our operations to avoid being required to register as an investment company or (b) to register as an investment company, either of which could have a material adverse effect on our operations and the market price of our common stock. The stock ownership limit imposed by our charter may inhibit market activity in our common stock and may restrict our business combination opportunities.
In order for us to maintain our qualification as a REIT under the Code, not more than 50% in value of the issued and outstanding shares of our capital stock may be owned, actually or constructively, by five or fewer individuals (as defined in the Code to include certain entities) at any time during the last half of each taxable year (other than our first year as a REIT). This test is known as the “5/50 test.” Attribution rules in the Code apply to determine if any individual or entity actually or constructively owns our capital stock for purposes of this requirement. Additionally, at least 100 persons must beneficially own our capital stock during at least 335 days of each taxable year (other than our first year as a REIT). To help ensure that we meet these tests, our charter restricts the acquisition and ownership of shares of our capital stock. Our charter, with certain exceptions, authorizes our directors to take such actions as are necessary and desirable to preserve our qualification as a REIT and provides that, unless exempted by our Board of Directors, no person may own more than 9.9% in value of the aggregate of the outstanding shares of our capital stock or more than 9.9% in value or in number of shares, whichever is more restrictive, of the aggregate of our outstanding shares of common stock. The ownership limits contained in our charter could delay or prevent a transaction or a change in control of our company under circumstances that otherwise could provide our stockholders with the opportunity to realize a premium over the then current market price for our common stock or would otherwise be in the best interests of our stockholders. Tax Risks Related to Our Structure Failure to qualify as a REIT would adversely affect our operations and ability to make distributions.
We have operated and intend to continue to operate so to qualify as a REIT for federal income tax purposes. Our continued qualification as a REIT will depend on our ability to meet various requirements concerning, among other things, the ownership of our outstanding stock, the nature of our assets, the sources of our income, and the amount of our distributions to our stockholders. In order to satisfy these requirements, we might have to forego investments we might otherwise make. Thus, compliance with the REIT requirements may hinder our investment performance. Moreover, while we intend to continue to operate so to qualify as a REIT for federal income tax purposes, given the highly complex nature of the rules governing REITs, there can be no assurance that we will so qualify in any taxable year.
If we fail to qualify as a REIT in any taxable year and we do not qualify for certain statutory relief provisions, we would be subject to federal
income tax (including any applicable alternative minimum tax) on our taxable income at regular corporate rates. We might be required to borrow funds or liquidate some investments in order to pay the applicable tax. Our payment of income tax would reduce our net earnings available for investment or distribution to stockholders. Furthermore, if we fail to qualify as a REIT and do not qualify for certain statutory relief provisions, we would no longer be required to make distributions to stockholders. Unless our failure to qualify as a REIT were excused under the federal income tax laws, we generally would be disqualified from treatment as a REIT for the four taxable years following the year in which we lost our REIT status.
REIT distribution requirements could adversely affect our liquidity.
In order to qualify as a REIT, we generally are required each year to distribute to our stockholders at least 90% of our REIT taxable income, excluding any net capital gain. To the extent that we distribute at least 90%, but less than 100% of our REIT taxable income, we will be subject to corporate income tax on our undistributed REIT taxable income. In addition, we will be subject to a 4% nondeductible excise tax on the amount, if any, by which certain distributions paid by us with respect to any calendar year are less than the sum of (i) 85% of our ordinary REIT income for that year, (ii) 95% of our REIT capital gain net income for that year, and (iii) 100% of our undistributed REIT taxable income from prior years.
37
We have made and intend to continue to make distributions to our stockholders to comply with the 90% distribution requirement and to avoid
corporate income tax and the nondeductible excise tax. However, differences in timing between the recognition of REIT taxable income and the actual receipt of cash could require us to sell assets or to borrow funds on a short-term basis to meet the 90% distribution requirement and to avoid corporate income tax and the nondeductible excise tax.
Certain of our assets may generate substantial mismatches between REIT taxable income and available cash. Such assets could include
mortgage-backed securities we hold that have been issued at a discount and require the accrual of taxable income in advance of the receipt of cash. As a result, our taxable income may exceed our cash available for distribution and the requirement to distribute a substantial portion of our net taxable income could cause us to:
Further, our lenders could require us to enter into negative covenants, including restrictions on our ability to distribute funds or to employ
leverage, which could inhibit our ability to satisfy the 90% distribution requirement. Dividends payable by REITs do not qualify for the reduced tax rates on dividend income from regular corporations.
The maximum U.S. federal income tax rate for dividends payable to domestic stockholders that are individuals, trust and estates is 20%. Dividends payable by REITs, however, are generally not eligible for the reduced rates. Although the reduced U.S. federal income tax rate applicable to dividend income from regular corporate dividends does not adversely affect the taxation of REITs or dividends paid by REITs, the more favorable rate applicable to regular corporate dividends could cause investors who are individuals, trusts and estates to perceive investments in REITs to be relatively less attractive than investments in the stocks of non-REIT corporations that pay dividends, which could adversely affect the value of the shares of REITs, including our common shares. Complying with REIT requirements may cause us to forego or liquidate otherwise attractive investments. To qualify as a REIT, we must continually satisfy various tests regarding the sources of our income, the nature and diversification of our assets, the amounts we distribute to our stockholders and the ownership of our common stock. In order to meet these tests, we may be required to forego investments we might otherwise make. We may be required to make distributions to stockholders at disadvantageous times or when we do not have funds readily available for distribution, and may be unable to pursue investments that would be otherwise advantageous to us in order to satisfy the source of income or asset diversification requirements for qualifying as a REIT. Thus, compliance with the REIT requirements may hinder our investment performance. Complying with REIT requirements may limit our ability to hedge effectively.
The REIT provisions of the Internal Revenue Code substantially limit our ability to hedge the RMBS in our investment portfolio. Our aggregate gross income from non-qualifying hedges, fees, and certain other non-qualifying sources cannot exceed 5% of our annual gross income. As a result, we might have to limit our use of advantageous hedging techniques or implement those hedges through a TRS. Any hedging income earned by a TRS would be subject to federal, state and local income tax at regular corporate rates. This could increase the cost of our hedging activities or expose us to greater risks associated with changes in interest rates than we would otherwise want to bear. Our ability to invest in distressed mortgage loans may be limited by our intention to maintain our qualification as a REIT, and our investments in distressed residential mortgage loans may affect our ability to qualify as a REIT.
We have acquired distressed mortgage loans and may acquire distressed mortgage loans in the future. In general, under the applicable Treasury Regulations, if a loan is secured by real property and other property and the highest principal amount of the loan outstanding during a taxable year exceeds the fair market value of the real property securing the loan as of (i) the date we agreed to acquire the loan or (ii) in the event of a significant modification, the date we modified the loan, then a portion of the interest income from such a loan will not be qualifying income for purposes of the 75% gross income test, but will be qualifying income for purposes of the 95% gross income test.
Although the law is not entirely clear, a portion of the loan will also likely be a non-qualifying asset for purposes of the 75% asset test. The non-qualifying portion of such a loan would be subject to, among other requirements, the 10% value test. Revenue Procedure 2014-52 provides a safe harbor under which the IRS has stated that it will not challenge a REIT’s treatment of a loan as being, in part, a qualifying real estate asset in an amount equal to the lesser of (i) the fair market value of the real property securing the loan determined as of the date the REIT committed to acquire the loan or (ii) the fair market value of the loan on the date of the relevant quarterly REIT asset testing date. This safe harbor will help us comply with the REIT asset tests immediately following the acquisition of a distressed mortgage loan. It will be less helpful if the value of the distressed mortgage loan increases over time. Under the safe harbor, when the current value of a distressed mortgage loan exceeds the fair market value of the real property
● sell assets in adverse market conditions, ● borrow on unfavorable terms or ● distribute amounts that would otherwise be invested in future acquisitions, capital expenditures or repayment of debt in order to comply
with the REIT distribution requirements.

that secures the loan, determined as of the date we committed to acquire the loan, the excess will be treated as a non-qualifying asset. Accordingly, an increasing portion of a distressed mortgage loan will be treated as a non-qualifying asset as the value of the distressed mortgage loan increases.
38

Revenue Procedure 2014-51 states that the IRS will treat distressed mortgage loans secured by real property and other property as producing
in part non-qualifying income for the 75% gross income test. Specifically, Revenue Procedure 2014-51 indicates that interest income on a distressed mortgage loan will be treated as qualifying income based on the ratio of (i) the fair market value of the real property securing the loan determined as of the date we committed to acquire the loan and (ii) the face amount of the loan (and not the purchase price or current value of the loan). The face amount of a distressed mortgage loan will typically exceed the fair market value of the real property securing the loan on the date we commit to acquire the loan. Accordingly, a distressed mortgage loan that is secured by real property and other property may produce a significant amount of non-qualifying income for purposes of the 75% gross income test and a significant portion of a distressed mortgage loan may be treated as a non-qualifying asset for the REIT asset tests once the loan increases in value. As noted above, the applicable Treasury Regulations require the apportionment of interest for purposes of the 75% gross income test only if the mortgage loan in question is secured by both real property and other property. To the extent that any distressed residential mortgage loan that we acquire is secured by both real property and other property, such loan will be subject to the apportionment rules described above. If we determine that a distressed residential mortgage loan is not subject to the apportionment rules described above because it is secured only by real property, no assurance could be given that the IRS would not assert successfully that the distressed residential mortgage loan was secured by property other than real property. In that case, a significant portion of our interest income from the distressed residential mortgage loan would be treated as non-qualifying income for the 75% gross income test. If we did not satisfy the 75% gross income test, we could lose our REIT qualification or be required to pay a penalty to the IRS.
Accordingly, we may be limited in our ability to invest in distressed mortgage loans and maintain our qualification as a REIT, and our investments in distressed residential mortgage loans could affect our ability to qualify as a REIT. Our ability to invest in and dispose of “to be announced” securities could be limited by our REIT status, and we could lose our REIT status as a result of these investments.
In connection with our investment in Agency IOs, we may purchase Agency RMBS through TBAs, or dollar roll transactions. In certain instances, rather than take delivery of the Agency RMBS subject to a TBA, we will dispose of the TBA through a dollar roll transaction in which we agree to purchase similar securities in the future at a predetermined price or otherwise, which may result in the recognition of income or gains. We account for dollar roll transactions as purchases and sales. The law is unclear regarding whether TBAs will be qualifying assets for the 75% asset test and whether income and gains from dispositions of TBAs will be qualifying income for the 75% gross income test.
Until such time as we seek and receive a favorable private letter ruling from the IRS, or we are advised by counsel that TBAs should be treated as qualifying assets for purposes of the 75% asset test, we will limit our investment in TBAs and any non-qualifying assets to no more than 25% of our assets at the end of any calendar quarter. Further, until such time as we seek and receive a favorable private letter ruling from the IRS or we are advised by counsel that income and gains from the disposition of TBAs should be treated as qualifying income for purposes of the 75% gross income test, we will limit our gains from dispositions of TBAs and any non-qualifying income to no more than 25% of our gross income for each calendar year. Accordingly, our ability to purchase Agency RMBS through TBAs and to dispose of TBAs, through dollar roll transactions or otherwise, could be limited.
Moreover, even if we are advised by counsel that TBAs should be treated as qualifying assets or that income and gains from dispositions of TBAs should be treated as qualifying income, it is possible that the IRS could successfully take the position that such assets are not qualifying assets and such income is not qualifying income. In that event, we could be subject to a penalty tax or we could fail to qualify as a REIT if (i) the value of our TBAs, together with our non-qualifying assets for the 75% asset test, exceeded 25% of our gross assets at the end of any calendar quarter or (ii) our income and gains from the disposition of TBAs, together with our non-qualifying income for the 75% gross income test, exceeded 25% of our gross income for any taxable year.
39

We may incur a significant tax liability as a result of selling assets that might be subject to the prohibited transactions tax if sold directly by us.
A REIT’s net income from prohibited transactions is subject to a 100% tax. In general, prohibited transactions are sales or other dispositions of assets held primarily for sale to customers in the ordinary course of business. There is a risk that certain loans that we are treating as owning for federal income tax purposes and property received upon foreclosure of these loans will be treated as held primarily for sale to customers in the ordinary course of business. Although we expect to avoid the prohibited transactions tax by contributing those assets to one of our TRS’s and conducting the marketing and sale of those assets through that TRS, no assurance can be given that the IRS will respect the transaction by which those assets are contributed to our TRS. Even if those contribution transactions are respected, our TRS will be subject to federal, state and local corporate income tax and may incur a significant tax liability as a result of those sales. Item 1B. UNRESOLVED STAFF COMMENTS
None. Item 2. PROPERTIES
The Company does not own any materially important physical properties; however, it does have residential homes (or real estate owned) that it acquires, from time to time, through or in lieu of foreclosures on mortgage loans. As of December 31, 2014, our principal executive and administrative offices are located in leased space at 275 Madison Avenue, Suite 3200, New York, New York 10016. Item 3. LEGAL PROCEEDINGS
We are at times subject to various legal proceedings arising in the ordinary course of our business. As of the date of this report, we do not believe that any of our current legal proceedings, individually or in the aggregate, will have a material adverse effect on our operations, financial condition or cash flows. Item 4. MINE SAFETY DISCLOSURES
Not applicable.
40
PART II
Item 5. MARKET FOR REGISTRANT’S COMMON EQUITY, RELATED STOCKHOLDER MATTERS AND ISSUER PURCHASES OF EQUITY SECURITIES Market Price of and Dividends on the Registrant’s Common Equity and Related Stockholder Matters
Our common stock is traded on the NASDAQ Global Select Market under the trading symbol “NYMT”. As of December 31, 2014, we had 105,094,565 shares of common stock outstanding and as of December 31, 2014, there were approximately 27 holders of record of our common stock. This figure does not reflect the beneficial ownership of shares held in nominee name.
The following table sets forth, for the periods indicated, the high, low and quarter end closing sales prices per share of our common stock and
the cash dividends paid or payable on our common stock on a per share basis:
We intend to continue to pay quarterly dividends to holders of shares of common stock. Future distributions will be at the discretion of the
Board of Directors and will depend on our earnings and financial condition, maintenance of our REIT qualification, restrictions on making distributions under Maryland law and such other factors as our Board of Directors deems relevant.
Purchases of Equity Securities by the Issuer and Affiliated Purchasers
The Company has a share repurchase program, which it previously announced in November 2005. At management’s discretion, the Company is authorized to repurchase shares of Company common stock in the open market or through privately negotiated transactions through December 31, 2015. The plan may be temporarily or permanently suspended or discontinued at any time. The Company has not repurchased any shares since March 2006 and currently has no intention to recommence repurchases in the near-future.
Common Stock Prices Cash Dividends
High Low Quarter
End Declaration
D ate Pa yment
Date Amount
P er Share Year Ended December 31, 2014 Fourth quarter $ 8.20 $ 7.30 $ 7.71 12/12/2014 01/26/2015 $ 0.27 Third quarter 8.03 7.23 7.23 09/18/2014 10/27/2014 0.27 Second quarter 8.12 7.16 7.81 06/18/2014 07/25/2014 0.27 First quarter 8.04 6.79 7.78 03/13/2014 04/25/2014 0.27
Common Stock Prices Cash Dividends
High Low Quarter
End Declaration
Date Payment
Date Amount
P er Share Year Ended December 31, 2013 Fourth quarter $ 7.30 $ 6.08 $ 6.99 12/10/2013 01/27/2014 $ 0.27 Third quarter 6.80 5.57 6.24 09/12/2013 10/25/2013 0.27 Second quarter 7.38 6.57 6.77 06/18/2013 07/25/2013 0.27 First quarter 7.60 6.48 7.54 03/18/2013 04/25/2013 0.27
41
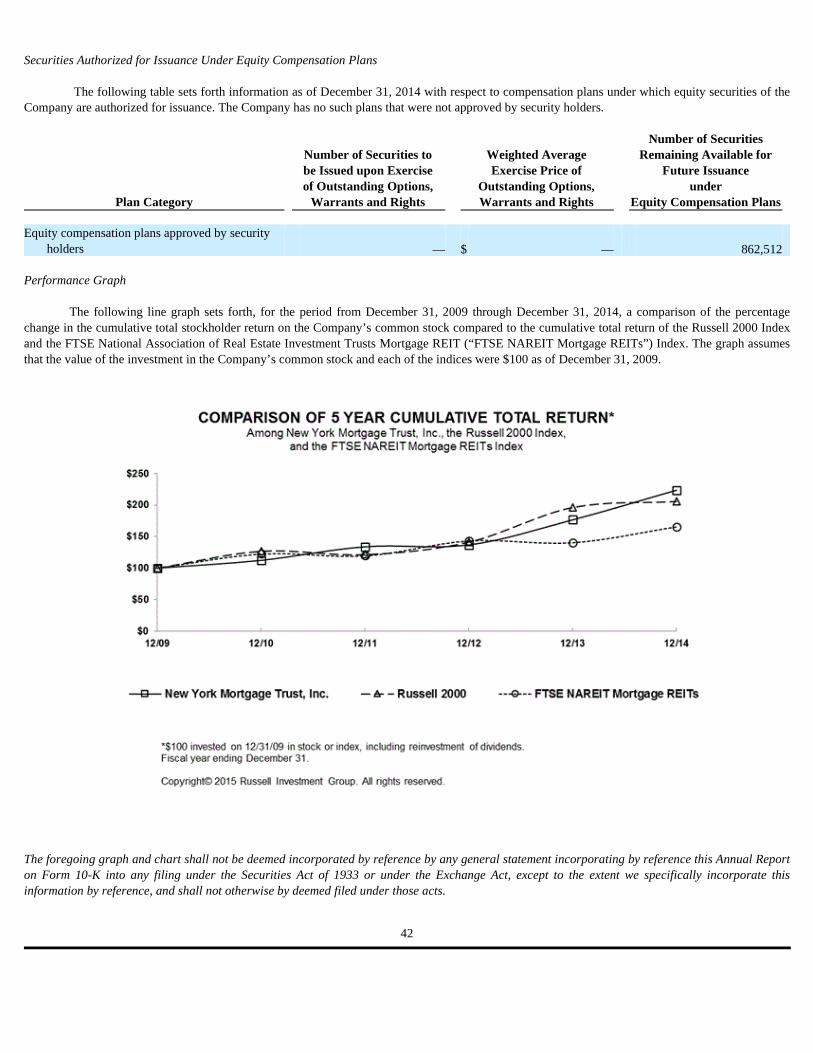
Securities Authorized for Issuance Under Equity Compensation Plans
The following table sets forth information as of December 31, 2014 with respect to compensation plans under which equity securities of the Company are authorized for issuance. The Company has no such plans that were not approved by security holders.
Performance Graph
The following line graph sets forth, for the period from December 31, 2009 through December 31, 2014, a comparison of the percentage change in the cumulative total stockholder return on the Company’s common stock compared to the cumulative total return of the Russell 2000 Index and the FTSE National Association of Real Estate Investment Trusts Mortgage REIT (“FTSE NAREIT Mortgage REITs”) Index. The graph assumes that the value of the investment in the Company’s common stock and each of the indices were $100 as of December 31, 2009.
The foregoing graph and chart shall not be deemed incorporated by reference by any general statement incorporating by reference this Annual Report on Form 10-K into any filing under the Securities Act of 1933 or under the Exchange Act, except to the extent we specifically incorporate this information by reference, and shall not otherwise by deemed filed under those acts.
Plan Category
Number of Securities to be Issued upon Exercise of Outstanding Options,
Warrants and Rights
Weighted Average Exercise Price of
Outstanding Options, Warrants and Rights
Number of Securities Remaining Available for
Future Issuance under
Equity Compensation Plans Equity compensation plans approved by security
holders — $ — 862,512
42

Item 6. SELECTED FINANCIAL DATA
The following table sets forth our selected historical operating and financial data. The selected historical operating and financial data for the
years ended December 31, 2014, 2013, 2012, 2011 and 2010 have been derived from our historical financial statements. The information presented below is only a summary and does not provide all of the information contained in our historical financial
statements, including the related notes. You should read the information below in conjunction with “Management’s Discussion and Analysis of Financial Condition and Results of Operations” and our historical financial statements, including the related notes, (amounts in thousands, except per share data):
Selected Statement of Operations Data:
Selected Balance Sheet Data:
For the Years Ended December 31,
201 4 201 3 201 2 201 1 20 10 Interest income $ 378,847 $ 291,727 $ 137,348 $ 24,291 $ 19,899 Interest expense 301,010 231,178 105,926 4,837 9,611
Net interest income 77,837 60,549 31,422 19,454 10,288 Other income (expense) 105,208 29,062 9,105 (3,693 ) 3,332 General, administrative and other expenses 40,459 19,917 11,427 10,518 7,950 Net income attributable to common stockholders $ 130,379 $ 65,387 $ 28,279 $ 4,776 $ 6,805 Per share basic income $ 1.48 $ 1.11 $ 1.08 $ 0.46 $ 0.72 Per share diluted income $ 1.48 $ 1.11 $ 1.08 $ 0.46 $ 0.72 Dividends declared per common share $ 1.08 $ 1.08 $ 1.06 $ 1.00 $ 0.79 Weighted average shares outstanding-basic 87,867 59,102 26,067 10,495 9,422 Weighted average shares outstanding-diluted 87,867 59,102 26,067 10,495 9,422
(1) Includes expenses incurred on termination of management contract amounting to $2.2 million for the year ended December 31, 2012.
As of December 31, 201 4 201 3 201 2 201 1 20 10 Investment securities, available for sale, at fair value $ 816,647 $ 912,443 $ 1,034,711 $ 200,342 $ 86,040 Investment securities, available for sale, at fair value held in
securitization trusts 38,594 92,578 71,159 — — Residential mortgage loans held in securitization trusts (net) 149,614 163,237 187,229 206,920 228,185 Distressed residential mortgage loans held in securitization
trusts (net) 221,591 254,721 60,459 — — Distressed residential mortgage loans 361,106 9,713 — — — Multi-family loans held in securitization trusts, at fair value 8,365,514 8,111,022 5,442,906 — — Total assets 10,540,005 9,898,675 7,160,401 682,705 374,294 Financing arrangements, portfolio investments 651,965 791,125 889,134 112,674 35,632 Financing arrangements, distressed residential mortgage
loans 238,949 — — — — Residential collateralized debt obligations 145,542 158,410 180,979 199,762 219,993 Multi-family collateralized debt obligations, at fair value 8,048,053 7,871,020 5,319,573 — — Securitized debt 232,877 304,964 117,591 — — Subordinated debentures (net) 45,000 45,000 45,000 45,000 45,000 Total liabilities 9,722,078 9,418,009 6,838,395 596,398 305,807 Total stockholders’ equity $ 817,927 $ 480,666 $ 322,006 $ 85,278 $ 68,487
(1) Our consolidated balance sheets include assets and liabilities of consolidated variable interest entities ("VIEs") as the Company is the primary beneficiary of these VIEs. As of December 31, 2014, December 31, 2013 and December 31, 2012, assets of Consolidated VIEs totaled $8,847,078, $8,665,829 and $5,786,569, respectively, and the liabilities of Consolidated VIEs totaled $8,457,034, $8,365,345 and $5,636,650, respectively. See Note 7 for further discussion.
43
(1)
(1)
(1)
Item 7. Management’s Discussion and Analysis of Financial Condition and Results of Operations General
We are a REIT, for federal income tax purposes, in the business of acquiring, investing in, financing and managing primarily mortgage-related assets and financial assets. Our objective is to manage a portfolio of investments that will deliver stable distributions to our stockholders over diverse economic conditions. We intend to achieve this objective through a combination of net interest margin and net realized capital gains from our investment portfolio. Our portfolio includes certain credit sensitive assets and investments sourced from distressed markets in recent years that create the potential for capital gains, as well as more traditional types of mortgage-related investments that generate interest income.
We have endeavored to build in recent years a diversified investment portfolio that includes elements of interest rate and credit risk, as we
believe a portfolio diversified among interest rate and credit risks are best suited to delivering stable cash flows over various economic cycles. Under our investment strategy, our targeted assets currently include residential mortgage loans, including distressed residential loans, multi-family CMBS, mezzanine loans to and preferred equity investments in owners of multi-family properties, equity and debt securities in entities that invest in commercial real estate-related debt investments and Agency RMBS. Subject to maintaining our qualification as a REIT, we also may opportunistically acquire and manage various other types of mortgage-related and financial assets that we believe will compensate us appropriately for the risks associated with them, including, without limitation, non-Agency RMBS (which may include IOs and POs), collateralized mortgage obligations and securities issued by newly originated residential securitizations, including credit sensitive securities from these securitizations.
We seek to achieve a balanced and diverse funding mix to finance our assets and operations. To this end, we rely primarily on a combination
of short-term borrowings, such as repurchase agreements with terms typically of 30 days (and, in some cases, up to one year) and longer term structured financings, such as securitization and re-securitization transactions, with terms longer than one year.
We internally manage a certain portion of our portfolio, including Agency ARMs, fixed-rate Agency RMBS, non-Agency RMBS, CLOs and
residential securitized loans. In addition, as part of our investment strategy, we also contract with certain external investment managers to manage specific asset types targeted by us. We are a party to separate investment management agreements with Headlands, Midway, and RiverBanc, with Headlands providing investment management services with respect to our investments in certain distressed residential mortgage loans, Midway providing investment management services with respect to our investments in Agency IOs, and RiverBanc providing investment management services with respect to our investments in multi-family CMBS and certain commercial real estate-related debt investments.
Significant Events in 2014
● We generated net income attributable to common stockholders of $130.4 million, or $1.48 per share;
● We declared aggregate 2014 dividends of $1.08 per common share;
● We issued 40,860,019 shares of common stock in three separate public offerings resulting in aggregate net proceeds to us of
approximately $296.5 million, after deducting underwriting discounts and commissions and offering expenses;
● We completed the sale of first loss PO securities and certain IO securities issued by two Freddie Mac-sponsored securitizations, realizing
an aggregate gain of approximately $39.1 million.
● We sold and refinanced distressed residential mortgage loans and residential mortgage loans with a carrying value, of approximately
$81.0 million for aggregate proceeds of approximately $95.4, which resulted in a net realized gain, before income taxes, of approximately $14.4 million; and
● We acquired residential mortgage loans, including distressed residential mortgage loans, for an aggregate purchase cost of approximately
$405.4 million.
44
Key Fourth Quarter 201 4 Developments Public Offering of Common Stock
On November 26, 2014, we closed on the issuance of 14,410,019 shares of common stock in an underwritten public offering (including 1,410,019 shares issued pursuant to an option granted to the underwriters), resulting in net proceeds to us of approximately $110.8 million, after deducting underwriting discounts, commissions and offering expenses. Sale of Multi-family CMBS
In December 2014, we completed the sale of a first loss PO security and certain IO securities issued by a single Freddie Mac-sponsored
securitization, realizing a gain of approximately $22.7 million. Sales and Refinancing of Distressed Residential Mortgage Loans
During the fourth quarter of 2014, we sold and refinanced distressed residential mortgage loans with a carrying value, of approximately $29.3 million for aggregate proceeds of approximately $34.2 million, which resulted in a net realized gain, before income taxes, of approximately $4.9 million.
Acquisition of a Pool of Distressed Residential Mortgage Loans
On December 29, 2014, we closed on the acquisition of a pool of distressed residential mortgage loans for an aggregate purchase price,
including accrued interest, of approximately $328.4 million. The pool was comprised of re-performing modified first lien mortgage loans having an aggregate unpaid principal balance of approximately $367.6 million on the closing date. We used the net proceeds from a public offering of shares of the Company’s common stock in November 2014 and approximately $238.9 million of borrowings under a master repurchase facility with Deutsche Bank AG, Cayman Islands Branch, to fund the acquisition.
Fourth Quarter 2014 Common Stock and Preferred Stock Dividends
On December 12, 2014, our Board of Directors declared a regular quarterly cash dividend of $0.27 per common share for the quarter ended
December 31, 2014. The dividend was paid on January 26, 2015 to our common stockholders of record as of December 22, 2014. On December 12, 2014, our Board of Directors declared a Series B Preferred Stock quarterly cash dividend of $0.484375 per share of Series
B Preferred Stock. The dividend was paid on January 15, 2015 to our preferred stockholders of record as of January 1, 2015.
Current Market Conditions and Commentar y
General. The U.S. economy showed modest signs of growth in 2014, with real gross domestic product (“GDP”) estimated to have expanded by 2.6% for the full year, as compared to growth of 2.2% in 2013 and slightly below the U.S. Federal Reserve’s (the “Federal Reserve”) December 2013 projection of 2.8% to 3.2% GDP growth in 2014. Data for the fourth quarter of 2014 suggests that economic activity slowed during the quarter with GDP only increasing by 2.6% in the fourth quarter 2014 compared to an increase of 5.0% in the third quarter 2014. According to the minutes of the Federal Reserve’s December 2014 meeting, Federal Reserve policymakers expect comparable GDP growth in 2015 and 2016, with the central tendency projections for GDP growth ranging from 2.6% to 3.0% for 2015 and 2.5% to 3.0% for 2016, with slower growth projected in 2017 and beyond.
The labor market displayed signs of improvement in 2014. According to the U.S. Department of Labor, the U.S. unemployment rate fell from
6.7% as of the end of December 2013 to 5.6% as of the end of December 2014, while total nonfarm payroll employment posted an average monthly increase of 246,000 jobs in 2014 as compared to an average monthly increase of 194,000 jobs in 2013. While these signs of employment growth are encouraging, the labor force participation rate has remained at historically low levels, raising concerns that the current unemployment rate is not an accurate measure of the economy’s overall health.
45

As widely publicized, since 2008, the Federal Reserve has undertaken three rounds of quantitative easing in an effort to support a stronger
economic recovery and to help ensure that inflation, over time, is at a rate that is most consistent with the Federal Reserve’s dual mandate of fostering maximum employment and price stability. The most current version of the Federal Reserve’s quantitative easing program, which is referred to as “QE3,” was originally established in September 2012 as an open-ended program to purchase an additional $40 billion of Agency RMBS per month until the unemployment rate, among other economic indicators, showed signs of improvement. This program, when combined with the Federal Reserve's programs to extend its holdings' average maturity, or “operation twist,” and reinvest principal payments from its holdings of agency debt and Agency RMBS into Agency RMBS, was expected to increase the Federal Reserve's holdings of long-term securities by approximately $85 billion per month through the end of 2012. As “operation twist” expired in December 2012, the Federal Reserve announced that it would continue purchasing additional Agency RMBS by about $40 billion per month and longer-term U.S. Treasury securities at a pace of $45 billion per month, and would continue its policy of reinvesting the principal payments from its holdings of Agency debt and Agency RMBS in Agency RMBS. This accommodative monetary policy has contributed to historically low-levels of interest rates and higher valuations for Agency RMBS.
On December 18, 2013, given indications that the U.S. economy had improved sufficiently, the Federal Reserve announced that it would reduce the pace of its purchases of (i) longer-term U.S. Treasury securities to $40 billion per month and (ii) Agency RMBS to $35 billion per month, and that it would likely reduce the pace of asset purchases in further measured steps throughout 2014 at future meetings. The Federal Reserve continued to reduce the pace of purchases throughout 2014, concluding its asset purchases under QE3 at the end of October 2014.
Notwithstanding the ending of QE3, the Federal Open Market Committee (the “FOMC”) has maintained its intent to keep the target range for the federal funds rate between 0% and 0.25% for the time being and in determining how long to maintain this target range, the FOMC will assess both realized and expected progress towards its objective of maximum employment and 2.0% inflation. Expectation for when the Federal Reserve will move the target range higher are varied, with some expecting an increase in the federal funds rate mid-year 2015, while others do not expect any movement until 2016. For now, it appears the market expects no change from the federal funds rate until late 2015 or into 2016 with the yield curve rate on the 10-year U.S. Treasury security declining during 2014 from 3.01% on January 2, 2014 to 1.96% at February 9, 2015.
Single-Family Homes and Residential Mortgage Market. Growth in the residential real estate market decelerated during 2014 resulting in modest home price increases as compared to 2013. Data released by S&P Indices for its S&P/Case-Shiller Home Price Indices for November 2014 showed that, on average, home prices increased 4.3% for the 20-City Composite over November 2013. However, since posting a 13.2% year-over-year gain in January 2014, the rate of year-over-year home price increase slowed substantially throughout the balance of 2014. While home prices increased moderately in 2014, single-family housing starts steadily increased throughout 2014. According to data provided by the U.S. Department of Commerce, privately-owned housing starts for single family homes averaged a seasonally adjusted annual rate of 707,700 during the fourth quarter of 2014, 652,000 during the third quarter of 2014, 625,300 during the second quarter of 2014 and 602,300 during the first quarter of 2014. Privately-owned housing starts for single family homes averaged a seasonally adjusted annual rate of 617,600 in the year ended December 31, 2013. We expect the single-family residential real estate market to continue to improve modestly in the near term, but believe that the run up in home prices over the past couple of years, the hesitancy of first-time home buyers to enter the market and the continued difficulty that many borrowers face in trying to obtain mortgage financing will continue to weigh on housing gains for single family homes in 2015. These conditions have resulted in reduced mortgage originations, and we expect this trend will continue in 2015. Improving single family housing fundamentals should have a positive impact on the overall credit profile of our portfolio of distressed residential loans, while reduced mortgage originations should result in a tighter supply of RMBS.
Multi-family Housing. Apartments and other residential rental properties remain one of the better performing segments of the commercial real estate market. According to data provided by the U.S. Department of Commerce in January 2015, starts on multi-family homes containing five units or more averaged a seasonally adjusted annual rate of 350,700 during the fourth quarter of 2014, 362,700 during the third quarter of 2014, 346,700 during the second quarter of 2014 and 311,700 during the first quarter of 2014. Housing starts on multi-family homes containing five units or more averaged a seasonally adjusted annual rate of 293,700 in the year ended December 31, 2013. Moreover, even with the recent growth in supply, vacancy trends in the multi-family sector appear to remain stable. According to the third quarter of 2014 Multifamily Vacancy Index (“MVI”), which is produced by the National Association of Home Builders and surveys the multifamily housing industry’s perception of vacancies, from the first quarter of 2013 through the third quarter of 2014, the MVI has produced readings between 37 and 42, this after reaching a high of 70 during the second quarter of 2009 (with higher numbers indicating higher vacancies). We believe the performance of multi-family housing over the past year is due, in part, to a significant decline in new construction during the recent economic downturn and increased demand from former homeowners, the hesitancy of first-time home buyers to purchase a home and the continued difficulty that many borrowers face in trying to obtain mortgage financing. In turn, these factors have contributed to stronger rental income growth in many U.S. markets and recent valuation improvements for multi-family properties and, we believe, negligible delinquencies on new multi-family loans originated by Freddie Mac and Fannie Mae.
46
Developments at Fannie Mae and Freddie Mac. Payments on the Agency ARMs and fixed-rate Agency RMBS in which we invest are
guaranteed by Fannie Mae and Freddie Mac. In addition, although not guaranteed by Freddie Mac, all of our multi-family CMBS has been issued by securitization vehicles sponsored by Freddie Mac and the Agency IOs we invest in are issued by Fannie Mae, Freddie Mac or Ginnie Mae. As broadly publicized, Fannie Mae and Freddie Mac are presently under federal conservatorship as the U.S. Government continues to evaluate the future of these entities and what role the U.S. Government should continue to play in the housing markets in the future. Since being placed under federal conservatorship, there have been a number of proposals introduced, both from industry groups and by the U.S. Congress, relating to changing the role of the U.S. government in the mortgage market and reforming or eliminating Fannie Mae and Freddie Mac. It remains unclear how the U.S. Congress will move forward on such reform at this time and what impact, if any, this reform will have on mortgage REITs.
Credit Spreads. Credit spreads in the residential and commercial markets generally continued to tighten further during 2014, continuing a trend that started in 2012. Typically when credit spreads widen, credit-sensitive assets such as CLOs and multi-family CMBS, as well as Agency IOs, are negatively impacted, while tightening credit spreads typically have a positive impact on the value of such assets.
Conditions for asset gathering were challenging throughout much of 2014, due, in part, to tightening spreads. In our view, further tightening of credit spreads has largely resulted from the continued pursuit of credit sensitive assets by a significant amount of investable capital, thereby placing upward pressure on the pricing of the credit sensitive assets that we currently target. Although this trend has had a positive impact on the value of many of the credit sensitive assets in our existing portfolio, which in turn helped to move our book value per common share to $7.07 as of December 31, 2014, it has resulted in a more challenging current return environment for new investment in these asset classes, particularly for new multi-family CMBS product. Given the current return environment, we expect to remain selective and opportunistic as we source new credit sensitive product in 2015, but remain focused in the current environment on allocating greater capital to credit sensitive assets that rely on asset selection rather than leverage to generate our targeted returns.
Financing markets and liquidity. During 2014, the closing yield of the ten-year U.S. Treasury Note traded between 3.01% and 2.07%, settling at 2.17% at December 31, 2014. Subsequent to December 31, 2014, the bond market has experienced a significant amount of volatility, with the closing yield on the ten-year U.S. Treasury Note falling as low as 1.68%. The 30-day London Interbank Offered Rate (“LIBOR”) was 0.16% at December 31, 2014, marking a decrease of approximately 1 basis point from December 31, 2013. We expect interest rates to rise over the longer term as the U.S. and global economic outlook improves. Significant Estimates and Critical Accounting Policies
We prepare our consolidated financial statements in conformity with U.S. GAAP, which requires the use of estimates, judgments and assumptions that affect reported amounts. These estimates are based, in part, on our judgment and assumptions regarding various economic conditions that we believe are reasonable based on facts and circumstances existing at the time of reporting. The results of these estimates affect reported amounts of assets, liabilities and accumulated other comprehensive income at the date of the consolidated financial statements and the reported amounts of income, expenses and other comprehensive income during the periods presented.
Changes in the estimates and assumptions could have a material effect on these financial statements. Accounting policies and estimates
related to specific components of our consolidated financial statements are disclosed in the notes to our consolidated financial statements. In accordance with SEC guidance, those material accounting policies and estimates that we believe are most critical to an investor’s understanding of our financial results and condition and which require complex management judgment are discussed below.
Revenue Recognition . Interest income on our investment securities and on our mortgage loans is accrued based on the outstanding principal balance and their contractual terms. Premiums and discounts associated with investment securities and mortgage loans at the time of purchase or origination are amortized into interest income over the life of such securities using the effective yield method. Adjustments to premium amortization are made for actual prepayment activity.
Interest income on our credit sensitive securities, such as our CLOs and certain of our CMBS that were purchased at a discount to par value, is
recognized based on the security’s effective interest rate. The effective interest rate on these securities is based on management’s estimate from each security of the projected cash flows, which are estimated based on the Company’s assumptions related to fluctuations in interest rates, prepayment speeds and the timing and amount of credit losses. On at least a quarterly basis, the Company reviews and, if appropriate, makes adjustments to its cash flow projections based on input and analysis received from external sources, internal models, and its judgment about interest rates, prepayment rates, the timing and amount of credit losses, and other factors. Changes in cash flows from those originally projected, or from those estimated at the last evaluation, may result in a prospective change in the yield/interest income recognized on these securities.
47

Based on the projected cash flows from the Company’s first loss PO multi-family CMBS purchased at a discount to par value, a portion of the
purchase discount is designated as non-accretable purchase discount or credit reserve, which partially mitigates the Company’s risk of loss on the mortgages collateralizing such CMBS, and is not expected to be accreted into interest income. The amount designated as a credit reserve may be adjusted over time, based on the actual performance of the security, its underlying collateral, actual and projected cash flow from such collateral, economic conditions and other factors. If the performance of a security with a credit reserve is more favorable than forecasted, a portion of the amount designated as credit reserve may be accreted into interest income over time. Conversely, if the performance of a security with a credit reserve is less favorable than forecasted, the amount designated as credit reserve may be increased, or impairment charges and write-downs of such securities to a new cost basis could result.
With respect to interest rate swaps that have not been designated as hedges, any net payments under, or fluctuations in the fair value of, such swaps will be recognized in current earnings.
Fair Value. The Company has established and documented processes for determining fair values. Fair value is based upon quoted market
prices, where available. If listed prices or quotes are not available, then fair value is based upon internally developed models that primarily use inputs that are market-based or independently-sourced market parameters, including interest rate yield curves. Such inputs to the valuation methodology are unobservable and significant to the fair value measurement. The Company’s IOs, POs, multi-family loans held in securitization trusts and multi-family CDOs are considered to be the most significant of its fair value estimates.
The Company’s valuation methodologies are described in “Note 14 – Fair Value of Financial Instruments” included in Item 8 of this Annual
Report on Form 10-K.
Residential Mortgage Loans Held in Securitization Trusts – Impaired Loans (net). Impaired residential mortgage loans held in the securitization trusts are recorded at amortized cost less specific loan loss reserves. Impaired loan value is based on management’s estimate of the net realizable value taking into consideration local market conditions of the distressed property, updated appraisal values of the property and estimated expenses required to remediate the impaired loan.
Variable Interest Entities – A variable interest entity (“VIE”) is an entity that lacks one or more of the characteristics of a voting interest
entity. A VIE is defined as an entity in which equity investors do not have the characteristics of a controlling financial interest or do not have sufficient equity at risk for the entity to finance its activities without additional subordinated financial support from other parties. The Company consolidates a VIE when it is the primary beneficiary of such VIE. As primary beneficiary, it has both the power to direct the activities that most significantly impact the economic performance of the VIE and a right to receive benefits or absorb losses of the entity that could be potentially significant to the VIE. The Company is required to reconsider its evaluation of whether to consolidate a VIE each reporting period, based upon changes in the facts and circumstances pertaining to the VIE.
Loan Consolidation Reporting Requirement for Certain Multi-Family K-Series Securitizations . As of December 31, 2014, we owned 100%
of the first loss securities of the “Consolidated K-Series.” The Consolidated K-Series collectively represents, as of December 31, 2014 and December 31, 2013, six separate Freddie Mac sponsored multi-family loan K-Series securitizations, of which we, or one of our special purpose entities, or SPEs, own the first loss PO securities and certain IO securities. We determined that the Consolidated K-Series were VIEs and that we are the primary beneficiary of the Consolidated K-Series. As a result, we are required to consolidate the Consolidated K-Series’ underlying multi-family loans including their liabilities, income and expenses in our consolidated financial statements. We have elected the fair value option on the assets and liabilities held within the Consolidated K-Series, which requires that changes in valuations in the assets and liabilities of the Consolidated K-Series will be reflected in our consolidated statement of operations.
Fair Value Option – The fair value option provides an election that allows companies to irrevocably elect fair value for financial assets and
liabilities on an instrument-by-instrument basis at initial recognition. Changes in fair value for assets and liabilities for which the election is made will be recognized in earnings as they occur. The Company elected the fair value option for its Agency IO strategy and the Consolidated K-Series (as defined in Note 2 to our consolidated financial statements included in this report).
Acquired Distressed Residential Mortgage Loans – Acquired distressed residential mortgage loans that have evidence of deteriorated credit quality at acquisition are accounted for under ASC Subtopic 310-30, "Loans and Debt Securities Acquired with Deteriorated Credit Quality" ("ASC 310-30"). Under ASC 310-30, the acquired loans may be aggregated and accounted for as a pool of loans if the loans being aggregated have common risk characteristics. A pool is accounted for as a single asset with a single composite interest rate and an aggregate expectation of cash flows. Once a pool is assembled, it is treated as if it was one loan for purposes of applying the accounting guidance.
48

Under ASC 310-30, the excess of cash flows expected to be collected over the carrying amount of the loans, referred to as the “accretable
yield,” is accreted into interest income over the life of the loans in each pool or individually using a level yield methodology. Accordingly, our acquired distressed residential mortgage loans accounted for under ASC 310-30 are not subject to classification as nonaccrual classification in the same manner as our residential mortgage loans that were not distressed when acquired by us. Rather, interest income on acquired distressed residential mortgage loans relates to the accretable yield recognized at the pool level or on an individual loan basis, and not to contractual interest payments received at the loan level. The difference between contractually required principal and interest payments and the cash flows expected to be collected, referred to as the “non-accretable difference,” includes estimates of both the impact of prepayments and expected credit losses over the life of the individual loan, or the pool (for loans grouped into a pool).
We monitor actual cash collections against our expectations, and revised cash flow expectations are prepared as necessary. A decrease in expected cash flows in subsequent periods may indicate that the loan pool or individual loan, as applicable, is impaired thus requiring the establishment of an allowance for loan losses by a charge to the provision for loan losses. An increase in expected cash flows in subsequent periods initially reduces any previously established allowance for loan losses by the increase in the present value of cash flows expected to be collected, and results in a recalculation of the amount of accretable yield for the loan pool. The adjustment of accretable yield due to an increase in expected cash flows is accounted for prospectively as a change in estimate. The additional cash flows expected to be collected are reclassified from the non-accretable difference to the accretable yield, and the amount of periodic accretion is adjusted accordingly over the remaining life of the loans in the pool or individual loan, as applicable.
Recent Accounting Pronouncements
A discussion of recent accounting pronouncements and the possible effects on our financial statements is included in “Note 2 — Summary of Significant Accounting Policies” included in Item 8 of this Annual Report on Form 10-K.
49
Capital Allocation
The following tables set forth our allocated capital by investment type at December 31, 2014 and December 31, 2013, respectively (dollar amounts in thousands): At December 31, 2014:
Agency
RMBS Agency
IOs Multi-
Family
Distressed Residential Loans
Residential Securitized Loans Other Total
Carrying value $ 660,374 $ 119,131 $ 430,789 $ 587,860 $ 149,614 $ 41,383 $ 1,989,151 Liabilities:
Callable (585,051 ) (66,914 ) — (238,949 ) — — (890,914 ) Non-callable — — (83,513 ) (149,364 ) (145,542 ) (45,000 ) (423,419 )
Hedges (Net) 3,501 11,415 — — — — 14,916 Cash 2,781 40,572 — — — 72,809 116,162 Other 2,731 3,329 (5,569 ) 39,759 1,531 (29,750 ) 12,031 Net capital allocated $ 84,336 $ 107,533 $ 341,707 $ 239,306 $ 5,603 $ 39,442 $ 817,927
Includes both Agency ARMs and Agency fixed rate RMBS. The Company determined it is the primary beneficiary of the Consolidated K-Series and has consolidated the Consolidated K-Series into the Company’s financial statements. A reconciliation to our financial statements as of December 31, 2014 follows:
Multi-Family loans held in securitization trusts, at fair value $ 8,365,514 Multi-Family CDOs, at fair value (8,048,053 ) Net carrying value 317,461 Investment securities available for sale, at fair value held in securitization trusts 38,594 Total CMBS, at fair value 356,055 First mortgage loan, mezzanine loan and preferred equity investments 74,734 Securitized debt (83,513 ) Other (5,569 )
Net Capital in Multi-Family $ 341,707
Includes mortgage loans held for sale with a carrying value of $5.2 million that is included in the Company’s accompanying consolidated balance sheet in receivables and other assets. Represents our residential mortgage loans held in securitization trusts. We securitized these loans in 2005.
Other includes CLOs having a carrying value of $35.2 million, non-Agency RMBS and loans held for investment. Other non-callable liabilities consist of $45.0 million in subordinated debentures.
Includes repurchase agreements. Includes derivative assets, derivative liabilities, payable for securities purchased and restricted cash posted as margin.
Includes $40.6 million held in overnight deposits in our Agency IO portfolio to be used for trading purposes. Such deposit is included in the Company’s accompanying consolidated balance sheet in receivables and other assets.
50
(1) (2) (3) ( 4 ) ( 5 )
( 6 )
( 7 ) ( 8 )
(1) (2)
( 3 )
( 4 )
( 5 )
( 6 )
( 7 ) ( 8 )
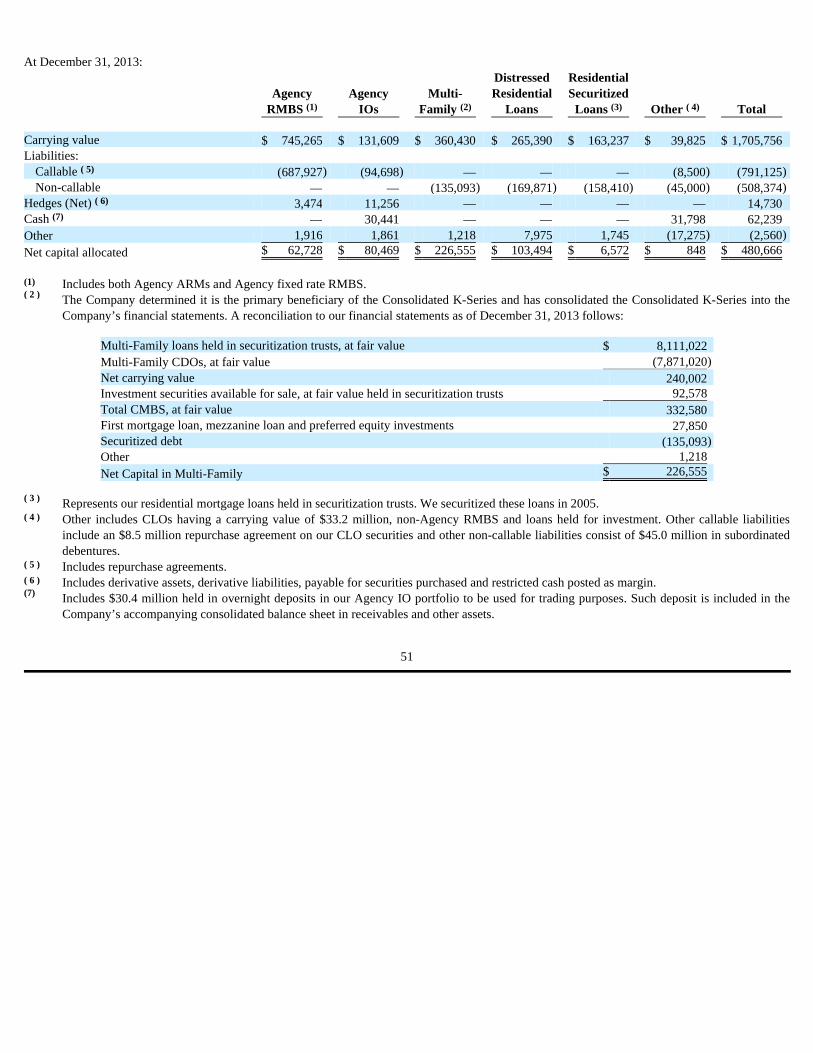
At December 31, 2013:
Agency
RMBS Agency
IOs Multi-
Family
Distressed Residential
Loans
Residential Securitized Loans Other Total
Carrying value $ 745,265 $ 131,609 $ 360,430 $ 265,390 $ 163,237 $ 39,825 $ 1,705,756 Liabilities:
Callable (687,927 ) (94,698 ) — — — (8,500 ) (791,125 ) Non-callable — — (135,093 ) (169,871 ) (158,410 ) (45,000 ) (508,374 )
Hedges (Net) 3,474 11,256 — — — — 14,730 Cash — 30,441 — — — 31,798 62,239 Other 1,916 1,861 1,218 7,975 1,745 (17,275 ) (2,560 )
Net capital allocated $ 62,728 $ 80,469 $ 226,555 $ 103,494 $ 6,572 $ 848 $ 480,666
Includes both Agency ARMs and Agency fixed rate RMBS. The Company determined it is the primary beneficiary of the Consolidated K-Series and has consolidated the Consolidated K-Series into the Company’s financial statements. A reconciliation to our financial statements as of December 31, 2013 follows:
Multi-Family loans held in securitization trusts, at fair value $ 8,111,022 Multi-Family CDOs, at fair value (7,871,020 ) Net carrying value 240,002 Investment securities available for sale, at fair value held in securitization trusts 92,578 Total CMBS, at fair value 332,580 First mortgage loan, mezzanine loan and preferred equity investments 27,850 Securitized debt (135,093 ) Other 1,218 Net Capital in Multi-Family $ 226,555
Represents our residential mortgage loans held in securitization trusts. We securitized these loans in 2005. Other includes CLOs having a carrying value of $33.2 million, non-Agency RMBS and loans held for investment. Other callable liabilities
include an $8.5 million repurchase agreement on our CLO securities and other non-callable liabilities consist of $45.0 million in subordinated debentures.
Includes repurchase agreements. Includes derivative assets, derivative liabilities, payable for securities purchased and restricted cash posted as margin.
Includes $30.4 million held in overnight deposits in our Agency IO portfolio to be used for trading purposes. Such deposit is included in the Company’s accompanying consolidated balance sheet in receivables and other assets.
51
(1) (2) (3) ( 4)
( 5)
( 6) (7)
(1) ( 2 )
( 3 )
( 4 )
( 5 )
( 6 ) (7)
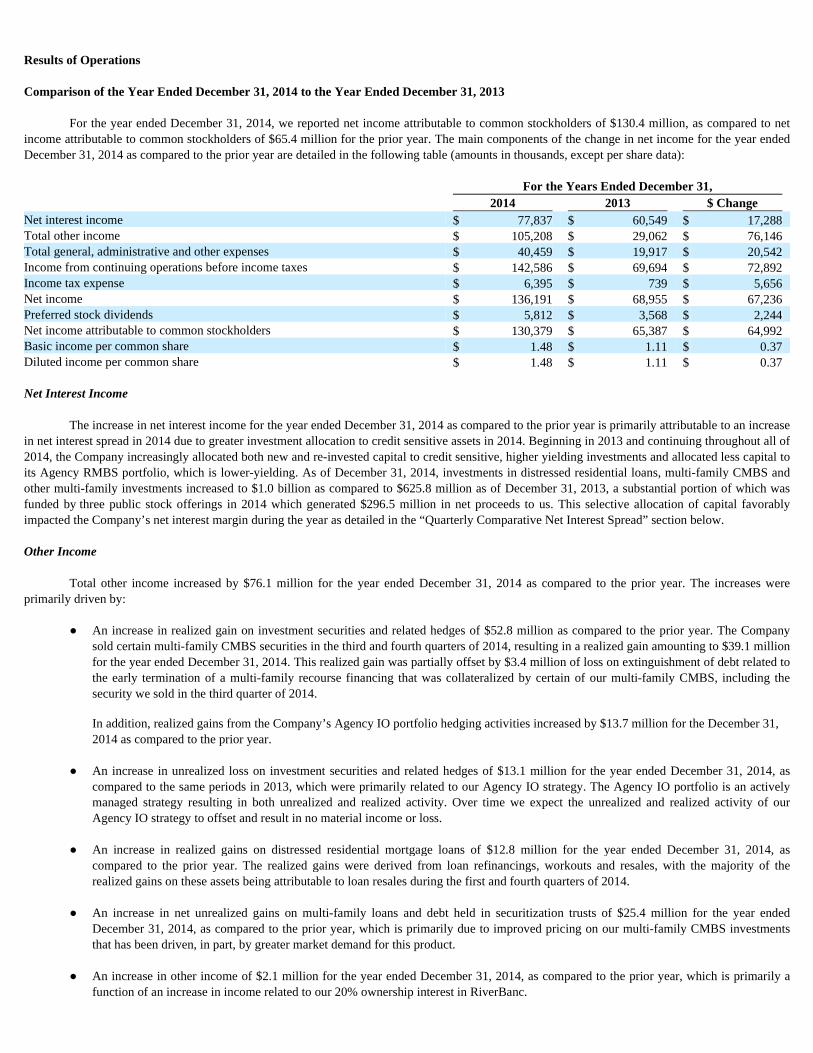
Results of Operations
Comparison of the Year Ended December 31, 2014 to the Year Ended December 31, 2013
For the year ended December 31, 2014, we reported net income attributable to common stockholders of $130.4 million, as compared to net income attributable to common stockholders of $65.4 million for the prior year. The main components of the change in net income for the year ended December 31, 2014 as compared to the prior year are detailed in the following table (amounts in thousands, except per share data):
Net Interest Income
The increase in net interest income for the year ended December 31, 2014 as compared to the prior year is primarily attributable to an increase
in net interest spread in 2014 due to greater investment allocation to credit sensitive assets in 2014. Beginning in 2013 and continuing throughout all of 2014, the Company increasingly allocated both new and re-invested capital to credit sensitive, higher yielding investments and allocated less capital to its Agency RMBS portfolio, which is lower-yielding. As of December 31, 2014, investments in distressed residential loans, multi-family CMBS and other multi-family investments increased to $1.0 billion as compared to $625.8 million as of December 31, 2013, a substantial portion of which was funded by three public stock offerings in 2014 which generated $296.5 million in net proceeds to us. This selective allocation of capital favorably impacted the Company’s net interest margin during the year as detailed in the “Quarterly Comparative Net Interest Spread” section below.
Other Income
Total other income increased by $76.1 million for the year ended December 31, 2014 as compared to the prior year. The increases were
primarily driven by:
For the Years Ended December 31, 2014 2013 $ Change Net interest income $ 77,837 $ 60,549 $ 17,288 Total other income $ 105,208 $ 29,062 $ 76,146 Total general, administrative and other expenses $ 40,459 $ 19,917 $ 20,542 Income from continuing operations before income taxes $ 142,586 $ 69,694 $ 72,892 Income tax expense $ 6,395 $ 739 $ 5,656 Net income $ 136,191 $ 68,955 $ 67,236 Preferred stock dividends $ 5,812 $ 3,568 $ 2,244 Net income attributable to common stockholders $ 130,379 $ 65,387 $ 64,992 Basic income per common share $ 1.48 $ 1.11 $ 0.37 Diluted income per common share $ 1.48 $ 1.11 $ 0.37
● An increase in realized gain on investment securities and related hedges of $52.8 million as compared to the prior year. The Company sold certain multi-family CMBS securities in the third and fourth quarters of 2014, resulting in a realized gain amounting to $39.1 million for the year ended December 31, 2014. This realized gain was partially offset by $3.4 million of loss on extinguishment of debt related to the early termination of a multi-family recourse financing that was collateralized by certain of our multi-family CMBS, including the security we sold in the third quarter of 2014.
In addition, realized gains from the Company’s Agency IO portfolio hedging activities increased by $13.7 million for the December 31,
2014 as compared to the prior year.
● An increase in unrealized loss on investment securities and related hedges of $13.1 million for the year ended December 31, 2014, as compared to the same periods in 2013, which were primarily related to our Agency IO strategy. The Agency IO portfolio is an actively managed strategy resulting in both unrealized and realized activity. Over time we expect the unrealized and realized activity of our Agency IO strategy to offset and result in no material income or loss.
● An increase in realized gains on distressed residential mortgage loans of $12.8 million for the year ended December 31, 2014, as
compared to the prior year. The realized gains were derived from loan refinancings, workouts and resales, with the majority of the realized gains on these assets being attributable to loan resales during the first and fourth quarters of 2014.
● An increase in net unrealized gains on multi-family loans and debt held in securitization trusts of $25.4 million for the year ended
December 31, 2014, as compared to the prior year, which is primarily due to improved pricing on our multi- family CMBS investments that has been driven, in part, by greater market demand for this product.
● An increase in other income of $2.1 million for the year ended December 31, 2014, as compared to the prior year, which is primarily a
function of an increase in income related to our 20% ownership interest in RiverBanc.

52
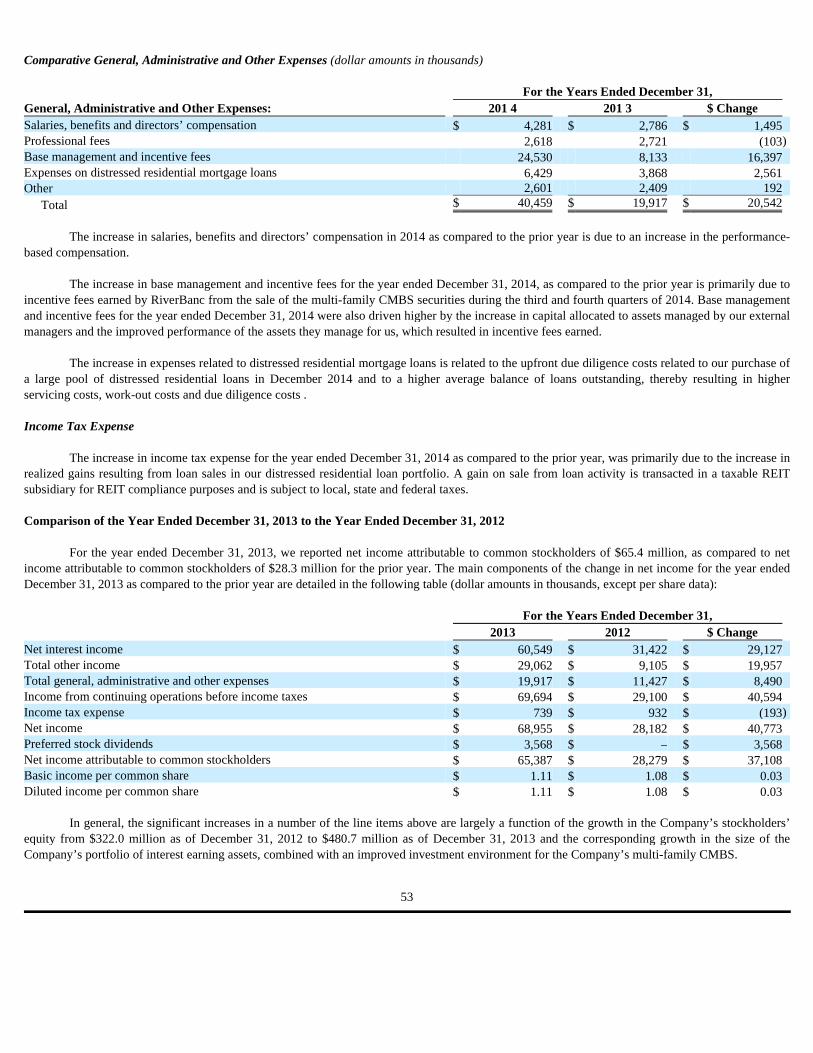
Comparative General, Administrative and Other Expenses (dollar amounts in thousands)
The increase in salaries, benefits and directors’ compensation in 2014 as compared to the prior year is due to an increase in the performance-
based compensation. The increase in base management and incentive fees for the year ended December 31, 2014, as compared to the prior year is primarily due to
incentive fees earned by RiverBanc from the sale of the multi-family CMBS securities during the third and fourth quarters of 2014. Base management and incentive fees for the year ended December 31, 2014 were also driven higher by the increase in capital allocated to assets managed by our external managers and the improved performance of the assets they manage for us, which resulted in incentive fees earned.
The increase in expenses related to distressed residential mortgage loans is related to the upfront due diligence costs related to our purchase of
a large pool of distressed residential loans in December 2014 and to a higher average balance of loans outstanding, thereby resulting in higher servicing costs, work-out costs and due diligence costs . Income Tax Expense
The increase in income tax expense for the year ended December 31, 2014 as compared to the prior year, was primarily due to the increase in
realized gains resulting from loan sales in our distressed residential loan portfolio. A gain on sale from loan activity is transacted in a taxable REIT subsidiary for REIT compliance purposes and is subject to local, state and federal taxes. Comparison of the Year Ended December 31, 2013 to the Year Ended December 31, 2012
For the year ended December 31, 2013, we reported net income attributable to common stockholders of $65.4 million, as compared to net income attributable to common stockholders of $28.3 million for the prior year. The main components of the change in net income for the year ended December 31, 2013 as compared to the prior year are detailed in the following table (dollar amounts in thousands, except per share data):
In general, the significant increases in a number of the line items above are largely a function of the growth in the Company’s stockholders’
equity from $322.0 million as of December 31, 2012 to $480.7 million as of December 31, 2013 and the corresponding growth in the size of the Company’s portfolio of interest earning assets, combined with an improved investment environment for the Company’s multi-family CMBS.
For the Years Ended December 31, General, Administrative and Other Expenses: 201 4 201 3 $ Change Salaries, benefits and directors’ compensation $ 4,281 $ 2,786 $ 1,495 Professional fees 2,618 2,721 (103 ) Base management and incentive fees 24,530 8,133 16,397 Expenses on distressed residential mortgage loans 6,429 3,868 2,561 Other 2,601 2,409 192
Total $ 40,459 $ 19,917 $ 20,542
For the Years Ended December 31, 2013 2012 $ Change Net interest income $ 60,549 $ 31,422 $ 29,127 Total other income $ 29,062 $ 9,105 $ 19,957 Total general, administrative and other expenses $ 19,917 $ 11,427 $ 8,490 Income from continuing operations before income taxes $ 69,694 $ 29,100 $ 40,594 Income tax expense $ 739 $ 932 $ (193 ) Net income $ 68,955 $ 28,182 $ 40,773 Preferred stock dividends $ 3,568 $ – $ 3,568 Net income attributable to common stockholders $ 65,387 $ 28,279 $ 37,108 Basic income per common share $ 1.11 $ 1.08 $ 0.03 Diluted income per common share $ 1.11 $ 1.08 $ 0.03
53
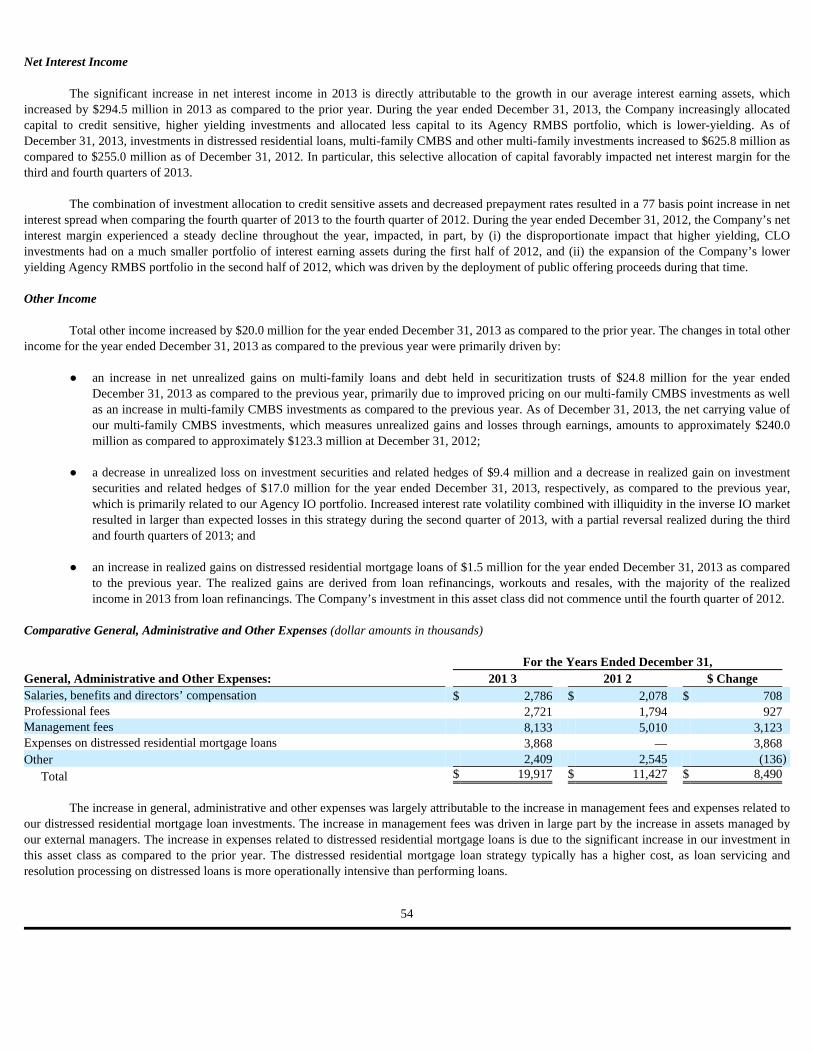
Net Interest Income
The significant increase in net interest income in 2013 is directly attributable to the growth in our average interest earning assets, which
increased by $294.5 million in 2013 as compared to the prior year. During the year ended December 31, 2013, the Company increasingly allocated capital to credit sensitive, higher yielding investments and allocated less capital to its Agency RMBS portfolio, which is lower-yielding. As of December 31, 2013, investments in distressed residential loans, multi-family CMBS and other multi-family investments increased to $625.8 million as compared to $255.0 million as of December 31, 2012. In particular, this selective allocation of capital favorably impacted net interest margin for the third and fourth quarters of 2013.
The combination of investment allocation to credit sensitive assets and decreased prepayment rates resulted in a 77 basis point increase in net
interest spread when comparing the fourth quarter of 2013 to the fourth quarter of 2012. During the year ended December 31, 2012, the Company’s net interest margin experienced a steady decline throughout the year, impacted, in part, by (i) the disproportionate impact that higher yielding, CLO investments had on a much smaller portfolio of interest earning assets during the first half of 2012, and (ii) the expansion of the Company’s lower yielding Agency RMBS portfolio in the second half of 2012, which was driven by the deployment of public offering proceeds during that time.
Other Income
Total other income increased by $20.0 million for the year ended December 31, 2013 as compared to the prior year. The changes in total other
income for the year ended December 31, 2013 as compared to the previous year were primarily driven by:
Comparative General, Administrative and Other Expenses (dollar amounts in thousands)
The increase in general, administrative and other expenses was largely attributable to the increase in management fees and expenses related to
our distressed residential mortgage loan investments. The increase in management fees was driven in large part by the increase in assets managed by our external managers. The increase in expenses related to distressed residential mortgage loans is due to the significant increase in our investment in this asset class as compared to the prior year. The distressed residential mortgage loan strategy typically has a higher cost, as loan servicing and resolution processing on distressed loans is more operationally intensive than performing loans.
● an increase in net unrealized gains on multi-family loans and debt held in securitization trusts of $24.8 million for the year ended December 31, 2013 as compared to the previous year, primarily due to improved pricing on our multi-family CMBS investments as well as an increase in multi-family CMBS investments as compared to the previous year. As of December 31, 2013, the net carrying value of our multi-family CMBS investments, which measures unrealized gains and losses through earnings, amounts to approximately $240.0 million as compared to approximately $123.3 million at December 31, 2012;
● a decrease in unrealized loss on investment securities and related hedges of $9.4 million and a decrease in realized gain on investment securities and related hedges of $17.0 million for the year ended December 31, 2013, respectively, as compared to the previous year, which is primarily related to our Agency IO portfolio. Increased interest rate volatility combined with illiquidity in the inverse IO market resulted in larger than expected losses in this strategy during the second quarter of 2013, with a partial reversal realized during the third and fourth quarters of 2013; and
● an increase in realized gains on distressed residential mortgage loans of $1.5 million for the year ended December 31, 2013 as compared
to the previous year. The realized gains are derived from loan refinancings, workouts and resales, with the majority of the realized income in 2013 from loan refinancings. The Company’s investment in this asset class did not commence until the fourth quarter of 2012.
For the Years Ended December 31, General, Administrative and Other Expenses: 201 3 201 2 $ Change Salaries, benefits and directors’ compensation $ 2,786 $ 2,078 $ 708 Professional fees 2,721 1,794 927 Management fees 8,133 5,010 3,123 Expenses on distressed residential mortgage loans 3,868 — 3,868 Other 2,409 2,545 (136 )
Total $ 19,917 $ 11,427 $ 8,490
54
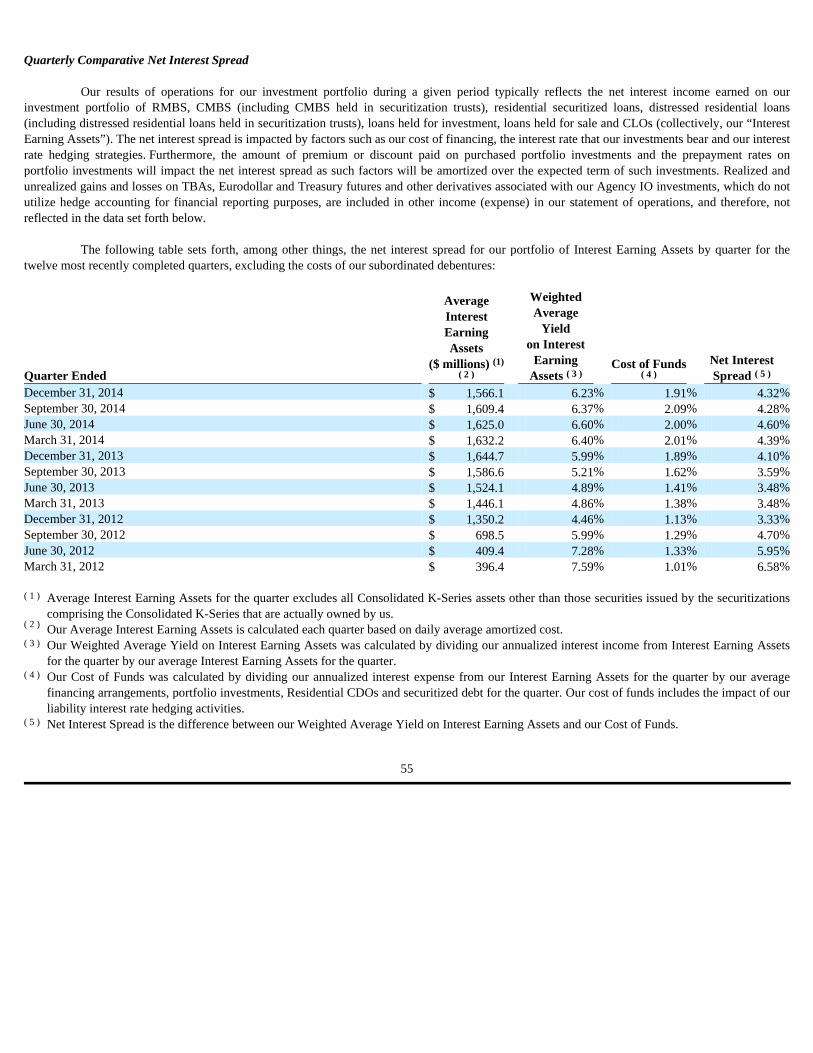
Quarterly Comparative Net Interest Spread
Our results of operations for our investment portfolio during a given period typically reflects the net interest income earned on our investment portfolio of RMBS, CMBS (including CMBS held in securitization trusts), residential securitized loans, distressed residential loans (including distressed residential loans held in securitization trusts), loans held for investment, loans held for sale and CLOs (collectively, our “Interest Earning Assets”). The net interest spread is impacted by factors such as our cost of financing, the interest rate that our investments bear and our interest rate hedging strategies. Furthermore, the amount of premium or discount paid on purchased portfolio investments and the prepayment rates on portfolio investments will impact the net interest spread as such factors will be amortized over the expected term of such investments. Realized and unrealized gains and losses on TBAs, Eurodollar and Treasury futures and other derivatives associated with our Agency IO investments, which do not utilize hedge accounting for financial reporting purposes, are included in other income (expense) in our statement of operations, and therefore, not reflected in the data set forth below.
The following table sets forth, among other things, the net interest spread for our portfolio of Interest Earning Assets by quarter for the
twelve most recently completed quarters, excluding the costs of our subordinated debentures:
Quarter Ended
Average Interest Earning Assets
($ millions)
Weighted Average
Yield on Interest
Earning Assets
Cost of Funds
Net Interest Spread
December 31, 2014 $ 1,566.1 6.23 % 1.91 % 4.32 % September 30, 2014 $ 1,609.4 6.37 % 2.09 % 4.28 % June 30, 2014 $ 1,625.0 6.60 % 2.00 % 4.60 % March 31, 2014 $ 1,632.2 6.40 % 2.01 % 4.39 % December 31, 2013 $ 1,644.7 5.99 % 1.89 % 4.10 % September 30, 2013 $ 1,586.6 5.21 % 1.62 % 3.59 % June 30, 2013 $ 1,524.1 4.89 % 1.41 % 3.48 % March 31, 2013 $ 1,446.1 4.86 % 1.38 % 3.48 % December 31, 2012 $ 1,350.2 4.46 % 1.13 % 3.33 % September 30, 2012 $ 698.5 5.99 % 1.29 % 4.70 % June 30, 2012 $ 409.4 7.28 % 1.33 % 5.95 % March 31, 2012 $ 396.4 7.59 % 1.01 % 6.58 %
Average Interest Earning Assets for the quarter excludes all Consolidated K-Series assets other than those securities issued by the securitizations comprising the Consolidated K-Series that are actually owned by us. Our Average Interest Earning Assets is calculated each quarter based on daily average amortized cost.
Our Weighted Average Yield on Interest Earning Assets was calculated by dividing our annualized interest income from Interest Earning Assets for the quarter by our average Interest Earning Assets for the quarter.
Our Cost of Funds was calculated by dividing our annualized interest expense from our Interest Earning Assets for the quarter by our average financing arrangements, portfolio investments, Residential CDOs and securitized debt for the quarter. Our cost of funds includes the impact of our liability interest rate hedging activities.
Net Interest Spread is the difference between our Weighted Average Yield on Interest Earning Assets and our Cost of Funds.
55
(1) ( 2 ) ( 3 ) ( 4 ) ( 5 )
( 1 )
( 2 )
( 3 )
( 4 )
( 5 )
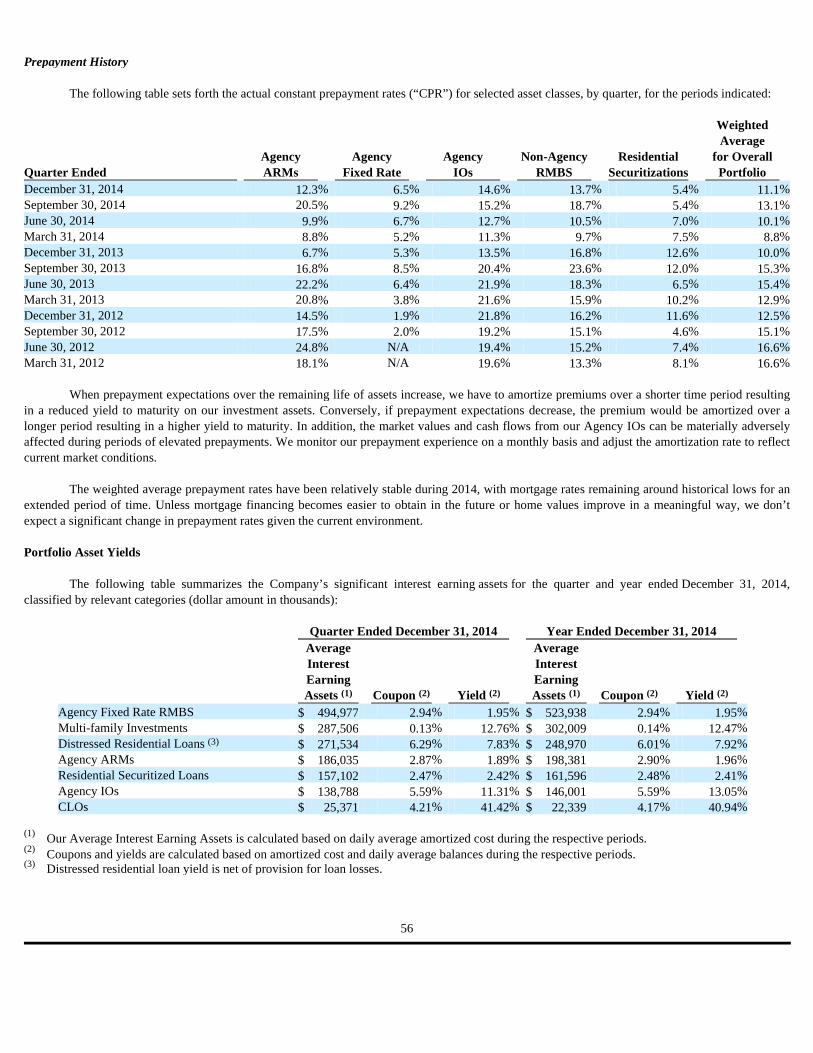
Prepayment History
The following table sets forth the actual constant prepayment rates (“CPR”) for selected asset classes, by quarter, for the periods indicated:
When prepayment expectations over the remaining life of assets increase, we have to amortize premiums over a shorter time period resulting
in a reduced yield to maturity on our investment assets. Conversely, if prepayment expectations decrease, the premium would be amortized over a longer period resulting in a higher yield to maturity. In addition, the market values and cash flows from our Agency IOs can be materially adversely affected during periods of elevated prepayments. We monitor our prepayment experience on a monthly basis and adjust the amortization rate to reflect current market conditions.
The weighted average prepayment rates have been relatively stable during 2014, with mortgage rates remaining around historical lows for an
extended period of time. Unless mortgage financing becomes easier to obtain in the future or home values improve in a meaningful way, we don’t expect a significant change in prepayment rates given the current environment.
Portfolio Asset Yields
The following table summarizes the Company’s significant interest earning assets for the quarter and year ended December 31, 2014,
classified by relevant categories (dollar amount in thousands):
Quarter Ended Agency ARMs
Agency Fixed Rate
Agency
IOs Non-Agency
RMBS Residential
Securitizations
Weighted Average
for Overall Portfolio
December 31, 2014 12.3 % 6.5 % 14.6 % 13.7 % 5.4 % 11.1 % September 30, 2014 20.5 % 9.2 % 15.2 % 18.7 % 5.4 % 13.1 % June 30, 2014 9.9 % 6.7 % 12.7 % 10.5 % 7.0 % 10.1 % March 31, 2014 8.8 % 5.2 % 11.3 % 9.7 % 7.5 % 8.8 % December 31, 2013 6.7 % 5.3 % 13.5 % 16.8 % 12.6 % 10.0 % September 30, 2013 16.8 % 8.5 % 20.4 % 23.6 % 12.0 % 15.3 % June 30, 2013 22.2 % 6.4 % 21.9 % 18.3 % 6.5 % 15.4 % March 31, 2013 20.8 % 3.8 % 21.6 % 15.9 % 10.2 % 12.9 % December 31, 2012 14.5 % 1.9 % 21.8 % 16.2 % 11.6 % 12.5 % September 30, 2012 17.5 % 2.0 % 19.2 % 15.1 % 4.6 % 15.1 % June 30, 2012 24.8 % N/A 19.4 % 15.2 % 7.4 % 16.6 % March 31, 2012 18.1 % N/A 19.6 % 13.3 % 8.1 % 16.6 %
Quarter Ended December 31, 2014 Year Ended December 31, 2014
Average Interest Earning Assets Coupon Yield
Average Interest Earning Assets Coupon Yield
Agency Fixed Rate RMBS $ 494,977 2.94 % 1.95 % $ 523,938 2.94 % 1.95 % Multi-family Investments $ 287,506 0.13 % 12.76 % $ 302,009 0.14 % 12.47 % Distressed Residential Loans $ 271,534 6.29 % 7.83 % $ 248,970 6.01 % 7.92 % Agency ARMs $ 186,035 2.87 % 1.89 % $ 198,381 2.90 % 1.96 % Residential Securitized Loans $ 157,102 2.47 % 2.42 % $ 161,596 2.48 % 2.41 % Agency IOs $ 138,788 5.59 % 11.31 % $ 146,001 5.59 % 13.05 % CLOs $ 25,371 4.21 % 41.42 % $ 22,339 4.17 % 40.94 %
Our Average Interest Earning Assets is calculated based on daily average amortized cost during the respective periods. Coupons and yields are calculated based on amortized cost and daily average balances during the respective periods. Distressed residential loan yield is net of provision for loan losses.
56
(1) (2) (2) (1) (2) (2)
(3)
(1) (2) (3)

The following table summarizes the Company’s significant interest earning assets for the quarter and year ended December 31, 2013,
classified by relevant categories (dollar amount in thousands):
The following table summarizes the Company’s significant interest earning assets for the quarter and year ended December 31, 2012,
classified by relevant categories (dollar amount in thousands):
Financial Condition
As of December 31, 2014, we had approximately $10.5 billion of total assets, as compared to approximately $9.9 billion of total assets as of December 31, 2013. A significant portion of our assets represents the assets comprising the Consolidated K-Series, which we consolidate under the accounting rules. The Consolidated K-Series assets as of December 31, 2014 and December 31, 2013 amount to approximately $8.4 billion and $8.1 billion, respectively . See "Significant Estimates and Critical Accounting Policies - Loan Consolidation Reporting Requirement for Certain Multi-Family K-Series Securitizations. Also, during 2014, we acquired residential mortgage loans, including distressed residential mortgage loans for an aggregate purchase cost of approximately $405.4 million and funded approximately $49.8 million in mezzanine loan, preferred equity and other equity investments with cash proceeds from our public offerings of common stock in 2014. Balance Sheet Analysis
Investment Securities Available for Sale . At December 31, 2014, our securities portfolio includes Agency RMBS, including Agency fixed-rate and ARM pass-through certificates, Agency IOs, non-Agency RMBS and CLOs, which are classified as investment securities available for sale. At December 31, 2014, we had no investment securities in a single issuer or entity that had an aggregate book value in excess of 10% of our total assets. The decrease in carrying value of investment securities available for sale as of December 31, 2014 as compared to December 31, 2013 is primarily a result of principal paydowns, as well as changes in market value.
Quarter Ended December 31, 2013 Year Ended December 31, 2013
Average Interest Earning Assets Coupon Yield
Average Interest Earning Assets Coupon Yield
Agency Fixed Rate RMBS $ 567,901 2.94 % 2.06 % $ 595,636 2.94 % 2.04 % Multi-family Investments $ 272,802 0.12 % 11.73 % $ 233,477 0.12 % 12.00 % Distressed Residential Loans $ 261,228 5.62 % 7.43 % $ 158,190 5.62 % 7.43 % Agency ARMs $ 216,221 2.92 % 2.27 % $ 234,838 2.94 % 1.56 % Residential Securitized Loans $ 164,236 2.67 % 2.55 % $ 172,468 2.83 % 2.73 % Agency IOs $ 140,266 5.69 % 14.73 % $ 135,380 5.74 % 10.56 % CLOs $ 17,778 4.23 % 41.36 % $ 15,959 4.19 % 40.55 %
Our Average Interest Earning Assets is calculated based on daily average amortized cost during the respective periods. Coupons and yields are calculated based on amortized cost and daily average balances during the respective periods.
Quarter Ended December 31, 2012 Year Ended December 31, 2012
Average Interest Earning Assets Coupon Yield
Average Interest Earning Assets Coupon Yield
Agency Fixed Rate RMBS $ 583,130 2.96 % 3.00 % $ 173,514 3.00 % 2.35 % Multi-family Investments $ 102,453 0.11 % 11.46 % $ 76,705 0.10 % 11.02 % Distressed Residential Loans N/A N/A N/A N/A N/A N/A Agency ARMs $ 277,917 2.98 % 1.75 % $ 146,500 3.12 % 1.95 % Residential Securitized Loans $ 195,215 2.91 % 2.81 % $ 193,474 2.96 % 2.88 % Agency IOs $ 101,125 5.94 % 5.71 % $ 83,388 5.71 % 13.42 % CLOs $ 13,170 4.35 % 40.59 % $ 11,984 4.43 % 40.41 %
Our Average Interest Earning Assets is calculated based on daily average amortized cost during the respective periods. Coupons and yields are calculated based on amortized cost and daily average balances during the respective periods.
57
(1) (2) (2) (1) (2) (2)
(1) (2)
(1) (2) (2) (1) (2) (2)
(1) (2)
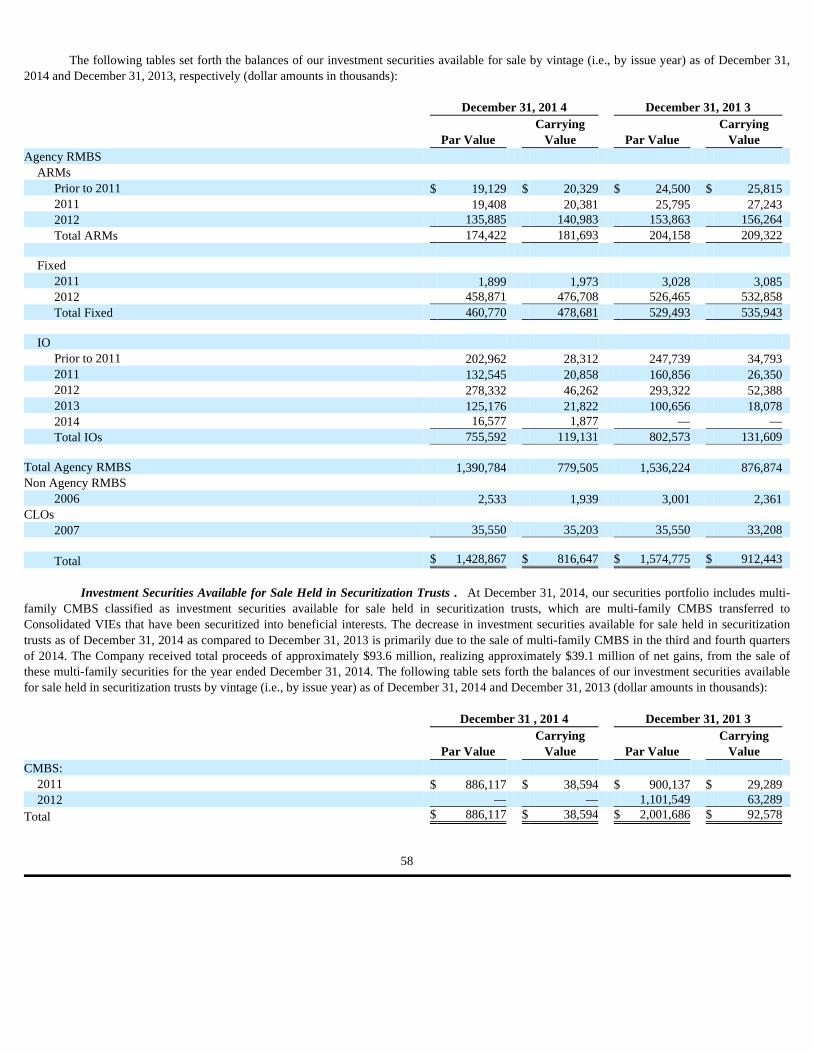
The following tables set forth the balances of our investment securities available for sale by vintage (i.e., by issue year) as of December 31,
2014 and December 31, 2013, respectively (dollar amounts in thousands):
Investment Securities Available for Sale Held in Securitization Trusts . At December 31, 2014, our securities portfolio includes multi-
family CMBS classified as investment securities available for sale held in securitization trusts, which are multi-family CMBS transferred to Consolidated VIEs that have been securitized into beneficial interests. The decrease in investment securities available for sale held in securitization trusts as of December 31, 2014 as compared to December 31, 2013 is primarily due to the sale of multi-family CMBS in the third and fourth quarters of 2014. The Company received total proceeds of approximately $93.6 million, realizing approximately $39.1 million of net gains, from the sale of these multi-family securities for the year ended December 31, 2014. The following table sets forth the balances of our investment securities available for sale held in securitization trusts by vintage (i.e., by issue year) as of December 31, 2014 and December 31, 2013 (dollar amounts in thousands):
December 31, 201 4 December 31, 201 3
Par Value Carrying
Value
Par Value Carrying
Value
Agency RMBS ARMs
Prior to 2011 $ 19,129 $ 20,329 $ 24,500 $ 25,815 2011 19,408 20,381 25,795 27,243 2012 135,885 140,983 153,863 156,264 Total ARMs 174,422 181,693 204,158 209,322
Fixed
2011 1,899 1,973 3,028 3,085 2012 458,871 476,708 526,465 532,858 Total Fixed 460,770 478,681 529,493 535,943
IO
Prior to 2011 202,962 28,312 247,739 34,793 2011 132,545 20,858 160,856 26,350 2012 278,332 46,262 293,322 52,388 2013 125,176 21,822 100,656 18,078 2014 16,577 1,877 — — Total IOs 755,592 119,131 802,573 131,609
Total Agency RMBS 1,390,784 779,505 1,536,224 876,874 Non Agency RMBS
2006 2,533 1,939 3,001 2,361 CLOs
2007 35,550 35,203 35,550 33,208
Total $ 1,428,867 $ 816,647 $ 1,574,775 $ 912,443
December 31 , 201 4 December 31, 201 3
Par Value Carrying
Value Par Value Carrying
Value CMBS:
2011 $ 886,117 $ 38,594 $ 900,137 $ 29,289 2012 — — 1,101,549 63,289
Total $ 886,117 $ 38,594 $ 2,001,686 $ 92,578
58
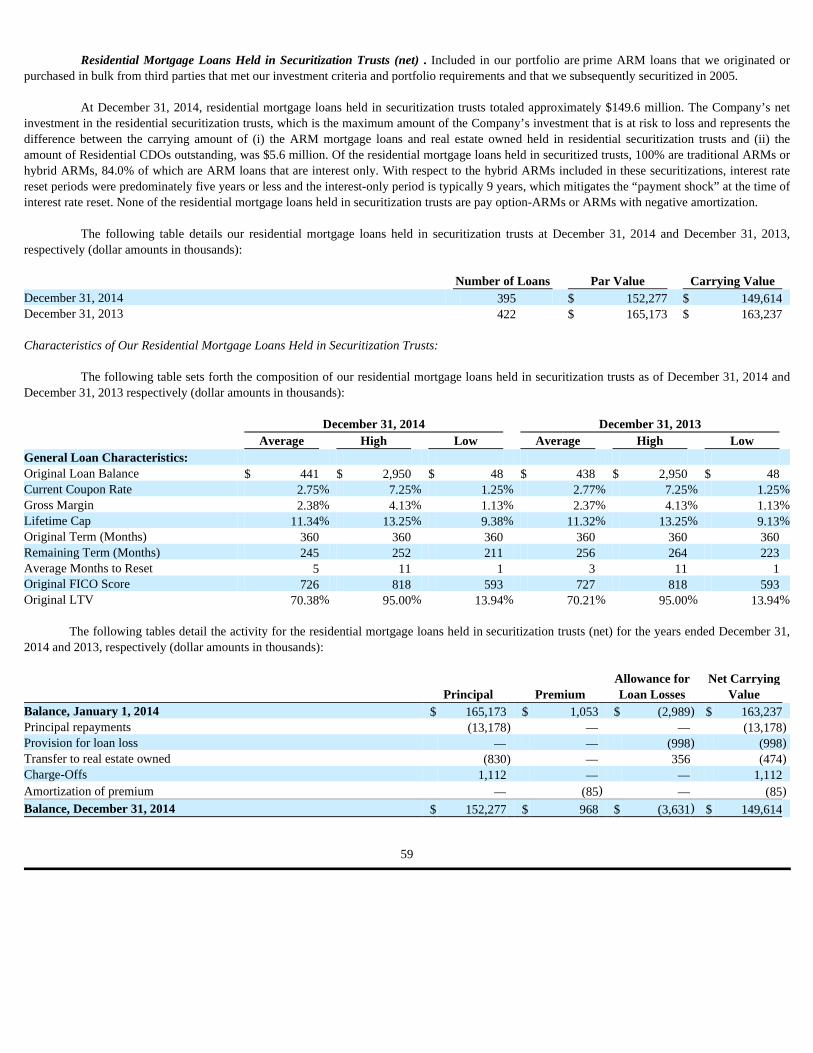
Residential Mortgage Loans Held in Securitization Trusts (net) . Included in our portfolio are prime ARM loans that we originated or
purchased in bulk from third parties that met our investment criteria and portfolio requirements and that we subsequently securitized in 2005.
At December 31, 2014, residential mortgage loans held in securitization trusts totaled approximately $149.6 million. The Company’s net investment in the residential securitization trusts, which is the maximum amount of the Company’s investment that is at risk to loss and represents the difference between the carrying amount of (i) the ARM mortgage loans and real estate owned held in residential securitization trusts and (ii) the amount of Residential CDOs outstanding, was $5.6 million. Of the residential mortgage loans held in securitized trusts, 100% are traditional ARMs or hybrid ARMs, 84.0% of which are ARM loans that are interest only. With respect to the hybrid ARMs included in these securitizations, interest rate reset periods were predominately five years or less and the interest-only period is typically 9 years, which mitigates the “payment shock” at the time of interest rate reset. None of the residential mortgage loans held in securitization trusts are pay option-ARMs or ARMs with negative amortization.
The following table details our residential mortgage loans held in securitization trusts at December 31, 2014 and December 31, 2013, respectively (dollar amounts in thousands):
Characteristics of Our Residential Mortgage Loans Held in Securitization Trusts:
The following table sets forth the composition of our residential mortgage loans held in securitization trusts as of December 31, 2014 and December 31, 2013 respectively (dollar amounts in thousands):
The following tables detail the activity for the residential mortgage loans held in securitization trusts (net) for the years ended December 31,
2014 and 2013, respectively (dollar amounts in thousands):
Number of Loans Par Value Carrying Value December 31, 2014 395 $ 152,277 $ 149,614 December 31, 2013 422 $ 165,173 $ 163,237
December 31, 2014 December 31, 2013 Average High Low Average High Low General Loan Characteristics: Original Loan Balance $ 441 $ 2,950 $ 48 $ 438 $ 2,950 $ 48 Current Coupon Rate 2.75 % 7.25 % 1.25 % 2.77 % 7.25 % 1.25 % Gross Margin 2.38 % 4.13 % 1.13 % 2.37 % 4.13 % 1.13 % Lifetime Cap 11.34 % 13.25 % 9.38 % 11.32 % 13.25 % 9.13 % Original Term (Months) 360 360 360 360 360 360 Remaining Term (Months) 245 252 211 256 264 223 Average Months to Reset 5 11 1 3 11 1 Original FICO Score 726 818 593 727 818 593 Original LTV 70.38 % 95.00 % 13.94 % 70.21 % 95.00 % 13.94 %
Principal Premium Allowance for Loan Losses
Net Carrying Value
Balance, January 1, 2014 $ 165,173 $ 1,053 $ (2,989 ) $ 163,237 Principal repayments (13,178 ) — — (13,178 ) Provision for loan loss — — (998 ) (998 ) Transfer to real estate owned (830 ) — 356 (474 ) Charge-Offs 1,112 — — 1,112 Amortization of premium — (85 ) — (85 ) Balance, December 31, 2014 $ 152,277 $ 968 $ (3,631 ) $ 149,614
59
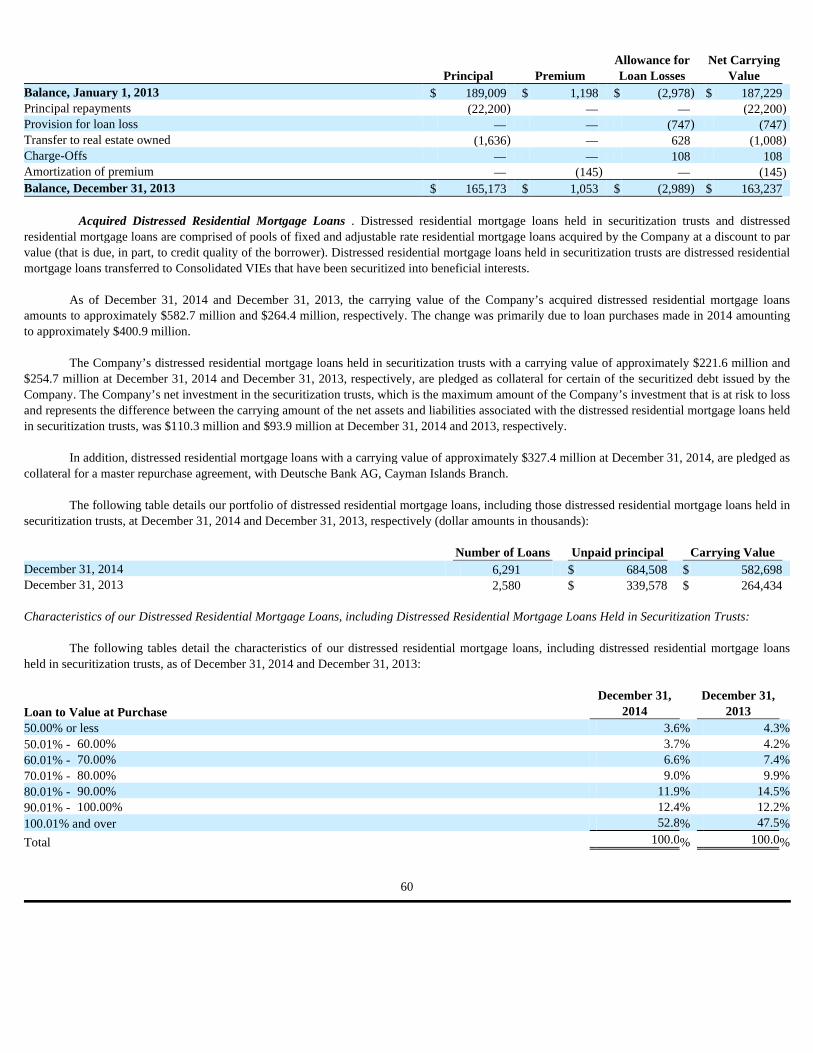
Acquired Distressed Residential Mortgage Loans . Distressed residential mortgage loans held in securitization trusts and distressed
residential mortgage loans are comprised of pools of fixed and adjustable rate residential mortgage loans acquired by the Company at a discount to par value (that is due, in part, to credit quality of the borrower). Distressed residential mortgage loans held in securitization trusts are distressed residential mortgage loans transferred to Consolidated VIEs that have been securitized into beneficial interests.
As of December 31, 2014 and December 31, 2013, the carrying value of the Company’s acquired distressed residential mortgage loans
amounts to approximately $582.7 million and $264.4 million, respectively. The change was primarily due to loan purchases made in 2014 amounting to approximately $400.9 million.
The Company’s distressed residential mortgage loans held in securitization trusts with a carrying value of approximately $221.6 million and
$254.7 million at December 31, 2014 and December 31, 2013, respectively, are pledged as collateral for certain of the securitized debt issued by the Company. The Company’s net investment in the securitization trusts, which is the maximum amount of the Company’s investment that is at risk to loss and represents the difference between the carrying amount of the net assets and liabilities associated with the distressed residential mortgage loans held in securitization trusts, was $110.3 million and $93.9 million at December 31, 2014 and 2013, respectively.
In addition, distressed residential mortgage loans with a carrying value of approximately $327.4 million at December 31, 2014, are pledged as
collateral for a master repurchase agreement, with Deutsche Bank AG, Cayman Islands Branch.
The following table details our portfolio of distressed residential mortgage loans, including those distressed residential mortgage loans held in securitization trusts, at December 31, 2014 and December 31, 2013, respectively (dollar amounts in thousands):
Characteristics of our Distressed Residential Mortgage Loans, including Distressed Residential Mortgage Loans Held in Securitization Trusts:
The following tables detail the characteristics of our distressed residential mortgage loans, including distressed residential mortgage loans held in securitization trusts, as of December 31, 2014 and December 31, 2013:
Principal Premium Allowance for Loan Losses
Net Carrying Value
Balance, January 1, 2013 $ 189,009 $ 1,198 $ (2,978 ) $ 187,229 Principal repayments (22,200 ) — — (22,200 ) Provision for loan loss — — (747 ) (747 ) Transfer to real estate owned (1,636 ) — 628 (1,008 ) Charge-Offs — — 108 108 Amortization of premium — (145 ) — (145 ) Balance, December 31, 2013 $ 165,173 $ 1,053 $ (2,989 ) $ 163,237
Number of Loans Unpaid principal Carrying Value December 31, 2014 6,291 $ 684,508 $ 582,698 December 31, 2013 2,580 $ 339,578 $ 264,434
Loan to Value at Purchase December 31,
2014 December 31,
2013 50.00% or less 3.6 % 4.3 % 50.01% - 60.00% 3.7 % 4.2 % 60.01% - 70.00% 6.6 % 7.4 % 70.01% - 80.00% 9.0 % 9.9 % 80.01% - 90.00% 11.9 % 14.5 % 90.01% - 100.00% 12.4 % 12.2 % 100.01% and over 52.8 % 47.5 %
Total 100.0 % 100.0 %
60
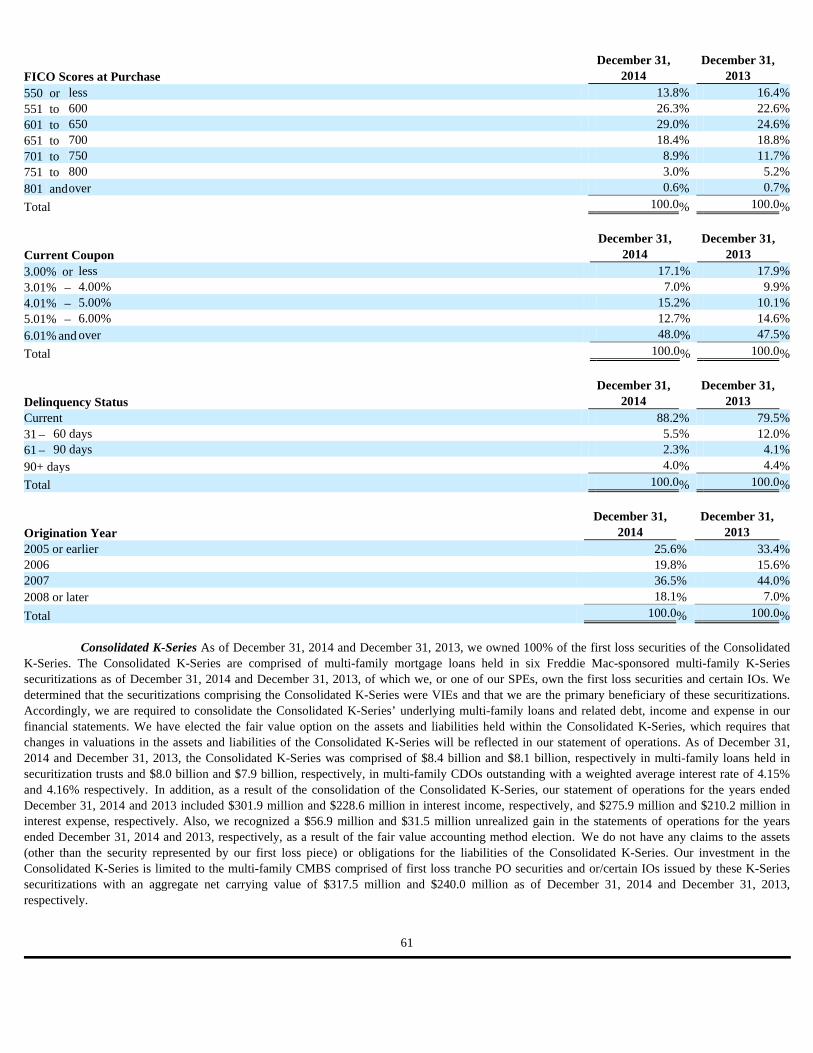
Consolidated K-Series As of December 31, 2014 and December 31, 2013, we owned 100% of the first loss securities of the Consolidated
K-Series. The Consolidated K-Series are comprised of multi-family mortgage loans held in six Freddie Mac-sponsored multi-family K-Series securitizations as of December 31, 2014 and December 31, 2013, of which we, or one of our SPEs, own the first loss securities and certain IOs. We determined that the securitizations comprising the Consolidated K-Series were VIEs and that we are the primary beneficiary of these securitizations. Accordingly, we are required to consolidate the Consolidated K-Series’ underlying multi-family loans and related debt, income and expense in our financial statements. We have elected the fair value option on the assets and liabilities held within the Consolidated K-Series, which requires that changes in valuations in the assets and liabilities of the Consolidated K-Series will be reflected in our statement of operations. As of December 31, 2014 and December 31, 2013, the Consolidated K-Series was comprised of $8.4 billion and $8.1 billion, respectively in multi-family loans held in securitization trusts and $8.0 billion and $7.9 billion, respectively, in multi-family CDOs outstanding with a weighted average interest rate of 4.15% and 4.16% respectively. In addition, as a result of the consolidation of the Consolidated K-Series, our statement of operations for the years ended December 31, 2014 and 2013 included $301.9 million and $228.6 million in interest income, respectively, and $275.9 million and $210.2 million in interest expense, respectively. Also, we recognized a $56.9 million and $31.5 million unrealized gain in the statements of operations for the years ended December 31, 2014 and 2013, respectively, as a result of the fair value accounting method election. We do not have any claims to the assets (other than the security represented by our first loss piece) or obligations for the liabilities of the Consolidated K-Series. Our investment in the Consolidated K-Series is limited to the multi-family CMBS comprised of first loss tranche PO securities and or/certain IOs issued by these K-Series securitizations with an aggregate net carrying value of $317.5 million and $240.0 million as of December 31, 2014 and December 31, 2013, respectively.
FICO Scores at Purchase December 31,
2014 December 31,
2013 550 or less 13.8 % 16.4 % 551 to 600 26.3 % 22.6 % 601 to 650 29.0 % 24.6 % 651 to 700 18.4 % 18.8 % 701 to 750 8.9 % 11.7 % 751 to 800 3.0 % 5.2 % 801 and over 0.6 % 0.7 %
Total 100.0 % 100.0 %
Current Coupon December 31,
2014 December 31,
2013 3.00% or less 17.1 % 17.9 % 3.01% – 4.00% 7.0 % 9.9 % 4.01% – 5.00% 15.2 % 10.1 % 5.01% – 6.00% 12.7 % 14.6 % 6.01% and over 48.0 % 47.5 %
Total 100.0 % 100.0 %
Delinquency Status December 31,
2014 December 31,
2013 Current 88.2 % 79.5 % 31 – 60 days 5.5 % 12.0 % 61 – 90 days 2.3 % 4.1 % 90+ days 4.0 % 4.4 %
Total 100.0 % 100.0 %
Origination Year December 31,
2014 December 31,
2013 2005 or earlier 25.6 % 33.4 % 2006 19.8 % 15.6 % 2007 36.5 % 44.0 % 2008 or later 18.1 % 7.0 %
Total 100.0 % 100.0 %
61
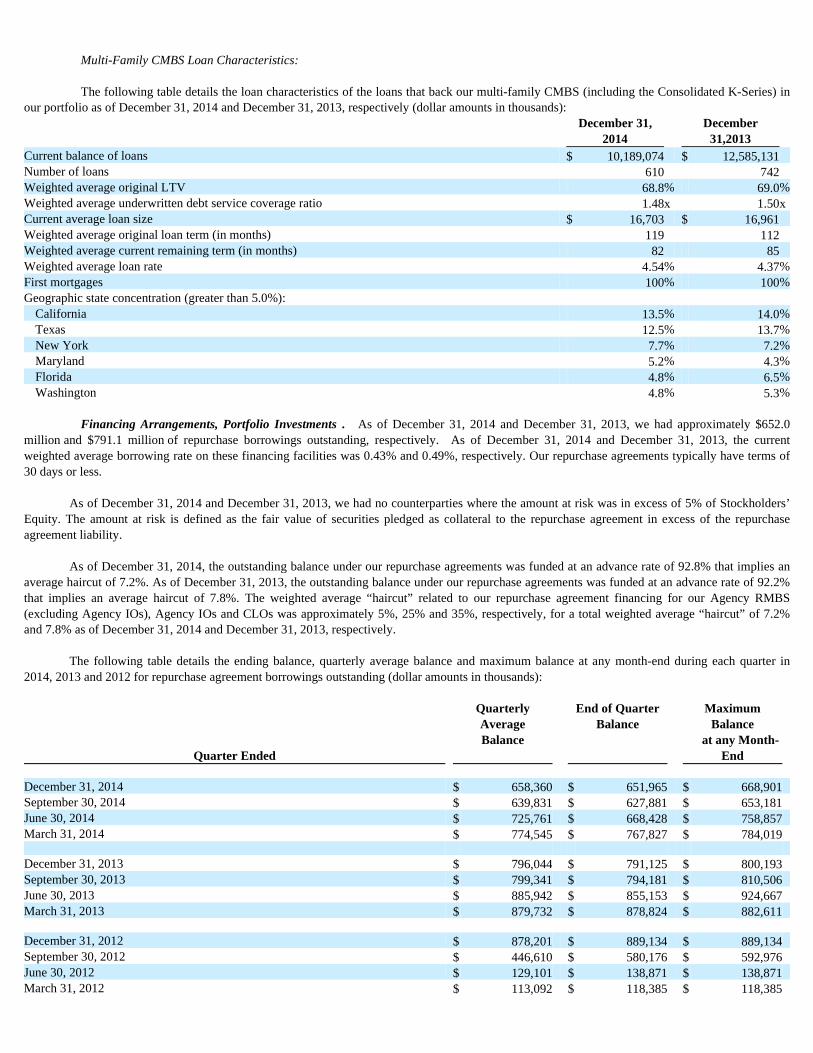
Multi-Family CMBS Loan Characteristics:
The following table details the loan characteristics of the loans that back our multi-family CMBS (including the Consolidated K-Series) in
our portfolio as of December 31, 2014 and December 31, 2013, respectively (dollar amounts in thousands):
Financing Arrangements, Portfolio Investments . As of December 31, 2014 and December 31, 2013, we had approximately $652.0
million and $791.1 million of repurchase borrowings outstanding, respectively. As of December 31, 2014 and December 31, 2013, the current weighted average borrowing rate on these financing facilities was 0.43% and 0.49%, respectively. Our repurchase agreements typically have terms of 30 days or less.
As of December 31, 2014 and December 31, 2013, we had no counterparties where the amount at risk was in excess of 5% of Stockholders’
Equity. The amount at risk is defined as the fair value of securities pledged as collateral to the repurchase agreement in excess of the repurchase agreement liability.
As of December 31, 2014, the outstanding balance under our repurchase agreements was funded at an advance rate of 92.8% that implies an
average haircut of 7.2%. As of December 31, 2013, the outstanding balance under our repurchase agreements was funded at an advance rate of 92.2% that implies an average haircut of 7.8%. The weighted average “haircut” related to our repurchase agreement financing for our Agency RMBS (excluding Agency IOs), Agency IOs and CLOs was approximately 5%, 25% and 35%, respectively, for a total weighted average “haircut” of 7.2% and 7.8% as of December 31, 2014 and December 31, 2013, respectively.
The following table details the ending balance, quarterly average balance and maximum balance at any month-end during each quarter in
2014, 2013 and 2012 for repurchase agreement borrowings outstanding (dollar amounts in thousands):
December 31,
2014 December 31,2013
Current balance of loans $ 10,189,074 $ 12,585,131 Number of loans 610 742 Weighted average original LTV 68.8 % 69.0 % Weighted average underwritten debt service coverage ratio 1.48 x 1.50 x Current average loan size $ 16,703 $ 16,961 Weighted average original loan term (in months) 119 112 Weighted average current remaining term (in months) 82 85 Weighted average loan rate 4.54 % 4.37 % First mortgages 100 % 100 % Geographic state concentration (greater than 5.0%):
California 13.5 % 14.0 % Texas 12.5 % 13.7 % New York 7.7 % 7.2 % Maryland 5.2 % 4.3 % Florida 4.8 % 6.5 % Washington 4.8 % 5.3 %
Quarter Ended
Quarterly Average Balance
End of Quarter Balance
Maximum Balance
at any Month-End
December 31, 2014 $ 658,360 $ 651,965 $ 668,901 September 30, 2014 $ 639,831 $ 627,881 $ 653,181 June 30, 2014 $ 725,761 $ 668,428 $ 758,857 March 31, 2014 $ 774,545 $ 767,827 $ 784,019 December 31, 2013 $ 796,044 $ 791,125 $ 800,193 September 30, 2013 $ 799,341 $ 794,181 $ 810,506 June 30, 2013 $ 885,942 $ 855,153 $ 924,667 March 31, 2013 $ 879,732 $ 878,824 $ 882,611 December 31, 2012 $ 878,201 $ 889,134 $ 889,134 September 30, 2012 $ 446,610 $ 580,176 $ 592,976 June 30, 2012 $ 129,101 $ 138,871 $ 138,871 March 31, 2012 $ 113,092 $ 118,385 $ 118,385

62
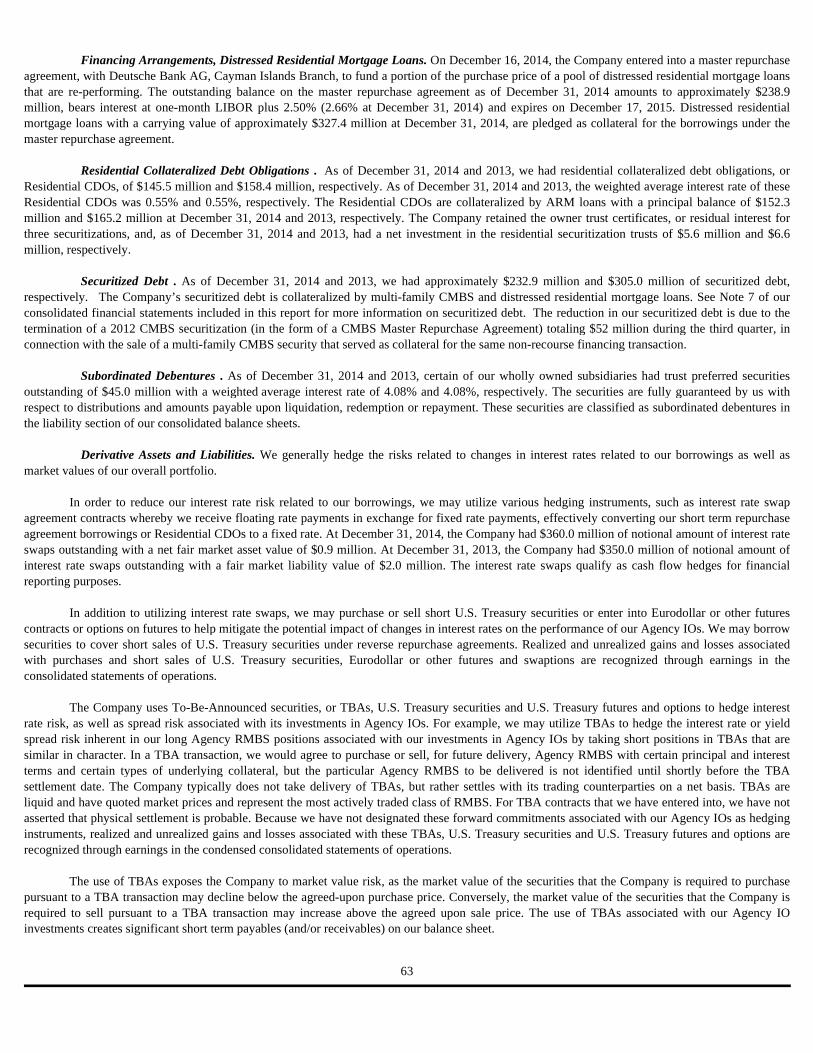
Financing Arrangements, Distressed Residential Mortgage Loans. On December 16, 2014, the Company entered into a master repurchase
agreement, with Deutsche Bank AG, Cayman Islands Branch, to fund a portion of the purchase price of a pool of distressed residential mortgage loans that are re-performing. The outstanding balance on the master repurchase agreement as of December 31, 2014 amounts to approximately $238.9 million, bears interest at one-month LIBOR plus 2.50% (2.66% at December 31, 2014) and expires on December 17, 2015. Distressed residential mortgage loans with a carrying value of approximately $327.4 million at December 31, 2014, are pledged as collateral for the borrowings under the master repurchase agreement.
Residential Collateralized Debt Obligations . As of December 31, 2014 and 2013, we had residential collateralized debt obligations, or
Residential CDOs, of $145.5 million and $158.4 million, respectively. As of December 31, 2014 and 2013, the weighted average interest rate of these Residential CDOs was 0.55% and 0.55%, respectively. The Residential CDOs are collateralized by ARM loans with a principal balance of $152.3 million and $165.2 million at December 31, 2014 and 2013, respectively. The Company retained the owner trust certificates, or residual interest for three securitizations, and, as of December 31, 2014 and 2013, had a net investment in the residential securitization trusts of $5.6 million and $6.6 million, respectively.
Securitized Debt . As of December 31, 2014 and 2013, we had approximately $232.9 million and $305.0 million of securitized debt,
respectively. The Company’s securitized debt is collateralized by multi-family CMBS and distressed residential mortgage loans. See Note 7 of our consolidated financial statements included in this report for more information on securitized debt. The reduction in our securitized debt is due to the termination of a 2012 CMBS securitization (in the form of a CMBS Master Repurchase Agreement) totaling $52 million during the third quarter, in connection with the sale of a multi-family CMBS security that served as collateral for the same non-recourse financing transaction.
Subordinated Debentures . As of December 31, 2014 and 2013, certain of our wholly owned subsidiaries had trust preferred securities
outstanding of $45.0 million with a weighted average interest rate of 4.08% and 4.08%, respectively. The securities are fully guaranteed by us with respect to distributions and amounts payable upon liquidation, redemption or repayment. These securities are classified as subordinated debentures in the liability section of our consolidated balance sheets.
Derivative Assets and Liabilities. We generally hedge the risks related to changes in interest rates related to our borrowings as well as
market values of our overall portfolio.
In order to reduce our interest rate risk related to our borrowings, we may utilize various hedging instruments, such as interest rate swap agreement contracts whereby we receive floating rate payments in exchange for fixed rate payments, effectively converting our short term repurchase agreement borrowings or Residential CDOs to a fixed rate. At December 31, 2014, the Company had $360.0 million of notional amount of interest rate swaps outstanding with a net fair market asset value of $0.9 million. At December 31, 2013, the Company had $350.0 million of notional amount of interest rate swaps outstanding with a fair market liability value of $2.0 million. The interest rate swaps qualify as cash flow hedges for financial reporting purposes.
In addition to utilizing interest rate swaps, we may purchase or sell short U.S. Treasury securities or enter into Eurodollar or other futures
contracts or options on futures to help mitigate the potential impact of changes in interest rates on the performance of our Agency IOs. We may borrow securities to cover short sales of U.S. Treasury securities under reverse repurchase agreements. Realized and unrealized gains and losses associated with purchases and short sales of U.S. Treasury securities, Eurodollar or other futures and swaptions are recognized through earnings in the consolidated statements of operations.
The Company uses To-Be-Announced securities, or TBAs, U.S. Treasury securities and U.S. Treasury futures and options to hedge interest
rate risk, as well as spread risk associated with its investments in Agency IOs. For example, we may utilize TBAs to hedge the interest rate or yield spread risk inherent in our long Agency RMBS positions associated with our investments in Agency IOs by taking short positions in TBAs that are similar in character. In a TBA transaction, we would agree to purchase or sell, for future delivery, Agency RMBS with certain principal and interest terms and certain types of underlying collateral, but the particular Agency RMBS to be delivered is not identified until shortly before the TBA settlement date. The Company typically does not take delivery of TBAs, but rather settles with its trading counterparties on a net basis. TBAs are liquid and have quoted market prices and represent the most actively traded class of RMBS. For TBA contracts that we have entered into, we have not asserted that physical settlement is probable. Because we have not designated these forward commitments associated with our Agency IOs as hedging instruments, realized and unrealized gains and losses associated with these TBAs, U.S. Treasury securities and U.S. Treasury futures and options are recognized through earnings in the condensed consolidated statements of operations.
The use of TBAs exposes the Company to market value risk, as the market value of the securities that the Company is required to purchase
pursuant to a TBA transaction may decline below the agreed-upon purchase price. Conversely, the market value of the securities that the Company is required to sell pursuant to a TBA transaction may increase above the agreed upon sale price. The use of TBAs associated with our Agency IO investments creates significant short term payables (and/or receivables) on our balance sheet.
63
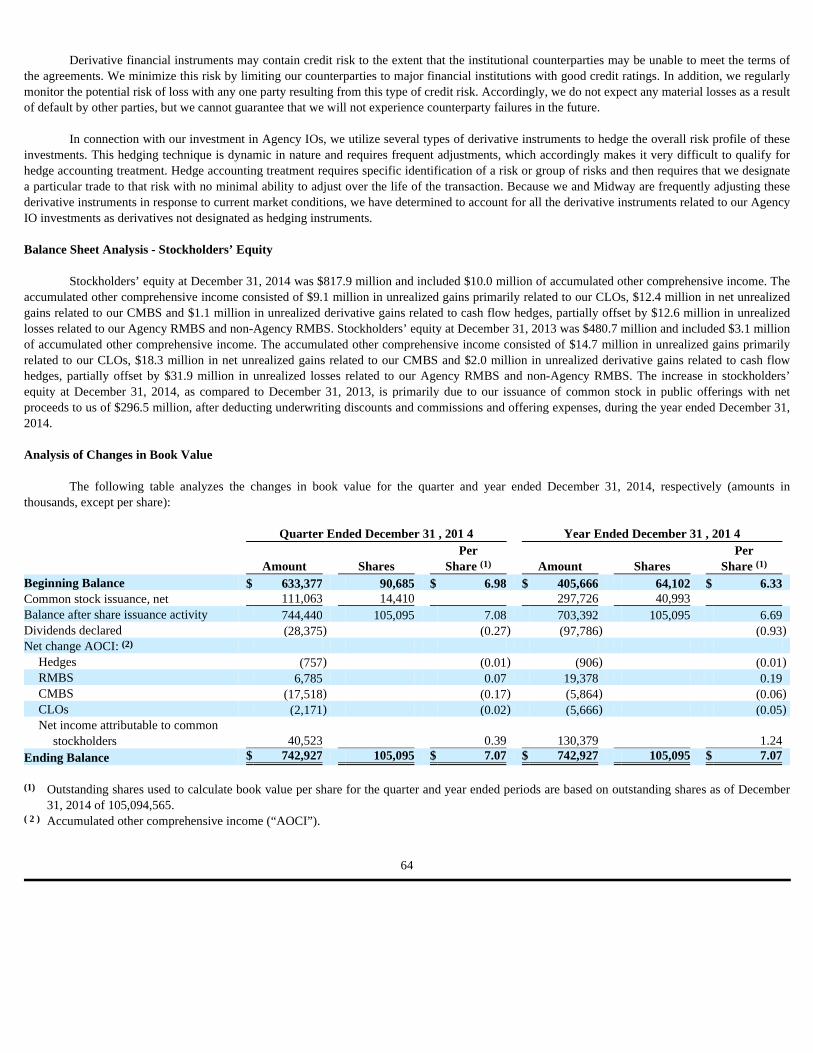
Derivative financial instruments may contain credit risk to the extent that the institutional counterparties may be unable to meet the terms of
the agreements. We minimize this risk by limiting our counterparties to major financial institutions with good credit ratings. In addition, we regularly monitor the potential risk of loss with any one party resulting from this type of credit risk. Accordingly, we do not expect any material losses as a result of default by other parties, but we cannot guarantee that we will not experience counterparty failures in the future.
In connection with our investment in Agency IOs, we utilize several types of derivative instruments to hedge the overall risk profile of these
investments. This hedging technique is dynamic in nature and requires frequent adjustments, which accordingly makes it very difficult to qualify for hedge accounting treatment. Hedge accounting treatment requires specific identification of a risk or group of risks and then requires that we designate a particular trade to that risk with no minimal ability to adjust over the life of the transaction. Because we and Midway are frequently adjusting these derivative instruments in response to current market conditions, we have determined to account for all the derivative instruments related to our Agency IO investments as derivatives not designated as hedging instruments. Balance Sheet Analysis - Stockholders’ Equity
Stockholders’ equity at December 31, 2014 was $817.9 million and included $10.0 million of accumulated other comprehensive income. The accumulated other comprehensive income consisted of $9.1 million in unrealized gains primarily related to our CLOs, $12.4 million in net unrealized gains related to our CMBS and $1.1 million in unrealized derivative gains related to cash flow hedges, partially offset by $12.6 million in unrealized losses related to our Agency RMBS and non-Agency RMBS. Stockholders’ equity at December 31, 2013 was $480.7 million and included $3.1 million of accumulated other comprehensive income. The accumulated other comprehensive income consisted of $14.7 million in unrealized gains primarily related to our CLOs, $18.3 million in net unrealized gains related to our CMBS and $2.0 million in unrealized derivative gains related to cash flow hedges, partially offset by $31.9 million in unrealized losses related to our Agency RMBS and non-Agency RMBS. The increase in stockholders’equity at December 31, 2014, as compared to December 31, 2013, is primarily due to our issuance of common stock in public offerings with net proceeds to us of $296.5 million, after deducting underwriting discounts and commissions and offering expenses, during the year ended December 31, 2014.
Analysis of Changes in Book Value
The following table analyzes the changes in book value for the quarter and year ended December 31, 2014, respectively (amounts in thousands, except per share):
Quarter Ended December 31 , 201 4 Year Ended December 31 , 201 4
Amount Shares Per
Share
Amount
Shares
Per
Share Beginning Balance $ 633,377 90,685 $ 6.98 $ 405,666 64,102 $ 6.33 Common stock issuance, net 111,063 14,410 297,726 40,993 Balance after share issuance activity 744,440 105,095 7.08 703,392 105,095 6.69 Dividends declared (28,375 ) (0.27 ) (97,786 ) (0.93 ) Net change AOCI:
Hedges (757 ) (0.01 ) (906 ) (0.01 ) RMBS 6,785 0.07 19,378 0.19 CMBS (17,518 ) (0.17 ) (5,864 ) (0.06 ) CLOs (2,171 ) (0.02 ) (5,666 ) (0.05 ) Net income attributable to common
stockholders 40,523 0.39 130,379 1.24 Ending Balance $ 742,927 105,095 $ 7.07 $ 742,927 105,095 $ 7.07
Outstanding shares used to calculate book value per share for the quarter and year ended periods are based on outstanding shares as of December 31, 2014 of 105,094,565.
Accumulated other comprehensive income (“AOCI”).
64
(1) (1)
(2)
(1)
( 2 )
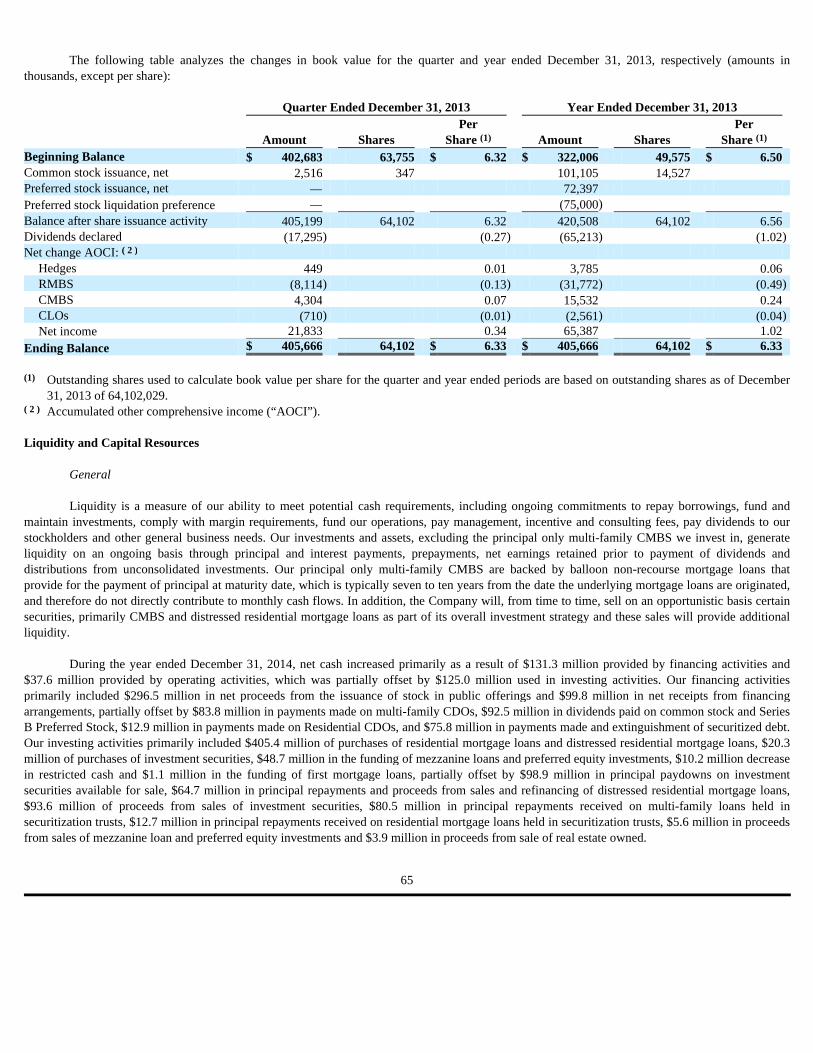
The following table analyzes the changes in book value for the quarter and year ended December 31, 2013, respectively (amounts in
thousands, except per share):
Liquidity and Capital Resources
General Liquidity is a measure of our ability to meet potential cash requirements, including ongoing commitments to repay borrowings, fund and
maintain investments, comply with margin requirements, fund our operations, pay management, incentive and consulting fees, pay dividends to our stockholders and other general business needs. Our investments and assets, excluding the principal only multi-family CMBS we invest in, generate liquidity on an ongoing basis through principal and interest payments, prepayments, net earnings retained prior to payment of dividends and distributions from unconsolidated investments. Our principal only multi-family CMBS are backed by balloon non-recourse mortgage loans that provide for the payment of principal at maturity date, which is typically seven to ten years from the date the underlying mortgage loans are originated, and therefore do not directly contribute to monthly cash flows. In addition, the Company will, from time to time, sell on an opportunistic basis certain securities, primarily CMBS and distressed residential mortgage loans as part of its overall investment strategy and these sales will provide additional liquidity.
During the year ended December 31, 2014, net cash increased primarily as a result of $131.3 million provided by financing activities and $37.6 million provided by operating activities, which was partially offset by $125.0 million used in investing activities. Our financing activities primarily included $296.5 million in net proceeds from the issuance of stock in public offerings and $99.8 million in net receipts from financing arrangements, partially offset by $83.8 million in payments made on multi-family CDOs, $92.5 million in dividends paid on common stock and Series B Preferred Stock, $12.9 million in payments made on Residential CDOs, and $75.8 million in payments made and extinguishment of securitized debt. Our investing activities primarily included $405.4 million of purchases of residential mortgage loans and distressed residential mortgage loans, $20.3 million of purchases of investment securities, $48.7 million in the funding of mezzanine loans and preferred equity investments, $10.2 million decrease in restricted cash and $1.1 million in the funding of first mortgage loans, partially offset by $98.9 million in principal paydowns on investment securities available for sale, $64.7 million in principal repayments and proceeds from sales and refinancing of distressed residential mortgage loans, $93.6 million of proceeds from sales of investment securities, $80.5 million in principal repayments received on multi-family loans held in securitization trusts, $12.7 million in principal repayments received on residential mortgage loans held in securitization trusts, $5.6 million in proceeds from sales of mezzanine loan and preferred equity investments and $3.9 million in proceeds from sale of real estate owned.
Quarter Ended December 31, 2013 Year Ended December 31, 2013
Amount Shares Per
Share
Amount
Shares
Per
Share Beginning Balance $ 402,683 63,755 $ 6.32 $ 322,006 49,575 $ 6.50 Common stock issuance, net 2,516 347 101,105 14,527 Preferred stock issuance, net — 72,397 Preferred stock liquidation preference — (75,000 ) Balance after share issuance activity 405,199 64,102 6.32 420,508 64,102 6.56 Dividends declared (17,295 ) (0.27 ) (65,213 ) (1.02 ) Net change AOCI:
Hedges 449 0.01 3,785 0.06 RMBS (8,114 ) (0.13 ) (31,772 ) (0.49 ) CMBS 4,304 0.07 15,532 0.24 CLOs (710 ) (0.01 ) (2,561 ) (0.04 ) Net income 21,833 0.34 65,387 1.02
Ending Balance $ 405,666 64,102 $ 6.33 $ 405,666 64,102 $ 6.33
Outstanding shares used to calculate book value per share for the quarter and year ended periods are based on outstanding shares as of December 31, 2013 of 64,102,029.
Accumulated other comprehensive income (“AOCI”).
65
(1) (1)
( 2 )
(1)
( 2 )
We fund our investments and operations through a balanced and diverse funding mix, which includes proceeds from equity offerings, short-
term and longer-term repurchase agreement borrowings, CDOs, securitized debt, and trust preferred debentures. The type and terms of financing used by us depends on the asset being financed. In those cases where we utilize some form of structured financing, be it through CDOs, longer-term repurchase agreements or securitized debt, the cash flow produced by the assets that serve as collateral for these structured finance instruments may be restricted in terms of its use or applied to pay principal or interest on CDOs, repurchase agreements, or notes that are senior to our interests. At December 31, 2014, we had cash and cash equivalents balances of $75.6 million, which increased from December 31, 2013 by $43.8 million. Based on our current investment portfolio, new investment initiatives, leverage ratio and available and future possible borrowing arrangements, we believe our existing cash balances, funds available under our various financing arrangements and cash flows from operations will meet our liquidity requirements for at least the next 12 months.
Liquidity – Financing Arrangements We rely primarily on short-term repurchase agreements (typically 30 days) to finance the more liquid assets in our investment portfolio, such
as Agency RMBS. As of December 31, 2014, we have outstanding short-term repurchase agreements, a form of collateralized short-term borrowing, with ten different financial institutions. These agreements are secured by certain of our investment securities and bear interest rates that have historically moved in close relationship to LIBOR. Our borrowings under repurchase agreements are based on the fair value of the investment securities securing these borrowings. Interest rate changes and increased prepayment activity can have a negative impact on the valuation of these securities, reducing the amount we can borrow under these agreements. Moreover, our repurchase agreements allow the counterparties to determine a new market value of the collateral to reflect current market conditions and because these lines of financing are not committed, the counterparty can call the loan at any time. The market value of the collateral securing these borrowings represents the price of such collateral obtained from generally recognized sources or the most recent closing bid quotation from such source plus accrued income. If a counterparty determines that the value of the collateral has decreased, the counterparty may initiate a margin call and require us to either post additional collateral to cover such decrease or repay a portion of the outstanding borrowing in cash, on minimal notice. Moreover, in the event an existing counterparty to one of our repurchase agreements elected to not “roll” the outstanding balance at maturity into a new repurchase agreement, we would be required to repay the outstanding balance with cash or proceeds received from a new counterparty or to surrender the securities that serve as collateral for the outstanding balance, or any combination thereof. If we are unable to secure financing from a new counterparty and had to surrender the collateral, we would expect to incur a loss. In addition, in the event one of our lenders under the repurchase agreement defaults on its obligation to “re-sell” or return to us the securities that are securing the borrowings at the end of the term of the repurchase agreement, we would incur a loss on the transaction equal to the amount of “haircut” associated with the short-term repurchase agreement, which we sometimes refer to as the “amount at risk.” As of December 31, 2014, we had an aggregate amount at risk under our repurchase agreements with ten counterparties of approximately $50.7 million, with no greater than approximately $19.0 million at risk with any single counterparty. The volatility in the market place during 2014 did not have a material impact on our liquidity or our ability to finance our more liquid assets through short-term repurchase agreements.
At December 31, 2014, the Company had short-term repurchase agreement borrowings on our investment securities of $652.0 million as
compared to $791.1 million as of December 31, 2013. In addition to our excess cash, the Company has $234.8 million in unencumbered securities, including $120.8 million of multi-family CMBS (which represents the net fair value of certain first loss tranche PO securities and/or certain IOs issued by certain K-Series securitizations included in the Consolidated K-Series), $78.8 million of RMBS, of which $76.8 million are Agency RMBS, and $35.2 million of CLOs. The $75.6 million of cash, the $120.8 in multi-family CMBS, the $78.8 million in RMBS, and $40.6 million held in overnight deposits in our Agency IO portfolio included in restricted cash (that is available to meet margin calls as it relates to our Agency IO portfolio repurchase agreements), which collectively represent 53.8% of our financing arrangements, portfolio investments, are liquid and could be monetized to pay down or collateralize the liability immediately.
At December 31, 2014, the Company also had a master repurchase agreement, with Deutsche Bank AG, Cayman Islands Branch, in an aggregate principal amount of up to $260.0 million, expiring on December 17, 2015. The outstanding balance under the master repurchase agreement amounted to approximately $238.9 million at December 31, 2014. This master repurchase agreement is collateralized by distressed residential mortgage loans with a carrying value of $327.4 million at December 31, 2014.
At December 31, 2014, we also had other longer-term debt, including Residential CDOs outstanding of $145.5 million, multi-family CDOs outstanding of $8.0 billion (which represent obligations of the Consolidated K-Series), subordinated debt of $45.0 million and securitized debt of $232.9 million. The CDOs are collateralized by residential and multi-family loans held in securitization trusts, respectively. The securitized debt as of December 31, 2014 represents the notes issued in (i) our May 2012 multi-family re-securitization transaction, (ii) our November 2013 multi-family CMBS collateralized recourse financing transaction, and (iii) our December 2012, July 2013 and September 2013 distressed residential mortgage loan securitization transactions, which are described in Note 7 in our consolidated financial statements.
66

As of December 31, 2014, our overall leverage ratio, including both our short-term and longer-term financing (and excluding the CDO’s
issued by the Consolidated K-Series and our Residential CDOs) divided by stockholders’ equity, was approximately 1.4 to 1. As of December 31, 2014, our leverage ratio on our short term financings or callable debt was approximately 1.1 to 1. We monitor all at risk or short term borrowings to ensure that we have adequate liquidity to satisfy margin calls and liquidity covenant requirements.
Liquidity – Hedging and Other Factors Certain of our hedging instruments may also impact our liquidity. We use interest rate swaps, swaptions, TBAs, Eurodollar or other futures
contracts to hedge interest rate risk associated with our investments in Agency RMBS (including Agency IOs). With respect to interest rate swaps, futures contracts and TBAs, initial margin deposits will be made upon entering into these contracts and can be either cash or securities. During the period these contracts are open, changes in the value of the contract are recognized as unrealized gains or losses by marking to market on a daily basis to reflect the market value of these contracts at the end of each day’s trading. We may be required to satisfy variable margin payments periodically, depending upon whether unrealized gains or losses are incurred.
We also use TBAs to hedge interest rate risk associated with our investments in Agency IOs. Since delivery for these securities extends
beyond the typical settlement dates for most non-derivative investments, these transactions are more prone to market fluctuations between the trade date and the ultimate settlement date, and thereby are more vulnerable to increasing amounts at risk with the applicable counterparties. The use of TBAs associated with our Agency IO investments creates significant short term payables (and/or receivables), amounting to $283.5 million at December 31, 2014, and is included in payable for securities purchased on our consolidated balance sheet.
We also use U.S. Treasury securities and U.S. Treasury futures and options to hedge interest rate risk associated with our investments in Agency IOs and interest rate swap agreements and swaptions as a mechanism to reduce the interest rate risk of our Agency ARMs and mortgage loans held in securitization trusts.
For additional information regarding the Company’s derivative instruments and hedging activities for the periods covered by this report,
including the fair values and notional amounts of these instruments and realized and unrealized gains and losses relating to these instruments, please see Note 8 to our consolidated financial statements included in this report. Also, please see Item 7A. Quantitative and Qualitative Disclosures about Market Risk, under the caption, “Fair Value Risk”, for a tabular presentation of the sensitivity of the market value and net duration changes of the Company’s portfolio across various changes in interest rates, which takes into account the Company’s hedging activities.
Liquidity — Equity Offerings
In addition to the financing arrangements described above under the caption “Liquidity—Financing Arrangements ,” we also rely on
secondary equity offerings as a source of both short-term and long-term liquidity. During the year ended December 31, 2014, we closed on the following underwritten public equity offerings:
We used substantially all of the net proceeds from these offerings to fund additional investments in our targeted assets, particularly, distressed
residential mortgage loans and other multi-family related investments.
● On January 10, 2014, we closed on the issuance of 11,500,000 shares of common stock to the underwriters (including the 1,500,000 shares
issued pursuant to an option to purchase additional shares), resulting in net proceeds to us of approximately $75.8 million, after deducting underwriting discounts, commissions and offering expenses.
● On April 7, 2014, we closed on the issuance of 14,950,000 shares of common stock to the underwriters (including the 1,950,000 shares
issued pursuant to an option to purchase additional shares), resulting in net proceeds to us of approximately $109.9 million, after deducting underwriting discounts, commissions and offering expenses.
● On November 26, 2014, we closed on the issuance of 14,410,019 shares of common stock to the underwriters (including the 1,410,019
shares issued pursuant to an option to purchase additional shares), resulting in net proceeds to us of approximately $110.8 million, after deducting underwriting discounts, commissions and estimated offering expenses.
67
We also may generate liquidity through the sale of shares of our common stock in an “at the market” offering program pursuant to an equity
distribution agreement, as well as through the sale of shares of our common stock pursuant to our Dividend Reinvestment Plan, or DRIP. On January 14, 2013, we filed a registration statement on Form S-3 to enable us to issue up to $20,000,000 of shares of our common stock pursuant to our DRIP. On June 11, 2012, we entered into an equity distribution agreement with JMP Securities LLC as the placement agent, pursuant to which we may sell up to $25,000,000 of shares of our common stock from time to time through the placement agent. Pursuant to the equity distribution agreement, the shares may be offered and sold through the placement agent in transactions that are deemed to be “at the market” offerings as defined in Rule 415 under the Securities Act of 1933, as amended, including sales made directly on The Nasdaq Global Select Market or sales made to or through a market maker other than on an exchange or, subject to the terms of a written notice from us, in privately negotiated transactions. We have no obligation to sell any of the shares under the equity distribution agreement and may at any time suspend solicitations and offers under the equity distribution agreement. During the year ended December 31, 2013, we issued 827,313 shares under the equity distribution agreement resulting in total net proceeds to the Company of approximately $5.8 million, after deducting sales commissions and expenses. During the year ended December 31, 2014, there were no shares issued under the equity distribution agreement. As of December 31, 2014, approximately $19.2 million remains available for issuance under our “at the market” offering program.
Management Agreements We have investment management agreements with RiverBanc, Midway and Headlands, pursuant to which we pay these managers a base
management and incentive fee quarterly in arrears. See "- Results of Operations - Comparison of the Year Ended December 31, 2014 to Year Ended December 31, 2013 - Comparative Expenses" for more information regarding the management fees paid during the year ended December 31, 2014. In addition, pursuant to the terms of our former advisory relationship with HCS, we also may pay incentive compensation to Harvest Capital Strategies LLC (“HCS’) with respect to those assets of our company that were managed by HCS at the time the advisory relationship with HCS concluded (the “Incentive Tail Assets”) until such time as such Incentive Tail Assets are disposed of by us or mature.
Dividends For information regarding the declaration and payment of dividends on our preferred stock, see “Note 15 – Stockholders’ Equity” below. For
information regarding the declaration and payment of dividends on our common stock, see “Item 5. Market for Registrant’s Common Equity, Related Stockholder Matters and Issuer Purchases of Equity Securities” above.
We expect to continue to pay quarterly cash dividends on our common stock during the near term. However, our Board of Directors will
continue to evaluate our dividend policy each quarter and will make adjustments as necessary, based on a variety of factors, including, among other things, the need to maintain our REIT status, our financial condition, liquidity, earnings projections and business prospects. Our dividend policy does not constitute an obligation to pay dividends.
We intend to make distributions to our stockholders to comply with the various requirements to maintain our REIT status and to minimize or avoid corporate income tax and the nondeductible excise tax. However, differences in timing between the recognition of REIT taxable income and the actual receipt of cash could require us to sell assets or to borrow funds on a short-term basis to meet the REIT distribution requirements and to minimize or avoid corporate income tax and the nondeductible excise tax.
Exposure to European financial counterparties We finance the acquisition of a significant portion of our mortgage-backed securities with repurchase agreements. In connection with these
financing arrangements, we pledge our securities as collateral to secure the borrowings. The amount of collateral pledged will typically exceed the amount of the financing with the extent of over-collateralization from 5% of the amount borrowed (in the case of Agency ARM and Agency fixed rate RMBS collateral), 25% (in the case of Agency IOs) and up to 35% (in the case of CLO collateral).While our repurchase agreement financing results in us recording a liability to the counterparty in our consolidated balance sheet, we are exposed to the counterparty, if during the term of the repurchase agreement financing, a lender should default on its obligation and we are not able to recover our pledged assets. The amount of this exposure is the difference between the amount loaned to us plus interest due to the counterparty and the fair value of the collateral pledged by us to the lender (including accrued interest receivable on such collateral).
68
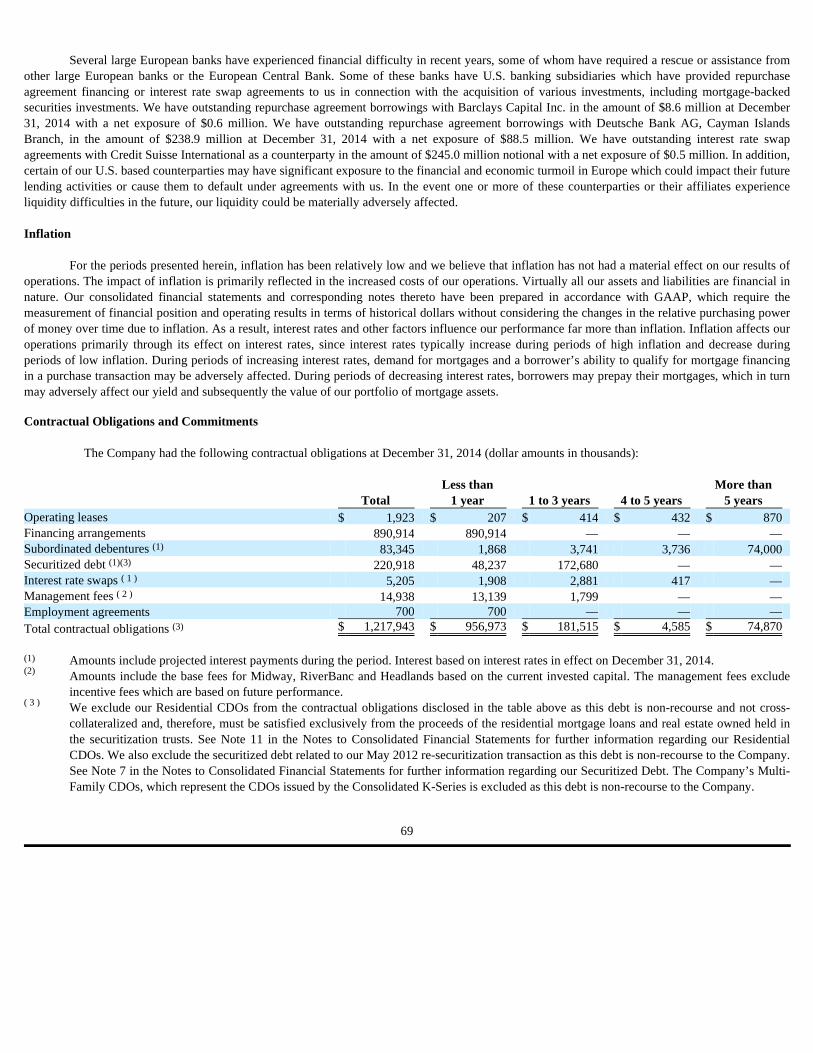
Several large European banks have experienced financial difficulty in recent years, some of whom have required a rescue or assistance from
other large European banks or the European Central Bank. Some of these banks have U.S. banking subsidiaries which have provided repurchase agreement financing or interest rate swap agreements to us in connection with the acquisition of various investments, including mortgage-backed securities investments. We have outstanding repurchase agreement borrowings with Barclays Capital Inc. in the amount of $8.6 million at December 31, 2014 with a net exposure of $0.6 million. We have outstanding repurchase agreement borrowings with Deutsche Bank AG, Cayman Islands Branch, in the amount of $238.9 million at December 31, 2014 with a net exposure of $88.5 million. We have outstanding interest rate swap agreements with Credit Suisse International as a counterparty in the amount of $245.0 million notional with a net exposure of $0.5 million. In addition, certain of our U.S. based counterparties may have significant exposure to the financial and economic turmoil in Europe which could impact their future lending activities or cause them to default under agreements with us. In the event one or more of these counterparties or their affiliates experience liquidity difficulties in the future, our liquidity could be materially adversely affected. Inflation
For the periods presented herein, inflation has been relatively low and we believe that inflation has not had a material effect on our results of
operations. The impact of inflation is primarily reflected in the increased costs of our operations. Virtually all our assets and liabilities are financial in nature. Our consolidated financial statements and corresponding notes thereto have been prepared in accordance with GAAP, which require the measurement of financial position and operating results in terms of historical dollars without considering the changes in the relative purchasing power of money over time due to inflation. As a result, interest rates and other factors influence our performance far more than inflation. Inflation affects our operations primarily through its effect on interest rates, since interest rates typically increase during periods of high inflation and decrease during periods of low inflation. During periods of increasing interest rates, demand for mortgages and a borrower’s ability to qualify for mortgage financing in a purchase transaction may be adversely affected. During periods of decreasing interest rates, borrowers may prepay their mortgages, which in turn may adversely affect our yield and subsequently the value of our portfolio of mortgage assets. Contractual Obligations and Commitments
The Company had the following contractual obligations at December 31, 2014 (dollar amounts in thousands):
Total Less than
1 year 1 to 3 years 4 to 5 years More than
5 years Operating leases $ 1,923 $ 207 $ 414 $ 432 $ 870 Financing arrangements 890,914 890,914 — — — Subordinated debentures 83,345 1,868 3,741 3,736 74,000 Securitized debt 220,918 48,237 172,680 — — Interest rate swaps 5,205 1,908 2,881 417 — Management fees 14,938 13,139 1,799 — — Employment agreements 700 700 — — — Total contractual obligations $ 1,217,943 $ 956,973 $ 181,515 $ 4,585 $ 74,870
Amounts include projected interest payments during the period. Interest based on interest rates in effect on December 31, 2014. Amounts include the base fees for Midway, RiverBanc and Headlands based on the current invested capital. The management fees exclude incentive fees which are based on future performance.
We exclude our Residential CDOs from the contractual obligations disclosed in the table above as this debt is non-recourse and not cross-collateralized and, therefore, must be satisfied exclusively from the proceeds of the residential mortgage loans and real estate owned held in the securitization trusts. See Note 11 in the Notes to Consolidated Financial Statements for further information regarding our Residential CDOs. We also exclude the securitized debt related to our May 2012 re-securitization transaction as this debt is non-recourse to the Company. See Note 7 in the Notes to Consolidated Financial Statements for further information regarding our Securitized Debt. The Company’s Multi-Family CDOs, which represent the CDOs issued by the Consolidated K-Series is excluded as this debt is non-recourse to the Company.
69
(1) (1)(3)
( 1 ) ( 2 )
(3)
(1) (2)
( 3 )
Off-Balance Sheet Arrangements
We did not maintain any relationships with unconsolidated entities or financial partnerships, such as entities often referred to as structured finance or special purpose entities, established for the purpose of facilitating off-balance sheet arrangements or other contractually narrow or limited purposes. Further, we have not guaranteed any obligations of unconsolidated entities nor do we have any commitment or intent to provide funding to any such entities. Item 7A. Quantitative and Qualitative Disclosures about Market Risk
This section should be read in conjunction with “Item 1A. Risk Factors” in this Annual Report on Form 10-K and our subsequent periodic reports filed with the SEC.
We seek to manage risks that we believe will impact our business including, interest rates, liquidity, prepayments, credit quality and market value. When managing these risks we consider the impact on our assets, liabilities and derivative positions. While we do not seek to avoid risk completely, we believe the risk can be quantified from historical experience and seek to actively manage that risk, to generate risk-adjusted total returns that we believe compensate us appropriately for those risks and to maintain capital levels consistent with the risks we take.
The following analysis includes forward-looking statements that assume that certain market conditions occur. Actual results may differ materially from these projected results due to changes in our portfolio assets and borrowings mix and due to developments in the domestic and global financial and real estate markets. Developments in the financial markets include the likelihood of changing interest rates and the relationship of various interest rates and their impact on our portfolio yield, cost of funds and cash flows. The analytical methods that we use to assess and mitigate these market risks should not be considered projections of future events or operating performance. Interest Rate Risk
Interest rates are sensitive to many factors, including governmental, monetary, tax policies, domestic and international economic conditions, and political or regulatory matters beyond our control. Changes in interest rates affect the value of the financial assets we manage and hold in our investment portfolio and the variable-rate borrowings we use to finance our portfolio. Changes in interest rates also affect the interest rate swaps and caps, Eurodollar and other futures, TBAs and other securities or instruments we use to hedge our portfolio. As a result, our net interest income is particularly affected by changes in interest rates.
For example, we hold RMBS, some of which may have fixed rates or interest rates that adjust on various dates that are not synchronized to
the adjustment dates on our repurchase agreements. In general, the re-pricing of our repurchase agreements occurs more quickly than the re-pricing of our variable-interest assets. Thus, it is likely that our floating rate borrowings, such as our repurchase agreements, may react to interest rates before our RMBS because the weighted average next re-pricing dates on the related borrowings may have shorter time periods than that of the RMBS. In addition, the interest rates on our Agency ARMs backed by hybrid ARMs may be limited to a “periodic cap,” or an increase of typically 1% or 2% per adjustment period, while our borrowings do not have comparable limitations. Moreover, changes in interest rates can directly impact prepayment speeds, thereby affecting our net return on RMBS. During a declining interest rate environment, the prepayment of RMBS may accelerate (as borrowers may opt to refinance at a lower interest rate) causing the amount of liabilities that have been extended by the use of interest rate swaps to increase relative to the amount of RMBS, possibly resulting in a decline in our net return on RMBS, as replacement RMBS may have a lower yield than those being prepaid. Conversely, during an increasing interest rate environment, RMBS may prepay more slowly than expected, requiring us to finance a higher amount of RMBS than originally forecast and at a time when interest rates may be higher, resulting in a decline in our net return on RMBS. Accordingly, each of these scenarios can negatively impact our net interest income.
We seek to manage interest rate risk in our portfolio by utilizing interest rate swaps, swaptions, caps, Eurodollar and other futures, options
and U.S. Treasury securities with the goal of optimizing the earnings potential while seeking to maintain long term stable portfolio values. We continually monitor the duration of our mortgage assets and have a policy to hedge the financing of those assets such that the net duration of the assets, our borrowed funds related to such assets, and related hedging instruments, is less than one year. In addition, we utilize TBAs to mitigate the risks on our long Agency RMBS positions associated with our investments in Agency IOs.
We utilize a model-based risk analysis system to assist in projecting portfolio performances over a scenario of different interest rates. The
model incorporates shifts in interest rates, changes in prepayments and other factors impacting the valuations of our financial securities and instruments, including mortgage-backed securities, repurchase agreements, interest rate swaps and interest rate caps, TBAs and Eurodollar futures.
70

Based on the results of the model, the instantaneous changes in interest rates specified below would have had the following effect on net
interest income for the next 12 months based on our assets and liabilities as of December 31, 2014 (dollar amounts in thousands):
Interest rate changes may also impact our net book value as our financial assets and related hedge derivatives are marked-to-market each
quarter. Generally, as interest rates increase, the value of our mortgage assets, other than IOs, decreases, and conversely, as interest rates decrease, the value of such investments will increase. The value of an IO will likely be negatively affected in a declining interest rate environment due to the risk of increasing prepayment rates because the IOs’ value is wholly contingent on the underlying mortgage loans having an outstanding balance. In general, we expect that, over time, decreases in the value of our portfolio attributable to interest rate changes will be offset, to the degree we are hedged, by increases in the value of our interest rate swaps or other financial instruments used for hedging purposes, and vice versa. However, the relationship between spreads on securities and spreads on our hedging instruments may vary from time to time, resulting in a net aggregate book value increase or decline. That said, unless there is a material impairment in value that would result in a payment not being received on a security or loan, changes in the book value of our portfolio will not directly affect our recurring earnings or our ability to make a distribution to our stockholders.
Liquidity Risk
Liquidity is a measure of our ability to meet potential cash requirements, including ongoing commitments to repay borrowings, fund and maintain investments, pay dividends to our stockholders and other general business needs. We recognize the need to have funds available to operate our business. It is our policy to have adequate liquidity at all times. We plan to meet liquidity through normal operations with the goal of avoiding unplanned sales of assets or emergency borrowing of funds.
Our principal sources of liquidity are the repurchase agreements on our mortgage-backed securities, the CDOs we have issued to finance our
loans held in securitization trusts, securitized debt, trust preferred securities, the principal and interest payments from our assets and cash proceeds from the issuance of equity or debt securities (as market and other conditions permit). We believe our existing cash balances and cash flows from operations will be sufficient for our liquidity requirements for at least the next 12 months.
We are subject to “margin call” risk under the terms of our repurchase agreements. In the event the value of our assets pledged as collateral
suddenly decreases, margin calls relating to our repurchase agreements could increase, causing an adverse change in our liquidity position. Additionally, if one or more of our repurchase agreement counterparties chooses not to provide ongoing funding, we may be unable to replace the financing through other lenders on favorable terms or at all. As such, we provide no assurance that we will be able to roll over our repurchase agreements as they mature from time to time in the future. See Item 7, "Management's Discussion and Analysis of Financial Condition and Results of Operations Liquidity and Capital Resources" in this Annual Report on Form 10-K for further information about our liquidity and capital resource management .
Derivative financial instruments used to hedge interest rate risk are subject to “margin call” risk. For example, under our interest rate swaps,
typically we pay a fixed rate to the counterparties while they pay us a floating rate. If interest rates drop below the fixed rate we are paying on an interest rate swap, we may be required to post cash margin.
Prepayment Risk
When borrowers repay the principal on their residential mortgage loans before maturity or faster than their scheduled amortization, the effect is to shorten the period over which interest is earned, and therefore, reduce the yield for residential mortgage assets purchased at a premium to their then current balance, as with our portfolio of Agency RMBS. Conversely, residential mortgage assets purchased for less than their then current balance, such as our distressed residential mortgage loans, exhibit higher yields due to faster prepayments. Furthermore, actual prepayment speeds may differ from our modeled prepayment speed projections impacting the effectiveness of any hedges we have in place to mitigate financing and/or fair value risk. Generally, when market interest rates decline, borrowers have a tendency to refinance their mortgages, thereby increasing prepayments. The impact of increasing prepayment rates, whether as a result of declining interest rates, government intervention in the mortgage markets or otherwise, is particularly acute with respect to our Agency IOs. Because the value of an IO security is wholly contingent on the underlying mortgage loans having an outstanding principal balance, an unexpected increase in prepayment rates on the pool of mortgage loans underlying the IOs could significantly negatively impact the performance of our Agency IOs.
Changes in Net Interest Income
Changes in Interest Rates Changes in Net Interest
Income +200 $ 6,494 +100 $ 6,545 -100 $ (16,191 )
71

Our modeled prepayments will help determine the amount of hedging we use to off-set changes in interest rates. If actual prepayment rates are
higher than modeled, the yield will be less than modeled in cases where we paid a premium for the particular residential mortgage asset. Conversely, when we have paid a premium, if actual prepayment rates experienced are slower than modeled, we would amortize the premium over a longer time period, resulting in a higher yield to maturity.
In an environment of increasing prepayment speeds, the timing difference between the actual cash receipt of principal paydowns and the
announcement of the principal paydown may result in additional margin requirements from our repurchase agreement counterparties.
We mitigate prepayment risk by constantly evaluating our residential mortgage assets relative to prepayment speeds observed for assets with similar structures, quantities and characteristics. Furthermore, we stress-test the portfolio as to prepayment speeds and interest rate risk in order to further develop or make modifications to our hedge balances. Historically, we have not hedged 100% of our liability costs due to prepayment risk. Credit Risk
Credit risk is the risk that we will not fully collect the principal we have invested in our credit sensitive assets, including distressed residential and other mortgage loans, CMBS, and CLOs, due to borrower defaults. In selecting the credit sensitive assets in our portfolio, we seek to identify and invest in assets with characteristics that we believe offset or limit the exposure of borrower defaults to the Company.
We seek to manage credit risk through our pre-acquisition due diligence process, and by factoring projected credit losses into the purchase
price we pay for all of our credit sensitive assets. In general, we evaluate relative valuation, supply and demand trends, prepayment rates, delinquency and default rates, vintage of collateral and macroeconomic factors as part of this process. Nevertheless, these procedures do not guarantee unanticipated credit losses which would materially affect our operating results.
With respect to the $582.7 million of distressed residential loans the Company owned at December 31, 2014, the mortgage loans were
purchased at a discount to par reflecting their distressed state or perceived higher risk of default, which may include higher loan to value ratios and, in certain instances, delinquent loan payments. Prior to the acquisition of distressed residential mortgage loans, the Company validates key information provided by the sellers that is necessary to determine the value of the distressed residential mortgage loans. We then seek to maximize the value of the mortgage loans that we acquire either through borrower assisted refinancing, outright loan sale or through foreclosure and resale of the underlying home. We evaluate credit quality on an ongoing basis by reviewing borrower’s payment status and current financial and economic condition. Additionally, we look at the carrying value of any delinquent loan and compare to the current value of the underlying collateral.
As of December 31, 2014, we own $321.6 million of first loss CMBS comprised primarily of first loss POs that are backed by commercial mortgage loans on multi-family properties at a weighted average amortized purchase price of approximately 32.4% of current par. Prior to the acquisition of each of our first loss CMBS securities, the Company completes an extensive review of the underlying loan collateral, including loan level cash flow re-underwriting, site inspections on selected properties, property specific cash flow and loss modeling, review of appraisals, property condition and environmental reports, and other credit risk analyses. We continue to monitor credit quality on an ongoing basis using updated property level financial reports provided by borrowers and periodic site inspection of selected properties. We also reconcile on a monthly basis the actual bond distributions received against projected distributions to assure proper allocation of cash flow generated by the underlying loan pool. As of December 31, 2014, we own approximately $35.2 million of notes issued by a CLO at a discounted price equal to 74% of par. The securities are backed by a portfolio of corporate loans. We also own approximately $34.8 million of first mortgage loan and mezzanine financing at December 31, 2014, backed by residential and multi-family properties. We also have invested approximately $36.6 million in equity and debt securities issued by an entity that invest in commercial real estate-related debt investments.
Fair Value Risk
Changes in interest rates also expose us to market value (fair value) fluctuation on our assets, liabilities and hedges. While the fair value of the majority of our assets (when excluding all Consolidated K-Series assets other than the securities we actually own) that are measured on a recurring basis are determined using Level 2 fair values, we own certain assets, such as our CMBS, for which fair values may not be readily available if there are no active trading markets for the instruments. In such cases, fair values would only be derived or estimated for these investments using various valuation techniques, such as computing the present value of estimated future cash flows using discount rates commensurate with the risks involved. However, the determination of estimated future cash flows is inherently subjective and imprecise. Minor changes in assumptions or estimation methodologies can have a material effect on these derived or estimated fair values. Our fair value estimates and assumptions are indicative of the interest rate environments as of December 31, 2014, and do not take into consideration the effects of subsequent interest rate fluctuations.
72
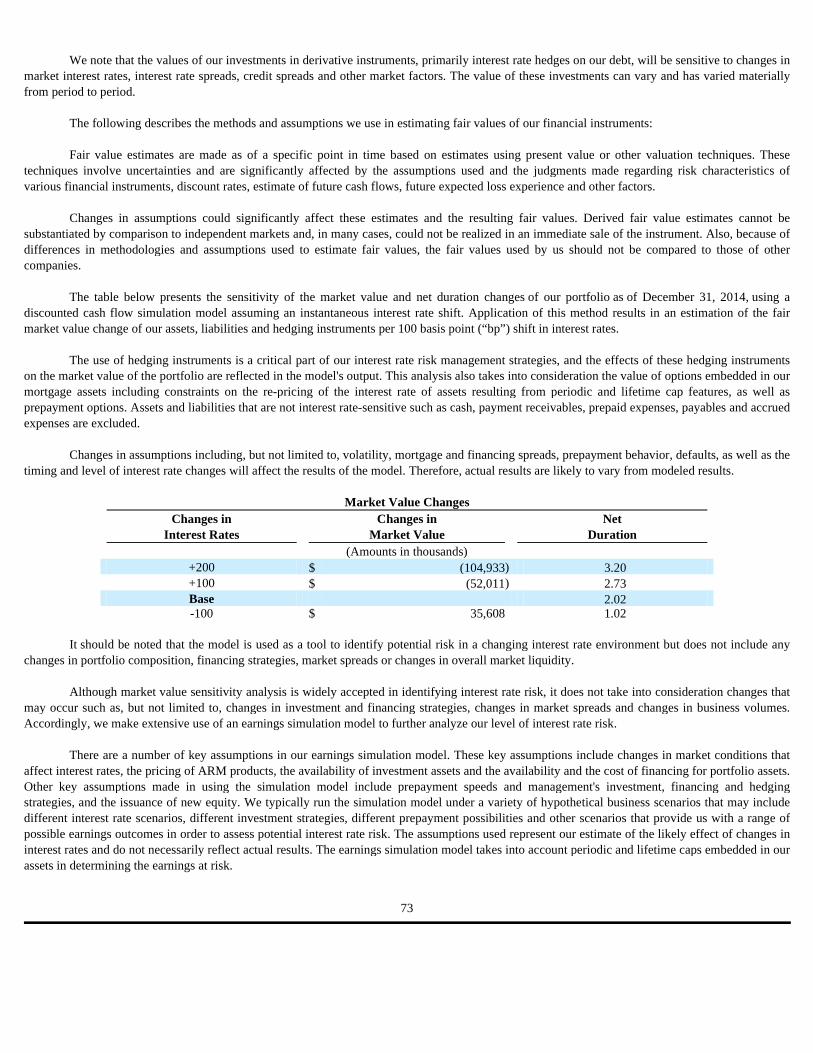
We note that the values of our investments in derivative instruments, primarily interest rate hedges on our debt, will be sensitive to changes in
market interest rates, interest rate spreads, credit spreads and other market factors. The value of these investments can vary and has varied materially from period to period.
The following describes the methods and assumptions we use in estimating fair values of our financial instruments: Fair value estimates are made as of a specific point in time based on estimates using present value or other valuation techniques. These
techniques involve uncertainties and are significantly affected by the assumptions used and the judgments made regarding risk characteristics of various financial instruments, discount rates, estimate of future cash flows, future expected loss experience and other factors.
Changes in assumptions could significantly affect these estimates and the resulting fair values. Derived fair value estimates cannot be
substantiated by comparison to independent markets and, in many cases, could not be realized in an immediate sale of the instrument. Also, because of differences in methodologies and assumptions used to estimate fair values, the fair values used by us should not be compared to those of other companies.
The table below presents the sensitivity of the market value and net duration changes of our portfolio as of December 31, 2014, using a
discounted cash flow simulation model assuming an instantaneous interest rate shift. Application of this method results in an estimation of the fair market value change of our assets, liabilities and hedging instruments per 100 basis point (“bp”) shift in interest rates.
The use of hedging instruments is a critical part of our interest rate risk management strategies, and the effects of these hedging instruments
on the market value of the portfolio are reflected in the model's output. This analysis also takes into consideration the value of options embedded in our mortgage assets including constraints on the re-pricing of the interest rate of assets resulting from periodic and lifetime cap features, as well as prepayment options. Assets and liabilities that are not interest rate-sensitive such as cash, payment receivables, prepaid expenses, payables and accrued expenses are excluded.
Changes in assumptions including, but not limited to, volatility, mortgage and financing spreads, prepayment behavior, defaults, as well as the
timing and level of interest rate changes will affect the results of the model. Therefore, actual results are likely to vary from modeled results.
It should be noted that the model is used as a tool to identify potential risk in a changing interest rate environment but does not include any
changes in portfolio composition, financing strategies, market spreads or changes in overall market liquidity. Although market value sensitivity analysis is widely accepted in identifying interest rate risk, it does not take into consideration changes that
may occur such as, but not limited to, changes in investment and financing strategies, changes in market spreads and changes in business volumes. Accordingly, we make extensive use of an earnings simulation model to further analyze our level of interest rate risk.
There are a number of key assumptions in our earnings simulation model. These key assumptions include changes in market conditions that
affect interest rates, the pricing of ARM products, the availability of investment assets and the availability and the cost of financing for portfolio assets. Other key assumptions made in using the simulation model include prepayment speeds and management's investment, financing and hedging strategies, and the issuance of new equity. We typically run the simulation model under a variety of hypothetical business scenarios that may include different interest rate scenarios, different investment strategies, different prepayment possibilities and other scenarios that provide us with a range of possible earnings outcomes in order to assess potential interest rate risk. The assumptions used represent our estimate of the likely effect of changes in interest rates and do not necessarily reflect actual results. The earnings simulation model takes into account periodic and lifetime caps embedded in our assets in determining the earnings at risk.
Market Value Changes
Changes in
Interest Rates Changes in
Market Value Net
Duration (Amounts in thousands) +200 $ (104,933 ) 3.20 +100 $ (52,011 ) 2.73 Base 2.02 -100 $ 35,608 1.02
73

Item 8. FINANCIAL STATEMENTS AND SUPPLEMENTARY DATA
Our financial statements and the related notes, together with the Report of Independent Registered Public Accounting Firm thereon, as required by this Item 8, are set forth beginning on page F-1 of this Annual Report on Form 10-K and are incorporated herein by reference.
Item 9. CHANGES IN AND DISAGREEMENTS WITH ACCOUNTANTS ON ACCOUNTING AND FINANCIAL DISCLOSURE.
None. Item 9A. CONTROLS AND PROCEDURES
Evaluation of Disclosure Controls and Procedures - We maintain disclosure controls and procedures that are designed to ensure that information required to be disclosed in the reports that we file or submit under the Securities Exchange Act of 1934, as amended, is recorded, processed, summarized and reported within the time periods specified in the rules and forms of the SEC, and that such information is accumulated and communicated to our management as appropriate to allow timely decisions regarding required disclosures. An evaluation was performed under the supervision and with the participation of our management, including our Chief Executive Officer and Chief Financial Officer, of the effectiveness of our disclosure controls and procedures (as defined in Rules 13a-15(e) and 15d-15(e) under the Securities Exchange Act of 1934, as amended) as of December 31, 2014. Based upon that evaluation, our Chief Executive Officer and Chief Financial Officer concluded that our disclosure controls and procedures were effective as of December 31, 2014.
Management’s Report on Internal Control Over Financial Reporting . Our management is responsible for establishing and maintaining
adequate internal control over financial reporting, as such term is defined in Exchange Act Rule 13a-15(f). Our internal control system was designed to provide reasonable assurance to our management and Board of Directors regarding the reliability, preparation and fair presentation of published financial statements in accordance with generally accepted accounting principles. Under the supervision and with the participation of our management, including our principal executive officer and principal financial officer, we conducted an evaluation of the effectiveness of our internal control over financial reporting based on the framework in Internal Control - Integrated Framework , issued by the Committee of Sponsoring Organizations of the Treadway Commission. Based on our evaluation under the framework in Internal Control Integrated Framework , our management concluded that our internal control over financial reporting was effective as of December 31, 2014.
The effectiveness of our internal control over financial reporting as of December 31, 2014 has been audited by Grant Thornton LLP, an
independent registered public accounting firm, as stated in their report which appears in Item 15(a) of this Annual Report on Form 10-K and is incorporated by reference herein.
Changes in Internal Control Over Financial Reporting. There have been no changes in our internal control over financial reporting during the
quarter ended December 31, 2014 that have materially affected, or are reasonably likely to materially affect, our internal control over financial reporting.
Inherent Limitations on Effectiveness of Controls. Our management, including our Chief Executive Officer and Chief Financial Officer, does
not expect that our disclosure controls or our internal control over financial reporting will prevent or detect all error and all fraud. A control system, no matter how well designed and operated, can provide only reasonable, not absolute, assurance that the control system’s objectives will be met. The design of a control system must reflect the fact that there are resource constraints, and the benefits of controls must be considered relative to their costs. Further, because of the inherent limitations in all control systems, no evaluation of controls can provide absolute assurance that misstatements due to error or fraud will not occur or that all control issues and instances of fraud, if any, have been detected. These inherent limitations include the realities that judgments in decision-making can be faulty and that breakdowns can occur because of simple error or mistake. Controls can also be circumvented by the individual acts of some persons, by collusion of two or more people, or by management override of the controls. The design of any system of controls is based in part on certain assumptions about the likelihood of future events, and there can be no assurance that any design will succeed in achieving its stated goals under all potential future conditions. Projections of any evaluation of controls effectiveness to future periods are subject to risks. Over time, controls may become inadequate because of changes in conditions or deterioration in the degree of compliance with policies or procedures.
Item 9B. OTHER INFORMATION
None.
74

PART III
Item 10. DIRECTORS, EXECUTIVE OFFICER AND CORPORATE GOVERNANCE
The information required by this item is included in our Proxy Statement for our 2015 Annual Meeting of Stockholders to be filed with the SEC within 120 days after the end of the fiscal year ended December 31, 2014 (the “2015 Proxy Statement”) and is incorporated herein by reference.
Item 11. EXECUTIVE COMPENSATION
The information required by this item is included in the 2015 Proxy Statement and is incorporated herein by reference.
Item 12. SECURITY OWNERSHIP OF CERTAIN BENEFICIAL OWNERS AND MANAGEMENT AND RELATED STOCKHOLDER MATTERS
Except as set forth below, the information required by this item is included in the 2015 Proxy Statement and is incorporated herein by reference.
The information presented under the heading “Market for the Registrant’s Common Equity and Related Stockholder Matters — Securities Authorized for Issuance Under Equity Compensation Plans” in Item 5 of Part II of this Form 10-K is incorporated herein by reference.
Item 13. CERTAIN RELATIONSHIPS AND RELATED TRANSACTIONS, AND DIRECTOR INDEPENDENCE
The information required by this item is included in the 2015 Proxy Statement and is incorporated herein by reference.
Item 14. PRINCIPAL ACCOUNTING FEES AND SERVICES
The information required by this item is included in the 2015 Proxy Statement and is incorporated herein by reference.
75
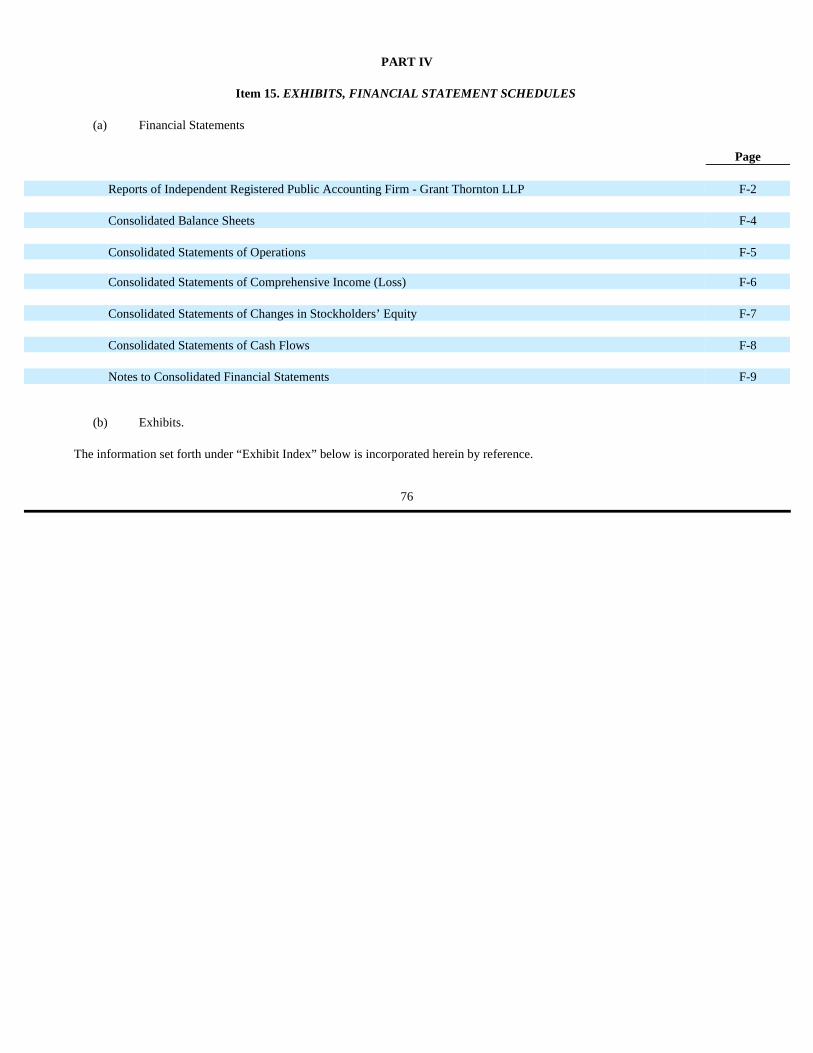
PART IV
Item 15. EXHIBITS, FINANCIAL STATEMENT SCHEDULES
The information set forth under “Exhibit Index” below is incorporated herein by reference.
(a) Financial Statements
Page Reports of Independent Registered Public Accounting Firm - Grant Thornton LLP F-2 Consolidated Balance Sheets F-4 Consolidated Statements of Operations F-5 Consolidated Statements of Comprehensive Income (Loss) F-6 Consolidated Statements of Changes in Stockholders’ Equity F-7 Consolidated Statements of Cash Flows F-8 Notes to Consolidated Financial Statements F-9
(b) Exhibits.
76

SIGNATURES
Pursuant to the requirements of Section 13 or 15(d) of the Securities Exchange Act of 1934, the Registrant has duly caused this report to be
signed on its behalf by the undersigned, thereunto duly authorized.
Pursuant to the requirements of the Securities Exchange Act of 1934, this report has been signed below by the following persons on behalf of
the registrant and in the capacities and on the dates indicated.
NEW YORK MORTGAGE TRUST, INC. Date: February 27, 2015 By: /s/ Steven R. Mumma Steven R. Mumma Chief Executive Officer and President (Principal Executive Officer)
Date: February 27, 2015 By: /s/ Kristine R. Nario Kristine R. Nario Chief Financial Officer (Principal Financial and Accounting Officer)
Signature Title Date /s/ Steven R. Mumma Chief Executive Officer, President and Director February 27, 2015 Steven R. Mumma (Principal Executive Officer) /s/ Kristine R. Nario Chief Financial Officer February 27, 2015 Kristine R. Nario (Principal Financial and Accounting Officer) /s/ Douglas E. Neal Chairman of the Board February 27, 2015 Douglas E. Neal /s/ Alan L. Hainey Director February 27, 2015 Alan L. Hainey /s/ Steven G. Norcutt Director February 27, 2015 Steven G. Norcutt /s/ David R. Bock Director February 27, 2015 David R. Bock
77
NEW YORK MORTGAGE TRUST, INC. AND SUBSIDIARIES
CONSOLIDATED FINANCIAL STATEMENTS
AND
REPORTS OF INDEPENDENT REGISTERED PUBLIC ACCOUNTING FIRM
For Inclusion in Form 10-K
Filed with
United States Securities and Exchange Commission
December 31, 2014
NEW YORK MORTGAGE TRUST, INC. AND SUBSIDIARIES
Index to Consolidated Financial Statements
FINANCIAL STATEMENTS: PAGE
Reports of Independent Registered Public Accounting Firm - Grant Thornton LLP F-2 Consolidated Balance Sheets F-4 Consolidated Statements of Operations F-5 Consolidated Statements of Comprehensive Income (Loss) F-6 Consolidated Statements of Changes in Stockholders' Equity F-7 Consolidated Statements of Cash Flows F-8 Notes to Consolidated Financial Statements F-9
REPORT OF INDEPENDENT REGISTERED PUBLIC ACCOUNTING FIRM Board of Directors and Stockholders New York Mortgage Trust, Inc. We have audited the accompanying consolidated balance sheets of New York Mortgage Trust, Inc. (a Maryland corporation) and subsidiaries (the “Company”) as of December 31, 2014 and 2013, and the related consolidated statements of operations, comprehensive income (loss), changes in stockholders’ equity, and cash flows for each of the three years in the period ended December 31, 2014. These financial statements are the responsibility of the Company’s management. Our responsibility is to express an opinion on these financial statements based on our audits. We conducted our audits in accordance with the standards of the Public Company Accounting Oversight Board (United States). Those standards require that we plan and perform the audit to obtain reasonable assurance about whether the financial statements are free of material misstatement. An audit includes examining, on a test basis, evidence supporting the amounts and disclosures in the financial statements. An audit also includes assessing the accounting principles used and significant estimates made by management, as well as evaluating the overall financial statement presentation. We believe that our audits provide a reasonable basis for our opinion. In our opinion, the consolidated financial statements referred to above present fairly, in all material respects, the financial position of New York Mortgage Trust, Inc. and subsidiaries as of December 31, 2014 and 2013, and the results of their operations and their cash flows for each of the three years in the period ended December 31, 2014 in conformity with accounting principles generally accepted in the United States of America. We also have audited, in accordance with the standards of the Public Company Accounting Oversight Board (United States), the Company’s internal control over financial reporting as of December 31, 2014, based on criteria established in the 2013 Internal Control—Integrated Framework issued by the Committee of Sponsoring Organizations of the Treadway Commission (COSO), and our report dated February 27, 2015 expressed an unqualified opinion. /s/ Grant Thornton LLP New York, New York February 27, 2015
F-2
REPORT OF INDEPENDENT REGISTERED PUBLIC ACCOUNTING FIRM Board of Directors and Stockholders New York Mortgage Trust, Inc. We have audited the internal control over financial reporting of New York Mortgage Trust, Inc. (a Maryland corporation) and subsidiaries (the “Company”) as of December 31, 2014, based on criteria established in the 2013 Internal Control—Integrated Framework issued by the Committee of Sponsoring Organizations of the Treadway Commission (COSO). The Company’s management is responsible for maintaining effective internal control over financial reporting and for its assessment of the effectiveness of internal control over financial reporting, included in the accompanying Management’s Report on Internal Control Over Financial Reporting. Our responsibility is to express an opinion on the Company’s internal control over financial reporting based on our audit. We conducted our audit in accordance with the standards of the Public Company Accounting Oversight Board (United States). Those standards require that we plan and perform the audit to obtain reasonable assurance about whether effective internal control over financial reporting was maintained in all material respects. Our audit included obtaining an understanding of internal control over financial reporting, assessing the risk that a material weakness exists, testing and evaluating the design and operating effectiveness of internal control based on the assessed risk, and performing such other procedures as we considered necessary in the circumstances. We believe that our audit provides a reasonable basis for our opinion. A company’s internal control over financial reporting is a process designed to provide reasonable assurance regarding the reliability of financial reporting and the preparation of financial statements for external purposes in accordance with generally accepted accounting principles. A company’s internal control over financial reporting includes those policies and procedures that (1) pertain to the maintenance of records that, in reasonable detail, accurately and fairly reflect the transactions and dispositions of the assets of the company; (2) provide reasonable assurance that transactions are recorded as necessary to permit preparation of financial statements in accordance with generally accepted accounting principles, and that receipts and expenditures of the company are being made only in accordance with authorizations of management and directors of the company; and (3) provide reasonable assurance regarding prevention or timely detection of unauthorized acquisition, use, or disposition of the company’s assets that could have a material effect on the financial statements. Because of its inherent limitations, internal control over financial reporting may not prevent or detect misstatements. Also, projections of any evaluation of effectiveness to future periods are subject to the risk that controls may become inadequate because of changes in conditions, or that the degree of compliance with the policies or procedures may deteriorate. In our opinion, the Company maintained, in all material respects, effective internal control over financial reporting as of December 31, 2014, based on criteria established in the 2013 Internal Control—Integrated Framework issued by COSO. We also have audited, in accordance with the standards of the Public Company Accounting Oversight Board (United States), the consolidated financial statements of the Company as of and for the year ended December 31, 2014, and our report dated February 27, 2015 expressed an unqualified opinion on those financial statements. /s/ Grant Thornton LLP New York, New York February 27, 2015
F-3
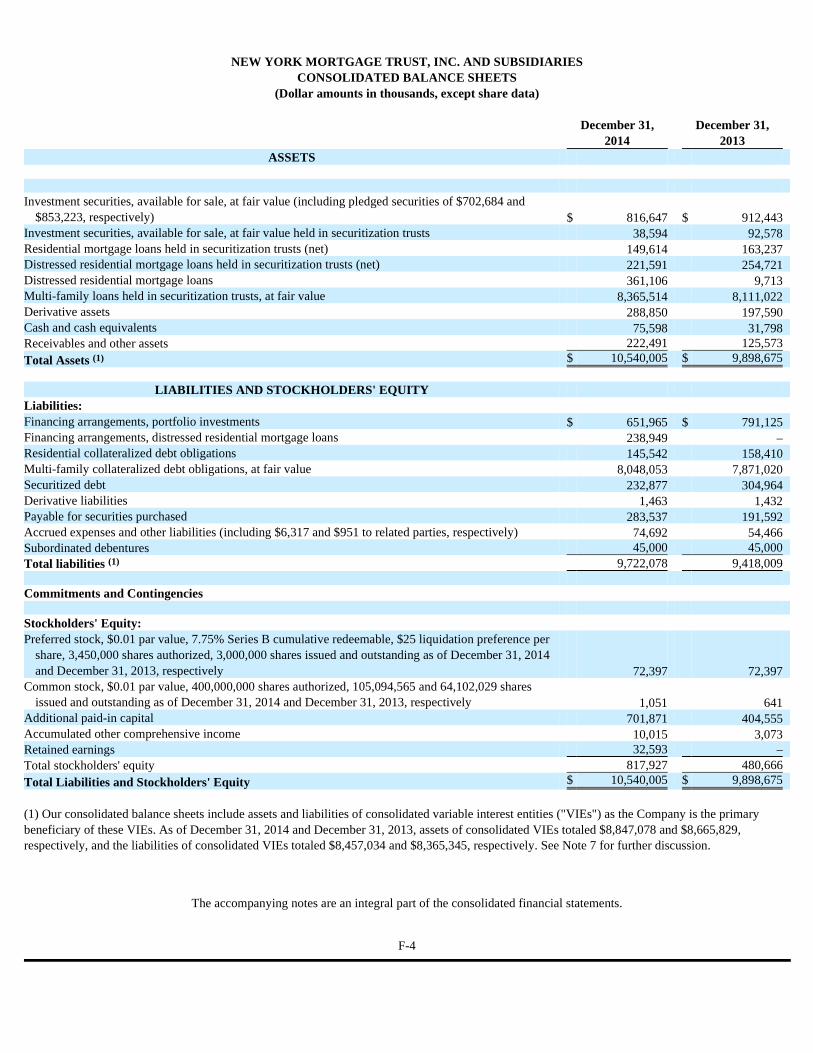
NEW YORK MORTGAGE TRUST, INC. AND SUBSIDIARIES
CONSOLIDATED BALANCE SHEETS (Dollar amounts in thousands, except share data)
(1) Our consolidated balance sheets include assets and liabilities of consolidated variable interest entities ("VIEs") as the Company is the primary beneficiary of these VIEs. As of December 31, 2014 and December 31, 2013, assets of consolidated VIEs totaled $8,847,078 and $8,665,829, respectively, and the liabilities of consolidated VIEs totaled $8,457,034 and $8,365,345, respectively. See Note 7 for further discussion.
The accompanying notes are an integral part of the consolidated financial statements.
December 31, December 31, 2014 2013
ASSETS Investment securities, available for sale, at fair value (including pledged securities of $702,684 and
$853,223, respectively) $ 816,647 $ 912,443 Investment securities, available for sale, at fair value held in securitization trusts 38,594 92,578 Residential mortgage loans held in securitization trusts (net) 149,614 163,237 Distressed residential mortgage loans held in securitization trusts (net) 221,591 254,721 Distressed residential mortgage loans 361,106 9,713 Multi-family loans held in securitization trusts, at fair value 8,365,514 8,111,022 Derivative assets 288,850 197,590 Cash and cash equivalents 75,598 31,798 Receivables and other assets 222,491 125,573 Total Assets $ 10,540,005 $ 9,898,675
LIABILITIES AND STOCKHOLDERS' EQUITY Liabilities: Financing arrangements, portfolio investments $ 651,965 $ 791,125 Financing arrangements, distressed residential mortgage loans 238,949 – Residential collateralized debt obligations 145,542 158,410 Multi-family collateralized debt obligations, at fair value 8,048,053 7,871,020 Securitized debt 232,877 304,964 Derivative liabilities 1,463 1,432 Payable for securities purchased 283,537 191,592 Accrued expenses and other liabilities (including $6,317 and $951 to related parties, respectively) 74,692 54,466 Subordinated debentures 45,000 45,000 Total liabilities 9,722,078 9,418,009 Commitments and Contingencies Stockholders' Equity: Preferred stock, $0.01 par value, 7.75% Series B cumulative redeemable, $25 liquidation preference per
share, 3,450,000 shares authorized, 3,000,000 shares issued and outstanding as of December 31, 2014 and December 31, 2013, respectively 72,397 72,397
Common stock, $0.01 par value, 400,000,000 shares authorized, 105,094,565 and 64,102,029 shares issued and outstanding as of December 31, 2014 and December 31, 2013, respectively 1,051 641
Additional paid-in capital 701,871 404,555 Accumulated other comprehensive income 10,015 3,073 Retained earnings 32,593 – Total stockholders' equity 817,927 480,666 Total Liabilities and Stockholders' Equity $ 10,540,005 $ 9,898,675
F-4
(1)
(1)
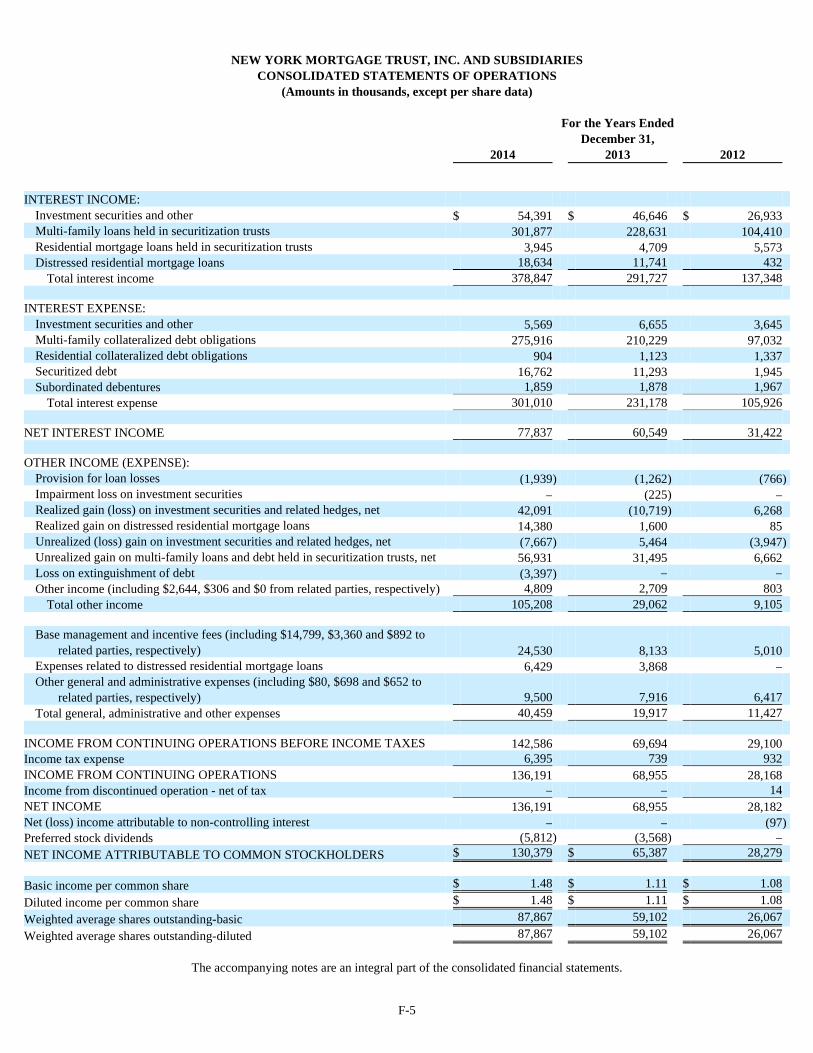
NEW YORK MORTGAGE TRUST, INC. AND SUBSIDIARIES
CONSOLIDATED STATEMENTS OF OPERATIONS (Amounts in thousands, except per share data)
The accompanying notes are an integral part of the consolidated financial statements.
For the Years Ended
December 31,
2014 2013 2012 INTEREST INCOME:
Investment securities and other $ 54,391 $ 46,646 $ 26,933 Multi-family loans held in securitization trusts 301,877 228,631 104,410 Residential mortgage loans held in securitization trusts 3,945 4,709 5,573 Distressed residential mortgage loans 18,634 11,741 432
Total interest income 378,847 291,727 137,348 INTEREST EXPENSE:
Investment securities and other 5,569 6,655 3,645 Multi-family collateralized debt obligations 275,916 210,229 97,032 Residential collateralized debt obligations 904 1,123 1,337 Securitized debt 16,762 11,293 1,945 Subordinated debentures 1,859 1,878 1,967
Total interest expense 301,010 231,178 105,926 NET INTEREST INCOME 77,837 60,549 31,422 OTHER INCOME (EXPENSE):
Provision for loan losses (1,939 ) (1,262 ) (766 ) Impairment loss on investment securities – (225 ) – Realized gain (loss) on investment securities and related hedges, net 42,091 (10,719 ) 6,268 Realized gain on distressed residential mortgage loans 14,380 1,600 85 Unrealized (loss) gain on investment securities and related hedges, net (7,667 ) 5,464 (3,947 ) Unrealized gain on multi-family loans and debt held in securitization trusts, net 56,931 31,495 6,662 Loss on extinguishment of debt (3,397 ) – – Other income (including $2,644, $306 and $0 from related parties, respectively) 4,809 2,709 803
Total other income 105,208 29,062 9,105
Base management and incentive fees (including $14,799, $3,360 and $892 to related parties, respectively) 24,530 8,133 5,010
Expenses related to distressed residential mortgage loans 6,429 3,868 – Other general and administrative expenses (including $80, $698 and $652 to
related parties, respectively) 9,500 7,916 6,417 Total general, administrative and other expenses 40,459 19,917 11,427
INCOME FROM CONTINUING OPERATIONS BEFORE INCOME TAXES 142,586 69,694 29,100 Income tax expense 6,395 739 932 INCOME FROM CONTINUING OPERATIONS 136,191 68,955 28,168 Income from discontinued operation - net of tax – – 14 NET INCOME 136,191 68,955 28,182 Net (loss) income attributable to non-controlling interest – – (97 ) Preferred stock dividends (5,812 ) (3,568 ) – NET INCOME ATTRIBUTABLE TO COMMON STOCKHOLDERS $ 130,379 $ 65,387 28,279 Basic income per common share $ 1.48 $ 1.11 $ 1.08
Diluted income per common share $ 1.48 $ 1.11 $ 1.08
Weighted average shares outstanding-basic 87,867 59,102 26,067
Weighted average shares outstanding-diluted 87,867 59,102 26,067
F-5

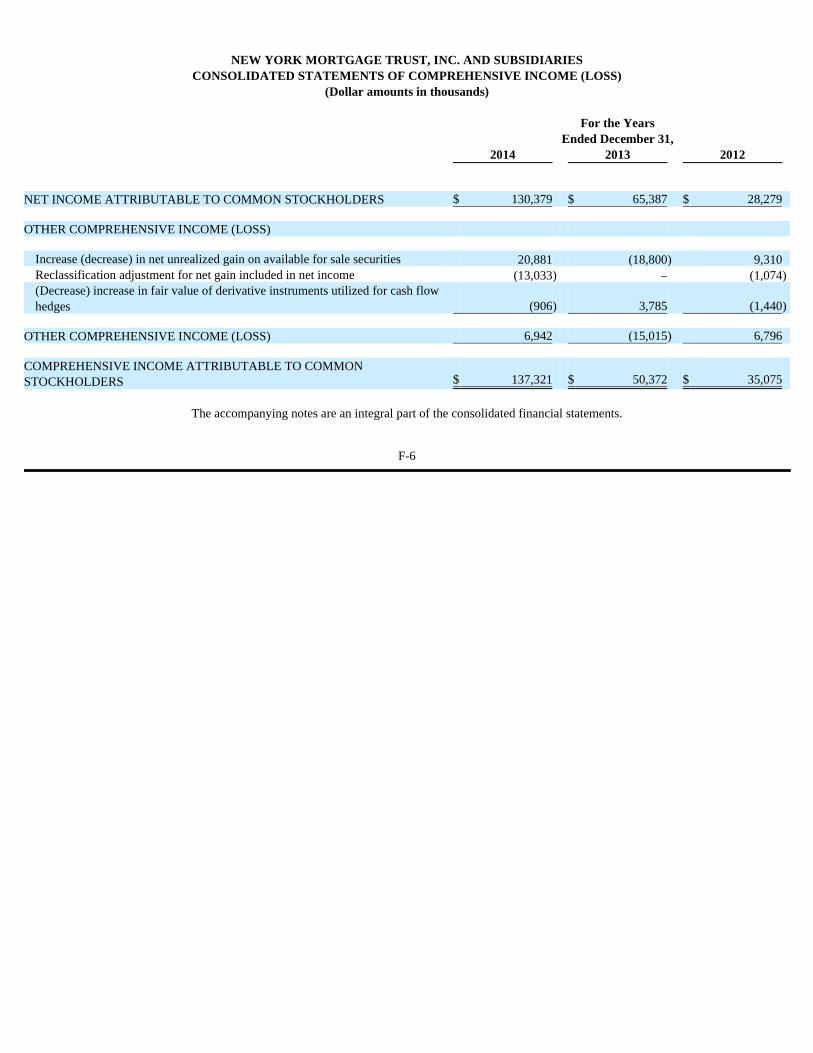
NEW YORK MORTGAGE TRUST, INC. AND SUBSIDIARIES
CONSOLIDATED STATEMENTS OF COMPREHENSIVE INCOME (LO SS) (Dollar amounts in thousands)
The accompanying notes are an integral part of the consolidated financial statements.
For the Years
Ended December 31,
2014 2013 2012 NET INCOME ATTRIBUTABLE TO COMMON STOCKHOLDERS $ 130,379 $ 65,387 $ 28,279 OTHER COMPREHENSIVE INCOME (LOSS)
Increase (decrease) in net unrealized gain on available for sale securities 20,881 (18,800 ) 9,310 Reclassification adjustment for net gain included in net income (13,033 ) – (1,074 ) (Decrease) increase in fair value of derivative instruments utilized for cash flow hedges (906 ) 3,785 (1,440 )
OTHER COMPREHENSIVE INCOME (LOSS) 6,942 (15,015 ) 6,796 COMPREHENSIVE INCOME ATTRIBUTABLE TO COMMON STOCKHOLDERS $ 137,321 $ 50,372 $ 35,075
F-6

NEW YORK MORTGAGE TRUST, INC. AND SUBSIDIARIES
CONSOLIDATED STATEMENTS OF CHANGES IN STOCKHOLDERS’ EQUITY For the Years Ended December 31, 2014, 2013 and 2012
(Dollar amounts in thousands)
The accompanying notes are an integral part of the consolidated financial statements.
Retained Accumulated Additional Earnings Other
Common
Preferred
Paid-In
(Accumulated
Comprehensive
Non-
Controlling
Stock Stock Capital Deficit) Income Interest Total Balance, December 31, 2011 $ 139 $ – $ 153,710 $ (79,863 ) $ 11,292 $ 1,029 $ 86,307
Net income – – – 28,279 – (97 ) 28,182 Stock issuance, net 357 – 232,105 – – – 232,462 Dividends declared – – (30,809 ) – – – (30,809 ) Decrease in non-controlling
interest related to sale of interest in a mortgage loan held for investment – – – – – (932 ) (932 )
Reclassification adjustment for net gain included in net income – – – – (1,074 ) – (1,074 )
Increase in net unrealized gain on available for sale securities – – – – 9,310 – 9,310
Decrease in fair value of derivative instruments utilized for cash flow hedges – – – – (1,440 ) – (1,440 )
Balance, December 31, 2012 496 – 355,006 (51,584 ) 18,088 – 322,006 Net income – – – 68,955 – – 68,955 Common Stock issuance, net 145 – 100,959 – – – 101,104 Preferred Stock issuance, net – 72,397 – – – – 72,397 Dividends declared on common
stock – – (51,410 ) (13,803 ) – – (65,213 ) Dividends declared on preferred
stock – – – (3,568 ) – – (3,568 ) Decrease in net unrealized gain
on available for sale securities – – – – (18,800 ) – (18,800 ) Increase in fair value of derivative
instruments utilized for cash flow hedges – – – – 3,785 – 3,785
Balance, December 31, 2013 641 72,397 404,555 – 3,073 – 480,666 Net income – – – 136,191 – – 136,191 Common Stock issuance, net 410 – 297,316 – – – 297,726 Dividends declared on common
stock – – – (97,786 ) – – (97,786 ) Dividends declared on preferred
stock – – – (5,812 ) – – (5,812 ) Reclassification adjustment for
net gain included in net income – – – – (13,033 ) – (13,033 ) Increase in net unrealized gain on
available for sale securities – – – – 20,881 – 20,881 Decrease in fair value of
derivative instruments utilized for cash flow hedges – – – – (906 ) – (906 )
Balance, December 31, 2014 $ 1,051 $ 72,397 $ 701,871 $ 32,593 $ 10,015 $ – $ 817,927
F-7
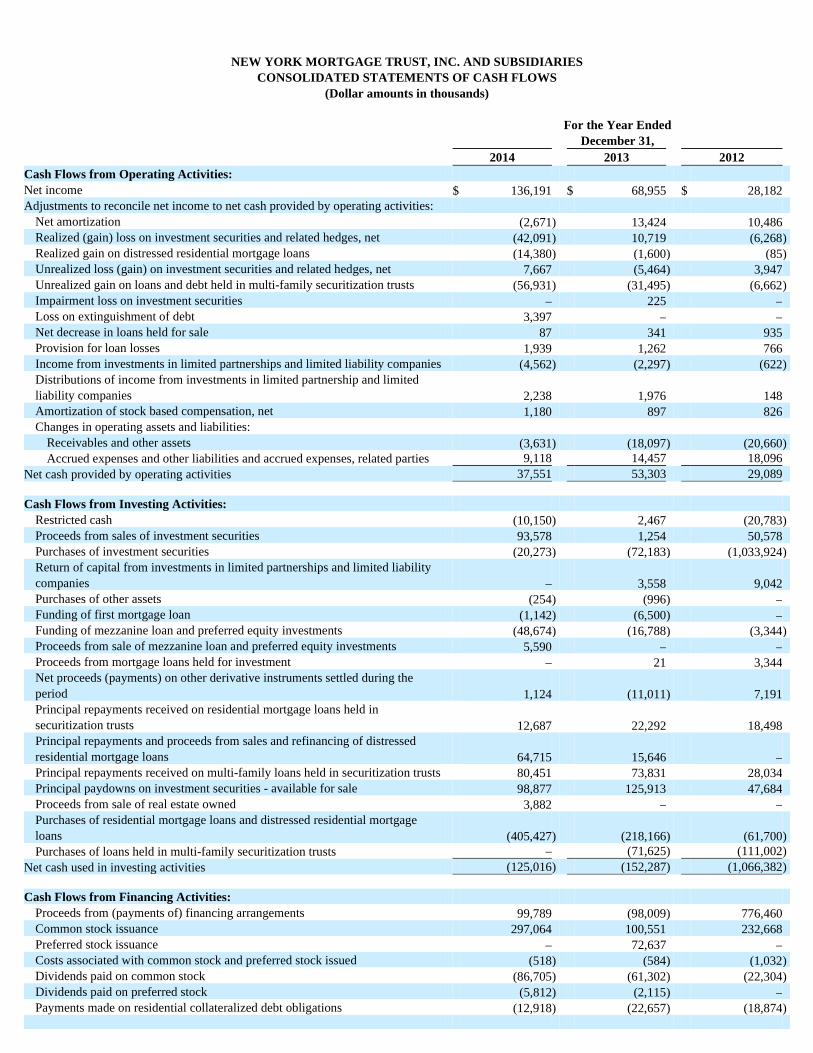
NEW YORK MORTGAGE TRUST, INC. AND SUBSIDIARIES
CONSOLIDATED STATEMENTS OF CASH FLOWS (Dollar amounts in thousands)
For the Year Ended
December 31,
2014 2013 2012 Cash Flows from Operating Activities: Net income $ 136,191 $ 68,955 $ 28,182 Adjustments to reconcile net income to net cash provided by operating activities:
Net amortization (2,671 ) 13,424 10,486 Realized (gain) loss on investment securities and related hedges, net (42,091 ) 10,719 (6,268 ) Realized gain on distressed residential mortgage loans (14,380 ) (1,600 ) (85 ) Unrealized loss (gain) on investment securities and related hedges, net 7,667 (5,464 ) 3,947 Unrealized gain on loans and debt held in multi-family securitization trusts (56,931 ) (31,495 ) (6,662 ) Impairment loss on investment securities – 225 – Loss on extinguishment of debt 3,397 – – Net decrease in loans held for sale 87 341 935 Provision for loan losses 1,939 1,262 766 Income from investments in limited partnerships and limited liability companies (4,562 ) (2,297 ) (622 ) Distributions of income from investments in limited partnership and limited liability companies 2,238 1,976 148 Amortization of stock based compensation, net 1,180 897 826 Changes in operating assets and liabilities:
Receivables and other assets (3,631 ) (18,097 ) (20,660 ) Accrued expenses and other liabilities and accrued expenses, related parties 9,118 14,457 18,096
Net cash provided by operating activities 37,551 53,303 29,089 Cash Flows from Investing Activities:
Restricted cash (10,150 ) 2,467 (20,783 ) Proceeds from sales of investment securities 93,578 1,254 50,578 Purchases of investment securities (20,273 ) (72,183 ) (1,033,924 ) Return of capital from investments in limited partnerships and limited liability companies – 3,558 9,042 Purchases of other assets (254 ) (996 ) – Funding of first mortgage loan (1,142 ) (6,500 ) – Funding of mezzanine loan and preferred equity investments (48,674 ) (16,788 ) (3,344 ) Proceeds from sale of mezzanine loan and preferred equity investments 5,590 – – Proceeds from mortgage loans held for investment – 21 3,344 Net proceeds (payments) on other derivative instruments settled during the period 1,124 (11,011 ) 7,191 Principal repayments received on residential mortgage loans held in securitization trusts 12,687 22,292 18,498 Principal repayments and proceeds from sales and refinancing of distressed residential mortgage loans 64,715 15,646 – Principal repayments received on multi-family loans held in securitization trusts 80,451 73,831 28,034 Principal paydowns on investment securities - available for sale 98,877 125,913 47,684 Proceeds from sale of real estate owned 3,882 – – Purchases of residential mortgage loans and distressed residential mortgage loans (405,427 ) (218,166 ) (61,700 ) Purchases of loans held in multi-family securitization trusts – (71,625 ) (111,002 )
Net cash used in investing activities (125,016 ) (152,287 ) (1,066,382 ) Cash Flows from Financing Activities:
Proceeds from (payments of) financing arrangements 99,789 (98,009 ) 776,460 Common stock issuance 297,064 100,551 232,668 Preferred stock issuance – 72,637 – Costs associated with common stock and preferred stock issued (518 ) (584 ) (1,032 ) Dividends paid on common stock (86,705 ) (61,302 ) (22,304 ) Dividends paid on preferred stock (5,812 ) (2,115 ) – Payments made on residential collateralized debt obligations (12,918 ) (22,657 ) (18,874 )
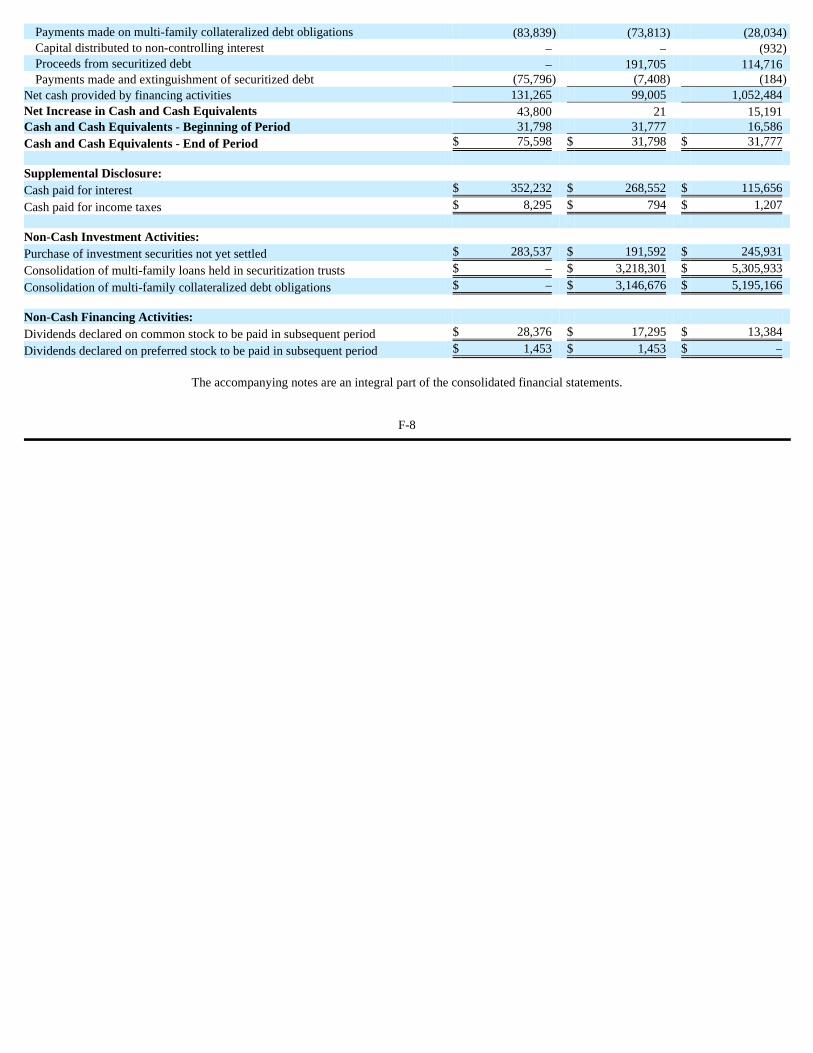
The accompanying notes are an integral part of the consolidated financial statements.
Payments made on multi-family collateralized debt obligations (83,839 ) (73,813 ) (28,034 ) Capital distributed to non-controlling interest – – (932 ) Proceeds from securitized debt – 191,705 114,716 Payments made and extinguishment of securitized debt (75,796 ) (7,408 ) (184 )
Net cash provided by financing activities 131,265 99,005 1,052,484 Net Increase in Cash and Cash Equivalents 43,800 21 15,191 Cash and Cash Equivalents - Beginning of Period 31,798 31,777 16,586 Cash and Cash Equivalents - End of Period $ 75,598 $ 31,798 $ 31,777 Supplemental Disclosure: Cash paid for interest $ 352,232 $ 268,552 $ 115,656
Cash paid for income taxes $ 8,295 $ 794 $ 1,207 Non-Cash Investment Activities: Purchase of investment securities not yet settled $ 283,537 $ 191,592 $ 245,931
Consolidation of multi-family loans held in securitization trusts $ – $ 3,218,301 $ 5,305,933
Consolidation of multi-family collateralized debt obligations $ – $ 3,146,676 $ 5,195,166 Non-Cash Financing Activities: Dividends declared on common stock to be paid in subsequent period $ 28,376 $ 17,295 $ 13,384
Dividends declared on preferred stock to be paid in subsequent period $ 1,453 $ 1,453 $ –
F-8
NOTES TO CONSOLIDATED FINANCIAL STATEMENTS
December 31, 2014
1. Organization
New York Mortgage Trust, Inc., together with its consolidated subsidiaries (“NYMT,” and the “Company”), is a real estate investment trust, or REIT, in the business of acquiring, investing in, financing and managing primarily mortgage-related assets and financial assets. Our objective is to manage a portfolio of investments that will deliver stable distributions to our stockholders over diverse economic conditions. We intend to achieve this objective through a combination of income generated by net interest margin and net realized capital gains from our investment portfolio. Our portfolio includes investments in primarily mortgage-related and financial assets, including multi-family CMBS, direct financing to owners of multi-family properties through mezzanine loans and preferred equity investments, residential mortgage loans, including loans sourced from distressed markets, Agency RMBS consisting of fixed-rate, adjustable-rate and hybrid adjustable-rate RMBS and Agency IOs consisting of interest only and inverse interest-only RMBS that represent the right to the interest component of the cash flow from a pool of mortgage loans.
The Company conducts its business through the parent company, NYMT, and several subsidiaries, including special purpose subsidiaries
established for residential loan, distressed residential loan, and CMBS securitization purposes, taxable REIT subsidiaries ("TRSs") and qualified REIT subsidiaries ("QRSs"). The Company consolidates all of its subsidiaries under generally accepted accounting principles in the United States of America (“GAAP”).
The Company is organized and conducts its operations to qualify as a REIT for U.S. federal income tax purposes. As such, the Company will generally not be subject to federal income taxes on that portion of its income that is distributed to stockholders if it distributes at least 90% of its REIT taxable income to its stockholders by the due date of its federal income tax return and complies with various other requirements.
2. Summary of Significant Accounting Policies
Definitions – The following defines certain of the commonly used terms in these financial statements: “RMBS” refers to residential
adjustable-rate, hybrid adjustable-rate, fixed-rate, interest only and inverse interest only and principal only mortgage-backed securities; “Agency RMBS” refers to RMBS representing interests in or obligations backed by pools of mortgage loans issued or guaranteed by a federally chartered corporation (“GSE”), such as the Federal National Mortgage Association (“Fannie Mae”) or the Federal Home Loan Mortgage Corporation (“Freddie Mac”), or an agency of the U.S. government, such as the Government National Mortgage Association (“Ginnie Mae”); “non-Agency RMBS” refers to RMBS backed by prime jumbo mortgage loans; “IOs” refers collectively to interest only and inverse interest only mortgage-backed securities that represent the right to the interest component of the cash flow from a pool of mortgage loans; government; “POs” refers to mortgage-backed securities that represent the right to the principal component of the cash flow from a pool of mortgage loans; “Agency IOs” refers to an IO that represents the right to the interest component of the cash flows from a pool of residential mortgage loans issued or guaranteed by a GSE or an agency of the U.S. government; “ARMs” refers to adjustable-rate residential mortgage loans; “Prime ARM loans” and “residential securitized loans” each refer to prime credit quality residential ARM loans (“prime ARM loans”) held in securitization trusts; “Agency ARMs” refers to Agency RMBS comprised of adjustable-rate and hybrid adjustable-rate RMBS; “CMBS” refers to commercial mortgage-backed securities comprised of commercial mortgage pass-through securities, as well as IO or PO securities that represent the right to a specific component of the cash flow from a pool of commercial mortgage loans; “multi-family CMBS” refers to CMBS backed by commercial mortgage loans on multi-family properties; “CDOs” refers to collateralized debt obligations; and “CLO” refers to collateralized loan obligations.
Basis of Presentation – The accompanying consolidated financial statements have been prepared on the accrual basis of accounting in
accordance with GAAP. The preparation of financial statements in conformity with GAAP requires management to make estimates and assumptions that affect the reported amounts of assets and liabilities and disclosure of contingent assets and liabilities at the date of the financial statements and the reported amounts of revenues and expenses during the reporting period. Although the Company’s estimates contemplate current conditions and how it expects them to change in the future, it is reasonably possible that actual conditions could be different than anticipated in those estimates, which could materially impact the Company’s results of operations and its financial condition. Management has made significant estimates in several areas, including valuation of its CMBS investments, multi-family loans held in securitization trusts and multi-family CDOs, as well as income recognition on distressed residential mortgage loans purchased at a discount.
Reclassifications – Certain prior period amounts have been reclassified in the consolidated financial statements to conform to current
period presentation.
F-9
Principles of Consolidation and Variable Interest Entities – The accompanying consolidated financial statements of the Company include
the accounts of all its subsidiaries which are majority-owned, controlled by the Company or a variable interest entity (“VIE”) where the Company is the primary beneficiary. All significant intercompany accounts and transactions have been eliminated in consolidation.
A VIE is an entity that lacks one or more of the characteristics of a voting interest entity. A VIE is defined as an entity in which equity investors do not have the characteristics of a controlling financial interest or do not have sufficient equity at risk for the entity to finance its activities without additional subordinated financial support from other parties. The Company consolidates a VIE when it is the primary beneficiary of such VIE. As primary beneficiary, it has both the power to direct the activities that most significantly impact the economic performance of the VIE and a right to receive benefits or absorb losses of the entity that could be potentially significant to the VIE. The Company is required to reconsider its evaluation of whether to consolidate a VIE each reporting period, based upon changes in the facts and circumstances pertaining to the VIE.
Investment Securities Available for Sale – The Company's investment securities, where the fair value option has not been elected and which
are reported at fair value, with unrealized gains and losses reported in Other Comprehensive Income (“OCI”), include Agency RMBS, non-Agency RMBS and CLOs. Our investment securities are classified as available for sale securities. Realized gains and losses recorded on the sale of investment securities available for sale are based on the specific identification method and included in realized gain (loss) on investment securities and related hedges in the accompanying consolidated statements of operations. Purchase premiums or discounts on investment securities are amortized or accreted to interest income over the estimated life of the investment securities using the effective yield method. Adjustments to amortization are made for actual prepayment activity.
The Company accounts for debt securities that are of high credit quality (generally those rated AA or better by a Nationally Recognized
Statistical Rating Organization, or NRSRO) at date of acquisition in accordance with Accounting Standards Codification (“ASC”) 320-10. The Company accounts for debt securities that are not of high credit quality (i.e., those whose risk of loss is less than remote) or securities that can be contractually prepaid such that we would not recover our initial investment at the date of acquisition in accordance with ASC 325-40. The Company considers credit ratings, the underlying credit risk and other market factors in determining whether the debt securities are of high credit quality; however, securities rated lower than AA or an equivalent rating are not considered of high credit quality and are accounted for in accordance with ASC 325-40. If ratings are inconsistent among NRSROs, the Company uses the lower rating in determining whether the securities are of high credit quality.
The Company assesses its impaired securities on at least a quarterly basis and designates such impairments as either “temporary” or “other-
than-temporary” by applying the guidance prescribed in ASC Topic 320-10. When the fair value of an investment security is less than its amortized cost as of the reporting balance sheet date, the security is considered impaired. If the Company intends to sell an impaired security, or it is more likely than not that it will be required to sell the impaired security before its anticipated recovery, then it must recognize an other-than-temporary impairment through earnings equal to the entire difference between the investment’s amortized cost and its fair value as of the balance sheet date. If the Company does not expect to sell an other-than-temporarily impaired security, only the portion of the other-than-temporary impairment related to credit losses is recognized through earnings with the remainder recognized as a component of other comprehensive income (loss) on the accompanying consolidated balance sheets. Impairments recognized through other comprehensive income (loss) do not impact earnings. Following the recognition of an other-than-temporary impairment through earnings, a new cost basis is established for the security, which may not be adjusted for subsequent recoveries in fair value through earnings. However, other-than-temporary impairments recognized through earnings may be accreted back to the amortized cost basis of the security on a prospective basis through interest income. The determination as to whether an other-than-temporary impairment exists and, if so, the amount considered other-than-temporarily impaired is subjective, as such determinations are based on both factual and subjective information available at the time of assessment. As a result, the timing and amount of other-than-temporary impairments constitute material estimates that are susceptible to significant change.
The Company’s investment securities classified as available for sale also include its investment in a wholly owned account referred to as the Agency IO portfolio. These investments primarily include Agency IOs. The Company has elected the fair value option for these investment securities, which measures unrealized gains and losses through earnings in the accompanying consolidated statements of operations, as the Company believes this accounting treatment more accurately and consistently reflects its results of operations. The Agency IO portfolio also includes derivative investments not designated as hedging instruments for accounting purposes, with unrealized gains and losses recognized through earnings in the accompanying consolidated statements of operations.
F-10

Investment Securities Available for Sale Held in Securitization Trusts – The Company’s investment securities available for sale held in
securitization trusts as of December 31, 2014 are comprised of multi-family CMBS consisting of PO securities that represent the first loss tranche of the securitizations from which they were issued, or “first loss tranche”, and certain IOs issued from two Freddie Mac-sponsored multi-family K-Series securitizations. As of December 31, 2013, this account was comprised of multi-family CMBS consisting of PO securities, a first loss tranche floating rate security and IO securities issued from four Freddie Mac-sponsored multi-family K-series securitizations. These securities are reported at fair value with unrealized gains and losses reported in OCI. Realized gains and losses recorded on the sale of investment securities available for sale held in securitization trusts are based on the specific identification method and included in realized gain (loss) on sale of securities and related hedges in the accompanying consolidated statements of operations. Purchase premiums or discounts are amortized or accreted to interest income over the estimated life of the investment securities using the effective yield method.
Residential Mortgage Loans Held in Securitization Trusts – Residential mortgage loans held in securitization trusts are comprised of
certain ARM loans transferred to Consolidated VIEs that have been securitized into sequentially rated classes of beneficial interests. The Company accounted for these securitization trusts as financings which are consolidated into the Company’s financial statements. Residential mortgage loans held in securitization trusts are carried at their unpaid principal balances, net of unamortized premium or discount, unamortized loan origination costs and allowance for loan losses. Interest income is accrued and recognized as revenue when earned according to the terms of the mortgage loans and when, in the opinion of management, it is collectible. The accrual of interest on loans is discontinued when, in management’s opinion, the interest is not collectible in the normal course of business, but in no case when payment becomes greater than 90 days delinquent. Loans return to accrual status when principal and interest become current and are anticipated to be fully collectible.
We establish an allowance for loan losses based on management's judgment and estimate of credit losses inherent in our portfolio of
residential mortgage loans held in securitization trusts. Estimation involves the consideration of various credit-related factors, including but not limited to, macro-economic conditions, current housing market conditions, loan-to-value ratios, delinquency status, historical credit loss severity rates, purchased mortgage insurance, the borrower's current economic condition and other factors deemed to warrant consideration. Additionally, we look at the balance of any delinquent loan and compare that to the current value of the collateralizing property. We utilize various home valuation methodologies including appraisals, broker pricing opinions, internet-based property data services to review comparable properties in the same area or consult with a realtor in the property's area.
Acquired Distressed Residential Mortgage Loans – Distressed residential mortgage loans are comprised of pools of fixed and adjustable
rate residential mortgage loans acquired by the Company at a discount (that is due, in part, to credit quality of the borrower). Distressed residential mortgage loans held in securitization trusts are distressed residential mortgage loans transferred to Consolidated VIEs that have been securitized into beneficial interests. The Company accounted for these securitization trusts as financings which are consolidated into the Company’s financial statements.
The Company considers the purchase price for the acquired distressed residential mortgage loans to be at fair value at the date of
acquisition. These acquired distressed residential mortgage loans were initially recorded at fair value with no allowance for loan losses. Acquired distressed residential mortgage loans that have evidence of deteriorated credit quality at acquisition are accounted for under ASC
Subtopic 310-30, "Loans and Debt Securities Acquired with Deteriorated Credit Quality" ("ASC 310-30"). Under ASC 310-30, the acquired loans may be aggregated and accounted for as a pool of loans if the loans being aggregated have common risk characteristics. A pool is accounted for as a single asset with a single composite interest rate and an aggregate expectation of cash flows. Once a pool is assembled, it is treated as if it was one loan for purposes of applying the accounting guidance.
Under ASC 310-30, the excess of cash flows expected to be collected over the carrying amount of the loans, referred to as the “accretable
yield,” is accreted into interest income over the life of the loans in each pool or individually using a level yield methodology. Accordingly, our acquired distressed residential mortgage loans accounted for under ASC 310-30 are not subject to classification as nonaccrual classification in the same manner as our residential mortgage loans that were not distressed when acquired by us. Rather, interest income on acquired distressed residential mortgage loans relates to the accretable yield recognized at the pool level or on an individual loan basis, and not to contractual interest payments received at the loan level. The difference between contractually required principal and interest payments and the cash flows expected to be collected, referred to as the “nonaccretable difference,” includes estimates of both the impact of prepayments and expected credit losses over the life of the individual loan, or the pool (for loans grouped into a pool).
F-11
The Company monitors actual cash collections against its expectations, and revised cash flow expectations are prepared as necessary. A
decrease in expected cash flows in subsequent periods may indicate that the loan pool or individual loan, as applicable, is impaired, thus requiring the establishment of an allowance for loan losses by a charge to the provision for loan losses. An increase in expected cash flows in subsequent periods initially reduces any previously established allowance for loan losses by the increase in the present value of cash flows expected to be collected, and results in a recalculation of the amount of accretable yield for the loan pool. The adjustment of accretable yield due to a significant increase in expected cash flows is accounted for prospectively as a change in estimate. The additional cash flows expected to be collected are reclassified from the nonaccretable difference to the accretable yield, and the amount of periodic accretion is adjusted accordingly over the remaining life of the loans in the pool or individual loan, as applicable.
An acquired distressed residential mortgage loan may be resolved either through receipt of payment (in full or in part) from the borrower, the sale of the loan to a third party, or foreclosure of the collateral. For acquired distressed residential mortgage loans held in pools, in the event of a sale of the loan, a gain or loss on sale is recognized and reported based on the difference between the sales proceeds and the carrying amount of the acquired distressed residential mortgage loan. In the case of a foreclosure, an individual loan is removed from the pool at the fair value of the underlying collateral less costs to sell. For loans satisfied by payment in full, the loan is removed from the pool. The Company uses the specific allocation method for the removal of loans as the estimated cash flows and related carrying amount for each individual loan are known. In these cases, the remaining accretable yield is unaffected and any material change in remaining effective yield caused by the removal of the loan from the pool is addressed by the re-assessment of the estimate of cash flows for the pool prospectively. Acquired distressed residential mortgage loans subject to modification are not removed from the pool even if those loans would otherwise be considered troubled debt restructurings because the pool, and not the individual loan, represents the unit of account.
For individual loans not accounted for in pools that are sold or satisfied by payment in full, a gain or loss on sale is recognized and reported based on the difference between the sales proceeds and the carrying amount of the acquired distressed residential mortgage loan. In the case of a foreclosure, the loss is recognized if the carrying value exceeds the fair value of the collateral (less costs to sell). A gain is not recognized if the fair value of collateral (less costs to sell) exceeds the carrying value.
Multi-Family Loans Held in Securitization Trusts – Multi-family loans held in securitization trusts are comprised of multi-family mortgage loans held in six Freddie Mac-sponsored multi-family K-Series securitizations (the “Consolidated K-Series”) as of December 31, 2014 and December 31, 2013. Based on a number of factors, we determined that we were the primary beneficiary of each VIE within the Consolidated K-Series, met the criteria for consolidation and, accordingly, have consolidated these Freddie Mac-sponsored multi-family K-Series securitizations, including their assets, liabilities, income and expenses in our financial statements. The Company has elected the fair value option on each of the assets and liabilities held within the Consolidated K-Series, which requires that changes in valuations in the assets and liabilities of the Consolidated K-Series be reflected in the Company's accompanying consolidated statement of operations, as the Company believes this accounting treatment more accurately and consistently reflects its results of operations.
Interest income is accrued and recognized as revenue when earned according to the terms of the mortgage loans and when, in the opinion of
management, it is collectible. The accrual of interest on loans is discontinued when, in management’s opinion, the interest is not collectible in the normal course of business, but in no case when payment becomes greater than 90 days delinquent. Loans return to accrual status when principal and interest become current and are anticipated to be fully collectible.
Mezzanine Loan and Preferred Equity Investments - The Company invests in mezzanine loans and preferred equity of entities that have significant real estate assets. The mezzanine loan is secured by a pledge of the borrower’s equity ownership in the property. Unlike a mortgage, this loan does not represent a lien on the property. Therefore, it is always junior and subordinate to any first-lien as well as second liens, if applicable, on the property. These loans are senior to any preferred equity or common equity interests. Purchasers of mezzanine loans benefit from a right to foreclose on the ownership equity in a more efficient manner than senior mortgage debt.
A preferred equity investment is an equity investment in an entity that owns the underlying property. Preferred equity is not secured by the
underlying property, but holders have priority relative to common equity holders on cash flow distributions and proceeds from capital events. In addition, preferred equity holders may be able to enhance their position and protect their equity position with covenants that limit the entity’s activities and grant the holder the exclusive right to control the property after an event of default.
F-12
Mezzanine loans and preferred equity investments, where the risks and payment characteristics are equivalent to mezzanine loans, are
accounted for as loans held for investment and are stated at unpaid principal balance, adjusted for any unamortized premium or discount, deferred fees or expenses, net of valuation allowances, and are included in receivables and other assets. We accrete or amortize any discounts or premiums over the life of the related loan receivable utilizing the effective interest method or straight line-method, if the result is not materially different. We evaluate the collectability of both interest and principal of each of our loans, if circumstances warrant, to determine whether they are impaired. A loan is impaired when, based on current information and events, it is probable that we will be unable to collect all amounts due according to the existing contractual terms. When a loan is impaired, the amount of the loss accrual is calculated by comparing the carrying amount of the investment to the estimated fair value of the loan or, as a practical expedient, to the value of the collateral if the loan is collateral dependent.
Mezzanine loans and preferred equity investments where the risks and payment characteristics are equivalent to an equity investment are accounted for using the equity method of accounting. See “ Investment in Limited Partnership and Limited Liability Companies ” for a description of our accounting policy for Investments in Limited Partnerships and Limited Liability Companies. The preferred equity investments are included in receivables and other assets.
Mortgage Loans Held for Investment – Mortgage loans held for investment are stated at unpaid principal balance, adjusted for any unamortized premium or discount, deferred fees or expenses, net of valuation allowances, and are included in receivables and other assets. Interest income is accrued on the principal amount of the loan based on the loan’s contractual interest rate. Amortization of premiums and discounts is recorded using the effective yield method. Interest income, amortization of premiums and discounts and prepayment fees are reported in interest income. A loan is considered to be impaired when it is probable that based upon current information and events, the Company will be unable to collect all amounts due under the contractual terms of the loan agreement. Based on the facts and circumstances of the individual loans being impaired, loan specific valuation allowances are established for the excess carrying value of the loan over either: (i) the present value of expected future cash flows discounted at the loan’s original effective interest rate, (ii) the estimated fair value of the loan’s underlying collateral if the loan is in the process of foreclosure or otherwise collateral dependent, or (iii) the loan’s observable market price.
Investments in Limited Partnership and Limited Liability Companies – In circumstances where the Company has a non-controlling interest
but either owns a significant interest or is able to exert influence over the affairs of the enterprise, the Company utilizes the equity method of accounting. Under the equity method of accounting, the initial investment is increased each period for additional capital contributions and a proportionate share of the entity’s earnings or preferred return and decreased for cash distributions and a proportionate share of the entity’s losses. Where the Company is not required to fund additional losses, the Company does not continue to record its proportionate share of the entity’s losses such that its investment balance would go below zero.
Management periodically reviews its investments for impairment based on projected cash flows from the entity over the holding period. When any impairment is identified, the investments are written down to recoverable amounts.
Cash and Cash Equivalents – Cash and cash equivalents include cash on hand, amounts due from banks and overnight deposits, all of which have original maturities of 90 days or less. The Company maintains its cash and cash equivalents in highly rated financial institutions, and at times these balances exceed insurable amounts.
Receivables and Other Assets – Receivables and other assets as of December 31, 2014 and 2013 include restricted cash held by third parties
of $54.2 million and $44.1 million, respectively. Included in restricted cash is $40.6 million and $30.4 million held in our Agency IO portfolio to be used for trading purposes and $11.4 million and $10.2 million held by counterparties as collateral for hedging instruments as of December 31, 2014 and 2013, respectively. Interest receivable on multi-family loans held in securitization trusts is also included in receivables and other assets in the amounts of $29.8 million and $30.2 million as of December 31, 2014 and 2013, respectively.
Financing Arrangements, Portfolio Investments – The Company finances the majority of its Agency RMBS purchases using repurchase
agreements. Under a repurchase agreement, an asset is sold to a counterparty to be repurchased at a future date at a predetermined price, which represents the original sales price plus interest. The Company accounts for these repurchase agreements as financings under ASC 860, Transfers and Servicing . Under ASC 860, for these transactions to be treated as financings, they must be separate transactions and not linked. If the Company finances the purchase of its securities with repurchase agreements with the same counterparty from which the securities are purchased and both transactions are entered into contemporaneously or in contemplation of each other, the transactions are presumed under GAAP to be part of the same arrangement, or a "Linked Transaction," unless certain criteria are met. None of the Company’s repurchase agreements are accounted for as linked transactions because they met the applicable criteria in accordance with ASC 860-10-40.
Financing Arrangements, Distressed Residential Mortgage Loans – The Company finances a portion of its distressed residential mortgage
loans through a repurchase agreement, expiring within one year. The borrowing under the repurchase agreement bears an interest rate of a specified margin over one-month LIBOR. The repurchase agreement is treated as a collateralized financing transaction and is carried at the contractual amounts, as specified in the respective agreement. Costs related to the establishment of the repurchase agreement which include underwriting, legal, accounting and other fees are reflected as deferred charges. Such costs are included on the Company’s accompanying consolidated balance sheets in receivables and other assets in the amount of $1.7 million as of December 31, 2014. These deferred charges are amortized as an adjustment to interest expense using the effective interest method, or straight line-method, if the result is not materially different.

F-13
Residential Collateralized Debt Obligations (“Residential CDOs”) – We use Residential CDOs to permanently finance our residential
mortgage loans held in securitization trusts. For financial reporting purposes, the ARM loans held as collateral are recorded as assets of the Company and the Residential CDOs are recorded as the Company’s debt. The Company completed four securitizations in 2005 and 2006. The first three were accounted for as a permanent financing while the fourth was accounted for as a sale and accordingly, is not included in the Company’s accompanying consolidated financial statements
M ulti- Family Collateralized Debt Obligations (“Multi-Family CDOs”) – We consolidated the Consolidated K-Series including their debt,
referred to as Multi-Family CDOs, in our financial statements. The Multi-Family CDOs permanently finance the multi-family mortgage loans held in the Consolidated K-Series securitizations. For financial reporting purposes, the loans held as collateral are recorded as assets of the Company and the Multi-Family CDOs are recorded as the Company’s debt. We refer to both the Residential CDOs and Multi-Family CDOs as CDOs in this report.
Securitized Debt –Securitized Debt represents third-party liabilities of Financing VIEs and excludes liabilities of the VIEs acquired by the
Company that are eliminated on consolidation. The Company has entered into several financing transactions that resulted in the Company consolidating as VIEs the special purpose entities (the “SPEs”) that were created to facilitate the transactions and to which underlying assets in connection with the financing were transferred. The Company engaged in these transactions primarily to obtain permanent or longer term financing on a portion of its multi-family CMBS and acquired distressed residential mortgage loans.
Costs related to issuance of securitized debt which include underwriting, rating agency, legal, accounting and other fees are reflected as
deferred charges. Such costs are included on the Company’s accompanying consolidated balance sheets in receivables and other assets in the amount of $2.2 million and $4.1 million as of December 31, 2014 and December 31, 2013, respectively. These deferred charges are amortized as an adjustment to interest expense using the effective interest method, or straight line-method, if the result is not materially different.
The Company has multi-family CMBS investments issued by Freddie Mac-sponsored K-Series securitization trusts. Based on evaluation of
ASC 810, six of these K-Series securitization trusts required consolidation in the accompanying consolidated financial statements. The multi-family CMBS investments issued by four K-Series securitization trusts serve as collateral for certain Securitized Debt issued by the Company. The multi-family CMBS investments issued by two K-Series securitization trusts are not pledged or collateral for any financing as of December 31, 2014 (see Note 7) .
Derivative Financial Instruments – The Company has developed risk management programs and processes, which include investments in
derivative financial instruments designed to manage interest rate and prepayment risk associated with its securities investment activities. Derivative instruments contain an element of risk in the event that the counterparties may be unable to meet the terms of such agreements.
The Company minimizes its risk exposure by limiting the counterparties with which it enters into contracts to banks and investment banks who meet established credit and capital guidelines.
The Company invests in To-Be-Announced securities (“TBAs”) through its Agency IO portfolio. TBAs are forward-settling purchases and sales of Agency RMBS where the underlying pools of mortgage loans are “To-Be-Announced.” Pursuant to these TBA transactions, we agree to purchase or sell, for future settlement, Agency RMBS with certain principal and interest terms and certain types of underlying collateral, but the particular Agency RMBS to be delivered is not identified until shortly before the TBA settlement date. For TBA contracts that we have entered into, we have not asserted that physical settlement is probable, therefore we have not designated these forward commitments as hedging instruments. Realized and unrealized gains and losses associated with these TBAs are recognized through earnings as part of the other income (expense) category in the consolidated statements of operations.
For derivative instruments that are designated and qualify as a cash flow hedge, the effective portion of the gain or loss on the derivative
instrument is reported as a component of OCI and reclassified into earnings in the same period or periods during which the hedged transaction affects earnings. The remaining gain or loss on the derivative instruments in excess of the cumulative change in the present value of future cash flows of the hedged item, if any, is recognized in current earnings during the period of change.
For instruments that are not designated or qualify as a cash flow hedge, such as our use of U.S. Treasury securities or financial futures,
options on financial futures contracts and interest rate swaps in our Agency IO portfolio, any realized and unrealized gains and losses associated with these instruments are recognized through earnings as other income (expense) in the consolidated statements of operations.
Termination of Hedging Relationships – The Company employs risk management monitoring procedures to ensure that the designated hedging relationships are demonstrating, and are expected to continue to demonstrate, a high level of effectiveness. Hedge accounting is discontinued on a prospective basis if it is determined that the hedging relationship is no longer highly effective or expected to be highly effective in offsetting changes in fair value of the hedged item.
F-14
Additionally, the Company may elect to un-designate a hedge relationship during an interim period and re-designate upon the rebalancing
of a hedge profile and the corresponding hedge relationship. When hedge accounting is discontinued, the Company continues to carry the derivative instruments at fair value with changes recorded in earnings.
Revenue Recognition – Interest income on our investment securities and on our residential mortgage loans held in securitization trusts is
accrued based on the outstanding principal balance and their contractual terms. Premiums and discounts associated with investment securities and mortgage loans at the time of purchase or origination are amortized into interest income over the life of such securities using the effective yield method. Adjustments to amortization are made for actual prepayment activity.
Interest income on our credit sensitive securities, such as our CLOs and certain of our CMBS that were purchased at a discount to par value,
is recognized based on the security’s effective interest rate. The effective interest rate on these securities is based on management’s estimate from each security of the projected cash flows, which are estimated based on the Company’s assumptions related to fluctuations in interest rates, prepayment speeds and the timing and amount of credit losses. On at least a quarterly basis, the Company reviews and, if appropriate, makes adjustments to its cash flow projections based on input and analysis received from external sources, internal models, and its judgment about interest rates, prepayment rates, the timing and amount of credit losses, and other factors. Changes in cash flows from those originally projected, or from those estimated at the last evaluation, may result in a prospective change in the yield/interest income recognized on these securities.
Based on the projected cash flows from the Company’s first loss tranche PO multi-family CMBS purchased at a discount to par value, a
portion of the purchase discount is designated as non-accretable purchase discount or credit reserve, which partially mitigates the Company’s risk of loss on the mortgages collateralizing such multi-family CMBS, and is not expected to be accreted into interest income. The amount designated as a credit reserve may be adjusted over time, based on the actual performance of the security, its underlying collateral, actual and projected cash flow from such collateral, economic conditions and other factors. If the performance of a security with a credit reserve is more favorable than forecasted, a portion of the amount designated as credit reserve may be accreted into interest income over time. Conversely, if the performance of a security with a credit reserve is less favorable than forecasted, the amount designated as credit reserve may be increased, or impairment charges and write-downs of such securities to a new cost basis could result.
With respect to interest rate swaps that have not been designated as hedges, any net payments under, or fluctuations in the fair value of, such swaps will be recognized in earnings.
See “Acquired Distressed Residential Mortgage Loans” for a description of our revenue recognition policy for acquired distressed residential mortgage loans.
Other Comprehensive Income (Loss) – The Company’s comprehensive income/(loss) available to common stockholders includes net income, the change in net unrealized gains/(losses) on its available for sale securities and its derivative hedging instruments, currently comprised of interest rate swaps, (to the extent that such changes are not recorded in earnings), adjusted by realized net gains/(losses) reclassified out of accumulated other comprehensive income/(loss) for available for sale securities and is reduced by dividends declared on the Company’s preferred stock.
Employee Benefits Plans – The Company sponsors a defined contribution plan (the “Plan”) for all eligible domestic employees. The Plan qualifies as a deferred salary arrangement under Section 401(k) of the Internal Revenue Code of 1986, as amended (the “Internal Revenue Code”). The Company made no contributions to the Plan for the years ended December 31, 2014 and 2013.
Stock Based Compensation – Compensation expense for equity based awards and stock issued for services are recognized over the vesting
period of such awards and services based upon the fair value of the stock at the grant date. Income Taxes – The Company operates in such a manner so as to qualify as a REIT under the requirements of the Internal Revenue Code.
Requirements for qualification as a REIT include various restrictions on ownership of the Company’s stock, requirements concerning distribution of taxable income and certain restrictions on the nature of assets and sources of income. A REIT must distribute at least 90% of its taxable income to its stockholders, of which 85% plus any undistributed amounts from the prior year must be distributed within the taxable year in order to avoid the imposition of an excise tax. Distribution of the remaining balance may extend until timely filing of the Company’s tax return in the subsequent taxable year. Qualifying distributions of taxable income are deductible by a REIT in computing taxable income.
F-15
Certain activities of the Company are conducted through TRSs and therefore are subject to federal and various state and local income taxes.
Accordingly, deferred tax assets and liabilities are recognized for the future tax consequences attributable to differences between the financial statement carrying amounts of existing assets and liabilities and their respective tax bases. Deferred tax assets and liabilities are measured using enacted tax rates expected to apply to taxable income in the years in which those temporary differences are expected to be recovered or settled. The effect on deferred tax assets and liabilities of a change in tax rates is recognized in income in the period that includes the enactment date.
ASC 740, Income Taxes , provides guidance for how uncertain tax positions should be recognized, measured, presented, and disclosed in
the financial statements. ASC 740 requires the evaluation of tax positions taken or expected to be taken in the course of preparing the Company’s tax returns to determine whether the tax positions are “more-likely-than-not” of being sustained by the applicable tax authority. In situations involving uncertain tax positions related to income tax matters, we do not recognize benefits unless it is more likely than not that they will be sustained. ASC 740 was applied to all open taxable years as of the effective date. Management’s determinations regarding ASC 740 may be subject to review and adjustment at a later date based on factors including, but not limited to, an ongoing analysis of tax laws, regulations and interpretations thereof. The Company will recognize interest and penalties, if any, related to uncertain tax positions as income tax expense.
Earnings Per Share – Basic earnings per share excludes dilution and is computed by dividing net income available to common stockholders
by the weighted-average number of shares of common stock outstanding for the period. Diluted earnings per share reflects the potential dilution that could occur if securities or other contracts to issue common stock were exercised or converted into common stock or resulted in the issuance of common stock that then shared in the earnings of the Company.
Segment Reporting – ASC 280, Segment Reporting, is the authoritative guidance for the way public entities report information about
operating segments in their annual financial statements. We are a REIT focused on the business of acquiring, investing in, financing and managing primarily mortgage-related assets, and financial assets, and currently operate in only one reportable segment. Summary of Recent Accounting Pronouncements Liabilities (ASC 405)
In April 2013, the FASB issued Accounting Standards Update ("ASU") 2013-04, Liabilities (Topic 405)—Obligations Resulting from Joint and Several Liability Arrangements for Which the Total Amount of the Obligation Is Fixed at the Reporting Date ("ASU 2013-04"), which provides guidance for the recognition, measurement, and disclosure of obligations resulting from joint and several liability arrangements for which the total amount of the obligation is fixed at the reporting date. ASU 2013-04 became effective for the Company beginning January 1, 2014. The adoption of ASU 2013-04 did not have an effect on the Company's consolidated financial statements.
Income taxes (ASC 740)
In November 2013, the FASB issued ASU No. 2013-11, Income Taxes (Topic 740)—Presentation of an Unrecognized Tax Benefit When a Net Operating Loss Carryforward, a Similar Tax Loss, or a Tax Credit Carryforward Exists (“ASU 2013-11”). ASU No. 2013-11 provide that an unrecognized tax benefit, or a portion thereof, should be presented in the financial statements as a reduction to a deferred tax asset for a net operating loss carryforward, a similar tax loss, or a tax credit carryforward, except to the extent that a net operating loss carryforward, a similar tax loss, or a tax credit carryforward is not available at the reporting date to settle any additional income taxes that would result from disallowance of a tax position, or the tax law does not require the entity to use, and the entity does not intend to use, the deferred tax asset for such purpose, then the unrecognized tax benefit should be presented as a liability. ASU 2013-11 became effective for the Company beginning January 1, 2014. The adoption of ASU 2013-11 did not have an impact on the Company's consolidated financial statements. Receivables (ASC 310)
In April 2014, the FASB issued ASU 2014-04, Receivables—Troubled Debt Restructurings by Creditors (Subtopic 310-40)—
Reclassification of Residential Real Estate Collateralized Consumer Mortgage Loans upon Foreclosure (“ASU 2014-04”). The amendments of this ASU are intended to clarify when a creditor should be considered to have received physical possession of residential real estate property collateralizing a consumer mortgage loan such that the loan should be derecognized and the real estate recognized. In addition, the amendments clarify that an in substance repossession or foreclosure occurs, and a creditor is considered to have received physical possession of residential real estate property collateralizing a consumer mortgage loan, upon either: (1) the creditor obtaining legal title to the residential real estate property upon completion of a foreclosure, or (2) the borrower conveying all interest in the residential real estate property to the creditor to satisfy that loan through completion of a deed in lieu of foreclosure or through a similar legal agreement. ASU 2014-04 is effective for fiscal years, and interim periods within those years, beginning after December 15, 2014. We do not expect the adoption of ASU 2014-04 to have a significant effect on our financial condition, results of operations and disclosures.
F-16
Transfers and Servicing (ASC 860)
In June 2014, the FASB issued ASU 2014-11, Transfers and Servicing: Repurchase-to-Maturity Transaction, Repurchase Financings, and Disclosures (“ASU 2014-09”). This guidance requires repurchase-to-maturity transactions to be accounted for as secured borrowings as if the transferor retains effective control, even though the transferred financial assets are not returned to the transferor at settlement. ASU 2014-09 also eliminates existing guidance for repurchase financings and requires instead that entities consider the initial transfer and the related repurchase agreement separately when applying the derecognition requirements of ASC 860, Transfers and Servicing. New disclosures will be required for (1) certain transactions accounted for as secured borrowings and (2) transfers accounted for as sales when the transferor also retains substantially all of the exposure to the economic return on the transferred financial assets throughout the term of the transaction. This guidance will take effect for periods beginning after December 15, 2014, and early adoption is prohibited. Certain disclosures under this guidance do not take effect until the first period beginning after March 15, 2015. We do not expect the adoption of ASU 2014-11 to have a significant effect on our financial condition, results of operations and disclosures. Revenue Recognition (Topic 606)
In May 2014, the FASB issued ASU 2014-09, Revenue from Contracts with Customers (“ASU 2014-09”). This guidance creates a new,
principle-based revenue recognition framework that will affect nearly every revenue-generating entity. ASU 2014-09 also creates a new topic in the Codification, Topic 606 (“ASC 606”). In addition to superseding and replacing nearly all existing U.S. GAAP revenue recognition guidance, including industry-specific guidance, ASC 606 does the following: (1) establishes a new control-based revenue recognition model; (2) changes the basis for deciding when revenue is recognized over time or at a point in time; (3) provides new and more detailed guidance on specific aspects of revenue recognition; and (4) expands and improves disclosures about revenue. ASC 606 is effective for public business entities for annual reporting periods beginning after December 15, 2016, including interim periods therein. Early application is not permitted for public business entities. The Company is currently assessing the impact of this guidance. Consolidation (Topic 810)
In August 2014, the FASB issued ASU 2014-13, Measuring the Financial Assets and the Financial Liabilities of a Consolidated Collateralized Financing Entity (“ASU 2014-13”). For entities that consolidate a collateralized financing entity within the scope of this update, an option to elect to measure the financial assets and the financial liabilities of that collateralized financing entity using either the measurement alternative included in this Update or Topic 820 on fair value measurement is provided. The guidance is effective for fiscal years beginning after December 15, 2015, and the interim periods within those fiscal years. Early adoption is permitted as of the beginning of an annual period. The Company is currently assessing the impact of this guidance.
F-17

Investment securities available for sale consist of the following as of December 31, 2014 and December 31, 2013 (dollar amounts in
thousands):
Included in investment securities available for sale as of December 31, 2014 and 2013 are Agency IOs. Agency IOs are measured at fair value
through earnings.
During the year ended December 31, 2014, the Company received total proceeds of approximately $93.6 million, realizing approximately $39.1 million of net gains, from the sale of investment securities available for sale. During the year ended December 31, 2013, the Company received total proceeds of approximately $1.3 million, realizing approximately $0.1 million of net gains, from the sale of investment securities available for sale. During the year ended December 31, 2012, the Company received total proceeds of approximately $50.6 million, realizing approximately $0.5 million of net gains, from the sale of investment securities available for sale.
Actual maturities of our available for sale securities are generally shorter than stated contractual maturities (which range up to 30 years), as
they are affected by the contractual lives of the underlying mortgages, periodic payments and prepayments of principal. As of December 31, 2014 and 2013, based on management’s estimates using three month historical CPR, the weighted average life of the Company’s available for sale securities portfolio was approximately 4.95 years and 7.03 years, respectively.
3. Investment Securities Available For Sale
December 31, 201 4 December 31, 201 3
Amortized Unrealized Fair Amortized Unrealized Fair Cost Gains Losses Value Cost Gains Losses Value Agency RMBS:
Agency ARMs Freddie Mac $ 57,597 $ 55 $ (488 ) $ 57,164 $ 67,121 $ 37 $ (2,101 ) $ 65,057 Fannie Mae 113,192 81 (1,037 ) 112,236 130,487 58 (3,128 ) 127,417 Ginnie Mae 12,552 — (259 ) 12,293 17,049 — (201 ) 16,848
Total Agency ARMs 183,341 136 (1,784 ) 181,693 214,657 95 (5,430 ) 209,322
Agency Fixed Rate Freddie Mac 37,800 — (629 ) 37,171 43,920 — (1,714 ) 42,206 Fannie Mae 451,694 — (10,184 ) 441,510 518,598 — (24,861 ) 493,737
Total Agency Fixed Rate 489,494 — (10,813 ) 478,681 562,518 — (26,575 ) 535,943
Agency IOs Freddie Mac 38,844 273 (5,779 ) 33,338 43,468 252 (5,187 ) 38,533 Fannie Mae 53,666 741 (6,388 ) 48,019 60,813 1,300 (5,007 ) 57,106 Ginnie Mae 42,991 310 (5,527 ) 37,774 37,660 706 (2,396 ) 35,970
Total Agency IOs 135,501 1,324 (17,694 ) 119,131 141,941 2,258 (12,590 ) 131,609 Total Agency RMBS 808,336 1,460 (30,291 ) 779,505 919,116 2,353 (44,595 ) 876,874 Non-Agency RMBS 2,061 69 (191 ) 1,939 2,413 136 (188 ) 2,361 CLOs 26,140 9,063 — 35,203 18,478 14,730 — 33,208 Total investment securities
available for sale $ 836,537 $ 10,592 $ (30,482 ) $ 816,647 $ 940,007 $ 17,219 $ (44,783 ) $ 912,443 CMBS $ 26,193 $ 12,401 $ — $ 38,594 $ 74,314 $ 18,264 $ — $ 92,578 Total investment securities
available for sale held in securitization trusts $ 26,193 $ 12,401 $ — $ 38,954 $ 74,314 $ 18,264 $ — $ 92,578
F-18
(1)
(1)
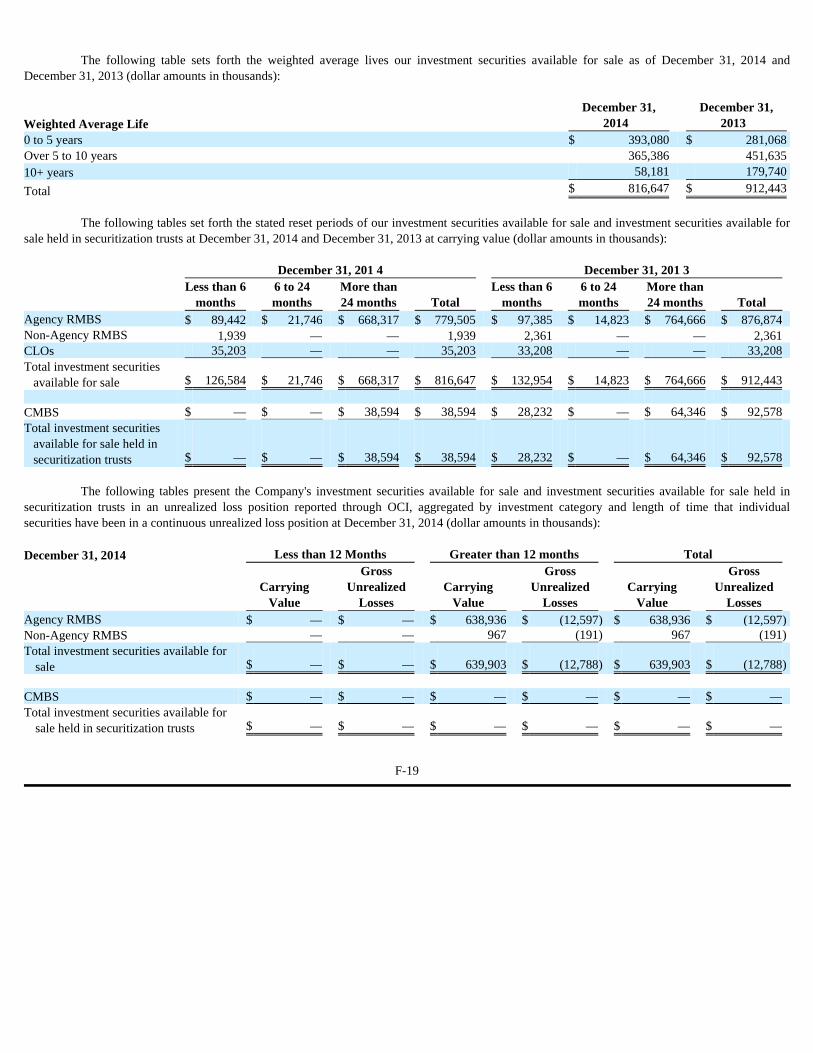
The following table sets forth the weighted average lives our investment securities available for sale as of December 31, 2014 and
December 31, 2013 (dollar amounts in thousands):
The following tables set forth the stated reset periods of our investment securities available for sale and investment securities available for
sale held in securitization trusts at December 31, 2014 and December 31, 2013 at carrying value (dollar amounts in thousands):
The following tables present the Company's investment securities available for sale and investment securities available for sale held in
securitization trusts in an unrealized loss position reported through OCI, aggregated by investment category and length of time that individual securities have been in a continuous unrealized loss position at December 31, 2014 (dollar amounts in thousands):
Weighted Average Life December 31,
2014 December 31,
2013 0 to 5 years $ 393,080 $ 281,068 Over 5 to 10 years 365,386 451,635 10+ years 58,181 179,740
Total $ 816,647 $ 912,443
December 31, 201 4 December 31, 201 3
Less than 6
months 6 to 24 months
More than 24 months Total
Less than 6 months
6 to 24 months
More than 24 months Total
Agency RMBS $ 89,442 $ 21,746 $ 668,317 $ 779,505 $ 97,385 $ 14,823 $ 764,666 $ 876,874 Non-Agency RMBS 1,939 — — 1,939 2,361 — — 2,361 CLOs 35,203 — — 35,203 33,208 — — 33,208 Total investment securities
available for sale $ 126,584 $ 21,746 $ 668,317 $ 816,647 $ 132,954 $ 14,823 $ 764,666 $ 912,443 CMBS $ — $ — $ 38,594 $ 38,594 $ 28,232 $ — $ 64,346 $ 92,578 Total investment securities
available for sale held in securitization trusts $ — $ — $ 38,594 $ 38,594 $ 28,232 $ — $ 64,346 $ 92,578
December 31, 2014 Less than 12 Months Greater than 12 months Total
Carrying
Value
Gross Unrealized
Losses Carrying
Value
Gross Unrealized
Losses Carrying
Value
Gross Unrealized
Losses Agency RMBS $ — $ — $ 638,936 $ (12,597 ) $ 638,936 $ (12,597 ) Non-Agency RMBS — — 967 (191 ) 967 (191 ) Total investment securities available for
sale $ — $ — $ 639,903 $ (12,788 ) $ 639,903 $ (12,788 ) CMBS $ — $ — $ — $ — $ — $ — Total investment securities available for
sale held in securitization trusts $ — $ — $ — $ — $ — $ —
F-19
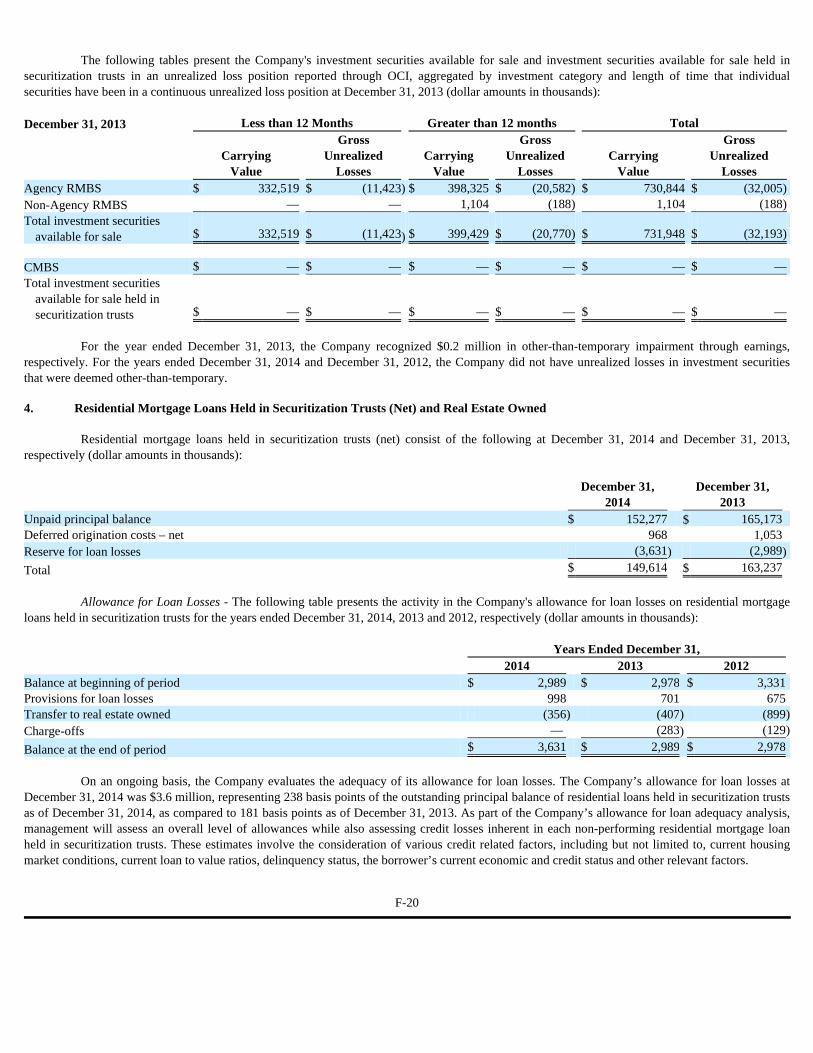
The following tables present the Company's investment securities available for sale and investment securities available for sale held in
securitization trusts in an unrealized loss position reported through OCI, aggregated by investment category and length of time that individual securities have been in a continuous unrealized loss position at December 31, 2013 (dollar amounts in thousands):
For the year ended December 31, 2013, the Company recognized $0.2 million in other-than-temporary impairment through earnings,
respectively. For the years ended December 31, 2014 and December 31, 2012, the Company did not have unrealized losses in investment securities that were deemed other-than-temporary.
Residential mortgage loans held in securitization trusts (net) consist of the following at December 31, 2014 and December 31, 2013,
respectively (dollar amounts in thousands):
Allowance for Loan Losses - The following table presents the activity in the Company's allowance for loan losses on residential mortgage
loans held in securitization trusts for the years ended December 31, 2014, 2013 and 2012, respectively (dollar amounts in thousands):
On an ongoing basis, the Company evaluates the adequacy of its allowance for loan losses. The Company’s allowance for loan losses at
December 31, 2014 was $3.6 million, representing 238 basis points of the outstanding principal balance of residential loans held in securitization trusts as of December 31, 2014, as compared to 181 basis points as of December 31, 2013. As part of the Company’s allowance for loan adequacy analysis, management will assess an overall level of allowances while also assessing credit losses inherent in each non-performing residential mortgage loan held in securitization trusts. These estimates involve the consideration of various credit related factors, including but not limited to, current housing market conditions, current loan to value ratios, delinquency status, the borrower’s current economic and credit status and other relevant factors.
December 31, 2013 Less than 12 Months Greater than 12 months Total
Carrying
Value
Gross Unrealized
Losses Carrying
Value
Gross Unrealized
Losses Carrying
Value
Gross Unrealized
Losses Agency RMBS $ 332,519 $ (11,423 ) $ 398,325 $ (20,582) $ 730,844 $ (32,005) Non-Agency RMBS — — 1,104 (188) 1,104 (188) Total investment securities
available for sale $ 332,519 $ (11,423 ) $ 399,429 $ (20,770) $ 731,948 $ (32,193) CMBS $ — $ — $ — $ — $ — $ — Total investment securities
available for sale held in securitization trusts $ — $ — $ — $ — $ — $ —
4. Residential Mortgage Loans Held in Securitization Trusts (Net) and Real Estate Owned
December 31,
2014 December 31,
2013 Unpaid principal balance $ 152,277 $ 165,173 Deferred origination costs – net 968 1,053 Reserve for loan losses (3,631 ) (2,989 )
Total $ 149,614 $ 163,237
Years Ended December 31,
2014 2013 2012
Balance at beginning of period $ 2,989 $ 2,978 $ 3,331 Provisions for loan losses 998 701 675 Transfer to real estate owned (356 ) (407 ) (899 ) Charge-offs — (283 ) (129 )
Balance at the end of period $ 3,631 $ 2,989 $ 2,978
F-20
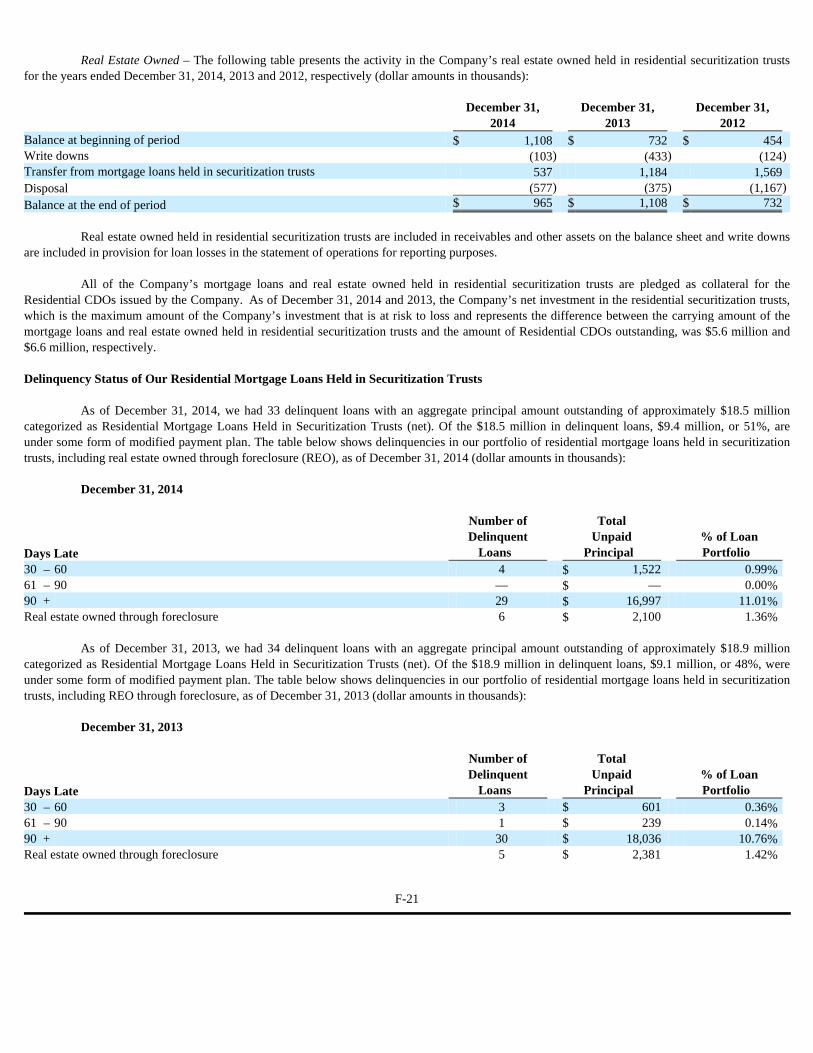
Real Estate Owned – The following table presents the activity in the Company’s real estate owned held in residential securitization trusts
for the years ended December 31, 2014, 2013 and 2012, respectively (dollar amounts in thousands):
Real estate owned held in residential securitization trusts are included in receivables and other assets on the balance sheet and write downs
are included in provision for loan losses in the statement of operations for reporting purposes.
All of the Company’s mortgage loans and real estate owned held in residential securitization trusts are pledged as collateral for the Residential CDOs issued by the Company. As of December 31, 2014 and 2013, the Company’s net investment in the residential securitization trusts, which is the maximum amount of the Company’s investment that is at risk to loss and represents the difference between the carrying amount of the mortgage loans and real estate owned held in residential securitization trusts and the amount of Residential CDOs outstanding, was $5.6 million and $6.6 million, respectively. Delinquency Status of Our Residential Mortgage Loans Held in Securitization Trusts
As of December 31, 2014, we had 33 delinquent loans with an aggregate principal amount outstanding of approximately $18.5 million categorized as Residential Mortgage Loans Held in Securitization Trusts (net). Of the $18.5 million in delinquent loans, $9.4 million, or 51%, are under some form of modified payment plan. The table below shows delinquencies in our portfolio of residential mortgage loans held in securitization trusts, including real estate owned through foreclosure (REO), as of December 31, 2014 (dollar amounts in thousands):
December 31, 2014
As of December 31, 2013, we had 34 delinquent loans with an aggregate principal amount outstanding of approximately $18.9 million
categorized as Residential Mortgage Loans Held in Securitization Trusts (net). Of the $18.9 million in delinquent loans, $9.1 million, or 48%, were under some form of modified payment plan. The table below shows delinquencies in our portfolio of residential mortgage loans held in securitization trusts, including REO through foreclosure, as of December 31, 2013 (dollar amounts in thousands):
December 31, 2013
December 31,
2014 December 31,
2013 December 31,
2012
Balance at beginning of period $ 1,108 $ 732 $ 454 Write downs (103 ) (433 ) (124 ) Transfer from mortgage loans held in securitization trusts 537 1,184 1,569 Disposal (577 ) (375 ) (1,167 )
Balance at the end of period $ 965 $ 1,108 $ 732
Days Late
Number of Delinquent
Loans
Total Unpaid
Principal % of Loan Portfolio
30 – 60 4 $ 1,522 0.99 % 61 – 90 — $ — 0.00 % 90 + 29 $ 16,997 11.01 % Real estate owned through foreclosure 6 $ 2,100 1.36 %
Days Late
Number of Delinquent
Loans
Total Unpaid
Principal % of Loan Portfolio
30 – 60 3 $ 601 0.36 % 61 – 90 1 $ 239 0.14 % 90 + 30 $ 18,036 10.76 % Real estate owned through foreclosure 5 $ 2,381 1.42 %
F-21

The geographic concentrations of credit risk exceeding 5% of the total loan balances in our residential mortgage loans held in securitization
trusts and real estate owned held in residential securitization trusts at December 31, 2014 and 2013 are as follows:
As of December 31, 2014 and December 31, 2013, the carrying value of the Company’s acquired distressed residential mortgage loans
amounts to approximately $582.7 million and $264.4 million, respectively. The Company considers its purchase price for the acquired distressed residential mortgage loans, including distressed residential mortgage
loans held in securitization trusts, to be at fair value at the date of acquisition. The Company only establishes an allowance for loan losses subsequent to acquisition.
The following table presents information regarding the estimates of the contractually required payments, the cash flows expected to be
collected, and the estimated fair value of the distressed residential mortgage loans acquired during the years ended December 31, 2014 and December 31, 2013, respectively (dollar amounts in thousands):
The following table details activity in accretable yield for the distressed residential mortgage loans, including distressed residential
mortgage loans held in securitization trusts, for the years ended December 31, 2014 and December 31, 2013, respectively (dollar amounts in thousands):
December 31,
2014 December 31,
2013 New York 36.1 % 35.9 % Massachusetts 24.0 % 24.6 % New Jersey 10.9 % 10.4 % Florida 6.2 % 5.8 % Connecticut 5.9 % 5.6 %
5. Distressed Residential Mortgage Loans
December 31,
2014 December 31
2013
Contractually required principal and interest $ 910,787 $ 368,571 Non-accretable yield (85,474 ) (47,453 ) Expected cash flows to be collected 825,313 321,118 Accretable yield (424,444 ) (102,952 )
Fair value at the date of acquisition $ 400,869 $ 218,166
December 31,
2014 December 31,
2013
Balance at beginning of period $ 171,112 $ 91,252 Additions 598,247 102,952 Disposals (110,309 ) (11,351 ) Accretion (18,634 ) (11,741 )
Balance at end of period $ 640,416 $ 171,112
Accretable yield is the excess of the distressed residential mortgage loans’ cash flows expected to be collected over the purchase price. The cash flows expected to be collected represents the Company’s estimate of the amount and timing of undiscounted principal and interest cash flows. Additions include accretable yield estimates for purchases made during the period and reclassification to accretable yield from nonaccretable yield. Deletions include distressed residential mortgage loan dispositions, which include refinancing, sale and foreclosure of the underlying collateral and resulting removal of the distressed residential mortgage loans from the accretable yield, and reclassifications from accretable to nonaccretable yield. The reclassifications between accretable and nonaccretable yield and the accretion of interest income is based on various estimates regarding loan performance and the value of the underlying real estate securing the loans. As the Company continues to gather additional information regarding the loans and the underlying collateral, the accretable yield may change. Therefore, the amount of accretable income recorded in the twelve-month period ended December 31, 2014 is not necessarily indicative of future results.
F-22
(1)
(1)
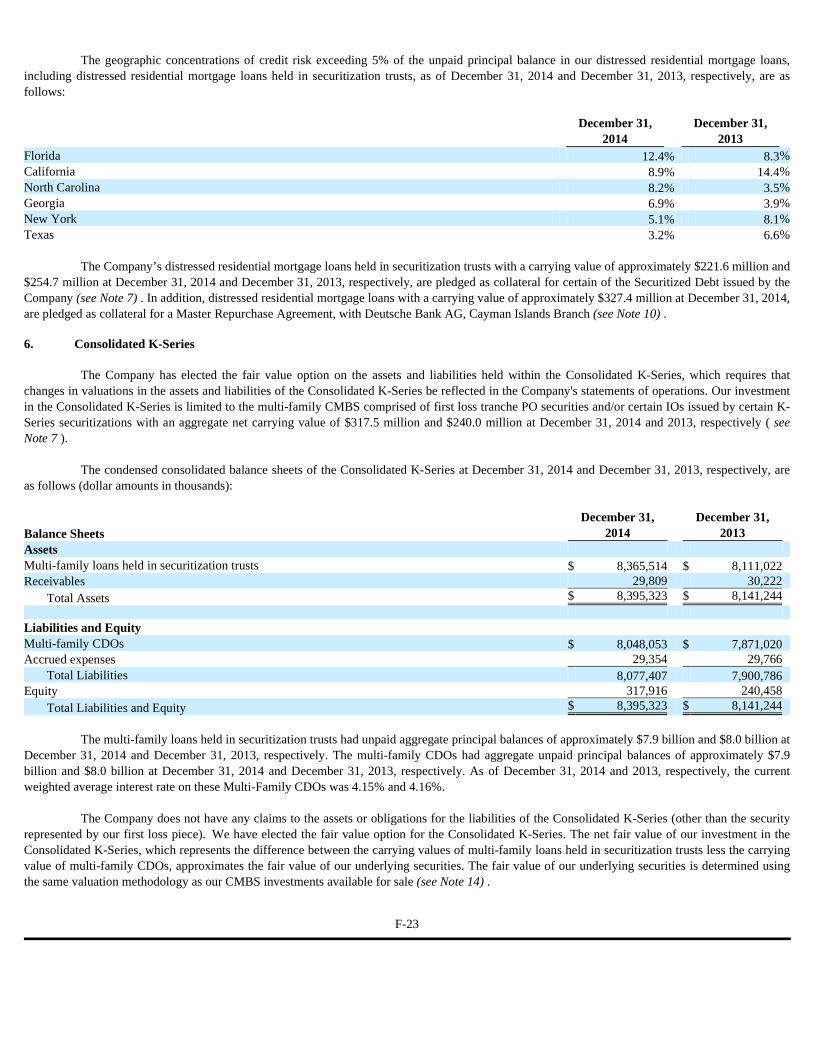
The geographic concentrations of credit risk exceeding 5% of the unpaid principal balance in our distressed residential mortgage loans,
including distressed residential mortgage loans held in securitization trusts, as of December 31, 2014 and December 31, 2013, respectively, are as follows:
The Company’s distressed residential mortgage loans held in securitization trusts with a carrying value of approximately $221.6 million and
$254.7 million at December 31, 2014 and December 31, 2013, respectively, are pledged as collateral for certain of the Securitized Debt issued by the Company (see Note 7) . In addition, distressed residential mortgage loans with a carrying value of approximately $327.4 million at December 31, 2014, are pledged as collateral for a Master Repurchase Agreement, with Deutsche Bank AG, Cayman Islands Branch (see Note 10) .
The Company has elected the fair value option on the assets and liabilities held within the Consolidated K-Series, which requires that
changes in valuations in the assets and liabilities of the Consolidated K-Series be reflected in the Company's statements of operations. Our investment in the Consolidated K-Series is limited to the multi-family CMBS comprised of first loss tranche PO securities and/or certain IOs issued by certain K-Series securitizations with an aggregate net carrying value of $317.5 million and $240.0 million at December 31, 2014 and 2013, respectively ( see Note 7 ).
The condensed consolidated balance sheets of the Consolidated K-Series at December 31, 2014 and December 31, 2013, respectively, are
as follows (dollar amounts in thousands):
The multi-family loans held in securitization trusts had unpaid aggregate principal balances of approximately $7.9 billion and $8.0 billion at
December 31, 2014 and December 31, 2013, respectively. The multi-family CDOs had aggregate unpaid principal balances of approximately $7.9 billion and $8.0 billion at December 31, 2014 and December 31, 2013, respectively. As of December 31, 2014 and 2013, respectively, the current weighted average interest rate on these Multi-Family CDOs was 4.15% and 4.16%.
The Company does not have any claims to the assets or obligations for the liabilities of the Consolidated K-Series (other than the security
represented by our first loss piece). We have elected the fair value option for the Consolidated K-Series. The net fair value of our investment in the Consolidated K-Series, which represents the difference between the carrying values of multi-family loans held in securitization trusts less the carrying value of multi-family CDOs, approximates the fair value of our underlying securities. The fair value of our underlying securities is determined using the same valuation methodology as our CMBS investments available for sale (see Note 14) .
December 31,
2014 December 31,
2013 Florida 12.4 % 8.3 % California 8.9 % 14.4 % North Carolina 8.2 % 3.5 % Georgia 6.9 % 3.9 % New York 5.1 % 8.1 % Texas 3.2 % 6.6 %
6. Consolidated K-Series
Balance Sheets December 31,
2014 December 31,
2013 Assets Multi-family loans held in securitization trusts $ 8,365,514 $ 8,111,022 Receivables 29,809 30,222
Total Assets $ 8,395,323 $ 8,141,244 Liabilities and Equity Multi-family CDOs $ 8,048,053 $ 7,871,020 Accrued expenses 29,354 29,766
Total Liabilities 8,077,407 7,900,786 Equity 317,916 240,458
Total Liabilities and Equity $ 8,395,323 $ 8,141,244
F-23
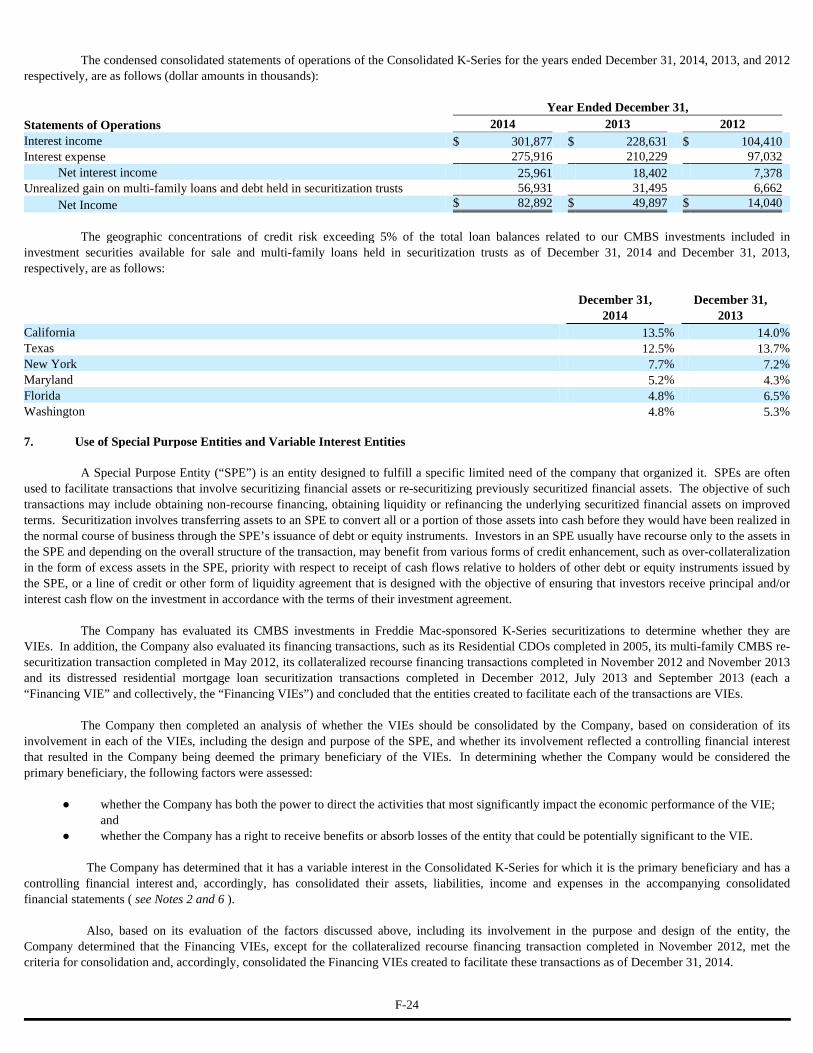
The condensed consolidated statements of operations of the Consolidated K-Series for the years ended December 31, 2014, 2013, and 2012
respectively, are as follows (dollar amounts in thousands):
The geographic concentrations of credit risk exceeding 5% of the total loan balances related to our CMBS investments included in
investment securities available for sale and multi-family loans held in securitization trusts as of December 31, 2014 and December 31, 2013, respectively, are as follows:
A Special Purpose Entity (“SPE”) is an entity designed to fulfill a specific limited need of the company that organized it. SPEs are often
used to facilitate transactions that involve securitizing financial assets or re-securitizing previously securitized financial assets. The objective of such transactions may include obtaining non-recourse financing, obtaining liquidity or refinancing the underlying securitized financial assets on improved terms. Securitization involves transferring assets to an SPE to convert all or a portion of those assets into cash before they would have been realized in the normal course of business through the SPE’s issuance of debt or equity instruments. Investors in an SPE usually have recourse only to the assets in the SPE and depending on the overall structure of the transaction, may benefit from various forms of credit enhancement, such as over-collateralization in the form of excess assets in the SPE, priority with respect to receipt of cash flows relative to holders of other debt or equity instruments issued by the SPE, or a line of credit or other form of liquidity agreement that is designed with the objective of ensuring that investors receive principal and/or interest cash flow on the investment in accordance with the terms of their investment agreement.
The Company has evaluated its CMBS investments in Freddie Mac-sponsored K-Series securitizations to determine whether they are
VIEs. In addition, the Company also evaluated its financing transactions, such as its Residential CDOs completed in 2005, its multi-family CMBS re-securitization transaction completed in May 2012, its collateralized recourse financing transactions completed in November 2012 and November 2013 and its distressed residential mortgage loan securitization transactions completed in December 2012, July 2013 and September 2013 (each a “Financing VIE” and collectively, the “Financing VIEs”) and concluded that the entities created to facilitate each of the transactions are VIEs.
The Company then completed an analysis of whether the VIEs should be consolidated by the Company, based on consideration of its involvement in each of the VIEs, including the design and purpose of the SPE, and whether its involvement reflected a controlling financial interest that resulted in the Company being deemed the primary beneficiary of the VIEs. In determining whether the Company would be considered the primary beneficiary, the following factors were assessed:
The Company has determined that it has a variable interest in the Consolidated K-Series for which it is the primary beneficiary and has a
controlling financial interest and, accordingly, has consolidated their assets, liabilities, income and expenses in the accompanying consolidated financial statements ( see Notes 2 and 6 ).
Also, based on its evaluation of the factors discussed above, including its involvement in the purpose and design of the entity, the Company determined that the Financing VIEs, except for the collateralized recourse financing transaction completed in November 2012, met the criteria for consolidation and, accordingly, consolidated the Financing VIEs created to facilitate these transactions as of December 31, 2014.
Year Ended December 31, Statements of Operations 2014 2013 2012 Interest income $ 301,877 $ 228,631 $ 104,410 Interest expense 275,916 210,229 97,032
Net interest income 25,961 18,402 7,378 Unrealized gain on multi-family loans and debt held in securitization trusts 56,931 31,495 6,662
Net Income $ 82,892 $ 49,897 $ 14,040
December 31, December 31, 2014 2013 California 13.5 % 14.0 % Texas 12.5 % 13.7 % New York 7.7 % 7.2 % Maryland 5.2 % 4.3 % Florida 4.8 % 6.5 % Washington 4.8 % 5.3 %
7. Use of Special Purpose Entities and Variable Interest Entities
● whether the Company has both the power to direct the activities that most significantly impact the economic performance of the VIE; and
● whether the Company has a right to receive benefits or absorb losses of the entity that could be potentially significant to the VIE.
F-24

In September 2014, the Company, through a wholly-owned subsidiary, repurchased $52 million of outstanding notes issued in connection
with the Company’s November 2012 collateralized recourse financing transaction. The repurchase of the notes resulted in the simultaneous (i) termination of the CMBS master repurchase agreement entered into by affiliates of the Company in connection with the November 2012 collateralized recourse financing transaction (and the related repayment of outstanding borrowings thereunder) and (ii) transfer back to the Company of the multi-family CMBS serving as collateral for the $52 million of borrowings. The master repurchase agreement entered into in November 2012 was scheduled to mature in November 2015. In connection with the early termination of this master repurchase agreement, the Company recognized a loss on extinguishment of debt of $3.4 million, which included unamortized debt issue costs of $0.4 million from the transaction. The repayment of the notes and the termination of this master repurchase agreement deconsolidated the Financing VIE that facilitated the transaction as of December 31, 2014.
The following table presents a summary of the assets and liabilities of these consolidated Financing VIEs. Intercompany balances have
been eliminated for purposes of this presentation.
F-25
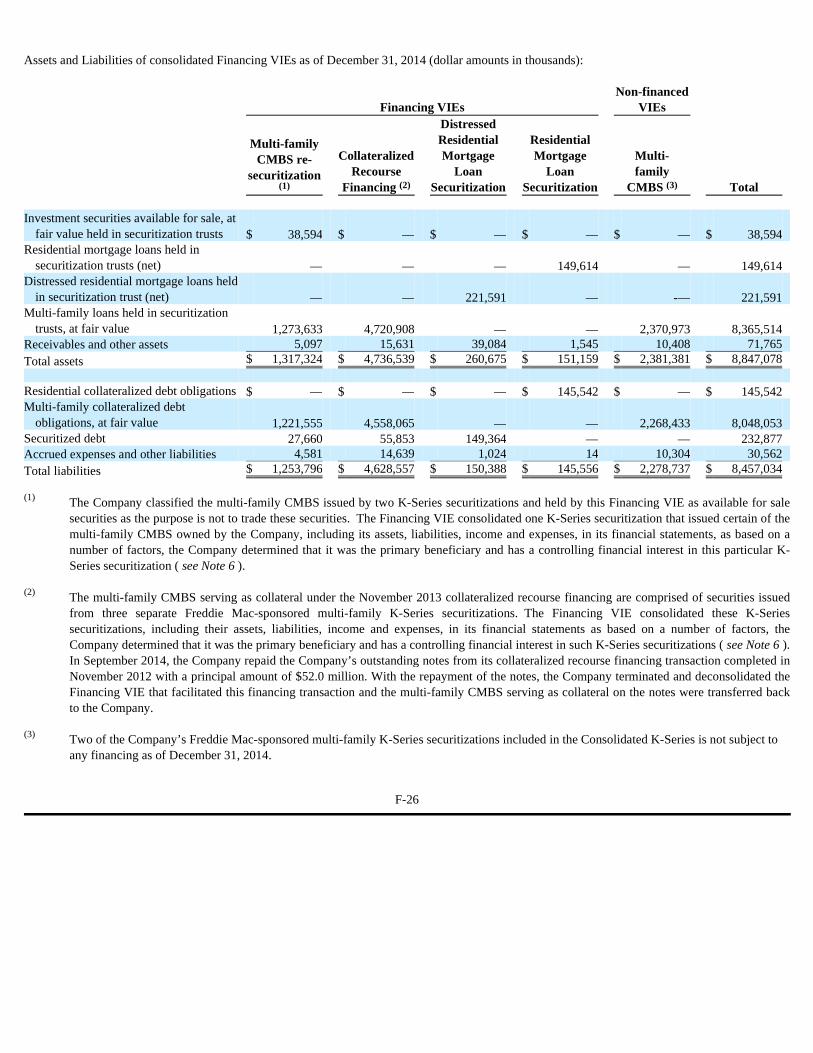
Assets and Liabilities of consolidated Financing VIEs as of December 31, 2014 (dollar amounts in thousands):
Financing VIEs Non-financed
VIEs
Multi-family CMBS re-
securitization
Collateralized Recourse
Financing
Distressed Residential Mortgage
Loan Securitization
Residential Mortgage
Loan Securitization
Multi- family
CMBS Total Investment securities available for sale, at
fair value held in securitization trusts $ 38,594 $ — $ — $ — $ — $ 38,594 Residential mortgage loans held in
securitization trusts (net) — — — 149,614 — 149,614 Distressed residential mortgage loans held
in securitization trust (net) — — 221,591 — -— 221,591 Multi-family loans held in securitization
trusts, at fair value 1,273,633 4,720,908 — — 2,370,973 8,365,514 Receivables and other assets 5,097 15,631 39,084 1,545 10,408 71,765 Total assets $ 1,317,324 $ 4,736,539 $ 260,675 $ 151,159 $ 2,381,381 $ 8,847,078 Residential collateralized debt obligations $ — $ — $ — $ 145,542 $ — $ 145,542 Multi-family collateralized debt
obligations, at fair value 1,221,555 4,558,065 — — 2,268,433 8,048,053 Securitized debt 27,660 55,853 149,364 — — 232,877 Accrued expenses and other liabilities 4,581 14,639 1,024 14 10,304 30,562 Total liabilities $ 1,253,796 $ 4,628,557 $ 150,388 $ 145,556 $ 2,278,737 $ 8,457,034
The Company classified the multi-family CMBS issued by two K-Series securitizations and held by this Financing VIE as available for sale securities as the purpose is not to trade these securities. The Financing VIE consolidated one K-Series securitization that issued certain of the multi-family CMBS owned by the Company, including its assets, liabilities, income and expenses, in its financial statements, as based on a number of factors, the Company determined that it was the primary beneficiary and has a controlling financial interest in this particular K-Series securitization ( see Note 6 ).
The multi-family CMBS serving as collateral under the November 2013 collateralized recourse financing are comprised of securities issued from three separate Freddie Mac-sponsored multi-family K-Series securitizations. The Financing VIE consolidated these K-Series securitizations, including their assets, liabilities, income and expenses, in its financial statements as based on a number of factors, the Company determined that it was the primary beneficiary and has a controlling financial interest in such K-Series securitizations ( see Note 6 ). In September 2014, the Company repaid the Company’s outstanding notes from its collateralized recourse financing transaction completed in November 2012 with a principal amount of $52.0 million. With the repayment of the notes, the Company terminated and deconsolidated the Financing VIE that facilitated this financing transaction and the multi-family CMBS serving as collateral on the notes were transferred back to the Company.
Two of the Company’s Freddie Mac-sponsored multi-family K-Series securitizations included in the Consolidated K-Series is not subject to any financing as of December 31, 2014.
F-26
(1) (2) (3)
(1)
(2)
(3)
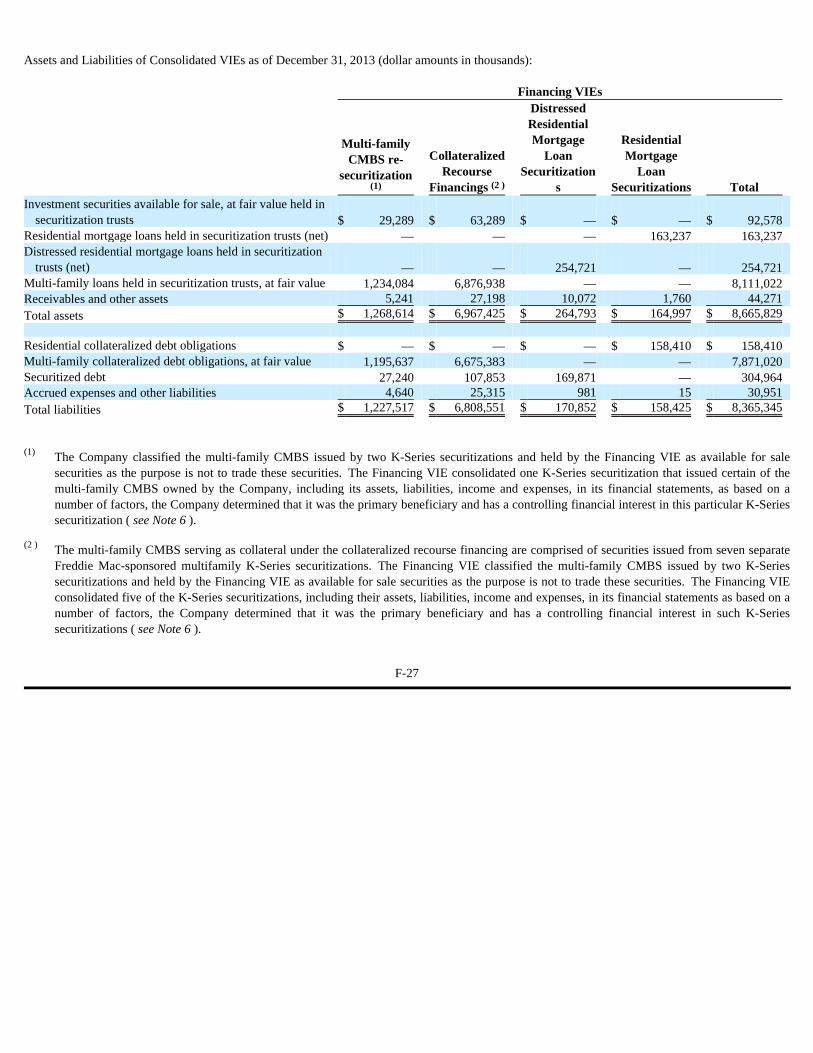
Assets and Liabilities of Consolidated VIEs as of December 31, 2013 (dollar amounts in thousands):
Financing VIEs
Multi-family CMBS re-
securitization
Collateralized Recourse
Financings
Distressed Residential Mortgage
Loan Securitization
s
Residential Mortgage
Loan Securitizations Total
Investment securities available for sale, at fair value held in securitization trusts $ 29,289 $ 63,289 $ — $ — $ 92,578
Residential mortgage loans held in securitization trusts (net) — — — 163,237 163,237 Distressed residential mortgage loans held in securitization
trusts (net) — — 254,721 — 254,721 Multi-family loans held in securitization trusts, at fair value 1,234,084 6,876,938 — — 8,111,022 Receivables and other assets 5,241 27,198 10,072 1,760 44,271 Total assets $ 1,268,614 $ 6,967,425 $ 264,793 $ 164,997 $ 8,665,829 Residential collateralized debt obligations $ — $ — $ — $ 158,410 $ 158,410 Multi-family collateralized debt obligations, at fair value 1,195,637 6,675,383 — — 7,871,020 Securitized debt 27,240 107,853 169,871 — 304,964 Accrued expenses and other liabilities 4,640 25,315 981 15 30,951 Total liabilities $ 1,227,517 $ 6,808,551 $ 170,852 $ 158,425 $ 8,365,345
The Company classified the multi-family CMBS issued by two K-Series securitizations and held by the Financing VIE as available for sale securities as the purpose is not to trade these securities. The Financing VIE consolidated one K-Series securitization that issued certain of the multi-family CMBS owned by the Company, including its assets, liabilities, income and expenses, in its financial statements, as based on a number of factors, the Company determined that it was the primary beneficiary and has a controlling financial interest in this particular K-Series securitization ( see Note 6 ).
The multi-family CMBS serving as collateral under the collateralized recourse financing are comprised of securities issued from seven separate Freddie Mac-sponsored multifamily K-Series securitizations. The Financing VIE classified the multi-family CMBS issued by two K-Series securitizations and held by the Financing VIE as available for sale securities as the purpose is not to trade these securities. The Financing VIE consolidated five of the K-Series securitizations, including their assets, liabilities, income and expenses, in its financial statements as based on a number of factors, the Company determined that it was the primary beneficiary and has a controlling financial interest in such K-Series securitizations ( see Note 6 ).
F-27
(1) (2 )
(1)
(2 )
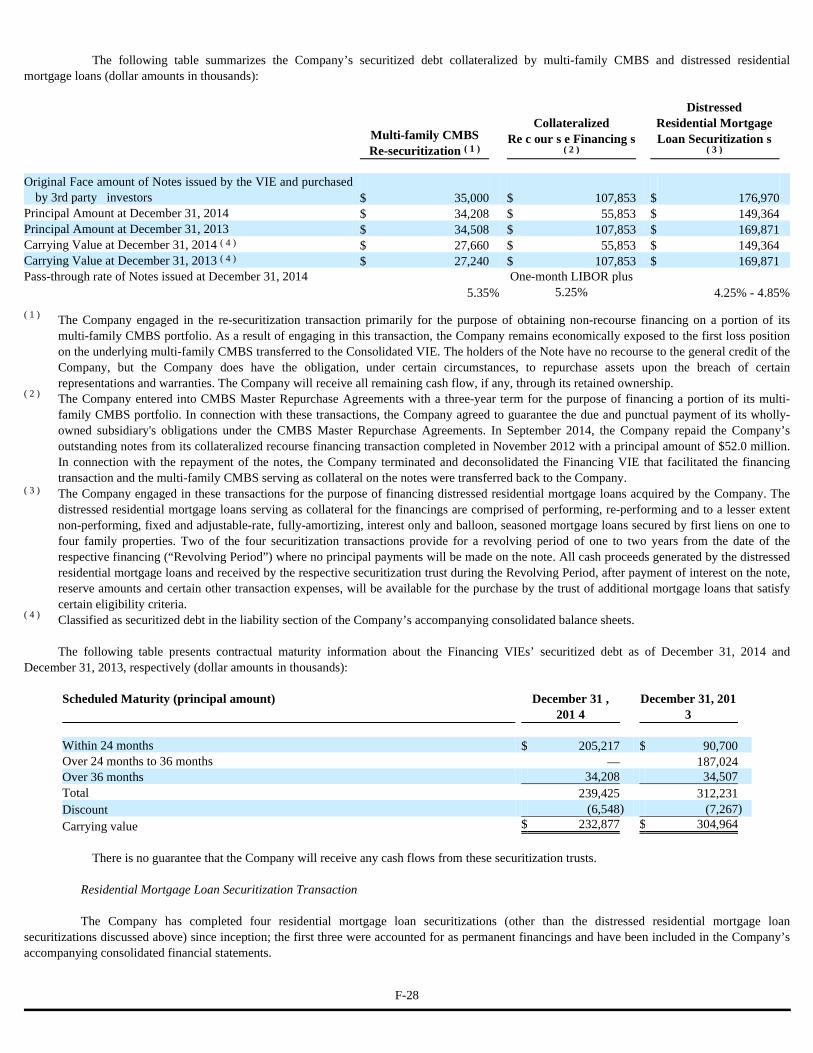
The following table summarizes the Company’s securitized debt collateralized by multi-family CMBS and distressed residential
mortgage loans (dollar amounts in thousands):
The following table presents contractual maturity information about the Financing VIEs’ securitized debt as of December 31, 2014 and
December 31, 2013, respectively (dollar amounts in thousands):
There is no guarantee that the Company will receive any cash flows from these securitization trusts.
Residential Mortgage Loan Securitization Transaction
The Company has completed four residential mortgage loan securitizations (other than the distressed residential mortgage loan
securitizations discussed above) since inception; the first three were accounted for as permanent financings and have been included in the Company’s accompanying consolidated financial statements.
Multi-family CMBS Re-securitization
Collateralized
Re c our s e Financing s
Distressed Residential Mortgage Loan Securitization s
Original Face amount of Notes issued by the VIE and purchased
by 3rd party investors $ 35,000 $ 107,853 $ 176,970 Principal Amount at December 31, 2014 $ 34,208 $ 55,853 $ 149,364 Principal Amount at December 31, 2013 $ 34,508 $ 107,853 $ 169,871 Carrying Value at December 31, 2014 $ 27,660 $ 55,853 $ 149,364 Carrying Value at December 31, 2013 $ 27,240 $ 107,853 $ 169,871 Pass-through rate of Notes issued at December 31, 2014
5.35 %
One-month LIBOR plus 5.25%
4.25% - 4.85 %
The Company engaged in the re-securitization transaction primarily for the purpose of obtaining non-recourse financing on a portion of its multi-family CMBS portfolio. As a result of engaging in this transaction, the Company remains economically exposed to the first loss position on the underlying multi-family CMBS transferred to the Consolidated VIE. The holders of the Note have no recourse to the general credit of the Company, but the Company does have the obligation, under certain circumstances, to repurchase assets upon the breach of certain representations and warranties. The Company will receive all remaining cash flow, if any, through its retained ownership. The Company entered into CMBS Master Repurchase Agreements with a three-year term for the purpose of financing a portion of its multi-family CMBS portfolio. In connection with these transactions, the Company agreed to guarantee the due and punctual payment of its wholly-owned subsidiary's obligations under the CMBS Master Repurchase Agreements. In September 2014, the Company repaid the Company’s outstanding notes from its collateralized recourse financing transaction completed in November 2012 with a principal amount of $52.0 million. In connection with the repayment of the notes, the Company terminated and deconsolidated the Financing VIE that facilitated the financing transaction and the multi-family CMBS serving as collateral on the notes were transferred back to the Company.
The Company engaged in these transactions for the purpose of financing distressed residential mortgage loans acquired by the Company. The distressed residential mortgage loans serving as collateral for the financings are comprised of performing, re-performing and to a lesser extent non-performing, fixed and adjustable-rate, fully-amortizing, interest only and balloon, seasoned mortgage loans secured by first liens on one to four family properties. Two of the four securitization transactions provide for a revolving period of one to two years from the date of the respective financing (“Revolving Period”) where no principal payments will be made on the note. All cash proceeds generated by the distressed residential mortgage loans and received by the respective securitization trust during the Revolving Period, after payment of interest on the note, reserve amounts and certain other transaction expenses, will be available for the purchase by the trust of additional mortgage loans that satisfy certain eligibility criteria. Classified as securitized debt in the liability section of the Company’s accompanying consolidated balance sheets.
Scheduled Maturity (principal amount) December 31 , 201 4
December 31, 201 3
Within 24 months $ 205,217 $ 90,700 Over 24 months to 36 months — 187,024 Over 36 months 34,208 34,507 Total 239,425 312,231 Discount (6,548 ) (7,267 )
Carrying value $ 232,877 $ 304,964
F-28
( 1 ) ( 2 ) ( 3 )
( 4 ) ( 4 )
( 1 )
( 2 )
( 3 )
( 4 )

Unconsolidated VIEs
The Company has evaluated its multi-family CMBS investments in two and four Freddie Mac-sponsored K-Series securitizations as of
December 31, 2014 and 2013, respectively, and its mezzanine loan, preferred equity and other equity investments to determine whether they are VIEs and should be consolidated by the Company. Based on a number of factors, the Company determined that it does not have a controlling financial interest and is not the primary beneficiary of these VIEs. The following table presents the classification and carrying value of unconsolidated VIEs as of December 31, 2014 and 2013 (dollar amounts in thousands):
Our maximum loss exposure on the multi-family CMBS investments and mezzanine loan and equity investments is approximately $111.5
million and $120.8 million at December 31, 2014 and December 31, 2013, respectively. The Company’s maximum exposure does not exceed the carrying value of its investments.
The Company enters into derivative instruments to manage its interest rate risk exposure. These derivative instruments include interest rate
swaps, swaptions and futures. The Company may also purchase or sell short TBAs and U.S. Treasury securities, purchase put or call options on U.S. Treasury futures or invest in other types of mortgage derivative securities.
The following table presents the fair value of derivative instruments that were not designated as hedging instruments and their location in our consolidated balance sheets at December 31, 2014 and December 31, 2013, respectively (dollar amounts in thousands):
December 31, 2014 December 31, 2013
Investment securities
available for sale, at fair
value, held in securitization
trusts
Receivables and o ther
Assets Total
Investment securities
available for sale, at fair
value, held in securitization
trusts
Receivables and o ther
Assets Total Multi-Family CMBS $ 38,594 $ 80 $ 38,674 $ 92,578 $ 183 $ 92,761 Mezzanine loan and equity investments — 72,799 72,799 — 28,058 28,058 Total assets $ 38,594 $ 72,879 $ 111,473 $ 92,578 $ 28,241 $ 120,819
8. Derivative Instruments and Hedging Activities
Derivatives Not Designated as Hedging Instruments Balance Sheet Location
December 31, 2014
December 31, 2013
TBA securities Derivative assets $ 284,971 $ 190,742 U.S. Treasury futures Derivative assets 379 3,257 Swaptions Derivative assets 2,273 1,305 Options on U.S. Treasury futures Derivative assets 92 7 Interest rate swap futures Derivative assets — 238 Eurodollar futures Derivative liabilities 900 1,432 Interest rate swaps Derivative liabilities 232 — Interest rate swap futures Derivative liabilities 331 —
Open TBA purchases and sales involving the same counterparty, same underlying deliverable and the same settlement date are reflected in our accompanying consolidated financial statements on a net basis. There was no netting of TBA sales against TBA purchases as of December 31, 2014 and December 31, 2013.
Includes interest rate swaps in our Agency IO portfolio.
F-29
(1)
(2)
(1)
(2)
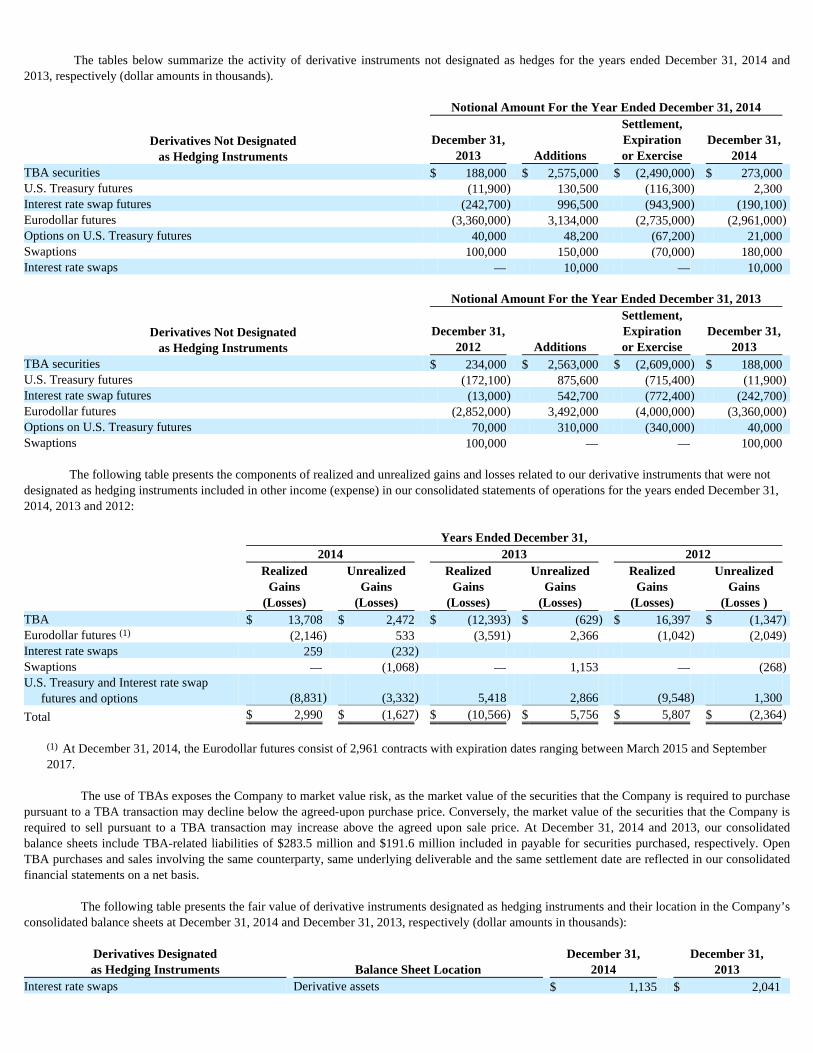
The tables below summarize the activity of derivative instruments not designated as hedges for the years ended December 31, 2014 and
2013, respectively (dollar amounts in thousands).
The following table presents the components of realized and unrealized gains and losses related to our derivative instruments that were not
designated as hedging instruments included in other income (expense) in our consolidated statements of operations for the years ended December 31, 2014, 2013 and 2012:
At December 31, 2014, the Eurodollar futures consist of 2,961 contracts with expiration dates ranging between March 2015 and September
2017. The use of TBAs exposes the Company to market value risk, as the market value of the securities that the Company is required to purchase
pursuant to a TBA transaction may decline below the agreed-upon purchase price. Conversely, the market value of the securities that the Company is required to sell pursuant to a TBA transaction may increase above the agreed upon sale price. At December 31, 2014 and 2013, our consolidated balance sheets include TBA-related liabilities of $283.5 million and $191.6 million included in payable for securities purchased, respectively. Open TBA purchases and sales involving the same counterparty, same underlying deliverable and the same settlement date are reflected in our consolidated financial statements on a net basis.
The following table presents the fair value of derivative instruments designated as hedging instruments and their location in the Company’s
consolidated balance sheets at December 31, 2014 and December 31, 2013, respectively (dollar amounts in thousands):
Notional Amount For the Year Ended December 31, 2014
Derivatives Not Designated as Hedging Instruments
December 31, 2013 Additions
Settlement, Expiration or Exercise
December 31, 2014
TBA securities $ 188,000 $ 2,575,000 $ (2,490,000 ) $ 273,000 U.S. Treasury futures (11,900 ) 130,500 (116,300 ) 2,300 Interest rate swap futures (242,700 ) 996,500 (943,900 ) (190,100 ) Eurodollar futures (3,360,000 ) 3,134,000 (2,735,000 ) (2,961,000 ) Options on U.S. Treasury futures 40,000 48,200 (67,200 ) 21,000 Swaptions 100,000 150,000 (70,000 ) 180,000 Interest rate swaps — 10,000 — 10,000
Notional Amount For the Year Ended December 31, 2013
Derivatives Not Designated as Hedging Instruments
December 31, 2012 Additions
Settlement, Expiration or Exercise
December 31, 2013
TBA securities $ 234,000 $ 2,563,000 $ (2,609,000 ) $ 188,000 U.S. Treasury futures (172,100 ) 875,600 (715,400 ) (11,900 ) Interest rate swap futures (13,000 ) 542,700 (772,400 ) (242,700 ) Eurodollar futures (2,852,000 ) 3,492,000 (4,000,000 ) (3,360,000 ) Options on U.S. Treasury futures 70,000 310,000 (340,000 ) 40,000 Swaptions 100,000 — — 100,000
Years Ended December 31, 2014 2013 2012
Realized Gains
(Losses)
Unrealized Gains
(Losses)
Realized Gains
(Losses)
Unrealized Gains
(Losses)
Realized Gains
(Losses)
Unrealized Gains
(Losses ) TBA $ 13,708 $ 2,472 $ (12,393 ) $ (629 ) $ 16,397 $ (1,347 ) Eurodollar futures (2,146 ) 533 (3,591 ) 2,366 (1,042 ) (2,049 ) Interest rate swaps 259 (232 ) Swaptions — (1,068 ) — 1,153 — (268 ) U.S. Treasury and Interest rate swap
futures and options (8,831 ) (3,332 ) 5,418 2,866 (9,548 ) 1,300
Total $ 2,990 $ (1,627 ) $ (10,566 ) $ 5,756 $ 5,807 $ (2,364 )
Derivatives Designated as Hedging Instruments Balance Sheet Location
December 31, 2014
December 31, 2013
Interest rate swaps Derivative assets $ 1,135 $ 2,041
(1)
(1)

F-30

The Company has netting arrangements by counterparty with respect to its interest rate swaps. Contracts in a liability position of $0.2
million have been netted against the asset position of $1.3 million and contracts in a liability position of $0.3 million have been netted against the asset position of $2.3 million in the accompanying consolidated balance sheets at December 31, 2014 and December 31, 2013, respectively.
The following table presents the impact of the Company’s derivative instruments on the Company’s accumulated other comprehensive
income (loss) for the years ended December 31, 2014, 2013 and 2012 (dollar amounts in thousands):
The Company estimates that over the next 12 months, approximately $1.2 million of the net unrealized gains on the interest rate swaps will
be reclassified from accumulated other comprehensive income (loss) into earnings.
The following table details the impact of the Company’s interest rate swaps designated as hedging instruments included in interest expense for the years ended December 31, 2014, 2013 and 2012, respectively (dollar amounts in thousands):
The Company’s interest rate swaps, except interest swaps included in our Agency IO portfolio, are designated as cash flow hedges against
the benchmark interest rate risk associated with its short term repurchase agreements. There were no costs incurred at the inception of our interest rate swaps, under which the Company agrees to pay a fixed rate of interest and receive a variable interest rate based on one month LIBOR, on the notional amount of the interest rate swaps.
The Company documents its risk-management policies, including objectives and strategies, as they relate to its hedging activities, and upon entering into hedging transactions, documents the relationship between the hedging instrument and the hedged liability contemporaneously. The Company assesses, both at inception of a hedge and on an on-going basis, whether or not the hedge is “highly effective” when using the matched term basis.
The Company discontinues hedge accounting on a prospective basis and recognizes changes in the fair value through earnings when: (i) it
is determined that the derivative is no longer effective in offsetting cash flows of a hedged item (including forecasted transactions); (ii) it is no longer probable that the forecasted transaction will occur; or (iii) it is determined that designating the derivative as a hedge is no longer appropriate. The Company’s derivative instruments are carried on the Company’s balance sheets at fair value, as assets, if their fair value is positive, or as liabilities, if their fair value is negative. For the Company’s derivative instruments that are designated as “cash flow hedges,” changes in their fair value are recorded in accumulated other comprehensive income (loss), provided that the hedges are effective. A change in fair value for any ineffective amount of the Company’s derivative instruments would be recognized in earnings. The Company has not recognized any change in the value of its existing derivative instruments designated as cash flow hedges through earnings as a result of ineffectiveness of any of its hedges.
Years Ended December 31, Derivatives Designated as Hedging Instruments 2014 2013 2012 Accumulated other comprehensive income (loss) for derivative instruments:
Balance at beginning of the period $ 2,041 $ (1,744 ) $ (304 ) Unrealized (loss) gain on interest rate swaps (906 ) 3,785 (1,440 )
Balance at end of the period $ 1,135 $ 2,041 $ (1,744 )
Years Ended December 31, 2014 2013 2012 Interest Rate Swaps:
Interest expense-investment securities $ 1,848 $ 1,737 $ 810
F-31
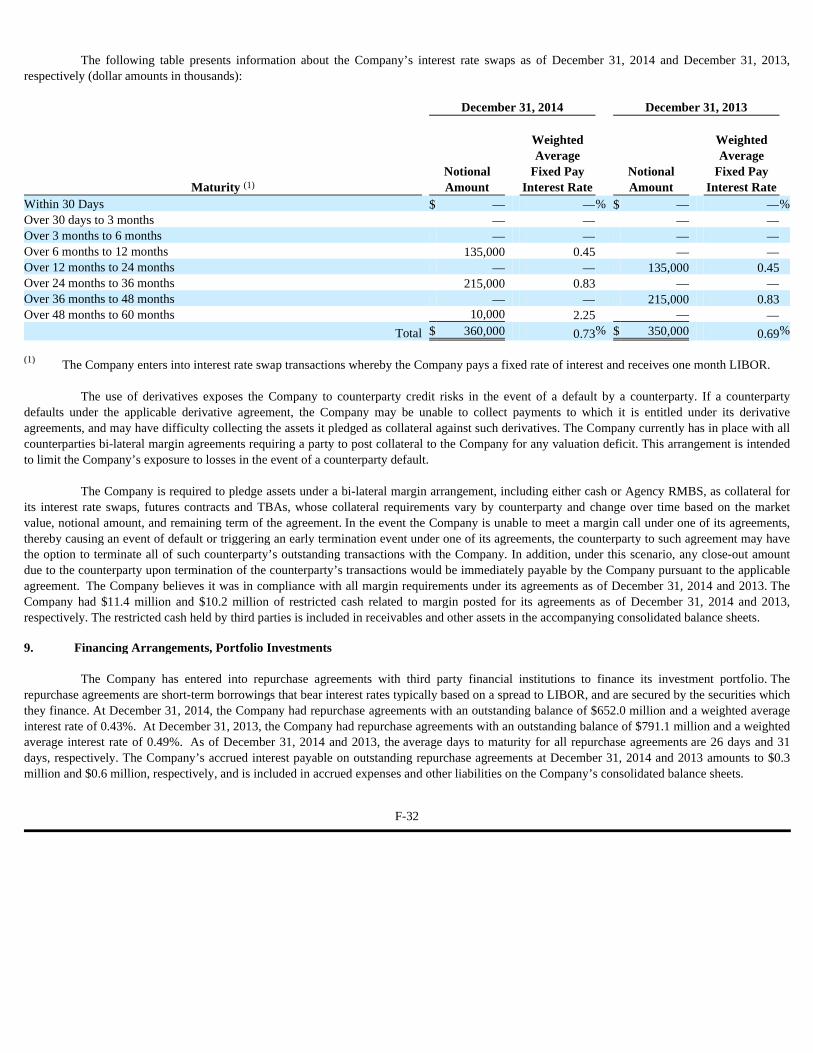
The following table presents information about the Company’s interest rate swaps as of December 31, 2014 and December 31, 2013,
respectively (dollar amounts in thousands):
The use of derivatives exposes the Company to counterparty credit risks in the event of a default by a counterparty. If a counterparty
defaults under the applicable derivative agreement, the Company may be unable to collect payments to which it is entitled under its derivative agreements, and may have difficulty collecting the assets it pledged as collateral against such derivatives. The Company currently has in place with all counterparties bi-lateral margin agreements requiring a party to post collateral to the Company for any valuation deficit. This arrangement is intended to limit the Company’s exposure to losses in the event of a counterparty default.
The Company is required to pledge assets under a bi-lateral margin arrangement, including either cash or Agency RMBS, as collateral for its interest rate swaps, futures contracts and TBAs, whose collateral requirements vary by counterparty and change over time based on the market value, notional amount, and remaining term of the agreement. In the event the Company is unable to meet a margin call under one of its agreements, thereby causing an event of default or triggering an early termination event under one of its agreements, the counterparty to such agreement may have the option to terminate all of such counterparty’s outstanding transactions with the Company. In addition, under this scenario, any close-out amount due to the counterparty upon termination of the counterparty’s transactions would be immediately payable by the Company pursuant to the applicable agreement. The Company believes it was in compliance with all margin requirements under its agreements as of December 31, 2014 and 2013. The Company had $11.4 million and $10.2 million of restricted cash related to margin posted for its agreements as of December 31, 2014 and 2013, respectively. The restricted cash held by third parties is included in receivables and other assets in the accompanying consolidated balance sheets.
The Company has entered into repurchase agreements with third party financial institutions to finance its investment portfolio. The
repurchase agreements are short-term borrowings that bear interest rates typically based on a spread to LIBOR, and are secured by the securities which they finance. At December 31, 2014, the Company had repurchase agreements with an outstanding balance of $652.0 million and a weighted average interest rate of 0.43%. At December 31, 2013, the Company had repurchase agreements with an outstanding balance of $791.1 million and a weighted average interest rate of 0.49%. As of December 31, 2014 and 2013, the average days to maturity for all repurchase agreements are 26 days and 31 days, respectively. The Company’s accrued interest payable on outstanding repurchase agreements at December 31, 2014 and 2013 amounts to $0.3 million and $0.6 million, respectively, and is included in accrued expenses and other liabilities on the Company’s consolidated balance sheets.
December 31, 2014 December 31, 2013
Maturity Notional Amount
Weighted Average
Fixed Pay Interest Rate
Notional Amount
Weighted Average
Fixed Pay Interest Rate
Within 30 Days $ — —% $ — —% Over 30 days to 3 months — — — — Over 3 months to 6 months — — — — Over 6 months to 12 months 135,000 0.45 — — Over 12 months to 24 months — — 135,000 0.45 Over 24 months to 36 months 215,000 0.83 — — Over 36 months to 48 months — — 215,000 0.83 Over 48 months to 60 months 10,000 2.25 — —
Total $ 360,000 0.73 % $ 350,000 0.69 %
The Company enters into interest rate swap transactions whereby the Company pays a fixed rate of interest and receives one month LIBOR.
9. Financing Arrangements, Portfolio Investments
F-32
(1)
(1)
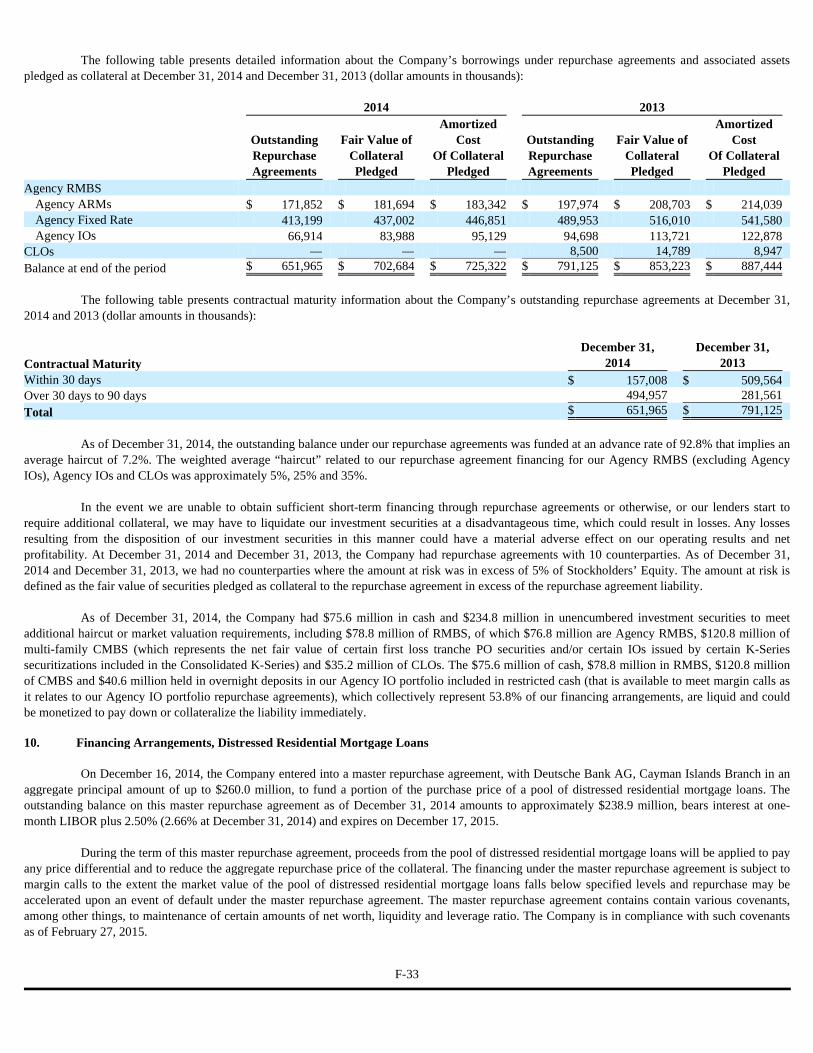
The following table presents detailed information about the Company’s borrowings under repurchase agreements and associated assets
pledged as collateral at December 31, 2014 and December 31, 2013 (dollar amounts in thousands):
The following table presents contractual maturity information about the Company’s outstanding repurchase agreements at December 31,
2014 and 2013 (dollar amounts in thousands):
As of December 31, 2014, the outstanding balance under our repurchase agreements was funded at an advance rate of 92.8% that implies an
average haircut of 7.2%. The weighted average “haircut” related to our repurchase agreement financing for our Agency RMBS (excluding Agency IOs), Agency IOs and CLOs was approximately 5%, 25% and 35%.
In the event we are unable to obtain sufficient short-term financing through repurchase agreements or otherwise, or our lenders start to
require additional collateral, we may have to liquidate our investment securities at a disadvantageous time, which could result in losses. Any losses resulting from the disposition of our investment securities in this manner could have a material adverse effect on our operating results and net profitability. At December 31, 2014 and December 31, 2013, the Company had repurchase agreements with 10 counterparties. As of December 31, 2014 and December 31, 2013, we had no counterparties where the amount at risk was in excess of 5% of Stockholders’ Equity. The amount at risk is defined as the fair value of securities pledged as collateral to the repurchase agreement in excess of the repurchase agreement liability.
As of December 31, 2014, the Company had $75.6 million in cash and $234.8 million in unencumbered investment securities to meet additional haircut or market valuation requirements, including $78.8 million of RMBS, of which $76.8 million are Agency RMBS, $120.8 million of multi-family CMBS (which represents the net fair value of certain first loss tranche PO securities and/or certain IOs issued by certain K-Series securitizations included in the Consolidated K-Series) and $35.2 million of CLOs. The $75.6 million of cash, $78.8 million in RMBS, $120.8 million of CMBS and $40.6 million held in overnight deposits in our Agency IO portfolio included in restricted cash (that is available to meet margin calls as it relates to our Agency IO portfolio repurchase agreements), which collectively represent 53.8% of our financing arrangements, are liquid and could be monetized to pay down or collateralize the liability immediately.
On December 16, 2014, the Company entered into a master repurchase agreement, with Deutsche Bank AG, Cayman Islands Branch in an
aggregate principal amount of up to $260.0 million, to fund a portion of the purchase price of a pool of distressed residential mortgage loans. The outstanding balance on this master repurchase agreement as of December 31, 2014 amounts to approximately $238.9 million, bears interest at one-month LIBOR plus 2.50% (2.66% at December 31, 2014) and expires on December 17, 2015.
During the term of this master repurchase agreement, proceeds from the pool of distressed residential mortgage loans will be applied to pay any price differential and to reduce the aggregate repurchase price of the collateral. The financing under the master repurchase agreement is subject to margin calls to the extent the market value of the pool of distressed residential mortgage loans falls below specified levels and repurchase may be accelerated upon an event of default under the master repurchase agreement. The master repurchase agreement contains contain various covenants, among other things, to maintenance of certain amounts of net worth, liquidity and leverage ratio. The Company is in compliance with such covenants as of February 27, 2015.
2014 2013
Outstanding Repurchase Agreements
Fair Value of Collateral Pledged
Amortized Cost
Of Collateral Pledged
Outstanding Repurchase Agreements
Fair Value of Collateral Pledged
Amortized Cost
Of Collateral Pledged
Agency RMBS Agency ARMs $ 171,852 $ 181,694 $ 183,342 $ 197,974 $ 208,703 $ 214,039 Agency Fixed Rate 413,199 437,002 446,851 489,953 516,010 541,580 Agency IOs 66,914 83,988 95,129 94,698 113,721 122,878
CLOs — — — 8,500 14,789 8,947 Balance at end of the period $ 651,965 $ 702,684 $ 725,322 $ 791,125 $ 853,223 $ 887,444
Contractual Maturity December 31,
2014 December 31,
2013 Within 30 days $ 157,008 $ 509,564 Over 30 days to 90 days 494,957 281,561 Total $ 651,965 $ 791,125
10. Financing Arrangements, Distressed Residential Mortgage Loans
F-33
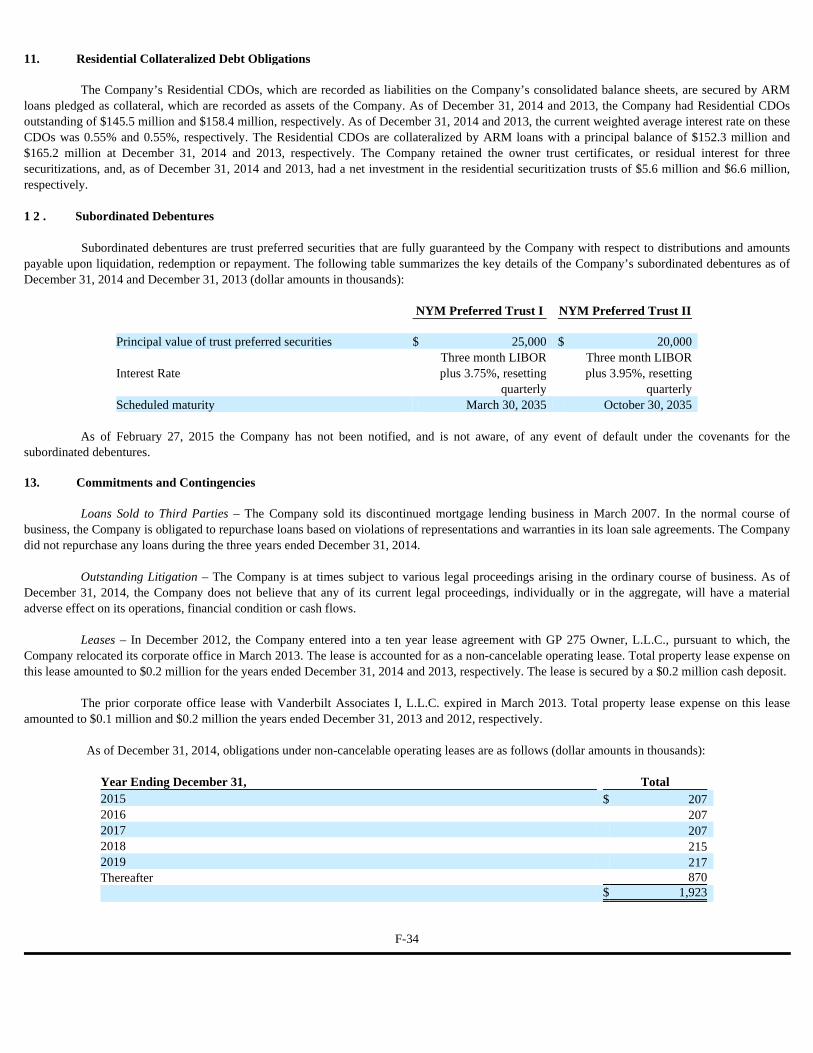
The Company’s Residential CDOs, which are recorded as liabilities on the Company’s consolidated balance sheets, are secured by ARM
loans pledged as collateral, which are recorded as assets of the Company. As of December 31, 2014 and 2013, the Company had Residential CDOs outstanding of $145.5 million and $158.4 million, respectively. As of December 31, 2014 and 2013, the current weighted average interest rate on these CDOs was 0.55% and 0.55%, respectively. The Residential CDOs are collateralized by ARM loans with a principal balance of $152.3 million and $165.2 million at December 31, 2014 and 2013, respectively. The Company retained the owner trust certificates, or residual interest for three securitizations, and, as of December 31, 2014 and 2013, had a net investment in the residential securitization trusts of $5.6 million and $6.6 million, respectively.
Subordinated debentures are trust preferred securities that are fully guaranteed by the Company with respect to distributions and amounts
payable upon liquidation, redemption or repayment. The following table summarizes the key details of the Company’s subordinated debentures as of December 31, 2014 and December 31, 2013 (dollar amounts in thousands):
As of February 27, 2015 the Company has not been notified, and is not aware, of any event of default under the covenants for the
subordinated debentures.
Loans Sold to Third Parties – The Company sold its discontinued mortgage lending business in March 2007. In the normal course of
business, the Company is obligated to repurchase loans based on violations of representations and warranties in its loan sale agreements. The Company did not repurchase any loans during the three years ended December 31, 2014.
Outstanding Litigation – The Company is at times subject to various legal proceedings arising in the ordinary course of business. As of December 31, 2014, the Company does not believe that any of its current legal proceedings, individually or in the aggregate, will have a material adverse effect on its operations, financial condition or cash flows.
Leases – In December 2012, the Company entered into a ten year lease agreement with GP 275 Owner, L.L.C., pursuant to which, the
Company relocated its corporate office in March 2013. The lease is accounted for as a non-cancelable operating lease. Total property lease expense on this lease amounted to $0.2 million for the years ended December 31, 2014 and 2013, respectively. The lease is secured by a $0.2 million cash deposit.
The prior corporate office lease with Vanderbilt Associates I, L.L.C. expired in March 2013. Total property lease expense on this lease
amounted to $0.1 million and $0.2 million the years ended December 31, 2013 and 2012, respectively. As of December 31, 2014, obligations under non-cancelable operating leases are as follows (dollar amounts in thousands):
11. Residential Collateralized Debt Obligations
1 2 . Subordinated Debentures
NYM Preferred Trust I NYM Preferred Trust II Principal value of trust preferred securities $ 25,000 $ 20,000
Interest Rate
Three month LIBOR plus 3.75%, resetting
quarterly
Three month LIBOR plus 3.95%, resetting
quarterly Scheduled maturity March 30, 2035 October 30, 2035
13. Commitments and Contingencies
Year Ending December 31, Total 2015 $ 207 2016 207 2017 207 2018 215 2019 217 Thereafter 870
$ 1,923
F-34
The Company has established and documented processes for determining fair values. Fair value is based upon quoted market prices, where
available. If listed prices or quotes are not available, then fair value is based upon internally developed models that primarily use inputs that are market-based or independently-sourced market parameters, including interest rate yield curves.
A financial instrument’s categorization within the valuation hierarchy is based upon the lowest level of input that is significant to the fair value measurement. The three levels of valuation hierarchy are defined as follows:
Level 1 - inputs to the valuation methodology are quoted prices (unadjusted) for identical assets or liabilities in active markets.
Level 2 - inputs to the valuation methodology include quoted prices for similar assets and liabilities in active markets, and inputs that are observable for the asset or liability, either directly or indirectly, for substantially the full term of the financial instrument.
Level 3 - inputs to the valuation methodology are unobservable and significant to the fair value measurement.
The following describes the valuation methodologies used for the Company’s financial instruments measured at fair value, as well as the general classification of such instruments pursuant to the valuation hierarchy.
1 4. Fair Value of Financial Instruments
a. Investment Securities Available for Sale (RMBS and CLOs) – Fair value for the RMBS in our portfolio are valued using a third-party pricing service or are based on quoted prices provided by dealers who make markets in similar financial instruments. The dealers will incorporate common market pricing methods, including a spread measurement to the Treasury curve or interest rate swap curve as well as underlying characteristics of the particular security including coupon, periodic and life caps, collateral type, rate reset period and seasoning or age of the security. If quoted prices for a security are not reasonably available from a dealer, the security will be re-classified as a Level 3 security and, as a result, management will determine the fair value based on characteristics of the security that the Company receives from the issuer and based on available market information. Management reviews all prices used in determining valuation to ensure they represent current market conditions. This review includes surveying similar market transactions, comparisons to interest pricing models as well as offerings of like securities by dealers. The Company's investment securities that are comprised of RMBS and CLOs are valued based upon readily observable market parameters and are classified as Level 2 fair values.
b. Investment Securities Available for Sale Held in Securitization Trusts (CMBS) – As the Company’s CMBS investments are comprised of securities for which there are not substantially similar securities that trade frequently, the Company classifies these securities as Level 3 fair values. Fair value of the Company’s CMBS investments is based on an internal valuation model that considers expected cash flows from the underlying loans and yields required by market participants. The significant unobservable inputs used in the measurement of these investments are projected losses of certain identified loans within the pool of loans and a discount rate. The discount rate used in determining fair value incorporates default rate, loss severity and current market interest rates. The discount rate ranges from 4.7% to 10.3%. Significant increases or decreases in these inputs would result in a significantly lower or higher fair value measurement.
c. Multi-Family Loans Held in Securitization Trusts – Multi- family loans held in securitization trusts are recorded at fair value and classified as Level 3 fair values. Fair value is based on an internal valuation model that considers expected cash flows from the underlying loans and yields required by market participants. The significant unobservable inputs used in the measurement of these investments are discount rates. The discount rate used in determining fair value incorporates default rate, loss severity and current market interest rates. The discount rate ranges from 2.9% to 5.6%. Significant increases or decreases in these inputs would result in a significantly lower or higher fair value measurement.
d. Derivative Instruments – The fair value of interest rate swaps, swaptions, options and TBAs are based on dealer quotes. The fair value of futures are based on exchange-traded prices. The Company’s derivatives are classified as Level 1 or Level 2 fair values.
e. Multi-Family CDOs – Multi-Family collateralized debt obligations are recorded at fair value and classified as Level 3 fair values. The fair value of Multi-family CDOs is determined using a third party pricing service or are based on quoted prices provided by dealers who make markets in similar financial instruments. The dealers will consider contractual cash payments and yields expected by market participants. Dealers also incorporate common market pricing methods, including a spread measurement to the Treasury curve or interest rate swap curve as well as underlying characteristics of the particular security including coupon, periodic and life caps, collateral type, rate reset period and seasoning or age of the security. The Company’s Multi-family CDOs are classified as Level 3 fair values.
F-35
The following table presents the Company’s financial instruments measured at fair value on a recurring basis as of December 31, 2014 and
2013, respectively, on the Company’s consolidated balance sheets (dollar amounts in thousands):
The following table details changes in valuation for the Level 3 assets for the years ended December 31, 2014, 2013 and 2012,
respectively (amounts in thousands): Level 3 Assets:
Measured at Fair Value on a Recurring Basis at December 31, 201 4 December 31, 201 3
Level 1 Level 2 Level 3 Total Level 1 Level 2 Level 3 Total Assets carried at fair value Investment securities
available for sale: Agency RMBS $ — $ 779,505 $ — $ 779,505 $ — $ 876,874 $ — $ 876,874 Non-Agency RMBS — 1,939 — 1,939 — 2,361 — 2,361 CLOs — 35,203 — 35,203 — 33,208 — 33,208
Investment securities available for sale held in securitization trusts:
CMBS — — 38,594 38,594 — — 92,578 92,578 Multi-family loans held in
securitization trusts — — 8,365,514 8,365,514 — — 8,111,022 8,111,022 Derivative Assets:
TBA Securities — 284,971 — 284,971 — 190,742 — 190,742 Options on U.S. Treasury
futures 92 — — 92 7 — — 7 U.S. Treasury futures 379 — — 379 3,257 — — 3,257 Interest rate swap futures — — — — 238 — — 238 Interest rate swaps — 1,135 — 1,135 — 2,041 — 2,041 Swaptions — 2,273 — 2,273 — 1,305 — 1,305
Total $ 471 $ 1,105,026 $ 8,404,108 $ 9,509,605 $ 3,502 $ 1,106,531 $ 8,203,600 $ 9,313,633
Liabilities carried at fair value
Multi-family collateralized debt obligations $ — $ — $ 8,048,053 $ 8,048,053 $ — $ — $ 7,871,020 $ 7,871,020
Derivative liabilities: Interest rate swaps — 232 — 232 — — — — Interest rate swap futures 331 — — 331 — — — — Eurodollar futures 900 — — 900 1,432 — — 1,432
Total $ 1,231 $ 232 $ 8,048,053 $ 8,049,516 $ 1,432 $ — $ 7,871,020 $ 7,872,452
Years Ended December 31, 2014 2013 2012 Balance at beginning of period $ 8,203,600 $ 5,514,065 $ 41,185 Total gains (realized/unrealized)
Included in earnings 383,795 (470,467 ) 167,094 Included in other comprehensive income (5,863 ) 15,532 3,768
Purchases/(Sales) (93,578 ) 3,218,301 4,212,009 Paydowns (80,451 ) (73,831 ) (28,034 ) Sale of real estate owned (3,395 ) — — Transfers — — 1,118,043 Balance at the end of period $ 8,404,108 $ 8,203,600 $ 5,514,065
Amounts included in interest income from multi-family loans held in securitization trusts and unrealized gain on multi-family loans and debt held in securitization trusts, net and realized gain (loss) on investment securities and related hedges, net.
Based on a number of factors, we determined that we were the primary beneficiary of one K-Series securitization as of January 4, 2012 and have consolidated its assets, liabilities, income and expenses in our consolidated financial statements.
F-36
(1)
(2)
(1)
(2)

The following table details changes in valuation for the Level 3 liabilities for the years ended December 31, 2014, 2013 and 2012,
respectively (amounts in thousands): Level 3 Liabilities:
The following table details the changes in unrealized gains (losses) included in earnings for our Level 3 assets and liabilities for the years
ended December 31, 2014, 2013 and 2012, respectively (dollar amounts in thousands):
Any changes to the valuation methodology are reviewed by management to ensure the changes are appropriate. As markets and products
develop and the pricing for certain products becomes more transparent, the Company continues to refine its valuation methodologies. The methods described above may produce a fair value calculation that may not be indicative of net realizable value or reflective of future fair values. Furthermore, while the Company believes its valuation methods are appropriate and consistent with other market participants, the use of different methodologies, or assumptions, to determine the fair value of certain financial instruments could result in a different estimate of fair value at the reporting date. The Company uses inputs that are current as of each reporting date, which may include periods of market dislocation, during which time price transparency may be reduced. This condition could cause the Company’s financial instruments to be reclassified from Level 2 to Level 3 in future periods.
Years Ended December 31,
2014 2013 2012
Balance at beginning of period $ 7,871,020 $ 5,319,573 $ — Total gains (realized/unrealized)
Included in earnings 260,872 (521,416 ) 152,440 Included in other comprehensive income — — —
Purchases — 3,146,676 4,077,276 Paydowns (83,839 ) (73,813 ) (28,034 ) Transfers — — 1,117,891 Balance at the end of period $ 8,048,053 $ 7,871,020 $ 5,319,573
Amounts included in interest expense on multi-family collateralized debt obligations and unrealized gain on multi-family loans and debt held in securitization trusts, net.
Based on a number of factors, we determined that we were the primary beneficiary of one K-Series securitization as of January 4, 2012 and have consolidated its assets, liabilities, income and expenses in our consolidated financial statements.
Years Ended December 31, 2014 2013 2012 Change in unrealized gains (losses) – assets $ 390,371 $ (423,949 ) $ 194,363 Change in unrealized (losses) gains – liabilities (333,440 ) 455,444 (187,701 )
Net change in unrealized gains included in earnings for assets and liabilities $ 56,931 $ 31,495 $ 6,662
F-37
(1)
(2)
(1)
(2)
The following table presents assets measured at fair value on a non-recurring basis as of December 31, 2014 and 2013, respectively, on the
consolidated balance sheets (dollar amounts in thousands):
The following table presents losses incurred for assets measured at fair value on a non-recurring basis for the years ended December 31,
2014, 2013 and 2012, respectively, on the Company’s consolidated statements of operations (dollar amounts in thousands):
Residential Mortgage Loans Held in Securitization Trusts – Impaired Loans (net) – Impaired residential mortgage loans held in
securitization trusts are recorded at amortized cost less specific loan loss reserves. Impaired loan value is based on management’s estimate of the net realizable value taking into consideration local market conditions of the property, updated appraisal values of the property and estimated expenses required to remediate the impaired loan.
Real Estate Owned Held in Residential Securitization Trusts – Real estate owned held in the residential securitization trusts are recorded at
net realizable value. Any subsequent adjustment will result in the reduction in carrying value with the corresponding amount charged to earnings. Net realizable value based on an estimate of disposal taking into consideration local market conditions of the property, updated appraisal values of the property and estimated expenses required to sell the property.
Assets Measured at Fair Value on a Non-Recurring Basis at December 31, 201 4 December 31, 201 3 Level 1 Level 2 Level 3 Total Level 1 Level 2 Level 3 Total Residential Mortgage loans
held in securitization trusts – impaired loans (net) $ $ $ 9,323 $ 9,323 $ — $ — $ 6,591 $ 6,591
Real estate owned held in residential securitization trusts 965 965 — — 1,108 1,108
Years Ended December 31, 2014 2013 2012 Residential mortgage loans held in securitization trusts – impaired loans (net) $ 998 $ 701 $ 707 Real estate owned held in residential securitization trusts 103 433 45
F-38
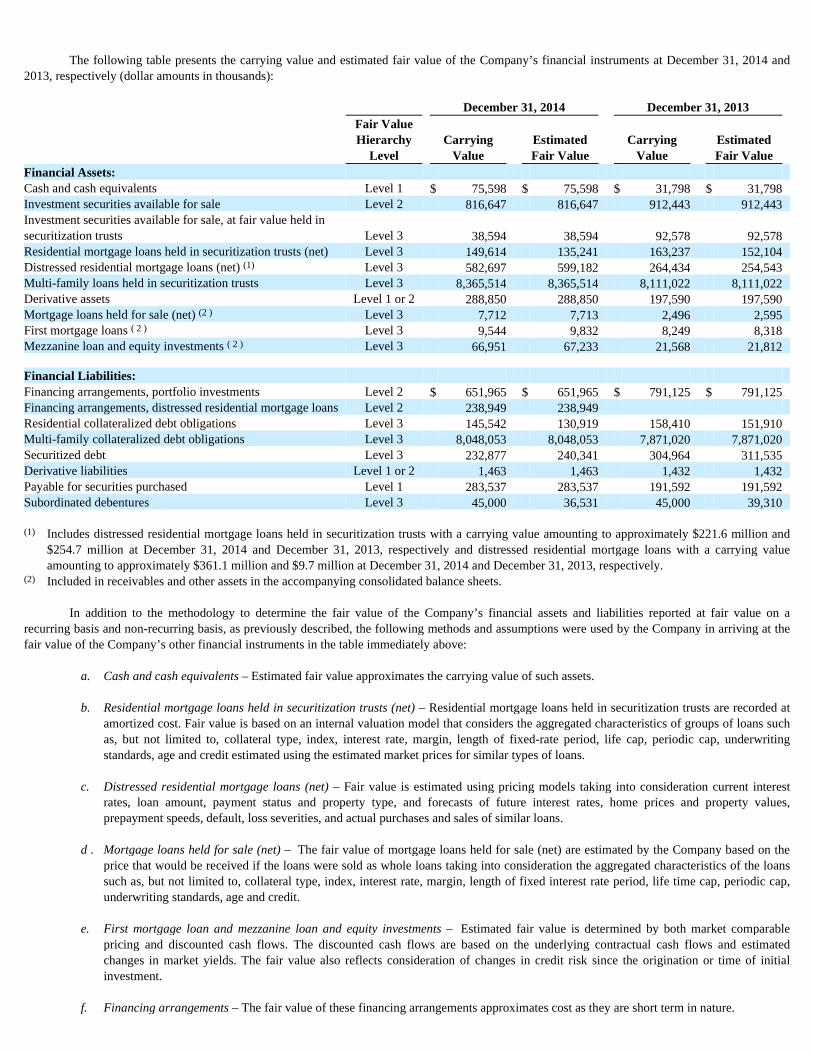
The following table presents the carrying value and estimated fair value of the Company’s financial instruments at December 31, 2014 and
2013, respectively (dollar amounts in thousands):
In addition to the methodology to determine the fair value of the Company’s financial assets and liabilities reported at fair value on a
recurring basis and non-recurring basis, as previously described, the following methods and assumptions were used by the Company in arriving at the fair value of the Company’s other financial instruments in the table immediately above:
December 31, 2014 December 31, 2013
Fair Value Hierarchy
Level Carrying
Value Estimated Fair Value
Carrying Value
Estimated Fair Value
Financial Assets: Cash and cash equivalents Level 1 $ 75,598 $ 75,598 $ 31,798 $ 31,798 Investment securities available for sale Level 2 816,647 816,647 912,443 912,443 Investment securities available for sale, at fair value held in securitization trusts Level 3 38,594 38,594 92,578 92,578 Residential mortgage loans held in securitization trusts (net) Level 3 149,614 135,241 163,237 152,104 Distressed residential mortgage loans (net) Level 3 582,697 599,182 264,434 254,543 Multi-family loans held in securitization trusts Level 3 8,365,514 8,365,514 8,111,022 8,111,022 Derivative assets Level 1 or 2 288,850 288,850 197,590 197,590 Mortgage loans held for sale (net) Level 3 7,712 7,713 2,496 2,595 First mortgage loans Level 3 9,544 9,832 8,249 8,318 Mezzanine loan and equity investments Level 3 66,951 67,233 21,568 21,812 Financial Liabilities: Financing arrangements, portfolio investments Level 2 $ 651,965 $ 651,965 $ 791,125 $ 791,125 Financing arrangements, distressed residential mortgage loans Level 2 238,949 238,949 Residential collateralized debt obligations Level 3 145,542 130,919 158,410 151,910 Multi-family collateralized debt obligations Level 3 8,048,053 8,048,053 7,871,020 7,871,020 Securitized debt Level 3 232,877 240,341 304,964 311,535 Derivative liabilities Level 1 or 2 1,463 1,463 1,432 1,432 Payable for securities purchased Level 1 283,537 283,537 191,592 191,592 Subordinated debentures Level 3 45,000 36,531 45,000 39,310
Includes distressed residential mortgage loans held in securitization trusts with a carrying value amounting to approximately $221.6 million and $254.7 million at December 31, 2014 and December 31, 2013, respectively and distressed residential mortgage loans with a carrying value amounting to approximately $361.1 million and $9.7 million at December 31, 2014 and December 31, 2013, respectively.
Included in receivables and other assets in the accompanying consolidated balance sheets.
a. Cash and cash equivalents – Estimated fair value approximates the carrying value of such assets.
b. Residential mortgage loans held in securitization trusts (net) – Residential mortgage loans held in securitization trusts are recorded at amortized cost. Fair value is based on an internal valuation model that considers the aggregated characteristics of groups of loans such as, but not limited to, collateral type, index, interest rate, margin, length of fixed-rate period, life cap, periodic cap, underwriting standards, age and credit estimated using the estimated market prices for similar types of loans.
c. Distressed residential mortgage loans (net) – Fair value is estimated using pricing models taking into consideration current interest
rates, loan amount, payment status and property type, and forecasts of future interest rates, home prices and property values, prepayment speeds, default, loss severities, and actual purchases and sales of similar loans.
d . Mortgage loans held for sale (net) – The fair value of mortgage loans held for sale (net) are estimated by the Company based on the price that would be received if the loans were sold as whole loans taking into consideration the aggregated characteristics of the loans such as, but not limited to, collateral type, index, interest rate, margin, length of fixed interest rate period, life time cap, periodic cap, underwriting standards, age and credit.
e. First mortgage loan and mezzanine loan and equity investments – Estimated fair value is determined by both market comparable pricing and discounted cash flows. The discounted cash flows are based on the underlying contractual cash flows and estimated changes in market yields. The fair value also reflects consideration of changes in credit risk since the origination or time of initial investment.
f. Financing arrangements – The fair value of these financing arrangements approximates cost as they are short term in nature.
(1)
(2 ) ( 2 )
( 2 )
(1)
(2)

g. Residential collateralized debt obligations – The fair value of these CDOs is based on discounted cash flows as well as market pricing
on comparable obligations.
h. Securitized debt – The fair value of securitized debt is based on discounted cash flows using management’s estimate for market yields.
i. Payable for securities purchased – Estimated fair value approximates the carrying value of such liabilities.
j. Subordinated debentures – The fair value of these subordinated debentures is based on discounted cash flows using management’s
estimate for market yields.
F-39
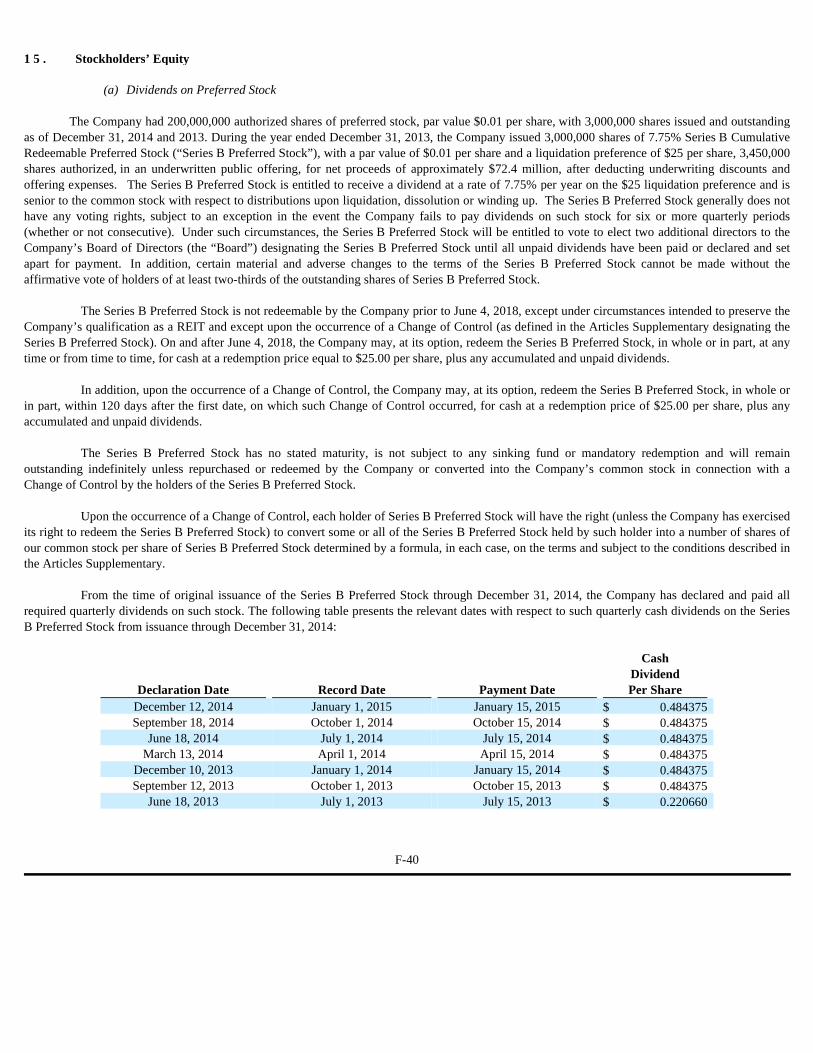
The Company had 200,000,000 authorized shares of preferred stock, par value $0.01 per share, with 3,000,000 shares issued and outstanding
as of December 31, 2014 and 2013. During the year ended December 31, 2013, the Company issued 3,000,000 shares of 7.75% Series B Cumulative Redeemable Preferred Stock (“Series B Preferred Stock”), with a par value of $0.01 per share and a liquidation preference of $25 per share, 3,450,000 shares authorized, in an underwritten public offering, for net proceeds of approximately $72.4 million, after deducting underwriting discounts and offering expenses. The Series B Preferred Stock is entitled to receive a dividend at a rate of 7.75% per year on the $25 liquidation preference and is senior to the common stock with respect to distributions upon liquidation, dissolution or winding up. The Series B Preferred Stock generally does not have any voting rights, subject to an exception in the event the Company fails to pay dividends on such stock for six or more quarterly periods (whether or not consecutive). Under such circumstances, the Series B Preferred Stock will be entitled to vote to elect two additional directors to the Company’s Board of Directors (the “Board”) designating the Series B Preferred Stock until all unpaid dividends have been paid or declared and set apart for payment. In addition, certain material and adverse changes to the terms of the Series B Preferred Stock cannot be made without the affirmative vote of holders of at least two-thirds of the outstanding shares of Series B Preferred Stock.
The Series B Preferred Stock is not redeemable by the Company prior to June 4, 2018, except under circumstances intended to preserve the Company’s qualification as a REIT and except upon the occurrence of a Change of Control (as defined in the Articles Supplementary designating the Series B Preferred Stock). On and after June 4, 2018, the Company may, at its option, redeem the Series B Preferred Stock, in whole or in part, at any time or from time to time, for cash at a redemption price equal to $25.00 per share, plus any accumulated and unpaid dividends.
In addition, upon the occurrence of a Change of Control, the Company may, at its option, redeem the Series B Preferred Stock, in whole or
in part, within 120 days after the first date, on which such Change of Control occurred, for cash at a redemption price of $25.00 per share, plus any accumulated and unpaid dividends.
The Series B Preferred Stock has no stated maturity, is not subject to any sinking fund or mandatory redemption and will remain
outstanding indefinitely unless repurchased or redeemed by the Company or converted into the Company’s common stock in connection with a Change of Control by the holders of the Series B Preferred Stock.
Upon the occurrence of a Change of Control, each holder of Series B Preferred Stock will have the right (unless the Company has exercised
its right to redeem the Series B Preferred Stock) to convert some or all of the Series B Preferred Stock held by such holder into a number of shares of our common stock per share of Series B Preferred Stock determined by a formula, in each case, on the terms and subject to the conditions described in the Articles Supplementary.
From the time of original issuance of the Series B Preferred Stock through December 31, 2014, the Company has declared and paid all
required quarterly dividends on such stock. The following table presents the relevant dates with respect to such quarterly cash dividends on the Series B Preferred Stock from issuance through December 31, 2014:
1 5 . Stockholders’ Equity
(a) Dividends on Preferred Stock
Declaration Date Record Date Payment Date
Cash Dividend Per Share
December 12, 2014 January 1, 2015 January 15, 2015 $ 0.484375 September 18, 2014 October 1, 2014 October 15, 2014 $ 0.484375
June 18, 2014 July 1, 2014 July 15, 2014 $ 0.484375 March 13, 2014 April 1, 2014 April 15, 2014 $ 0.484375
December 10, 2013 January 1, 2014 January 15, 2014 $ 0.484375 September 12, 2013 October 1, 2013 October 15, 2013 $ 0.484375
June 18, 2013 July 1, 2013 July 15, 2013 $ 0.220660
F-40
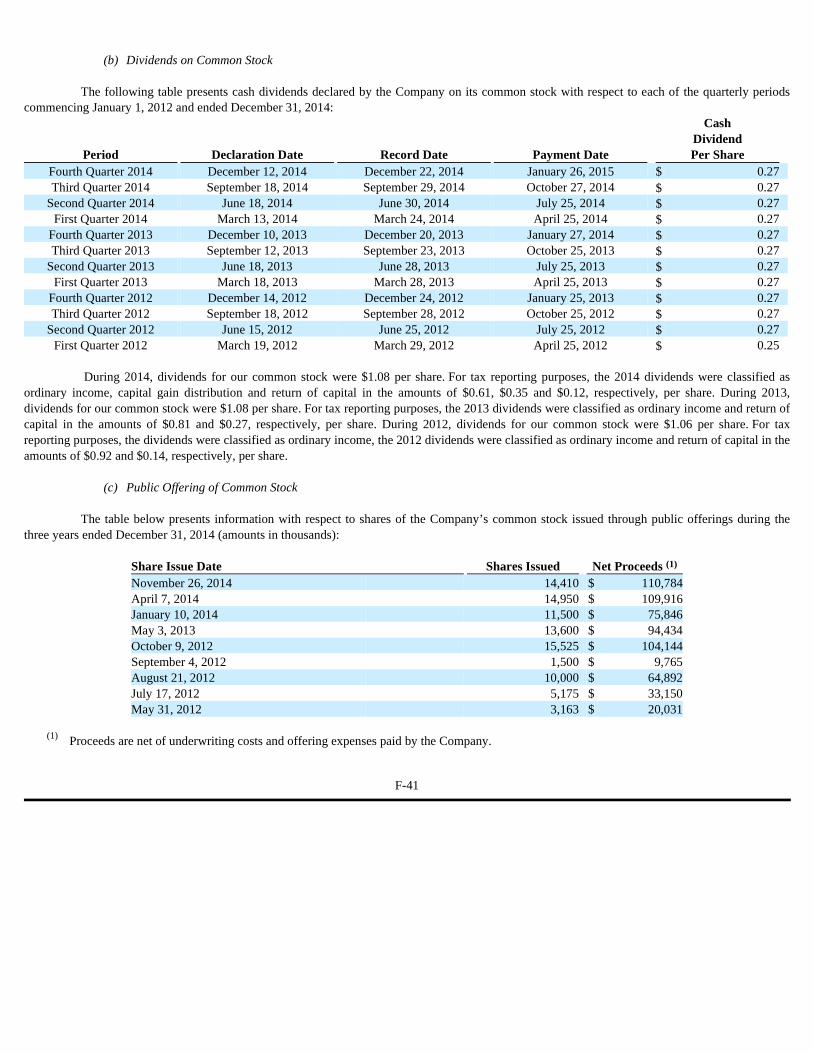
The following table presents cash dividends declared by the Company on its common stock with respect to each of the quarterly periods
commencing January 1, 2012 and ended December 31, 2014:
During 2014, dividends for our common stock were $1.08 per share. For tax reporting purposes, the 2014 dividends were classified as
ordinary income, capital gain distribution and return of capital in the amounts of $0.61, $0.35 and $0.12, respectively, per share. During 2013, dividends for our common stock were $1.08 per share. For tax reporting purposes, the 2013 dividends were classified as ordinary income and return of capital in the amounts of $0.81 and $0.27, respectively, per share. During 2012, dividends for our common stock were $1.06 per share. For tax reporting purposes, the dividends were classified as ordinary income, the 2012 dividends were classified as ordinary income and return of capital in the amounts of $0.92 and $0.14, respectively, per share.
The table below presents information with respect to shares of the Company’s common stock issued through public offerings during the
three years ended December 31, 2014 (amounts in thousands):
(b) Dividends on Common Stock
Period Declaration Date Record Date Payment Date
Cash Dividend Per Share
Fourth Quarter 2014 December 12, 2014 December 22, 2014 January 26, 2015 $ 0.27 Third Quarter 2014 September 18, 2014 September 29, 2014 October 27, 2014 $ 0.27
Second Quarter 2014 June 18, 2014 June 30, 2014 July 25, 2014 $ 0.27 First Quarter 2014 March 13, 2014 March 24, 2014 April 25, 2014 $ 0.27
Fourth Quarter 2013 December 10, 2013 December 20, 2013 January 27, 2014 $ 0.27 Third Quarter 2013 September 12, 2013 September 23, 2013 October 25, 2013 $ 0.27
Second Quarter 2013 June 18, 2013 June 28, 2013 July 25, 2013 $ 0.27 First Quarter 2013 March 18, 2013 March 28, 2013 April 25, 2013 $ 0.27
Fourth Quarter 2012 December 14, 2012 December 24, 2012 January 25, 2013 $ 0.27 Third Quarter 2012 September 18, 2012 September 28, 2012 October 25, 2012 $ 0.27
Second Quarter 2012 June 15, 2012 June 25, 2012 July 25, 2012 $ 0.27 First Quarter 2012 March 19, 2012 March 29, 2012 April 25, 2012 $ 0.25
(c) Public Offering of Common Stock
Share Issue Date Shares Issued Net Proceeds November 26, 2014 14,410 $ 110,784 April 7, 2014 14,950 $ 109,916 January 10, 2014 11,500 $ 75,846 May 3, 2013 13,600 $ 94,434 October 9, 2012 15,525 $ 104,144 September 4, 2012 1,500 $ 9,765 August 21, 2012 10,000 $ 64,892 July 17, 2012 5,175 $ 33,150 May 31, 2012 3,163 $ 20,031
Proceeds are net of underwriting costs and offering expenses paid by the Company.
F-41
(1)
(1)
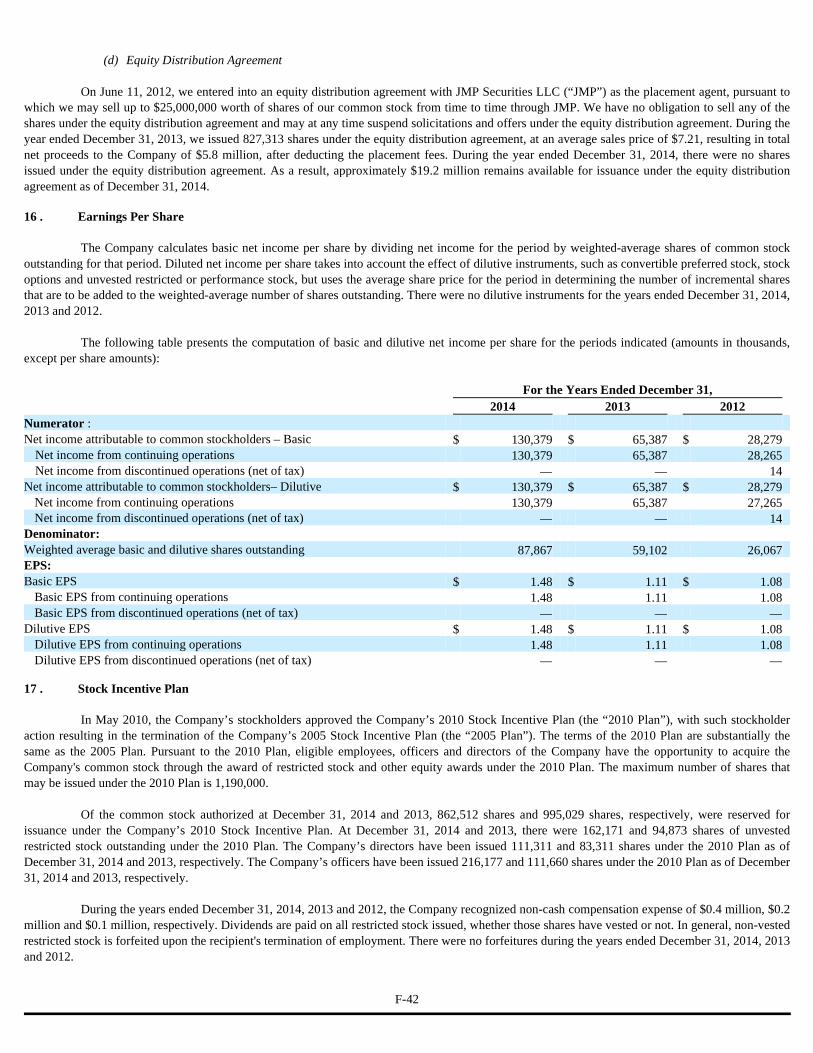
On June 11, 2012, we entered into an equity distribution agreement with JMP Securities LLC (“JMP”) as the placement agent, pursuant to
which we may sell up to $25,000,000 worth of shares of our common stock from time to time through JMP. We have no obligation to sell any of the shares under the equity distribution agreement and may at any time suspend solicitations and offers under the equity distribution agreement. During the year ended December 31, 2013, we issued 827,313 shares under the equity distribution agreement, at an average sales price of $7.21, resulting in total net proceeds to the Company of $5.8 million, after deducting the placement fees. During the year ended December 31, 2014, there were no shares issued under the equity distribution agreement. As a result, approximately $19.2 million remains available for issuance under the equity distribution agreement as of December 31, 2014.
The Company calculates basic net income per share by dividing net income for the period by weighted-average shares of common stock
outstanding for that period. Diluted net income per share takes into account the effect of dilutive instruments, such as convertible preferred stock, stock options and unvested restricted or performance stock, but uses the average share price for the period in determining the number of incremental shares that are to be added to the weighted-average number of shares outstanding. There were no dilutive instruments for the years ended December 31, 2014, 2013 and 2012.
The following table presents the computation of basic and dilutive net income per share for the periods indicated (amounts in thousands, except per share amounts):
In May 2010, the Company’s stockholders approved the Company’s 2010 Stock Incentive Plan (the “2010 Plan”), with such stockholder
action resulting in the termination of the Company’s 2005 Stock Incentive Plan (the “2005 Plan”). The terms of the 2010 Plan are substantially the same as the 2005 Plan. Pursuant to the 2010 Plan, eligible employees, officers and directors of the Company have the opportunity to acquire the Company's common stock through the award of restricted stock and other equity awards under the 2010 Plan. The maximum number of shares that may be issued under the 2010 Plan is 1,190,000.
Of the common stock authorized at December 31, 2014 and 2013, 862,512 shares and 995,029 shares, respectively, were reserved for
issuance under the Company’s 2010 Stock Incentive Plan. At December 31, 2014 and 2013, there were 162,171 and 94,873 shares of unvested restricted stock outstanding under the 2010 Plan. The Company’s directors have been issued 111,311 and 83,311 shares under the 2010 Plan as of December 31, 2014 and 2013, respectively. The Company’s officers have been issued 216,177 and 111,660 shares under the 2010 Plan as of December 31, 2014 and 2013, respectively.
During the years ended December 31, 2014, 2013 and 2012, the Company recognized non-cash compensation expense of $0.4 million, $0.2 million and $0.1 million, respectively. Dividends are paid on all restricted stock issued, whether those shares have vested or not. In general, non-vested restricted stock is forfeited upon the recipient's termination of employment. There were no forfeitures during the years ended December 31, 2014, 2013 and 2012.
(d) Equity Distribution Agreement
16 . Earnings Per Share
For the Years Ended December 31, 2014 2013 2012 Numerator : Net income attributable to common stockholders – Basic $ 130,379 $ 65,387 $ 28,279
Net income from continuing operations 130,379 65,387 28,265 Net income from discontinued operations (net of tax) — — 14
Net income attributable to common stockholders– Dilutive $ 130,379 $ 65,387 $ 28,279 Net income from continuing operations 130,379 65,387 27,265 Net income from discontinued operations (net of tax) — — 14
Denominator: Weighted average basic and dilutive shares outstanding 87,867 59,102 26,067 EPS: Basic EPS $ 1.48 $ 1.11 $ 1.08
Basic EPS from continuing operations 1.48 1.11 1.08 Basic EPS from discontinued operations (net of tax) — — —
Dilutive EPS $ 1.48 $ 1.11 $ 1.08 Dilutive EPS from continuing operations 1.48 1.11 1.08 Dilutive EPS from discontinued operations (net of tax) — — —
17 . Stock Incentive Plan
F-42
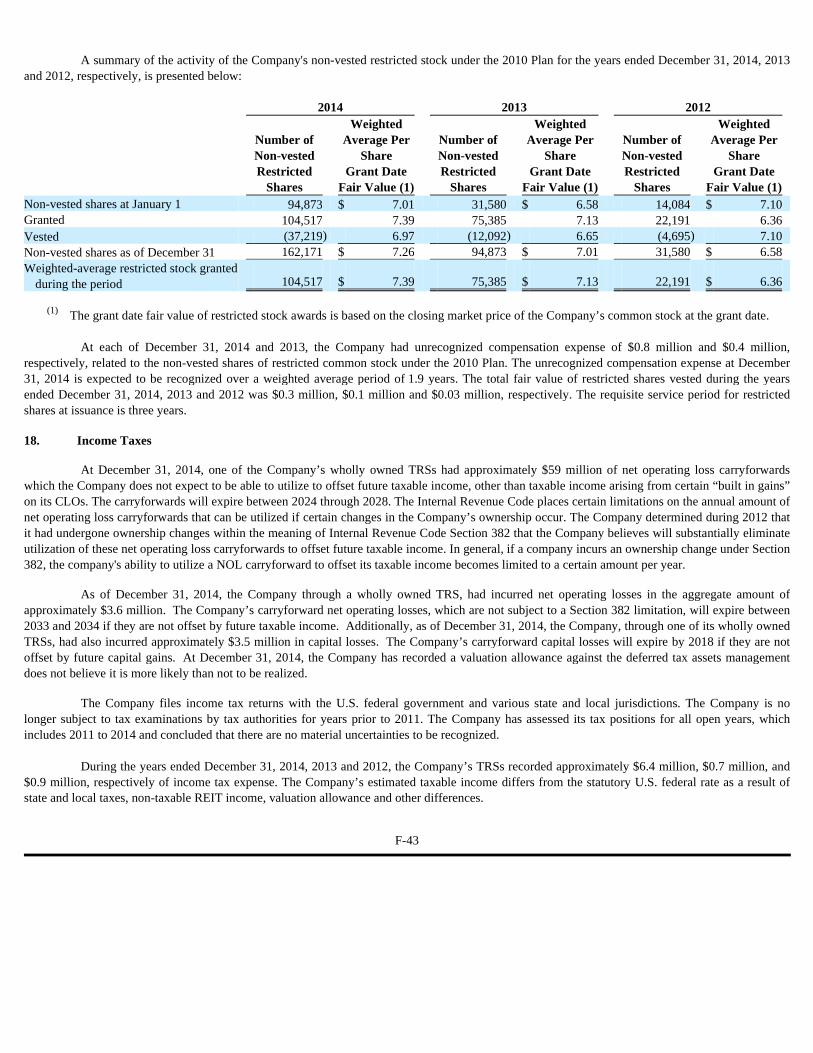
A summary of the activity of the Company's non-vested restricted stock under the 2010 Plan for the years ended December 31, 2014, 2013
and 2012, respectively, is presented below:
At each of December 31, 2014 and 2013, the Company had unrecognized compensation expense of $0.8 million and $0.4 million,
respectively, related to the non-vested shares of restricted common stock under the 2010 Plan. The unrecognized compensation expense at December 31, 2014 is expected to be recognized over a weighted average period of 1.9 years. The total fair value of restricted shares vested during the years ended December 31, 2014, 2013 and 2012 was $0.3 million, $0.1 million and $0.03 million, respectively. The requisite service period for restricted shares at issuance is three years.
At December 31, 2014, one of the Company’s wholly owned TRSs had approximately $59 million of net operating loss carryforwards
which the Company does not expect to be able to utilize to offset future taxable income, other than taxable income arising from certain “built in gains”on its CLOs. The carryforwards will expire between 2024 through 2028. The Internal Revenue Code places certain limitations on the annual amount of net operating loss carryforwards that can be utilized if certain changes in the Company’s ownership occur. The Company determined during 2012 that it had undergone ownership changes within the meaning of Internal Revenue Code Section 382 that the Company believes will substantially eliminate utilization of these net operating loss carryforwards to offset future taxable income. In general, if a company incurs an ownership change under Section 382, the company's ability to utilize a NOL carryforward to offset its taxable income becomes limited to a certain amount per year.
As of December 31, 2014, the Company through a wholly owned TRS, had incurred net operating losses in the aggregate amount of approximately $3.6 million. The Company’s carryforward net operating losses, which are not subject to a Section 382 limitation, will expire between 2033 and 2034 if they are not offset by future taxable income. Additionally, as of December 31, 2014, the Company, through one of its wholly owned TRSs, had also incurred approximately $3.5 million in capital losses. The Company’s carryforward capital losses will expire by 2018 if they are not offset by future capital gains. At December 31, 2014, the Company has recorded a valuation allowance against the deferred tax assets management does not believe it is more likely than not to be realized.
The Company files income tax returns with the U.S. federal government and various state and local jurisdictions. The Company is no longer subject to tax examinations by tax authorities for years prior to 2011. The Company has assessed its tax positions for all open years, which includes 2011 to 2014 and concluded that there are no material uncertainties to be recognized.
During the years ended December 31, 2014, 2013 and 2012, the Company’s TRSs recorded approximately $6.4 million, $0.7 million, and
$0.9 million, respectively of income tax expense. The Company’s estimated taxable income differs from the statutory U.S. federal rate as a result of state and local taxes, non-taxable REIT income, valuation allowance and other differences.
2014 2013 2012
Number of Non-vested Restricted
Shares
Weighted Average Per
Share Grant Date
Fair Value (1)
Number of Non-vested Restricted
Shares
Weighted Average Per
Share Grant Date
Fair Value (1)
Number of Non-vested Restricted
Shares
Weighted Average Per
Share Grant Date
Fair Value (1) Non-vested shares at January 1 94,873 $ 7.01 31,580 $ 6.58 14,084 $ 7.10 Granted 104,517 7.39 75,385 7.13 22,191 6.36 Vested (37,219 ) 6.97 (12,092 ) 6.65 (4,695 ) 7.10 Non-vested shares as of December 31 162,171 $ 7.26 94,873 $ 7.01 31,580 $ 6.58 Weighted-average restricted stock granted
during the period 104,517 $ 7.39 75,385 $ 7.13 22,191 $ 6.36
The grant date fair value of restricted stock awards is based on the closing market price of the Company’s common stock at the grant date.
18. Income Taxes
F-43
(1)
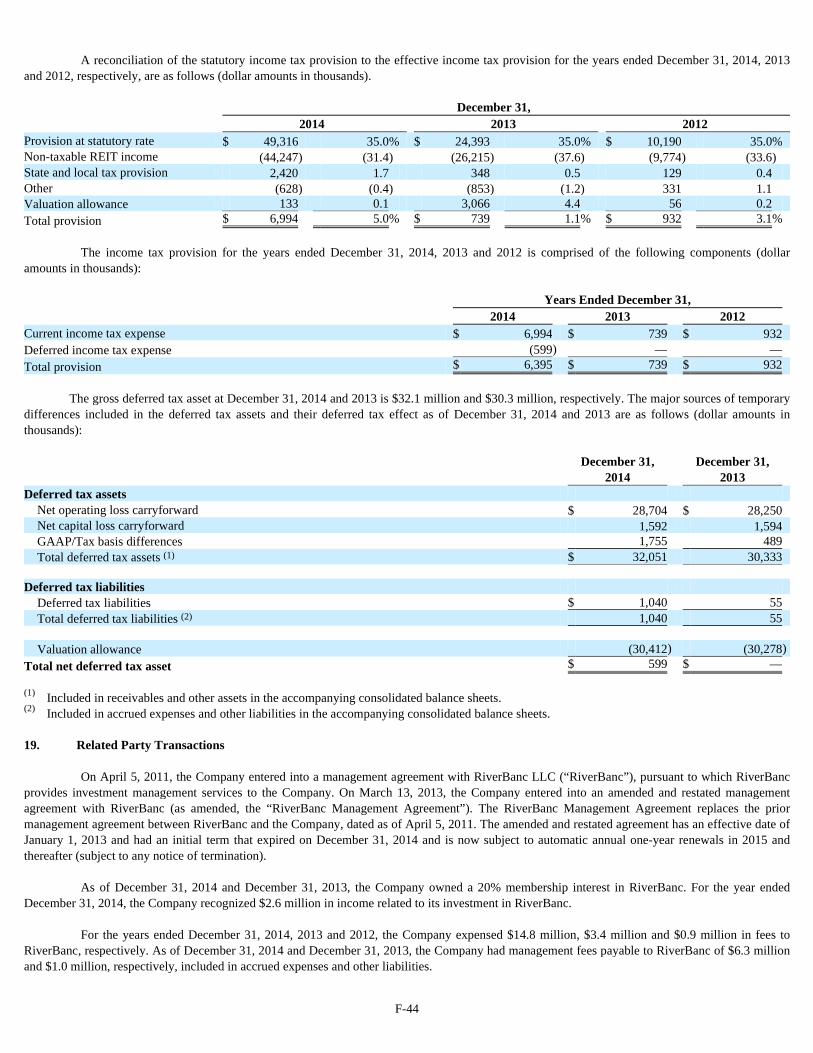
A reconciliation of the statutory income tax provision to the effective income tax provision for the years ended December 31, 2014, 2013
and 2012, respectively, are as follows (dollar amounts in thousands).
The income tax provision for the years ended December 31, 2014, 2013 and 2012 is comprised of the following components (dollar
amounts in thousands):
The gross deferred tax asset at December 31, 2014 and 2013 is $32.1 million and $30.3 million, respectively. The major sources of temporary
differences included in the deferred tax assets and their deferred tax effect as of December 31, 2014 and 2013 are as follows (dollar amounts in thousands):
On April 5, 2011, the Company entered into a management agreement with RiverBanc LLC (“RiverBanc”), pursuant to which RiverBanc
provides investment management services to the Company. On March 13, 2013, the Company entered into an amended and restated management agreement with RiverBanc (as amended, the “RiverBanc Management Agreement”). The RiverBanc Management Agreement replaces the prior management agreement between RiverBanc and the Company, dated as of April 5, 2011. The amended and restated agreement has an effective date of January 1, 2013 and had an initial term that expired on December 31, 2014 and is now subject to automatic annual one-year renewals in 2015 and thereafter (subject to any notice of termination).
As of December 31, 2014 and December 31, 2013, the Company owned a 20% membership interest in RiverBanc. For the year ended
December 31, 2014, the Company recognized $2.6 million in income related to its investment in RiverBanc. For the years ended December 31, 2014, 2013 and 2012, the Company expensed $14.8 million, $3.4 million and $0.9 million in fees to
RiverBanc, respectively. As of December 31, 2014 and December 31, 2013, the Company had management fees payable to RiverBanc of $6.3 million and $1.0 million, respectively, included in accrued expenses and other liabilities.
December 31,
2014 2013 2012 Provision at statutory rate $ 49,316 35.0 % $ 24,393 35.0 % $ 10,190 35.0 % Non-taxable REIT income (44,247 ) (31.4 ) (26,215 ) (37.6 ) (9,774 ) (33.6 ) State and local tax provision 2,420 1.7 348 0.5 129 0.4 Other (628 ) (0.4 ) (853 ) (1.2 ) 331 1.1 Valuation allowance 133 0.1 3,066 4.4 56 0.2 Total provision $ 6,994 5.0 % $ 739 1.1 % $ 932 3.1 %
Years Ended December 31, 2014 2013 2012 Current income tax expense $ 6,994 $ 739 $ 932 Deferred income tax expense (599 ) — — Total provision $ 6,395 $ 739 $ 932
December 31,
2014 December 31,
2013 Deferred tax assets
Net operating loss carryforward $ 28,704 $ 28,250 Net capital loss carryforward 1,592 1,594 GAAP/Tax basis differences 1,755 489 Total deferred tax assets $ 32,051 30,333
Deferred tax liabilities
Deferred tax liabilities $ 1,040 55 Total deferred tax liabilities 1,040 55
Valuation allowance (30,412 ) (30,278 )
Total net deferred tax asset $ 599 $ —
Included in receivables and other assets in the accompanying consolidated balance sheets. Included in accrued expenses and other liabilities in the accompanying consolidated balance sheets.
19. Related Party Transactions
F-44
(1)
(2)
(1) (2)

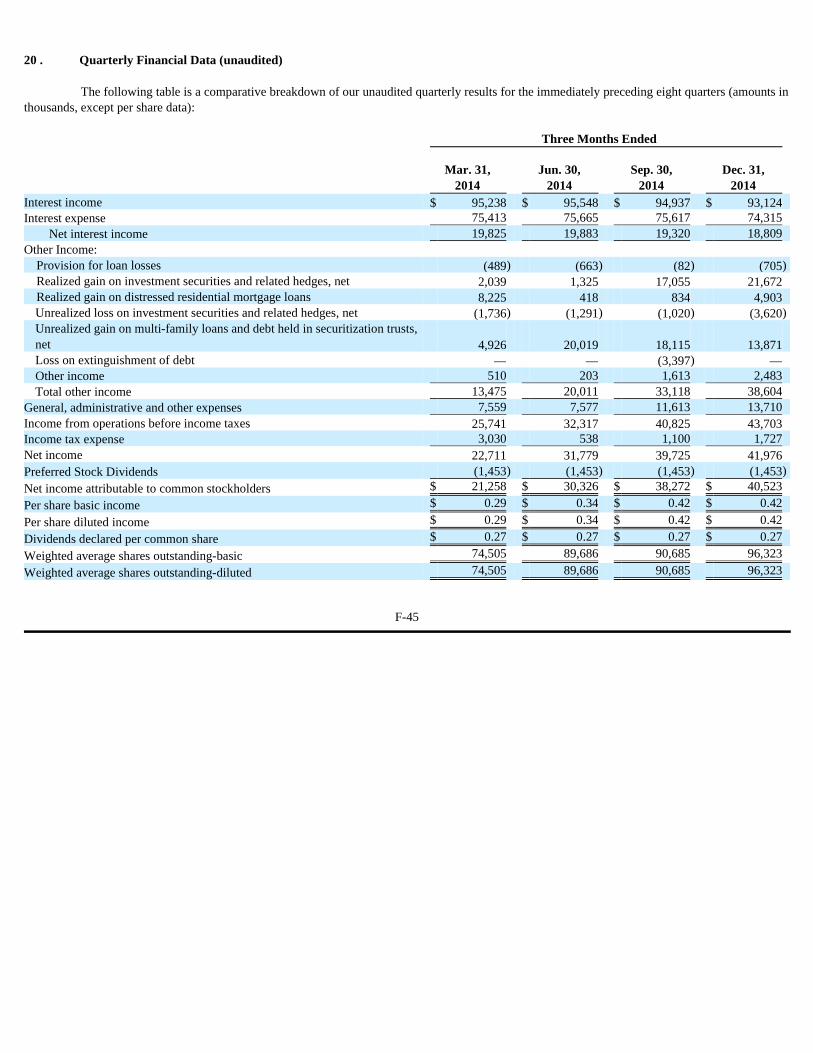
The following table is a comparative breakdown of our unaudited quarterly results for the immediately preceding eight quarters (amounts in
thousands, except per share data):
20 . Quarterly Financial Data (unaudited)
Three Months Ended
Mar. 31,
2014 Jun. 30,
2014 Sep. 30,
2014 Dec. 31,
2014 Interest income $ 95,238 $ 95,548 $ 94,937 $ 93,124 Interest expense 75,413 75,665 75,617 74,315
Net interest income 19,825 19,883 19,320 18,809 Other Income:
Provision for loan losses (489 ) (663 ) (82 ) (705 ) Realized gain on investment securities and related hedges, net 2,039 1,325 17,055 21,672 Realized gain on distressed residential mortgage loans 8,225 418 834 4,903 Unrealized loss on investment securities and related hedges, net (1,736 ) (1,291 ) (1,020 ) (3,620 ) Unrealized gain on multi-family loans and debt held in securitization trusts, net 4,926 20,019 18,115 13,871 Loss on extinguishment of debt — — (3,397 ) — Other income 510 203 1,613 2,483 Total other income 13,475 20,011 33,118 38,604
General, administrative and other expenses 7,559 7,577 11,613 13,710 Income from operations before income taxes 25,741 32,317 40,825 43,703 Income tax expense 3,030 538 1,100 1,727 Net income 22,711 31,779 39,725 41,976 Preferred Stock Dividends (1,453 ) (1,453 ) (1,453 ) (1,453 )
Net income attributable to common stockholders $ 21,258 $ 30,326 $ 38,272 $ 40,523
Per share basic income $ 0.29 $ 0.34 $ 0.42 $ 0.42
Per share diluted income $ 0.29 $ 0.34 $ 0.42 $ 0.42
Dividends declared per common share $ 0.27 $ 0.27 $ 0.27 $ 0.27
Weighted average shares outstanding-basic 74,505 89,686 90,685 96,323
Weighted average shares outstanding-diluted 74,505 89,686 90,685 96,323
F-45
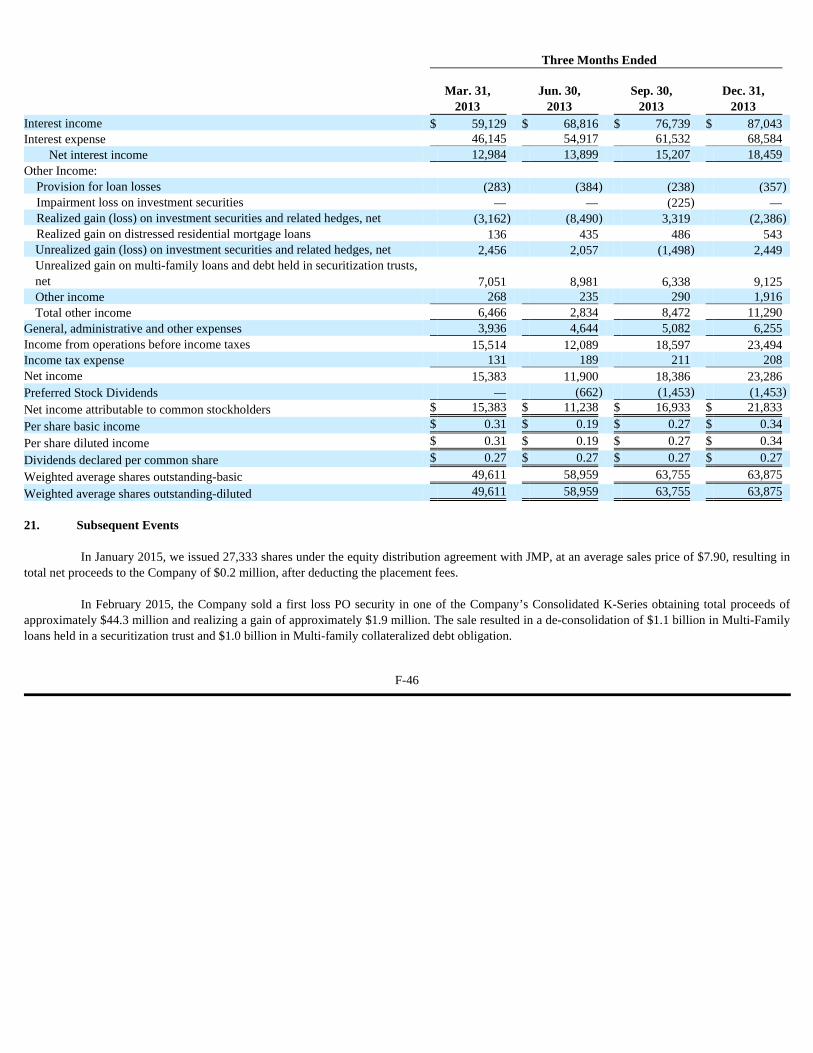
In January 2015, we issued 27,333 shares under the equity distribution agreement with JMP, at an average sales price of $7.90, resulting in
total net proceeds to the Company of $0.2 million, after deducting the placement fees. In February 2015, the Company sold a first loss PO security in one of the Company’s Consolidated K-Series obtaining total proceeds of
approximately $44.3 million and realizing a gain of approximately $1.9 million. The sale resulted in a de-consolidation of $1.1 billion in Multi-Family loans held in a securitization trust and $1.0 billion in Multi-family collateralized debt obligation.
Three Months Ended
Mar. 31,
2013 Jun. 30,
2013 Sep. 30,
2013 Dec. 31,
2013 Interest income $ 59,129 $ 68,816 $ 76,739 $ 87,043 Interest expense 46,145 54,917 61,532 68,584
Net interest income 12,984 13,899 15,207 18,459 Other Income:
Provision for loan losses (283 ) (384 ) (238 ) (357 ) Impairment loss on investment securities — — (225 ) — Realized gain (loss) on investment securities and related hedges, net (3,162 ) (8,490 ) 3,319 (2,386 ) Realized gain on distressed residential mortgage loans 136 435 486 543 Unrealized gain (loss) on investment securities and related hedges, net 2,456 2,057 (1,498 ) 2,449 Unrealized gain on multi-family loans and debt held in securitization trusts, net 7,051 8,981 6,338 9,125 Other income 268 235 290 1,916 Total other income 6,466 2,834 8,472 11,290
General, administrative and other expenses 3,936 4,644 5,082 6,255 Income from operations before income taxes 15,514 12,089 18,597 23,494 Income tax expense 131 189 211 208 Net income 15,383 11,900 18,386 23,286 Preferred Stock Dividends — (662 ) (1,453 ) (1,453 )
Net income attributable to common stockholders $ 15,383 $ 11,238 $ 16,933 $ 21,833
Per share basic income $ 0.31 $ 0.19 $ 0.27 $ 0.34
Per share diluted income $ 0.31 $ 0.19 $ 0.27 $ 0.34
Dividends declared per common share $ 0.27 $ 0.27 $ 0.27 $ 0.27
Weighted average shares outstanding-basic 49,611 58,959 63,755 63,875
Weighted average shares outstanding-diluted 49,611 58,959 63,755 63,875
21. Subsequent Events
F-46
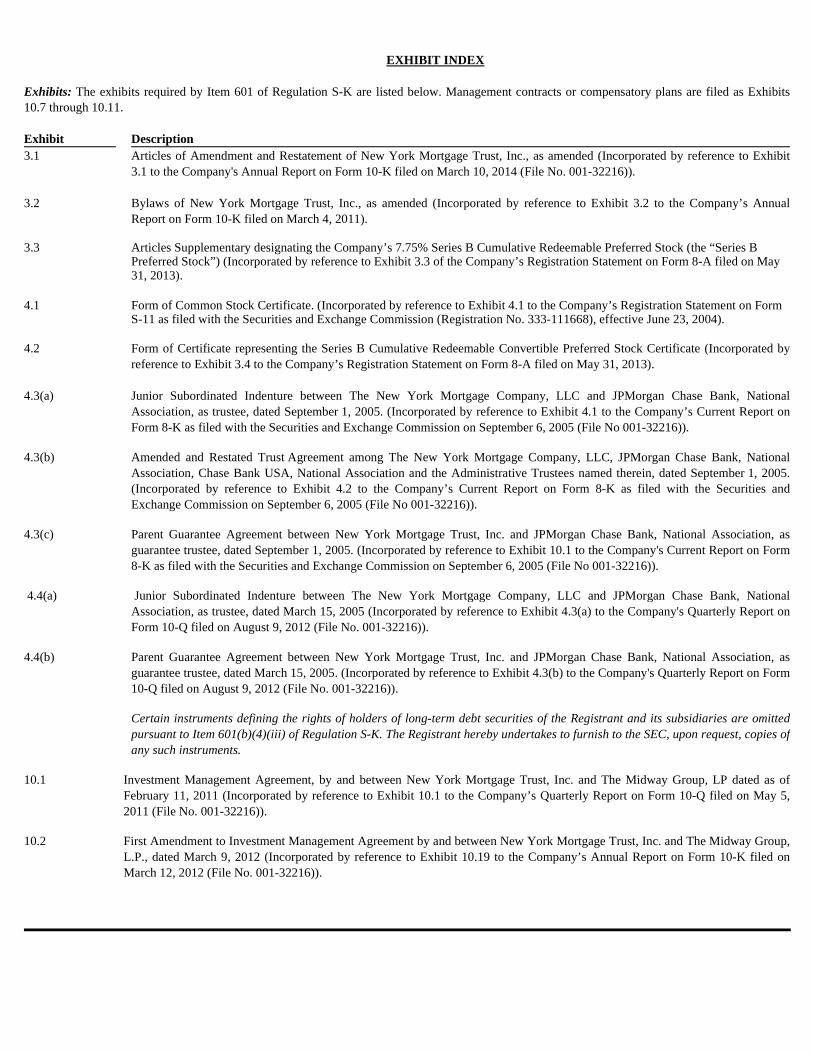
EXHIBIT INDEX
Exhibits: The exhibits required by Item 601 of Regulation S-K are listed below. Management contracts or compensatory plans are filed as Exhibits 10.7 through 10.11.
Exhibit Description 3.1 Articles of Amendment and Restatement of New York Mortgage Trust, Inc., as amended (Incorporated by reference to Exhibit
3.1 to the Company's Annual Report on Form 10-K filed on March 10, 2014 (File No. 001-32216)). 3.2 Bylaws of New York Mortgage Trust, Inc., as amended (Incorporated by reference to Exhibit 3.2 to the Company’s Annual
Report on Form 10-K filed on March 4, 2011). 3.3 Articles Supplementary designating the Company’s 7.75% Series B Cumulative Redeemable Preferred Stock (the “Series B
Preferred Stock”) (Incorporated by reference to Exhibit 3.3 of the Company’s Registration Statement on Form 8-A filed on May 31, 2013).
4.1 Form of Common Stock Certificate. (Incorporated by reference to Exhibit 4.1 to the Company’s Registration Statement on Form
S-11 as filed with the Securities and Exchange Commission (Registration No. 333-111668), effective June 23, 2004). 4.2 Form of Certificate representing the Series B Cumulative Redeemable Convertible Preferred Stock Certificate (Incorporated by
reference to Exhibit 3.4 to the Company’s Registration Statement on Form 8-A filed on May 31, 2013). 4.3(a) Junior Subordinated Indenture between The New York Mortgage Company, LLC and JPMorgan Chase Bank, National
Association, as trustee, dated September 1, 2005. (Incorporated by reference to Exhibit 4.1 to the Company’s Current Report on Form 8-K as filed with the Securities and Exchange Commission on September 6, 2005 (File No 001-32216)).
4.3(b)
Amended and Restated Trust Agreement among The New York Mortgage Company, LLC, JPMorgan Chase Bank, National Association, Chase Bank USA, National Association and the Administrative Trustees named therein, dated September 1, 2005. (Incorporated by reference to Exhibit 4.2 to the Company’s Current Report on Form 8-K as filed with the Securities and Exchange Commission on September 6, 2005 (File No 001-32216)).
4.3(c) Parent Guarantee Agreement between New York Mortgage Trust, Inc. and JPMorgan Chase Bank, National Association, as
guarantee trustee, dated September 1, 2005. (Incorporated by reference to Exhibit 10.1 to the Company's Current Report on Form 8-K as filed with the Securities and Exchange Commission on September 6, 2005 (File No 001-32216)).
4.4(a) Junior Subordinated Indenture between The New York Mortgage Company, LLC and JPMorgan Chase Bank, National
Association, as trustee, dated March 15, 2005 (Incorporated by reference to Exhibit 4.3(a) to the Company's Quarterly Report on Form 10-Q filed on August 9, 2012 (File No. 001-32216)).
4.4(b) Parent Guarantee Agreement between New York Mortgage Trust, Inc. and JPMorgan Chase Bank, National Association, as
guarantee trustee, dated March 15, 2005. (Incorporated by reference to Exhibit 4.3(b) to the Company's Quarterly Report on Form 10-Q filed on August 9, 2012 (File No. 001-32216)).
Certain instruments defining the rights of holders of long-term debt securities of the Registrant and its subsidiaries are omitted pursuant to Item 601(b)(4)(iii) of Regulation S-K. The Registrant hereby undertakes to furnish to the SEC, upon request, copies of any such instruments.
10.1 Investment Management Agreement, by and between New York Mortgage Trust, Inc. and The Midway Group, LP dated as of
February 11, 2011 (Incorporated by reference to Exhibit 10.1 to the Company’s Quarterly Report on Form 10-Q filed on May 5, 2011 (File No. 001-32216)).
10.2
First Amendment to Investment Management Agreement by and between New York Mortgage Trust, Inc. and The Midway Group, L.P., dated March 9, 2012 (Incorporated by reference to Exhibit 10.19 to the Company’s Annual Report on Form 10-K filed on March 12, 2012 (File No. 001-32216)).
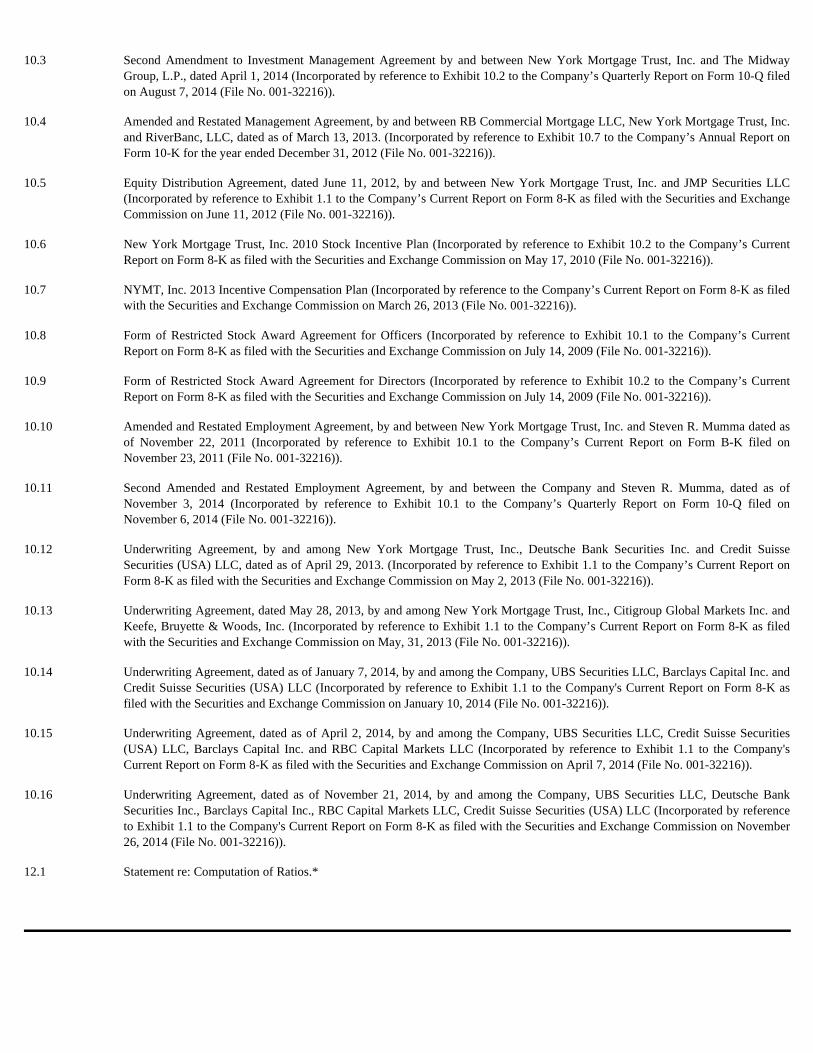
10.3 Second Amendment to Investment Management Agreement by and between New York Mortgage Trust, Inc. and The Midway Group, L.P., dated April 1, 2014 (Incorporated by reference to Exhibit 10.2 to the Company’s Quarterly Report on Form 10-Q filed on August 7, 2014 (File No. 001-32216)).
10.4 Amended and Restated Management Agreement, by and between RB Commercial Mortgage LLC, New York Mortgage Trust, Inc.
and RiverBanc, LLC, dated as of March 13, 2013. (Incorporated by reference to Exhibit 10.7 to the Company’s Annual Report on Form 10-K for the year ended December 31, 2012 (File No. 001-32216)).
10.5 Equity Distribution Agreement, dated June 11, 2012, by and between New York Mortgage Trust, Inc. and JMP Securities LLC
(Incorporated by reference to Exhibit 1.1 to the Company’s Current Report on Form 8-K as filed with the Securities and Exchange Commission on June 11, 2012 (File No. 001-32216)).
10.6 New York Mortgage Trust, Inc. 2010 Stock Incentive Plan (Incorporated by reference to Exhibit 10.2 to the Company’s Current
Report on Form 8-K as filed with the Securities and Exchange Commission on May 17, 2010 (File No. 001-32216)). 10.7 NYMT, Inc. 2013 Incentive Compensation Plan (Incorporated by reference to the Company’s Current Report on Form 8-K as filed
with the Securities and Exchange Commission on March 26, 2013 (File No. 001-32216)). 10.8 Form of Restricted Stock Award Agreement for Officers (Incorporated by reference to Exhibit 10.1 to the Company’s Current
Report on Form 8-K as filed with the Securities and Exchange Commission on July 14, 2009 (File No. 001-32216)). 10.9 Form of Restricted Stock Award Agreement for Directors (Incorporated by reference to Exhibit 10.2 to the Company’s Current
Report on Form 8-K as filed with the Securities and Exchange Commission on July 14, 2009 (File No. 001-32216)). 10.10 Amended and Restated Employment Agreement, by and between New York Mortgage Trust, Inc. and Steven R. Mumma dated as
of November 22, 2011 (Incorporated by reference to Exhibit 10.1 to the Company’s Current Report on Form B-K filed on November 23, 2011 (File No. 001-32216)).
10.11 Second Amended and Restated Employment Agreement, by and between the Company and Steven R. Mumma, dated as of
November 3, 2014 (Incorporated by reference to Exhibit 10.1 to the Company’s Quarterly Report on Form 10-Q filed on November 6, 2014 (File No. 001-32216)).
10.12 Underwriting Agreement, by and among New York Mortgage Trust, Inc., Deutsche Bank Securities Inc. and Credit Suisse
Securities (USA) LLC, dated as of April 29, 2013. (Incorporated by reference to Exhibit 1.1 to the Company’s Current Report on Form 8-K as filed with the Securities and Exchange Commission on May 2, 2013 (File No. 001-32216)).
10.13 Underwriting Agreement, dated May 28, 2013, by and among New York Mortgage Trust, Inc., Citigroup Global Markets Inc. and
Keefe, Bruyette & Woods, Inc. (Incorporated by reference to Exhibit 1.1 to the Company’s Current Report on Form 8-K as filed with the Securities and Exchange Commission on May, 31, 2013 (File No. 001-32216)).
10.14 Underwriting Agreement, dated as of January 7, 2014, by and among the Company, UBS Securities LLC, Barclays Capital Inc. and
Credit Suisse Securities (USA) LLC (Incorporated by reference to Exhibit 1.1 to the Company's Current Report on Form 8-K as filed with the Securities and Exchange Commission on January 10, 2014 (File No. 001-32216)).
10.15 Underwriting Agreement, dated as of April 2, 2014, by and among the Company, UBS Securities LLC, Credit Suisse Securities
(USA) LLC, Barclays Capital Inc. and RBC Capital Markets LLC (Incorporated by reference to Exhibit 1.1 to the Company's Current Report on Form 8-K as filed with the Securities and Exchange Commission on April 7, 2014 (File No. 001-32216)).
10.16 Underwriting Agreement, dated as of November 21, 2014, by and among the Company, UBS Securities LLC, Deutsche Bank
Securities Inc., Barclays Capital Inc., RBC Capital Markets LLC, Credit Suisse Securities (USA) LLC (Incorporated by reference to Exhibit 1.1 to the Company's Current Report on Form 8-K as filed with the Securities and Exchange Commission on November 26, 2014 (File No. 001-32216)).
12.1 Statement re: Computation of Ratios.*

21.1 List of Subsidiaries of the Registrant.* 23.1 Consent of Independent Registered Public Accounting Firm (Grant Thornton LLP).* 31.1 Certification of Chief Executive Officer pursuant to Rule 13a-14(a)/15d-14(a) of the Securities Exchange Act of 1934, as amended,
as adopted pursuant to Section 302 of the Sarbanes-Oxley Act of 2002.* 31.2 Certification of Chief Financial Officer pursuant to Rule 13a-14(a)/15d-14(a) of the Securities Exchange Act of 1934, as amended,
as adopted pursuant to Section 302 of the Sarbanes-Oxley Act of 2002.* 32.1 Certification of Chief Executive Officer and Chief Financial Officer pursuant to 18 U.S.C. 1350, as adopted pursuant to Section
906 of the Sarbanes-Oxley Act of 2002** 101.INS 101.SCH 101.CAL 101.DEF XBRL 101.LAB 101.PRE
XBRL Instance Document *** Taxonomy Extension Schema Document *** Taxonomy Extension Calculation Linkbase Document *** Taxonomy Extension Definition Linkbase Document *** Taxonomy Extension Label Linkbase Document *** Taxonomy Extension Presentation Linkbase Document ***
* Filed herewith.
** Furnished herewith. Such certification shall not be deemed “filed” for the purposes of Section 18 of the Securities Exchange Act of 1934, as amended.
*** Submitted electronically herewith. Attached as Exhibit 101 to this report are the following documents formatted in XBRL (Extensible Business Reporting Language): (i) Consolidated Balance Sheets at December 31, 2014 and 2013; (ii) Consolidated Statements of Operations for the years ended December 31, 2014, 2013 and 2012; (iii) Consolidated Statements of Comprehensive Income (Loss) for the years ended December 31, 2014, 2013 and 2012; (iv) Consolidated Statements of Changes in Stockholders’ Equity for the years ended December 31, 2014, 2013 and 2012; (v) Consolidated Statements of Cash Flows for the years ended December 31, 2014, 2013 and 2012; and (vi) Notes to Consolidated Financial Statements.
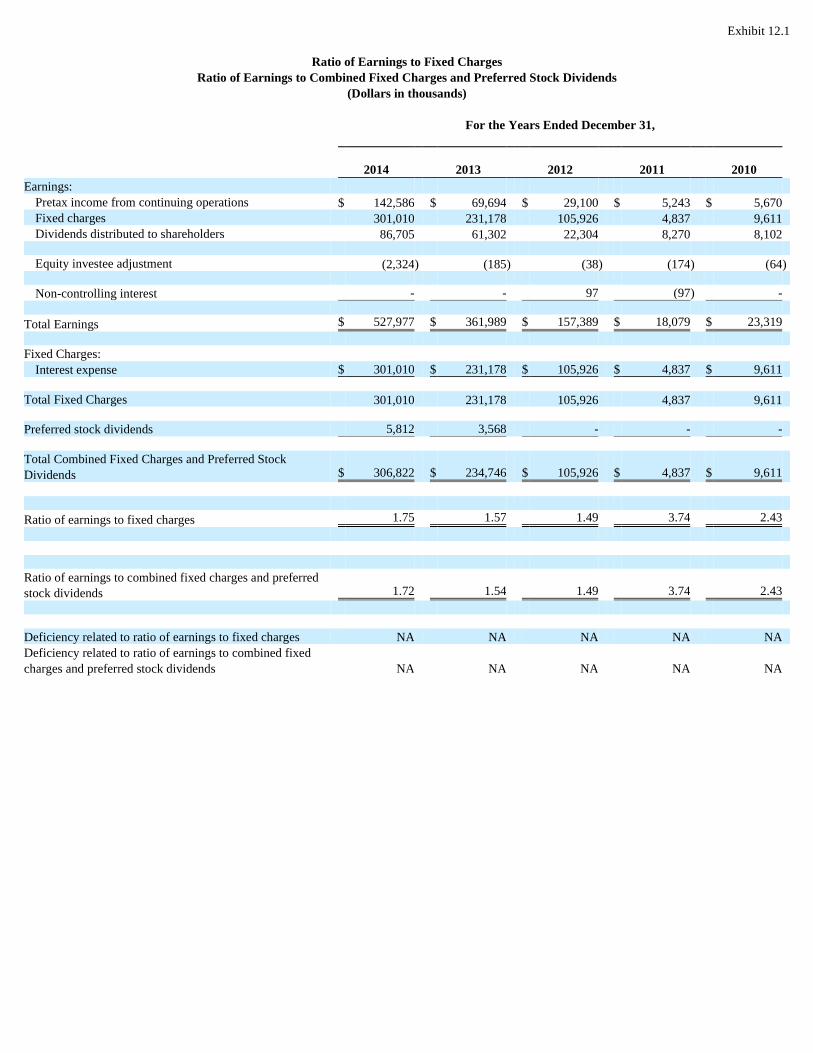
Exhibit 12.1
Ratio of Earnings to Fixed Charges Ratio of Earnings to Combined Fixed Charges and Preferred Stock Dividends
(Dollars in thousands)
For the Years Ended December 31, 2014 2013 2012 2011 2010 Earnings:
Pretax income from continuing operations $ 142,586 $ 69,694 $ 29,100 $ 5,243 $ 5,670 Fixed charges 301,010 231,178 105,926 4,837 9,611 Dividends distributed to shareholders 86,705 61,302 22,304 8,270 8,102 Equity investee adjustment (2,324 ) (185 ) (38 ) (174 ) (64 ) Non-controlling interest - - 97 (97 ) -
Total Earnings $ 527,977 $ 361,989 $ 157,389 $ 18,079 $ 23,319 Fixed Charges:
Interest expense $ 301,010 $ 231,178 $ 105,926 $ 4,837 $ 9,611 Total Fixed Charges 301,010 231,178 105,926 4,837 9,611 Preferred stock dividends 5,812 3,568 - - - Total Combined Fixed Charges and Preferred Stock Dividends $ 306,822 $ 234,746 $ 105,926 $ 4,837 $ 9,611 Ratio of earnings to fixed charges 1.75 1.57 1.49 3.74 2.43 Ratio of earnings to combined fixed charges and preferred stock dividends 1.72 1.54 1.49 3.74 2.43 Deficiency related to ratio of earnings to fixed charges NA NA NA NA NA Deficiency related to ratio of earnings to combined fixed charges and preferred stock dividends NA NA NA NA NA
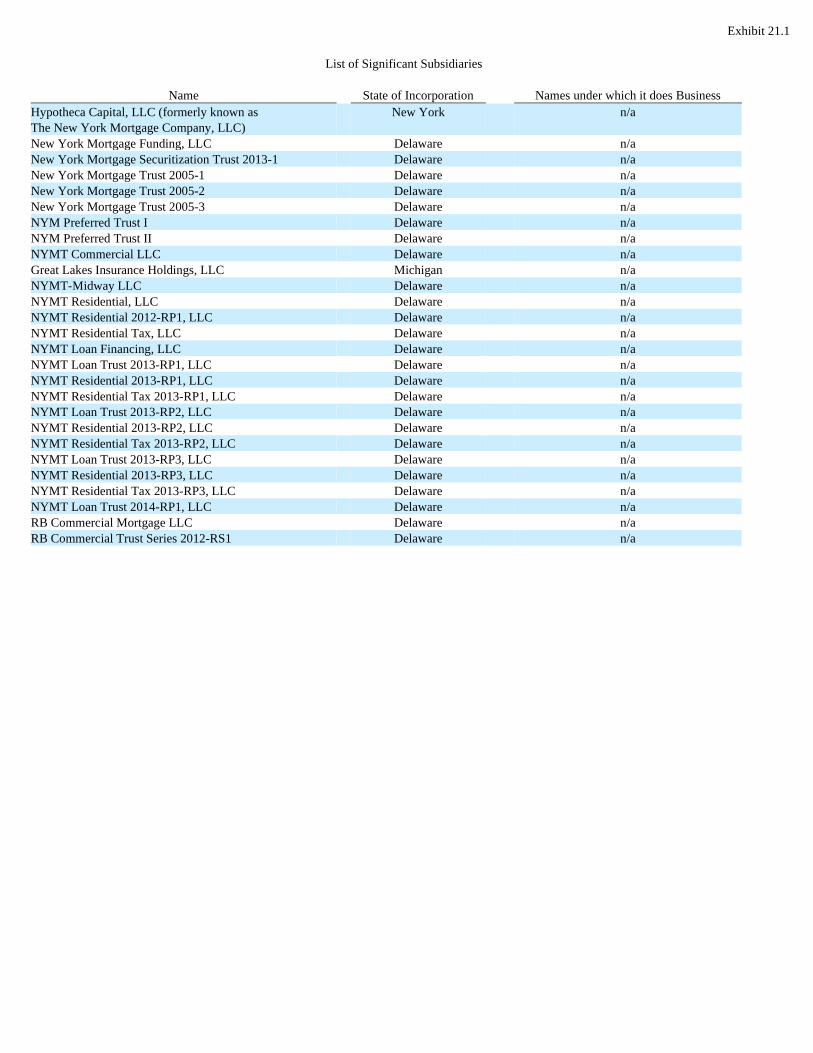
Exhibit 21.1
List of Significant Subsidiaries
Name State of Incorporation Names under which it does Business Hypotheca Capital, LLC (formerly known as The New York Mortgage Company, LLC)
New York n/a
New York Mortgage Funding, LLC Delaware n/a New York Mortgage Securitization Trust 2013-1 Delaware n/a New York Mortgage Trust 2005-1 Delaware n/a New York Mortgage Trust 2005-2 Delaware n/a New York Mortgage Trust 2005-3 Delaware n/a NYM Preferred Trust I Delaware n/a NYM Preferred Trust II Delaware n/a NYMT Commercial LLC Delaware n/a Great Lakes Insurance Holdings, LLC Michigan n/a NYMT-Midway LLC Delaware n/a NYMT Residential, LLC Delaware n/a NYMT Residential 2012-RP1, LLC Delaware n/a NYMT Residential Tax, LLC Delaware n/a NYMT Loan Financing, LLC Delaware n/a NYMT Loan Trust 2013-RP1, LLC Delaware n/a NYMT Residential 2013-RP1, LLC Delaware n/a NYMT Residential Tax 2013-RP1, LLC Delaware n/a NYMT Loan Trust 2013-RP2, LLC Delaware n/a NYMT Residential 2013-RP2, LLC Delaware n/a NYMT Residential Tax 2013-RP2, LLC Delaware n/a NYMT Loan Trust 2013-RP3, LLC Delaware n/a NYMT Residential 2013-RP3, LLC Delaware n/a NYMT Residential Tax 2013-RP3, LLC Delaware n/a NYMT Loan Trust 2014-RP1, LLC Delaware n/a RB Commercial Mortgage LLC Delaware n/a RB Commercial Trust Series 2012-RS1 Delaware n/a

Exhibit 23.1
CONSENT OF INDEPENDENT REGISTERED PUBLIC ACCOUNTING FIRM We have issued our reports dated February 27, 2015, with respect to the consolidated financial statements and internal control over financial reporting included in the Annual Report of New York Mortgage Trust, Inc. on Form 10-K for the year ended December 31, 2014. We hereby consent to the incorporation by reference of said reports in the Registration Statements of New York Mortgage Trust, Inc. on Forms S-3 (File No. 333-198177 effective August 15, 2014, File No. 333-186016 effective January 14, 2013, and File No. 333-179314 effective April 11, 2012) and on Forms S-8 (File No. 333-167609 effective June 17, 2010 and File No. 333-137987 effective October 13, 2006). /s/ Grant Thornton LLP New York, New York February 27, 2015
Exhibit 31.1
CERTIFICATION PURSUANT TO SECTION 302 OF THE SARBANES-OXLEY ACT OF 2002
I, Steven R. Mumma, certify that:
1. I have reviewed this annual report on Form 10-K for the year ended December 31, 2014 of New York Mortgage Trust, Inc.;
2. Based on my knowledge, this report does not contain any untrue statement of a material fact or omit to state a material fact necessary to make the statements made, in light of the circumstances under which such statements were made, not misleading with respect to the period covered by this report;
3. Based on my knowledge, the financial statements, and other financial information included in this report, fairly present in all material respects the financial condition, results of operations and cash flows of the registrant as of, and for, the periods presented in this report;
4. The registrant’s other certifying officer and I are responsible for establishing and maintaining disclosure controls and procedures (as defined in Exchange Act Rules 13a-15(e) and 15d-15(e)) and internal control over financial reporting (as defined in Exchange Act Rules 13a-15(f) and 15d-15(f)) for the registrant and have:
5. The registrant’s other certifying officer and I have disclosed, based on our most recent evaluation of internal control over financial reporting, to the registrant's auditors and the audit committee of the registrant's board of directors (or persons performing the equivalent functions):
(a) Designed such disclosure controls and procedures, or caused such disclosure controls and procedures to be designed under our supervision, to ensure that material information relating to the registrant, including its consolidated subsidiaries, is made known to us by others within those entities, particularly during the period in which this report is being prepared;
(b) Designed such internal control over financial reporting, or caused such internal control over financial reporting to be designed under
our supervision, to provide reasonable assurance regarding the reliability of financial reporting and the preparation of financial statements for external purposes in accordance with generally accepted accounting principles;
(c) Evaluated the effectiveness of the registrant's disclosure controls and procedures and presented in this report our conclusions about the
effectiveness of the disclosure controls and procedures, as of the end of the period covered by this report based on such evaluation; and
(d) Disclosed in this report any change in the registrant's internal control over financial reporting that occurred during the registrant's most
recent fiscal quarter (the registrant's fourth fiscal quarter in the case of an annual report) that has materially affected, or is reasonably likely to materially affect, the registrant's internal control over financial reporting; and
(a) All significant deficiencies and material weaknesses in the design or operation of internal control over financial reporting which are reasonably likely to adversely affect the registrant's ability to record, process, summarize and report financial information; and
(b) Any fraud, whether or not material, that involves management or other employees who have a significant role in the registrant's
internal control over financial reporting.
Date: February 27, 2015 /s/ Steven R. Mumma Steven R. Mumma Chief Executive Officer and President
(Principal Executive Officer)
Exhibit 31.2
CERTIFICATION PURSUANT TO SECTION 302 OF THE SARBANES-OXLEY ACT OF 2002
I, Kristine R. Nario, certify that:
1. I have reviewed this annual report on Form 10-K for the year ended December 31, 2014 of New York Mortgage Trust, Inc.;
2. Based on my knowledge, this report does not contain any untrue statement of a material fact or omit to state a material fact necessary to make the statements made, in light of the circumstances under which such statements were made, not misleading with respect to the period covered by this report;
3. Based on my knowledge, the financial statements, and other financial information included in this report, fairly present in all material respects the financial condition, results of operations and cash flows of the registrant as of, and for, the periods presented in this report;
4. The registrant’s other certifying officer and I are responsible for establishing and maintaining disclosure controls and procedures (as defined in Exchange Act Rules 13a-15(e) and 15d-15(e)) and internal control over financial reporting (as defined in Exchange Act Rules 13a-15(f) and 15d-15(f)) for the registrant and have:
5. The registrant’s other certifying officer and I have disclosed, based on our most recent evaluation of internal control over financial reporting, to the registrant's auditors and the audit committee of the registrant's board of directors (or persons performing the equivalent functions):
(a) Designed such disclosure controls and procedures, or caused such disclosure controls and procedures to be designed under our supervision, to ensure that material information relating to the registrant, including its consolidated subsidiaries, is made known to us by others within those entities, particularly during the period in which this report is being prepared;
(b) Designed such internal control over financial reporting, or caused such internal control over financial reporting to be designed under
our supervision, to provide reasonable assurance regarding the reliability of financial reporting and the preparation of financial statements for external purposes in accordance with generally accepted accounting principles;
(c) Evaluated the effectiveness of the registrant's disclosure controls and procedures and presented in this report our conclusions about the
effectiveness of the disclosure controls and procedures, as of the end of the period covered by this report based on such evaluation; and
(d) Disclosed in this report any change in the registrant's internal control over financial reporting that occurred during the registrant's most
recent fiscal quarter (the registrant's fourth fiscal quarter in the case of an annual report) that has materially affected, or is reasonably likely to materially affect, the registrant's internal control over financial reporting; and
(a) All significant deficiencies and material weaknesses in the design or operation of internal control over financial reporting which are reasonably likely to adversely affect the registrant's ability to record, process, summarize and report financial information; and
(b) Any fraud, whether or not material, that involves management or other employees who have a significant role in the registrant's
internal control over financial reporting.
Date: February 27, 2015 /s/ Kristine R. Nario Kristine R. Nario Chief Financial Officer
(Principal Financial and Accounting Officer)
EXHIBIT 32.1
CERTIFICATION PURSUANT TO 18 U.S.C. SECTION 1350,
AS ADOPTED PURSUANT TO SECTION 906 OF THE SARBANES-OXLEY ACT OF 2002
In connection with the Annual Report of New York Mortgage Trust, Inc., (the “Company”) on Form 10-K for the year ended December 31, 2014, as filed with the Securities and Exchange Commission on the date hereof (the “Report”), the undersigned hereby certifies, pursuant to 18 U.S.C. § 1350, as adopted pursuant to section 906 of the Sarbanes-Oxley Act of 2002, that: (1) The Report fully complies with the requirements of Section 13(a) or 15(d) of the Securities Exchange Act of 1934; and (2) The information contained in the Report fairly presents, in all material respects, the financial condition and results of operations of the Company. A signed original of this written statement required by Section 906 has been provided to the Company and will be retained by the Company and furnished to the Securities and Exchange Commission or its staff upon request.
Date: February 27, 2015 /s/ Steven R. Mumma Steven R. Mumma Chief Executive Officer and President
(Principal Executive Officer)
Date: February 27, 2015 /s/ Kristine R. Nario Kristine R. Nario Chief Financial Officer
(Principal Financial and Accounting Officer)