new-trend natural ventilation potential & analytics for … · · 2014-06-29new-trend natural...
TRANSCRIPT

New-Trend Natural Ventilation Potential & Analytics for Various
Climates in Canada
Liam Buckley1
1 IES Ltd, Boston, MA, USA
Abstract
This paper is focussed on the natural ventilation potential of different
weather data-sets used in Canada today. These weather data-sets have
been compared against existing CWEC (Canadian Weather for Energy
Calculations) weather data, which are based on 30 year weather data
(pre-1995), against newer to the industry; TMY (15) and TMY (7) sets
of weather data, which represents the last 15 and 7 years of weather
data respectively, i.e. from, and including the year 2013.
One major goal of this paper was to raise awareness of the availability
of newer useful weather data for building simulation and design.
Canadian multi-location TMY (Typical Meteorological Year) climate
based natural ventilation analyses included comparisons of:
1. Natural Ventilation Potential (NVP); which accounted for the
number of hours/year that acceptable outside air can be introduced in-
to rooms during occupied hours.
2. Percentage People Dissatisfied (PPD) for the thermal comfort of
occupants (ASHRAE 55).
3. Predictive energy-modelling of a small nature center building.
1 Introduction
There are various climate files and file-types used in our industry today. It has become appar-
ent that during my years working with various consultancies in Canada, little or no thought is
given to the selection of the appropriate weather file. Such selection is especially critical to
the performance of naturally ventilated buildings, LEED ratings, local code compliance and
provincial incentives offered to the buildings construction.
This paper has examined such impacts using appropriate files recognised by the Canadian
Green Building Council and provincial governments for utility rebates and incentives. That is,
CWEC and TMY files were examined, but TRY (Test Reference Year) data was not exam-
ined. TRY weather files are a UK-based weather file used for the calculation of building car-
bon emissions.
Two Canadian climates were examined in detail; Vancouver and Toronto. According to
2008 updated User Manual (Appendix D) of the CWEEDS (Canadian Weather Energy and
Engineering Data Sets), the CWEC weather data for Toronto and Vancouver were created
from actual weather data recorded between the years 1960-1989.
The new-trend TMY2 and TMY3 Canadian weather files used in this paper represent 30
year (TMY2) typical weather data; 15 year (TMY3-15) weather data and 7 year (TMY3-7)
weather data. They all share the year of 2013 as the last recorded year for their respective
‘typical’ meteorological years. All of these TMY files were all constructed in accordance with
the US-DOE (United States, Department of Energy) specified techniques by Weather Analyt-
ics. Further information of the TMY file composition can be found in ASHRAE 2013 Fun-
damentals Chapter 14 Climatic Data (ASHRAE).

2 Methodology
Various energy simulation and climatic tools were used to analyse, quantify and demonstrate
the differences in climatic data. The analyses included;
A Mahoney Analysis (Figure 3) of the climates under different time ranges.
A Natural Ventilation Potential calculation (Figure 5) of the climates under differ-
ent time ranges.
A whole building energy simulation of a fictitious model building in the various
climates using the different TMY ranges. Natural Ventilation strategies were in-
corporated to occupied zones and their levels of success have been quantified.
Comparative studies include identification of inappropriately selected weather
files.
Thermal comfort analysis of occupied rooms.
For a consistent comparative study, the same simulation model was used for all climates and
weather files. An architectural SketchUp model building is shown below in Figure 1.
Figure 1: Architectural SketchUp Model
This SketchUp model was converted to a building performance model for predictive energy
simulation and natural ventilation analysis.
Figure 2: Analytical Energy Model
The architectural model is auto-transferred to the energy model using the veXML as defined
by IES-VE (IES Ltd.). IES-VE is an ASHRAE 140 validate simulation tool.

3 Results
The methodology details five areas of analytical results.
3.1 Mahoney Analyses
An example of a Mahoney Analysis (monthly average) for Toronto is shown below. The
weather file used was a CWEC (Canadian Weather for Energy Calculations) file. A Mahoney
analysis is used to examine swings between daytime and nighttime conditions for human
comfort stresses (Upadhyay, Yoshida).
Figure 3: Mahoney Analysis of Toronto CWEC weather
The months of June, August and September are highlighted above in Figure 3 which demon-
strate opportunities to night-purge a building with unconditioned air, so to cool the thermal
mass of that building; thus lowering the peak internal operative temperatures of the occupied
spaces. These monthly average results represent a diurnal swing of greater than 5°C.
Most importantly, this diurnal swing of external dry-bulb temperature occurs during
the month where the peak external dry-bulb temperature (and daytime hot stress) occurs; Au-
gust.
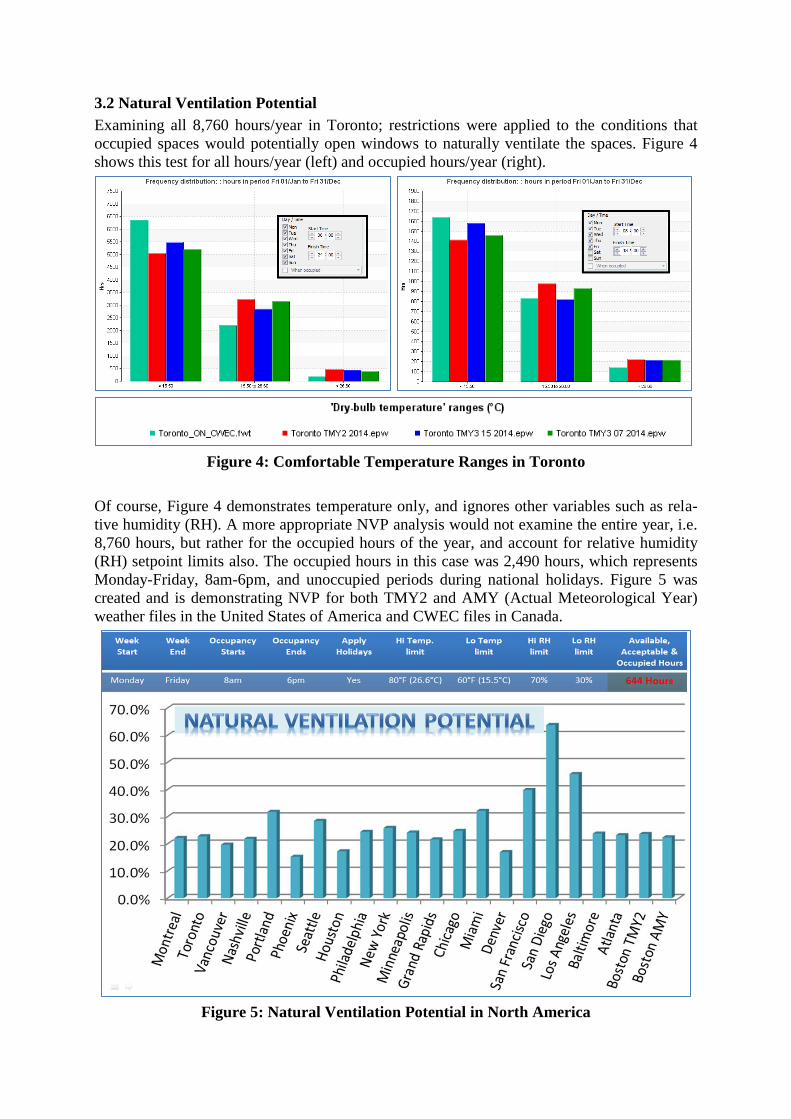
3.2 Natural Ventilation Potential
Examining all 8,760 hours/year in Toronto; restrictions were applied to the conditions that
occupied spaces would potentially open windows to naturally ventilate the spaces. Figure 4
shows this test for all hours/year (left) and occupied hours/year (right).
Figure 4: Comfortable Temperature Ranges in Toronto
Of course, Figure 4 demonstrates temperature only, and ignores other variables such as rela-
tive humidity (RH). A more appropriate NVP analysis would not examine the entire year, i.e.
8,760 hours, but rather for the occupied hours of the year, and account for relative humidity
(RH) setpoint limits also. The occupied hours in this case was 2,490 hours, which represents
Monday-Friday, 8am-6pm, and unoccupied periods during national holidays. Figure 5 was
created and is demonstrating NVP for both TMY2 and AMY (Actual Meteorological Year)
weather files in the United States of America and CWEC files in Canada.
Figure 5: Natural Ventilation Potential in North America

The Canadian climates shown in Figure 5 were ranging between 19-22% NVP. The upper
and lower limits were 26.6°C and 15.5°C; and 30%-70% relative humidity. These tempera-
tures represent conditions that are acceptable by the building operators to open windows, us-
ing a red-light-green-light alert system.
3.3 Building Energy Usage
Building energy usage profiles were generated for each building, in each region, and for each
climate file type. This followed a traditional ASHRAE 90.1-2010 Appendix G approach and
also included the minimum ventilation requirements of ASHRAE Standard 62.1. One exam-
ple is shown in Figure 6 for a fully air conditioned building.
Figure 6: Building Total Energy Usage Profile
As expected in a Canadian climate, heating dominated the profile of ‘total’ energy consump-
tion in Figure 6. This ‘total’ energy included a number of energy end-uses such as; space heat-
ing, service water heating, interior lighting, exterior lighting, space cooling, heat rejection,
fans, pumps, plug loads, cooking and refrigeration.
Figure 6 above was useful in that it demonstrated both the seasonal annual energy usage and
also what time of day those energy peaks occurred. This can generally allow a designer to tar-
get the causes of peak demands from one view. In this case, early-morning winter peaks have
indicated that the heating equipment is spiking and that a better nighttime setback strategy
should be implemented. This obviously required more investigation, but remains a useful vis-
ual tool.
3.4 Comparative Energy Studies
Examining one end-use; the chiller energy, for the building in Vancouver using different cli-
mate files, showed significant differences in chiller energy. See Figure 7 for a CWEC (red)
and TMY(7) (blue) comparison.

Figure 7: Chiller Energy for Office Building in Vancouver using different Vancouver
weather files; CWEC [red] and TMY (7) [blue]
Note the significant difference shown for chiller energy, simply by using different climate da-
ta for the identical location.
3.5 Adaptive Thermal Comfort
Analysis of all buildings in all locations included a thermal comfort check (CIBSE). Occa-
sionally, thermal comfort limits were exceeded, but upon further investigation, the uncom-
fortable conditions were occurring unoccupied times e.g. weekend evenings. This is shown in
Figure 8. These custom graphical analytics were generated by the energy analytical software.
Figure 8: Operative Temperature (red) and Occupancy Thermal Comfort (blue)
Please note the above graph has two y-axis labels with the operative temperature (red) on the
left Y-axis and the PPD (blue) of the right Y-axis.

4 Discussion
There were many areas of discussion related to the differences in weather data. Figure 7
showed the significant differences in chiller energy. These results correspond to the peak dry-
bulb temperature for the CWEC and TMY(7) climates, as shown below in Figure 9 which
shows a difference between peak external dry bulb temperature of 8 degrees between weather
files. The Vancouver CWEC peaked at 34°C and the Vancouver TMY(7) peaked at 26.1°C.
Please note that peak external dry-bulb temperatures both occurred in July.
Figure 9: Peak External Dry-Bulb Temperatures in Vancouver for TMY(7) [red]
and CWEC [green] Weather Files.
However, it is no longer sufficient to simply look at peak temperatures, but rather bins, trends
and frequency of distribution of weather data. Figure 10 below examines Toronto in Winter
(left) and Summer (right) and looks at the number of hours that exceed specific temperatures.
Figure 10: Frequency distribution of Toronto’s Weather File Types.
The traditional or outdated CWEC weather file (in light green) for Toronto shows some com-
pellingly out-of-sync data with respect to the other weather sets: TMY2(30), TMY(15) and
TMY(7).
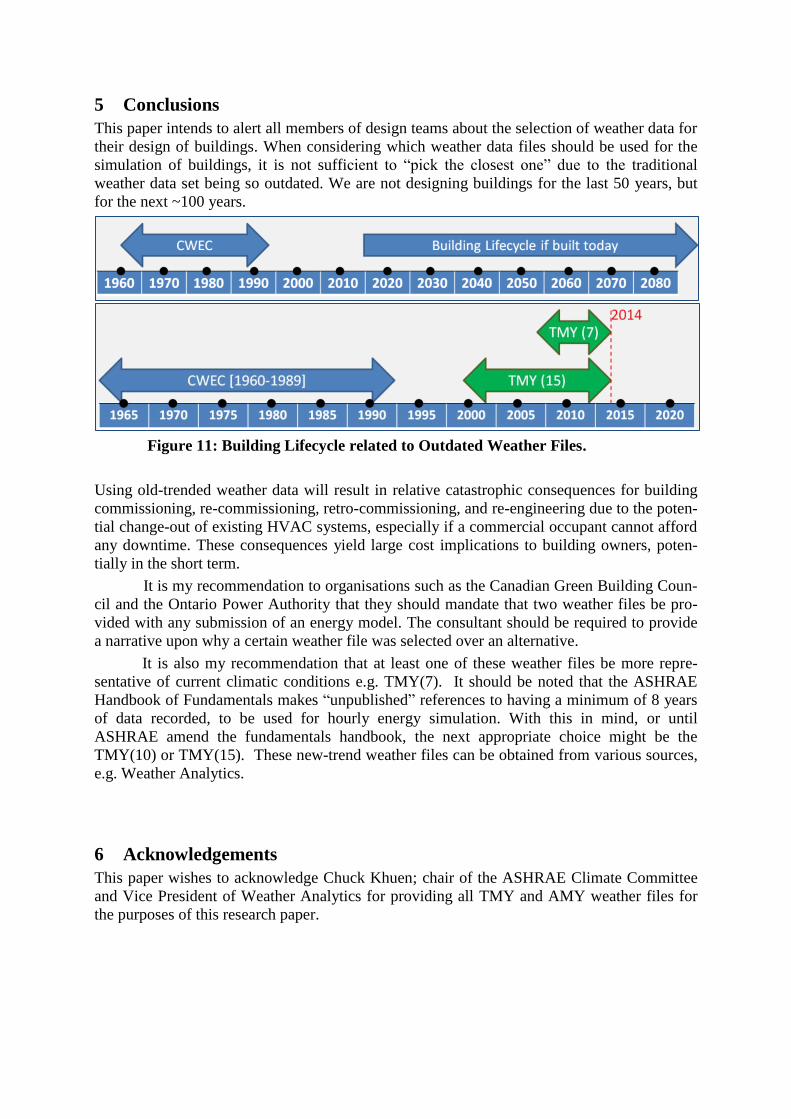
5 Conclusions
This paper intends to alert all members of design teams about the selection of weather data for
their design of buildings. When considering which weather data files should be used for the
simulation of buildings, it is not sufficient to “pick the closest one” due to the traditional
weather data set being so outdated. We are not designing buildings for the last 50 years, but
for the next ~100 years.
Figure 11: Building Lifecycle related to Outdated Weather Files.
Using old-trended weather data will result in relative catastrophic consequences for building
commissioning, re-commissioning, retro-commissioning, and re-engineering due to the poten-
tial change-out of existing HVAC systems, especially if a commercial occupant cannot afford
any downtime. These consequences yield large cost implications to building owners, poten-
tially in the short term.
It is my recommendation to organisations such as the Canadian Green Building Coun-
cil and the Ontario Power Authority that they should mandate that two weather files be pro-
vided with any submission of an energy model. The consultant should be required to provide
a narrative upon why a certain weather file was selected over an alternative.
It is also my recommendation that at least one of these weather files be more repre-
sentative of current climatic conditions e.g. TMY(7). It should be noted that the ASHRAE
Handbook of Fundamentals makes “unpublished” references to having a minimum of 8 years
of data recorded, to be used for hourly energy simulation. With this in mind, or until
ASHRAE amend the fundamentals handbook, the next appropriate choice might be the
TMY(10) or TMY(15). These new-trend weather files can be obtained from various sources,
e.g. Weather Analytics.
6 Acknowledgements
This paper wishes to acknowledge Chuck Khuen; chair of the ASHRAE Climate Committee
and Vice President of Weather Analytics for providing all TMY and AMY weather files for
the purposes of this research paper.

7 References
ASHRAE 2013 Fundamentals (Chapter 14 Climatic Data)
American Society of Heating, Refrigeration and Air-Conditioning Engineers
www.ashrae.org
ASHRAE Standard 90.1-2010 Appendix G; Performance Rating Method.
American Society of Heating, Refrigeration and Air-Conditioning Engineers
www.ashrae.org
ASHRAE Standard ASHRAE 62.1: Ventilation for Acceptable Indoor Air Quality.
American Society of Heating, Refrigeration and Air-Conditioning Engineers
www.ashrae.org
ASHRAE Standard 55: Thermal Environmental Conditions for Human Occupancy.
American Society of Heating, Refrigeration and Air-Conditioning Engineers
www.ashrae.org
ASHRAE Standard 140: Standard Method of Test for the Evaluation of Building Energy
Analysis Computer Programs.
American Society of Heating, Refrigeration and Air-Conditioning Engineers
www.ashrae.org
Canadian Weather Energy and Engineering Data Sets (CWEEDS); CWEC Weather Files.
CWEEDS Appendix D.
Chartered Institute of Building Services Engineers
CIBSE AM-10: Natural Ventilation
www.cibse.org
EnergyPlus Weather Files
http://apps1.eere.energy.gov/buildings/energyplus/weatherdata_about.cfm
Integrated Environmental Solutions
VE-GAIA and VE-Pro Software
www.iesve.com
Upadhyay, A., Yoshida, J., Rajal, H., 2006. Journal of Asian Architecture and Building Engi-
neering. May 2006.
Paper: “Climate Responsive Building Design in the Kathmandu Valley”.
Weather Analytics: Source of all TMY -7, TMY-15 and TMY-30 weather files.
http://www.weatheranalytics.com

8 Appendix A – Mahoney Analysis for Vancouver and Toronto Weather
Files
Vancouver Toronto
CWEC (1960-1989)
CWEC (1960-1989)
TMY2 (30 year) from 2013
TMY2 (30 year) from 2013
TMY3 (15 year) from 2013
TMY3 (15 year) from 2013

TMY3 (7 year) from 2013
TMY3 (7 year) from 2013
AMY (Actual Meteorological Year) 2013
Note: AMY weather files are used to cal-
ibrate existing buildings against utility
data.