new superintendents induction program: fall 2011 ... · web viewfall 2011 superintendents survey...
TRANSCRIPT

The New Superintendents Induction Program
Fall 2011 Superintendents Survey
The New Superintendents Induction Program (NSIP) is a joint initiative of the Massachusetts Association of School Superintendents and the Massachusetts Department of Elementary and Secondary Education’s Office for Targeted Assistance
March 2012

NSIP Fall 2011 Superintendents Survey Contents
Contents
Contents.......................................................................................................................................iiIntroduction..................................................................................................................................1Cohort 1........................................................................................................................................2
Year 2 Engagement...........................................................................................................2Coaching............................................................................................................................ 2October 2011 Content Day................................................................................................5NSIP Activities................................................................................................................... 6Focus on Instructional Improvement..................................................................................8
District Context...................................................................................................................8Leadership Team Turnover................................................................................................8District Functioning............................................................................................................9
Superintendent Recommendations for NSIP Improvement.............................................11Cohort 2......................................................................................................................................13
Program Objectives.........................................................................................................13Curriculum and Content Days..........................................................................................14Coaching Support............................................................................................................17Current Capacity and Practice.........................................................................................21Participant Experience.....................................................................................................23
Conclusion.................................................................................................................................25
I. District Context and Current Practice – Cohorts 1 and 2.....................................25II. NSIP Objectives – Cohort 2.................................................................................26III. Curriculum and Content Days – Cohort 2............................................................26IV. Coaching – Cohorts 1 and 2................................................................................26V. NSIP Activities – Cohorts 1 and 2........................................................................27VI. Recommendations for Improvement....................................................................28
Appendix A – Participating Superintendents.........................................................................29
UMass Donahue Institute Research and Evaluation Group
NSIP Fall 2011 Superintendents Survey Introduction
Introduction
The Massachusetts Association of School Superintendents (MASS) and the Massachusetts Department of Elementary and Secondary Education (ESE) have entered into an innovative partnership intended to develop and sustain district leadership and, by extension, enhance district capacity to support school improvement. This strategy aligns with ESE’s theory of action for district wide school improvement and manifests in the form of the New Superintendent’s Induction Program (NSIP). The University of Massachusetts Donahue Institute serves as the program’s external evaluator.
NSIP seeks to enhance superintendents’ effectiveness through an induction process centered on “The Massachusetts Way.” The Way is a specific approach to practice in relation to four broad activities that are considered essential to effective district leadership: strategic instructional leadership, district leadership team development, human resource management, and supervision and evaluation. The program delivers its curriculum through a series of Content Days and supports implementation of key practices through related work assignments and intensive coaching by a team of former superintendents who are themselves receiving extensive professional development in relation to the NSIP curriculum. The primary role of the coach is to support superintendents’ implementation of that curriculum.
NSIP is conceptualized as a three-year induction program designed to meet the needs of the Commonwealth’s new superintendents, with a cohort of newly hired, first-year superintendents entering the program each July. The first NSIP cohort (Cohort 1) entered the program in July 2010 and consisted of 25 superintendents. As of fall 2011, 23 of those individuals remained engaged in the second year of the NSIP curriculum1. Cohort 2 entered the program in July 2010 and includes 26 superintendents. See Appendix A for lists of participating superintendents by cohort.
This report summarizes data gathered through cohort-specific surveys of all participating superintendents administered in November 2011. Surveys for both cohorts were designed to gather information about participants’ engagement with the program in the summer and fall of 2011. Additional questions were tailored to each cohort’s stage of program implementation. An additional focus for cohort 1 was to provide them with an opportunity to report any contextual changes in their district. The cohort 2 survey was intended to gather some baseline information about participating superintendents’ and their districts. The surveys are part of a broader multi-year evaluation design which includes linked responses from semi-annual surveys, periodic formative feedback through customized content-day surveys, focus groups, and potential analysis of implementation rubrics.
Results are presented separately for each cohort with the structure of each cohort’s section mirroring its survey. The section for cohort 1 includes additional analysis linking fall 2011 responses to similar questions from a survey administered the previous spring. All reasonable efforts have been made to maintain the confidentiality of individual superintendents’ responses. Note that percentages in tables have been rounded the nearest whole number and thus may not always sum to 100 percent.
1 One superintendent (Marlborough) elected to discontinue the program and another (Ashland) resigned her position early in the school year.
UMass Donahue Institute Research and Evaluation Group 1

NSIP Fall 2011 Superintendents Survey Cohort 1
Cohort 1
The cohort 1 survey was completed by all 23 participating superintendents. Where relevant the results discussed below include linkages to parallel questions on the survey administered at the end of the 2010-2011 school year. Given the small population, year-to-year changes were not tested for statistical significance. Results will also be linked to future surveys as part of long term implementation and outcomes assessments.
Year 2 EngagementCoachingA key component of NSIP is ongoing coaching and support from an experienced former superintendent. At the time of this survey, all cohort 1 superintendents were assigned to the same coach with whom they had worked in the year prior. The following questions were designed to gauge the extent and nature of that ongoing engagement between coach and superintendent as they began their second year in the program.
Figure 1: Cohort 1 - How often have you had substantive communication with your coach?As shown in Figure 1, most of the cohort 1 superintendents communicated with their coaches once every two weeks with a substantial minority engaged on a monthly basis. None of the superintendents reported communicating with their coaches less frequently then once a month. The data presented in Table 1 show that, on average, about half of coach-superintendent meeting time was spent on work directly related to the NSIP curriculum and one-third of the time was spent addressing other issues of concern to the superintendent. However, looking only at the averages hides important variation among
individual superintendents. It is particularly noteworthy that about one-quarter of superintendents reported spending less than 25 percent of their coaching time on work directly related to NSIP.
Table 1: Cohort 1 - What proportion of scheduled meeting time with your coach is focused on each of the following?
N=22 0-24% 25-49% 50-74% 75-100% Mean
Work directly related to the NSIP curriculum and assignments
26% 13% 43% 17% 49%
Issues of concern to you that were not directly related to NSIP work
39% 39% 17% 4% 33%
Issues of concern to your coach that were not directly related to NSIP work
70% 22% 9% 0% 16%
Other focus 100% 0% 0% 0% 3%Note: Superintendents were asked to report specific percentages of time totaling 100 percent. These figures were grouped into the above presented categories as part of the analysis. Blanks were counted as 0 percent of time.
UMass Donahue Institute Research and Evaluation Group 2
4%
61%
35%
Weekly (or more) Every other week Monthly0%
20%
40%
60%
80%
Frequency of Coach Communication (N=23)

NSIP Fall 2011 Superintendents Survey Cohort 1
Comparing spring and fall means in Table 2 shows little change in the average distribution of coaching time spent in each of these areas, though there was a modest increase in the amount of time spent on non-NSIP issues that were of concern to the coach. Yet an examination of changes in individual responses over time reveals real shifts in focus at the individual level as shown in Figure 2.
Table 2: Cohort 1 - Focus of Coach-Superintendent Meeting Time, Change in Mean Distribution
N=22Spring 2011
Fall 2011
Work directly related to the NSIP curriculum and related assignments 51% 49%
Issues of concern to you that were not directly related to NSIP work 34% 33%
Issues of concern to your coach that were not directly related to NSIP work 8% 16%
Other focus 8% 3%
Note: Spring 2011 means include only responses for superintendents completing the most recent survey. As a result, they differ slightly from those previously reported.
Figure 2: Cohort 1 - Change in Focus of Coaching Meetings from Spring 2011 to Fall 2011
12
9
13
53
2
5
108
12
5
8
NSIP related Superintendent concern (not NSIP)
Coach concern (not NSIP)
Other focus0
5
10
15
20
Change in Focus of Coaching Meetings (N=23)
Increased Percentage Unchanged Decreased Percentage
Twelve superintendents reported an increased percentage of time spent directly on NSIP-related activities. In half of those cases the shifts were modest. However, in the other half the increases ranged from 20 to 45 percentage points. At the same time eight superintendents reported a decrease in the percentage of time spent directly on NSIP related activities. In three cases those decreases were between 50 and 65 percentage points resulting in only 10 percent of fall coaching time spent specifically addressing the NSIP curriculum. In two of these cases there was a substantial increase in the proportion of time focusing on non-NSIP issues of concern to the superintendent – now 50 percent and 70 percent. In the third case non-NSIP issues of concern to the coach now represent 55 percent of their meeting time. The survey questions do not allow us to gauge directly the extent to which any of the shifts in focus are well received by the superintendents or a source of frustration. It does seem likely that shifts emphasizing superintendent concerns would be viewed favorably by the superintendents at the same time that shifts away from work directly related to NSIP may be viewed as troublesome by program managers. If not already established, it may be useful for program managers to articulate broad expectations about the amount of formal coaching time that should be focused directly on work related to the NSIP curriculum
UMass Donahue Institute Research and Evaluation Group 3

NSIP Fall 2011 Superintendents Survey Cohort 1
and assignments while maintaining time to address some other important concerns identified by both superintendents and their knowledgeable coaches.
Table 3 suggests that creating and implementing district improvement strategies are a substantial focus of coaching activities entering the second year of the program. This is followed closely by support for classroom observation activities. Refining the superintendent’s theory of action appears to receive less attention, which may be a valid reflection of superintendents’ current stages of program implementation.
Given the launch of the District Governance Support Project (DGSP) and the intention for the two programs to be mutually reinforcing, it is interesting to note that five superintendents indicated that building school committee relationships received little or no focus in their coaching conversations. However, we should recognize that none of them are in DGSP districts. It is also noteworthy that five of the six who reported that school committee relationships are a strong focus of their coaching are from districts that are expected to participate in DGSP.
Table 3: Cohort 1 - To what extent have the following been a focus of conversations with your coach?
Strong Focus
Moderate Focus
Little or No Focus
Response Count
Implementing your strategy for district improvement 74% 26% 0% 23
Creating a strategy for district improvement 68% 27% 5% 22
Visiting classrooms to observe instruction 61% 35% 4% 23
Refining your theory of action 23% 64% 14% 22
Building school committee relationships 27% 50% 23% 22
Superintendents were also given the opportunity to identify other issues that had been a focus of their coaching conversations. Nine of them offered the following responses:
o District issues such as union relationships. Administrator professional development.
o Union issues and labor law
o Personnel issues
o Working with the administrative team
o Establishing priorities and time management
o Leadership, goals, communication with community, relationships
o Helping me to problem solve about issues in the district
o Budget development
o Instructional rounds
In response to an open-ended question about the ways in which their coach is most helpful, 22 respondents had something to offer. Most expressed appreciation of their coach’s ability to actively listen, offer advice and help them devise solutions to problems. Some of the more specific comments included:
o My coach is very helpful in providing an attentive ear first in each of our meetings, allowing me to present issues that have arisen and how they are connected. He also provides an agenda for each session that is structured and still flexible enough to allow for new items.
UMass Donahue Institute Research and Evaluation Group 4

NSIP Fall 2011 Superintendents Survey Cohort 1
o Listens. Open to discussing challenging problems facing me. Gives encouragement and positive feedback. Provides relevant resources/templates/articles. Gives thoughtful advice.
o My coach is able to help me set the appropriate priorities. She has helped me with strategies to build a strong administrative team and just as important trusting relationships with them. Some of our conversations regarding budget issues and school committee agenda building have also been very helpful.
o The candid informal conversations regarding work of the district are what I find to be most helpful. The periodic check-ins are helpful for stock-taking.
o Listening, offering feedback, suggestions, ideas and pathways to address short-term and long-term events.
o Giving me feedback on the implementation of my strategy. Helping me with developing a more powerful leadership team. Open to dealing with my concerns and providing feedback.
o He is stretching my thinking around the strategies that we have put in place and how to leverage these strategies for more accelerated growth. In our meetings, he also provided a sounding board for me to process issues that are impacting the work we need to do in order to clarify my next steps.
o Observing, listening, asking questions to help me reflect on the problems/challenges we are discussing. Doing everything in a calm, supportive manner. Being always available at least by phone or email. Engendering trust that all that is shared is confidential.
Respondents also offered the following suggestions for improving NSIP’s coaching component:
o Establishing an electronic method of communication for the cohort
o Continue the coaching aspect and create more opportunities for the coach to work with all of the superintendents they work with together in a professional learning community.
o Forward homework to coach prior to class for feedback
o Become more familiar with the teacher evaluation system being rolled out across the state and become more familiar themselves with what instructional leadership from the superintendent looks like.
o I think some focus on Conditions for School Effectiveness and the role it plays in the development of the NSIP would benefit everyone.
o I think there should be more time spent on matching a coach to a new superintendent. As a female superintendent it may be helpful to have a female coach who understands better other dynamics of the job because you are female.
o I liked the group meetings my coach arranged for me with him and the other superintendents he was coaching. This has deepened the network of support for us as new superintendents in the area.
October 2011 Content DayTypically cohort 1 superintendents are asked to complete a feedback survey at the end of each content day. Given that this larger survey was administered quite soon after that session, the first of the year for cohort 1, a broad feedback questions was instead incorporated into this instrument.
UMass Donahue Institute Research and Evaluation Group 5

NSIP Fall 2011 Superintendents Survey Cohort 1
According to their responses, 19 of the 23 responding superintendents attended the October content day. As shown in Table 4, most respondents found that the day was at least moderately successful in: establishing a clear agenda and goals for the second year of the program, offering a productive learning environment, and providing new insight into district improvement work.
Table 4: Cohort 1 - To what extent did the October content day . . .(N=19)
To aGreatExtent
To a Moderate
Extent
ToLittle or No
Extent
Establish a clear agenda and goals for year 2 of the NSIP program 74% 21% 5%
Offer a productive learning environment 58% 32% 11%
Provide new insight into your district improvement work 47% 37% 16%
NSIP ActivitiesAs of the late fall, cohort 1 superintendents were expected to have completed a number of key program activities. As shown in Figure 3, all reported that they had developed a strategy for district improvement, 87 percent had developed their theory of action, and 83 percent had scheduled time to visit classrooms this academic year.
Seventeen of the superintendents reported that they had completed all three of the listed activities. Five had yet to complete either the theory of action or scheduling classroom visit time, but not both. Only one indicated that neither of those activities were completed.
Figure 3: Cohort 1 - To date, which of the following NSIP activities have you completed?
UMass Donahue Institute Research and Evaluation Group 6
87%
100%
83%
Theory of action Strategy for district improvement
Scheduled time for classroom visits
0%
20%
40%
60%
80%
100%
NSIP Activities Completed (N=23)

NSIP Fall 2011 Superintendents Survey Cohort 1
Figure 4: Cohort 1 - How involved has your school committee been in developing your improvement strategy?
Substantial involvement
26%
Moderate involvement
43%
Little or no involvement
30%
School Committee Involvement in Strategy Development (N=23)
Gaining the buy-in of key constituencies, particularly the school committee, is clearly a key to successful strategy implementation. One way to attain that buy-in early is to involve the committee in strategy development. As shown in Figure 4, about one-quarter of cohort 1 superintendents reported that their school committee was substantially involved in their strategy development. However, 30 percent indicated that this critical group had little or no involvement in the process.
As shown in Figure 5, all but two of the superintendents reported that the district was actively implementing their improvement strategy. The majority (57 percent) said that they were deeply into the work and 35 percent said they were just beginning.
Superintendents described the following significant challenges that they faced in developing or implementing their strategies.
o Capacity building and then getting focused because of personnel issues.
o The biggest challenge that I am facing is building a functional leadership team. I am currently working on that issue.
Figure 5: Cohort 1 - At this time in the district actively implementing your improvement strategy?
Yes, we are deeply into the work
57%
Yes, we are just
beginning the work35%
No9%
Is District Actively Implementing Strategy? (N=23)
o Establishing the “sub goals” or objectives to meet each of the strategic goals in our plan has been a time consuming effort for the leadership team.
o Significant amount of time in an urban district that has a limited amount of leadership capacity (number of positions). Length of time to have DESE recommend plan approval.
o I have had some challenges in developing and implementing my strategies due to time issues. I have included all stakeholders in the process of the strategic improvement which makes it difficult to schedule time everyone can meet. It has been worth overcoming the challenges as I am finding more support for the plan, particularly from the teachers.
o 1) Change in leadership approach – everyone has a voice that is valued (new) vs. top-down (old); 2) Therefore leading to “lack of decision-making;” 3) Perceived issues raised by teachers regardless (sic) “Collective Bargaining Agreement;” 4) Time.
o Getting the board’s attention to its detail.
UMass Donahue Institute Research and Evaluation Group 7

NSIP Fall 2011 Superintendents Survey Cohort 1
o A lot of effort went into informing the SC about what the “current” state of the district is, and why we needed to focus on the areas selected. They were fine with the ideas but really don’t care what is done so long as what they want gets done. The committee is not a functioning team, nor do many members want to work as a team.
o The union is balking at conducting specific tasks. Administrators are having a difficult time with data management. They do not have the tools/skills to successfully mine the data.
o DESE cannot produce any substantive feedback on the plan we submitted the first two times except that it needs to be refined.
o It was difficult starting the program when I had already begun a strategic planning effort. However, I was able to weave into my plan the strategy approach. I think that it has worked fine and we are on the right track.
Focus on Instructional ImprovementAs shown in Figure 6, more than two-thirds (69%) of responding superintendents indicated that at least 60 percent of their time is focused on activities and initiatives that will have a direct impact on the quality of instruction in their district. About 20 percent spend between 40 to 59 percent of their time on such activities. A small minority (two respondents) spend only 20 to 39 percent of their time focused on instructional improvement. None of the respondents reported spending less than 20 percent of their time on such tasks. It is should be noted that four superintendents skipped this question and that it is the only closed-response item where some failed to respond. It is impossible to tell whether this had an impact on the observed distribution of responses.
Figure 6: Cohort 1 - What proportion of your time is focused on activities and initiatives that will have a direct impact on the quality of instruction in your district?
11%
21%
58%
11%
Proportion of Time Directly Impacting Quality of Instruction (N=19)
20-39 percent
40-59 percent
60-79 percent
80-100 percent
Cohort 1 superintendents offered the following related comments:
o My goal is to increase the percentage to where it reflects the overall importance, but it has been a challenge in the second year. My coach is very helpful with analyzing these challenges.
o I think that this question is too ambiguous – “direct impact” needs clarification. For example, even a five-year budget strategy meeting at town hall has an impact on the quality of education in the district both short and long term. It is a question of degree.
o That is the intended shift . . .to be an instructional leader. It hits most aspects of my work.
UMass Donahue Institute Research and Evaluation Group 8

NSIP Fall 2011 Superintendents Survey Cohort 1
o I spend a substantial amount of time working with my administrative and teacher leader teams working on quality of instruction. I do find it difficult to visit classes as much as I would like but know that needs to change.
o I meet with principals and assistant superintendent a lot of times during the week. I walk through classrooms twice a week.
o Lots of time used because of a new chair of the school committee who wants all my time.
o I am a superintendent in a small district and wear many hats. I believe the proportion is closer to 79 percent than 60 percent. That was a difficult question to answer. It depends on the day!
District ContextLeadership Team TurnoverSuperintendents’ responses show that most cohort 1 NSIP participants are dealing with some degree of turnover among their leadership teams. Eleven reported that at least one-quarter of their combined leadership team (central office and building principals) was new to their positions this academic year. In three of these cases the turnover rate was 50 percent or more. Sixteen had central office leadership turnover of 25 percent or more with rates ranging from 0 percent (three districts) to 67 percent (two districts). Turnover rates among building leadership were somewhat lower with 10 superintendents reporting that at least one-quarter of their building principals were new to their jobs. In four districts there was no turnover among building principals. One of the superintendents with the highest principal turnover had new principals in three out of four schools.
Figure 7: Cohort 1 - Turnover in District Leadership
7
1312
9
68
7
43
Central Office Building Principals Combined Leadership0
5
10
15
20
Leadership Turnover (N=23)
Less than 25% 25% to 49% 50% or more
District FunctioningAs shown in Table 5, overall cohort 1 superintendents report improvement in all of the listed areas of district functioning. The areas of greatest improvement were district-level focus on instructional improvement where positive responses (good or excellent) increased from 35 percent to 96 percent and the productivity of district leader team meetings which improved from 43 percent positive to 96 positive.
UMass Donahue Institute Research and Evaluation Group 9

NSIP Fall 2011 Superintendents Survey Cohort 1
Table 5: Cohort 1 - District Functioning Spring 2011 vs. Fall 2011 – Percent Responding Good/Excellent
(N=23) Spring 2011 Fall 2011
District-level focus on instructional improvement 35% 96%
Principal readiness to lead instructional improvement 35% 62%
Alignment of budget to the overall district improvement strategy^ 39% 52%
Productivity of school committee meetings 39% 57%
Productivity of district leader team meetings 43% 96%
Note: Spring 2011 means include only responses for superintendents completing the most recent survey. As a result, they differ slightly from those previously reported. ^ Question was reworded slightly from the spring survey where it read “Alignment of district budget to improvement strategy.”
Looking at individual respondent data, most response changes indicated improvement in district functioning on the listed dimensions. However, there were some respondents whose answers remained unchanged or indicated a decline in the level of functioning2. More detail on the changes by dimension is provided in the following bullets.
District-level focus on instructional improvement – Overall 17 superintendents’ responses indicated some degree of improvement in district-level focus on instructional improvement, including 14 superintendents whose answers changed from negative (poor or fair) to positive (good or excellent). Responses from the remaining six superintendents remained unchanged.
Principal readiness to lead instructional improvement – Thirteen superintendents’ offered responses that marked improvement in principal readiness to lead instructional improvement efforts, including eight whose answers changed from negative to positive. Responses from nine superintendents remained unchanged and one showed a decline in functioning from good to fair.
Alignment of budget to the overall district improvement strategy – Eleven superintendents’ responses indicated improvement in alignment of the budget and strategy, including seven whose answers changed from negative to positive. Eight respondents’ ratings remained unchanged and three showed declines in functioning, all from good to fair. In addition, one superintendent whose spring response had been good answered unsure on the fall survey.
Productivity of school committee meetings – Ten superintendents’ offered responses that marked improvement in the productivity of school committee meetings, with eight changing from negative to positive. Eight superintendents’ ratings remained unchanged and five showed declines in functioning, including two that changed from excellent to fair.
Productivity of district leader team meetings – Fifteen superintendents’ responses indicated some degree of improvement in productivity of district leader team meetings, including eleven whose responses changed from negative to positive. Seven respondents’ answers remained unchanged and one marked a decline from good to fair.
At the beginning of their second year, most superintendents reported that they have a positive (good or excellent) relationship with each of the key constituencies identified below. None of the superintendents selected the response options of poor or too soon to tell. As shown in Table 6, by far the strongest relationships are with the central office leadership team with 83 percent of superintendents rating that relationship as excellent and the remaining 17 percent as good. This is followed by both school building leaders and school committees, which had the same response profile with 52 percent excellent, 35 percent good and 13 percent fair. All but two respondents indicated their relationship with other community and business leaders is positive, though only about one-quarter 2 Fall survey respondents did not have access to their spring responses, which may result in some distortion due to rating subjectivity.
UMass Donahue Institute Research and Evaluation Group 10

NSIP Fall 2011 Superintendents Survey Cohort 1
rated that relationship as excellent. Although 17 percent rated their relationship with the teachers union as fair, more than one-third reported that it was excellent.
Table 6: Cohort 1 - Superintendent relationship with key constituencies(N=23)
Excellent Good Fair
School committee 52% 35% 13%
Central office leaders 83% 17% 0%
School building leaders 52% 35% 13%
Teachers union 35% 48% 17%
Other community and business leaders 26% 65% 9%
Cohort 1 superintendents described the significant changes in the district impacting their answers to the above questions.
o Have completely redesigned the function and form of the central office. Demoted two individuals, hired new business and special education managers, added several new non-union positions; all with the support of the school committee.
o With the full impact of my first year’s reorganization hitting the school committee in the summer, there was a lot of noise (distraction) with those who thought that lobbying the committee would save them from change. Some committee members unfortunately seemed consumed with the same myth. The late summer into fall was a time of dust settling and becoming accustomed to new assignments as well as the committee’s final flailing to gain some control. Things have settled down so we can focus on the work again.
o With three new building leaders there is obviously a learning curve with regards to our ability to work effectively as a team. Though I feel it is going quite well, we are still in a bit of a feeling out process.
o Change in the chair of the school committee as well as the union president. The relationship with the union is new, but much better than last year. The relationship with the new chair is not so good – he wants to run the district and puts his nose in places that he has no authority, but believes he does since he is the chair.
o Changes on school committee will help focus the remaining members.
o We have developed a behavioral health task force to address the emotional health of our students. Recently, we have had some tragic deaths of students in their 20’s who attended our school district. The student deaths were a result of substance abuse.
Superintendent Recommendations for NSIP ImprovementFinally, the cohort 1 superintendents offered the following recommendations for improving the induction program.
o Less whole group talk. More problem solving and consultancies.
UMass Donahue Institute Research and Evaluation Group 11

NSIP Fall 2011 Superintendents Survey Cohort 1
o The approach needs to change from an assumption that people know nothing to one of mutual respect and provide for more genuine adult learning opportunities as described in research on teaching adults and professionals.
o I like the ability grouping at the meetings. I think the groups according to ability makes the breakout sessions worthwhile to me.
o Need to ensure that differentiation of content continues, so we are all able to develop competencies based on our current base of knowledge and skills.
o I like the group work with my coach and the superintendents of similar districts in my area that occurred in October. This helps to provide layers of support and continuity.
o Topics and assignments should be directly linked to DESE’s priorities for school districts. This will make the time more meaningful and useful.
o More alignment with district initiatives and goals.
o Spend less time on strategy development and more time on staff and administrative evaluation.
o At the meetings I would like to see a continuation of the additional time provided with the coaches.
o Give new superintendents time to meet with their coaches, say morning, then have opportunities for new superintendents to meet one another during afternoon activities.
o Use your coaches. Collaborate with other superintendents as much as possible. Set clear goals and expectations for relationship with the school committee.
o You really, really, really have got to let the school committees know how intense the work is and how they need to support the superintendent instead of just acting like bobble heads and have the school committee continue to work as if nothing new has occurred. [Note this is a DGSP district.]
UMass Donahue Institute Research and Evaluation Group 12

Fall 2011 Superintendents Survey Cohort 2
Cohort 2
The cohort 2 survey was completed by all 26 participating superintendents. Their results will be linked to future surveys as part of long term implementation and outcomes assessments. Some questions match items on the spring 2011 cohort 1 survey. Due to the differences in timing of the surveys, this report does not compare and contrast cohort-level responses. Many of those questions will be repeated in the spring survey for cohort 2. At that time it will be appropriate to identify trends and differences in responses between the two cohorts.
Program ObjectivesTable 7 suggests that the NSIP objectives are generally very well aligned with cohort 2 superintendents’ priorities for improvement in their district. The strongest alignment is in building instructional leadership, developing effective leadership teams and developing collaborative relationships with key constituencies.
Table 7: Cohort 2 – Alignment of Objectives with Superintendents’ Priorities(N=26)
Very well aligned
Well aligned
Not well aligned
Not at all aligned
Don’t Know
Building instructional leadership 65% 31% 0% 0% 4%
Developing effective leadership teams 62% 39% 0% 0% 0%
Developing collaborative relationships with key constituencies
62% 39% 0% 0% 0%
Strategic management of resources to support district improvement
58% 31% 8% 0% 4%
Developing effective systems for supervision and evaluation
40% 52% 4% 0% 4%
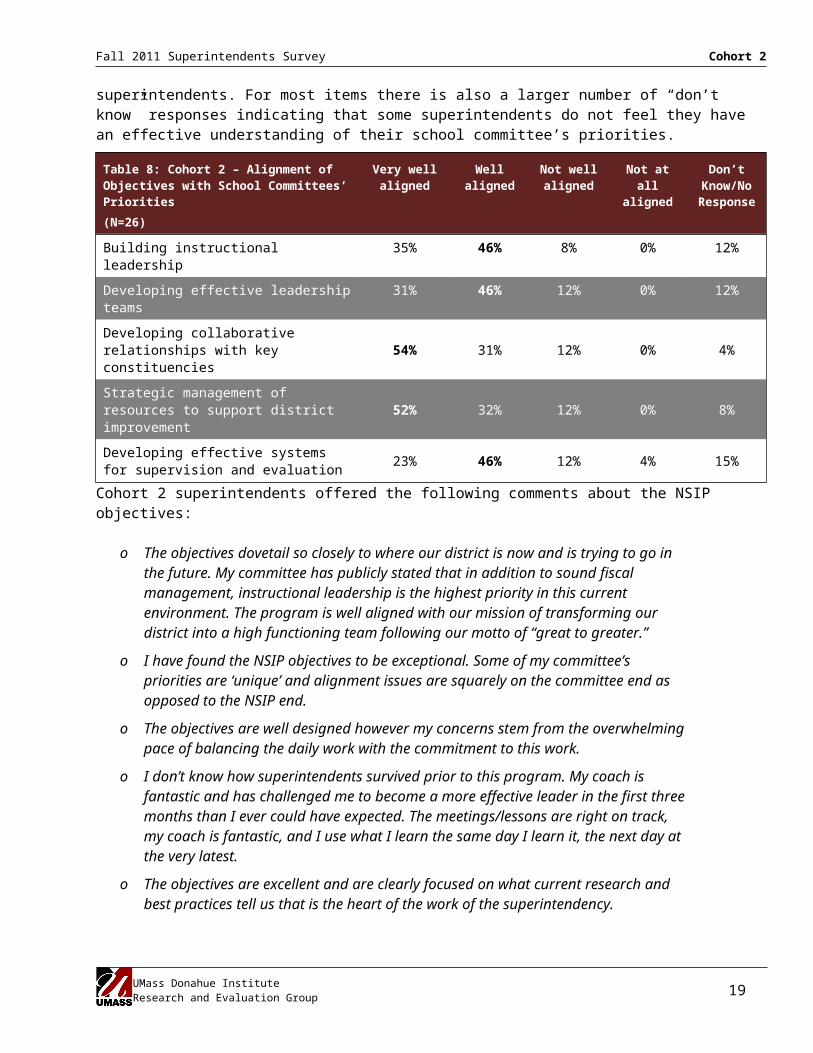
Table 8 displays superintendents’ perception of the alignment of NSIP objectives with the priorities of their school committees. These data suggest that school committees’ priorities (as perceived by the superintendent) are generally “well” or “very well” aligned. However, there is a somewhat weaker alignment with NSIP objectives than for superintendents. For most items there is also a larger number of “don’t know” responses indicating that some superintendents do not feel they have an effective understanding of their school committee’s priorities.
Table 8: Cohort 2 – Alignment of Objectives with School Committees’ Priorities(N=26)
Very well aligned
Well aligned
Not well aligned
Not at all aligned
Don’t Know/No Response
Building instructional leadership 35% 46% 8% 0% 12%
Developing effective leadership teams 31% 46% 12% 0% 12%
Developing collaborative relationships with key constituencies
54% 31% 12% 0% 4%
Strategic management of resources to support district improvement
52% 32% 12% 0% 8%
Developing effective systems for supervision and evaluation
23% 46% 12% 4% 15%
UMass Donahue Institute Research and Evaluation Group 13
Fall 2011 Superintendents Survey Cohort 2
Cohort 2 superintendents offered the following comments about the NSIP objectives:
o The objectives dovetail so closely to where our district is now and is trying to go in the future. My committee has publicly stated that in addition to sound fiscal management, instructional leadership is the highest priority in this current environment. The program is well aligned with our mission of transforming our district into a high functioning team following our motto of “great to greater.”
o I have found the NSIP objectives to be exceptional. Some of my committee’s priorities are ‘unique’ and alignment issues are squarely on the committee end as opposed to the NSIP end.
o The objectives are well designed however my concerns stem from the overwhelming pace of balancing the daily work with the commitment to this work.
o I don’t know how superintendents survived prior to this program. My coach is fantastic and has challenged me to become a more effective leader in the first three months than I ever could have expected. The meetings/lessons are right on track, my coach is fantastic, and I use what I learn the same day I learn it, the next day at the very latest.
o The objectives are excellent and are clearly focused on what current research and best practices tell us that is the heart of the work of the superintendency.
o The objectives are fine, but supposedly if we have been hired as a superintendent, we should have already mastered most of the objectives outlined for the program. It never hurts to revisit and be reminded of the concepts and content, but it does feel like review.
Curriculum and Content DaysAs shown in Table 9, cohort 2 superintendents have an overwhelmingly positive view of the NSIP curriculum as delivered through the content days. Only two respondents disagreed that the content is effectively integrated, only three expressed concern about the sequencing of material, and four did not agree that the content was clear in its connection to the year-end goals.
Table 9: Cohort 2 – Perceptions of the NSIP curriculum as delivered through Content Days(N=26)
Strongly Agree
Mostly Agree
Mostly Disagree
Strongly Disagree Unsure
Integrated effectively as part of a coherent curriculum
50% 42% 4% 4% 0%
Sequenced in a manner that supported learning
54% 35% 8% 4% 0%
Clear in its connection to NSIP’s year-end goals 50% 35% 8% 4% 4%
Table 10 provides additional insight regarding superintendents’ reaction to Content Days and to selected approaches to delivering content. Overall responses were positive with at least 80 percent of respondents rating each aspect as either excellent or good. Quality of facilitation received the highest ratings followed by effectiveness of small group work as a format for learning. Ratings for the connection between content days and assigned readings and the overall value of the content days were somewhat lower – each with 20 percent of respondents indicating that these aspects were fair or poor.
UMass Donahue Institute Research and Evaluation Group 14

Fall 2011 Superintendents Survey Cohort 2
Table 10: Cohort 2 – Content Day Ratings(N=26)
Excellent Good Fair Poor
Quality of facilitation 62% 31% 8% 0%
Effectiveness of small group work as a format for learning 58% 31% 12% 0%
Connection to Strategy in Action and other readings 54% 27% 12% 8%
Overall value of attending Content Days 50% 31% 12% 8%
The survey also asked respondents to reflect on and rate the clarity of expectations for work assignments that they were asked to complete as part of the program. As shown in Figure 8, nearly one-third responded that the clarity was excellent and half indicated that it was good. Nearly 20 percent responded that the clarity was fair or poor.
Figure 8: Cohort 2 – Clarity of Expectations for NSIP Work Assignments
Excellent31%
Good50%
Fair or Poor19%
Clarity of Expectations for Work Assigments (N=26)
Cohort 2 superintendents were asked to comment about the most valuable aspects of the NSIP content days. By far, the most commonly cited value was the opportunity to network and collaborate with other new superintendents and the coaches, particularly in a small group format. All responses are presented below.
o Readings and dialogue with others.
o Networking – enjoy the small group case study format.
o Networking with peers, working together in small groups, and sharing ideas and strategies.
o Small group strategy sessions.
o Making connections with other superintendents.
o Collaborating with other superintendents.
o Working with my coach and network group.
o Working in small groups during the day.
o I think the increased time with the mentor and in small groups has been great.
o The fact of being able to work with small groups to discuss similar situations is extremely valuable. It also validates what we are going through as a first year superintendent.
UMass Donahue Institute Research and Evaluation Group 15
Fall 2011 Superintendents Survey Cohort 2
o Ability to share ideas and products with other new superintendents as well as retired superintendents. Any work that this connected with day to day realities has been helpful (i.e., sharing draft entry plans and time to discuss, the exercise on initiatives/strategy, although would have liked more time on this.)
o I value most the opportunity to share with, and listen to “job alike” colleagues.
o Good to be with new colleagues.
o Mix of smaller and larger group discussions, opportunity to connect with my coach and the other new superintendents in his charge.
o I don’t think my approach has been substantively altered as a result of the curriculum because it is very closely aligned with my approach and my prior knowledge base. I find the days confirming/validating. I find the small group time, when we can learn from colleagues (new and veteran) about their challenges and responses and share the same from our own situations to be the most valuable part of the program.
o There have been at least several take-aways from each session that I can use immediately. And, of course, the networking is always good.
o The opportunity to learn from experts in school leadership and system development, as well as time to share with other new superintendents and coaches.
o Helping to develop the entry plan and the steps needed. Coaches are a value and a support for a new superintendent.
o When we receive practical tips and strategies for working in our districts.
o Helping me step back from the fray to consider how best to set an agenda that moves the district in ways that will ultimately impact instruction.
o The 30,000 foot level of leadership. The program helps me to see the bigger picture and to learn to operate in this level. I feel it is essential learning for me.
o Virtually nothing. If not for my coach asking me to hang in there, I would have withdrawn already.
Cohort 2 superintendents offered the following suggestions for improving the NSIP content days.
o Allow and encourage more mixing of the groups.
o I am not a fan of mixing the people up for group work. I understand that it is to get to know other superintendents, but it is nice to get comfortable with one set of people to do work with too.
o Based on participant data, formulate working groups by coach or demographic data of individual districts. Individuals in working groups would be consistent throughout the program, providing a dependable network of peer districts moving forward.
o More collegial interaction on common themes of interest with peers.
o Overall, I like how things are balanced. Perhaps it would be interesting to allow some time for more in-depth case conferencing regarding an issue that one of us bring to our small group. This would require just one person presenting and giving it the time it needs, and not going around with every group member.
UMass Donahue Institute Research and Evaluation Group 16

Fall 2011 Superintendents Survey Cohort 2
o There are a lot of things addressed in one day. It might be better received if the focus on each day was on one of the six standards within which we hold our licensure.
o Meetings are too often and it would help if there could be one theme per meeting rather than agendas that jump from one thing to the next. The schedule that jumps from one day to another each month has been more difficult to manage and explain to new staff than a consistent meeting time/day. Please consider Friday as very few evening meetings requiring preparation are scheduled on Fridays.
o Be sure to refer to and integrate all reading assignments. Include more opportunities to process the program content with small groups regarding how we are building our leadership teams, useful processes, protocols, etc. The beauty of this program is that it allows time for us to think and process what we are “in the middle of” in our everyday work. The more we can capitalize on this and have time to “think out loud” with our colleagues and coaches, the better.
o More of the practical tips and “how to” ideas. (Note, this is the same superintendent who identified practical tips and strategies as a strength of content days.)
o More practical advice from real practitioners, not Harvard professors.
o We have not worked on budgeting yet, however, I hope that will be a content day.
o I don’t find the MESPA room conducive to good facilitation/discussion. At times it is far too noisy to be able to pay attention to, or hear, people sharing in small groups. So far, it seems as if the content has been established for us. At times the content is relevant to my everyday work, but more often than not it does not help me deal with the day-to-day challenges/reality of the superintendent. I feel quite competent with instructional leadership, relationship building, crafting a vision. I need help with time management, managing the workload and setting priorities.
o Shorten the day.
o Do not have a content day so close to the opening day of school.
o Perfect. Don’t change a thing.
o Keep doing what you have been doing!
o I think they’re well designed. The reason I haven’t rated their value as excellent is because of my strong prior knowledge/understanding. (Note, this is the same superintendent who identified prior knowledge base above.)
Coaching SupportSurvey data show that 31 percent of cohort 2 superintendents met with their coaches at least weekly, and 42 percent met every other week. The remaining 27 percent met on a monthly basis. At the time of the survey, 89 percent of cohort 2 superintendents indicated that they had established a high level of trust with their coaches. The others described their level of trust has moderate.
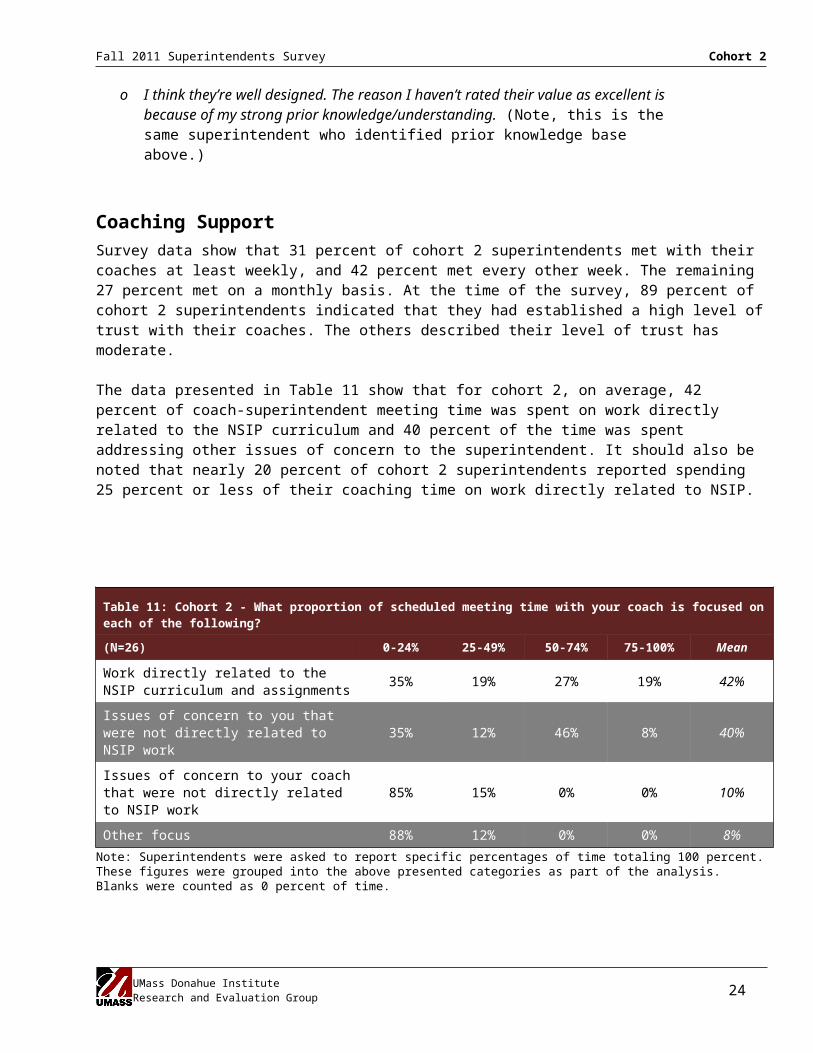
The data presented in Table 11 show that for cohort 2, on average, 42 percent of coach-superintendent meeting time was spent on work directly related to the NSIP curriculum and 40 percent of the time was spent addressing other issues of concern to the superintendent. It should also be noted that nearly 20 percent of cohort 2 superintendents reported spending 25 percent or less of their coaching time on work directly related to NSIP.
UMass Donahue Institute Research and Evaluation Group 17

Fall 2011 Superintendents Survey Cohort 2
Table 11: Cohort 2 - What proportion of scheduled meeting time with your coach is focused on each of the following?
(N=26) 0-24% 25-49% 50-74% 75-100% Mean
Work directly related to the NSIP curriculum and assignments
35% 19% 27% 19% 42%
Issues of concern to you that were not directly related to NSIP work
35% 12% 46% 8% 40%
Issues of concern to your coach that were not directly related to NSIP work
85% 15% 0% 0% 10%
Other focus 88% 12% 0% 0% 8%Note: Superintendents were asked to report specific percentages of time totaling 100 percent. These figures were grouped into the above presented categories as part of the analysis. Blanks were counted as 0 percent of time.
Table 12 suggests that leadership team development and entry planning are a substantial focus of coaching activities for cohort 2 superintendents. These are followed closely by support for classroom observation activities, although nearly one-quarter of cohort 2 superintendents report little or no coaching focus on classroom observation.
Table 12: Cohort 2 - To what extent have the following been a focus of conversations with your coach?
(N=26)
StrongFocus
Moderate Focus
Little or No Focus
Entry planning 58% 35% 8%
Leadership team development 65% 35% 0%
Classroom visits to observe instruction 46% 31% 23%
Superintendents were also given the opportunity to identify other issues that had been a focus of their coaching conversations. The most frequently cited topics related to working with school committees. Respondents’ specific comments were:
o Specific personnel issues
o School committee dynamics
o Dealing with issues/problems with my school committee.
o Lots of conversation about leadership hiring processes, about school committee relations, about matching my style to the leadership team and the community . . .
o The role of the superintendent. Interactions with school committee. Working through complex change within a district. Budget preparation.
o I have been dealing with a district-wide reconfiguration and my coach has been absolutely invaluable in helping me navigate the challenges associated with this.
UMass Donahue Institute Research and Evaluation Group 18
Fall 2011 Superintendents Survey Cohort 2
o Opening day of school. “No school” protocols. Filling administrative positions. Brainstorming strategies to work with my school committee. Strategies for communication with school committee.
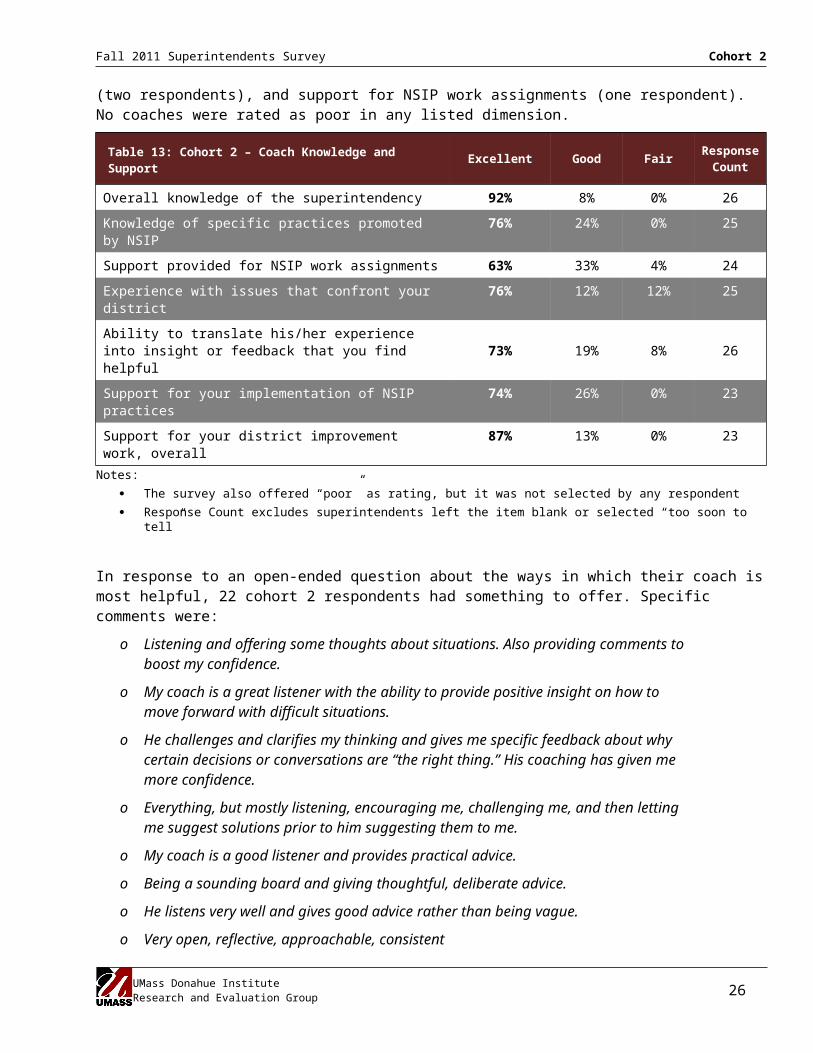
Table 13 presents cohort 2 superintendents’ ratings of their coaches, which are generally positive, with most responses falling into the excellent category. Ratings were highest in relation to coaches’ overall knowledge of the superintendency and support for district improvement work followed closely by knowledge of specific practices promoted by NSIP and support for implementation of NSIP practices. Only three of the areas questioned yielded fair ratings. These were: experience with issues that confront your district (three respondents), ability to translate experience into helpful insight (two respondents), and support for NSIP work assignments (one respondent). No coaches were rated as poor in any listed dimension.
Table 13: Cohort 2 – Coach Knowledge and Support Excellent Good Fair Response Count
Overall knowledge of the superintendency 92% 8% 0% 26
Knowledge of specific practices promoted by NSIP 76% 24% 0% 25
Support provided for NSIP work assignments 63% 33% 4% 24
Experience with issues that confront your district 76% 12% 12% 25
Ability to translate his/her experience into insight or feedback that you find helpful
73% 19% 8% 26
Support for your implementation of NSIP practices 74% 26% 0% 23
Support for your district improvement work, overall 87% 13% 0% 23Notes:
The survey also offered “poor” as rating, but it was not selected by any respondent Response Count excludes superintendents left the item blank or selected “too soon to tell”
In response to an open-ended question about the ways in which their coach is most helpful, 22 cohort 2 respondents had something to offer. Specific comments were:
o Listening and offering some thoughts about situations. Also providing comments to boost my confidence.
o My coach is a great listener with the ability to provide positive insight on how to move forward with difficult situations.
o He challenges and clarifies my thinking and gives me specific feedback about why certain decisions or conversations are “the right thing.” His coaching has given me more confidence.
o Everything, but mostly listening, encouraging me, challenging me, and then letting me suggest solutions prior to him suggesting them to me.
o My coach is a good listener and provides practical advice.
o Being a sounding board and giving thoughtful, deliberate advice.
o He listens very well and gives good advice rather than being vague.
o Very open, reflective, approachable, consistent
UMass Donahue Institute Research and Evaluation Group 19

Fall 2011 Superintendents Survey Cohort 2
o He is open and receptive to the district issues that I convey to him. He genuinely conveys a desire to be of assistance and to share his experience.
o Reinforcement of the direction I have set and the work I have implemented as part of the entry plan process.
o My coach allows me to work through problems by asking questions and acting as a sounding board.
o Listening to my description of my situation and then helping me to clarify my way forward, but also sharing his expertise in the form of his own past approaches, suggestions of alternatives to the ideas I’ve already considered, cautions regarding potential stumbling blocks.
o Making me feel supported.
o He is very supportive and knowledgeable.
o Constant communication and support for difficult issues.
o Keeping the connection between us active. It is easy to get distracted in the work.
o My coach is very calm and positive and is certainly open and willing to be contacted.
o Always available. If she doesn’t have an answer she knows where to get one. Her networking.
o Available for questions.
o My coach is experienced in all areas and is able to break things down and keep me on track.
o He is a great resource and a great match for me. In addition to regular visits he is always available to me when I have concerns or questions.
Respondents also offered the following suggestions for improving NSIP’s coaching component:
o I have a few very tough issues to contend with. Although my coach is extremely supportive and has ideas to share, I don’t believe my coach has experience dealing with them.
o Hard to say. I think it is more me than him that prevents me from conferring with him more often.
o I would appreciate more critical feedback. Maybe there have not yet been enough opportunities to observe me, however, feedback has been very positive so far with little suggestion of new things to do or try.
o Affiliation and meetings should be scheduled with the beginning schedule. Clear expectations of what needs to be observed in advance.
o I think there’s nothing wrong with these coaches also sharing their expertise. I think my coach at times feels doing this is a transgression, which is a shame. He’s been a successful superintendent for a very long time. Why shouldn’t I benefit from his many years of learning?
o It would be helpful to have a menu of coaching options available from which we could choose. It could be structured around the main themes of the program. For example, for instructional leadership the coaching options could be: class visits using any one of a few different protocols, examining an instructional leadership dilemma together, role playing a difficult conversation to address an issue, etc.
UMass Donahue Institute Research and Evaluation Group 20

Fall 2011 Superintendents Survey Cohort 2
Current Capacity and PracticeThe cohort 2 survey included a series of questions intended to capture some “baseline” information about participants’ current capacity and practice. The results can be found in Tables 14 and 15. Future surveys will probe on changes in these areas.
Coming into their jobs, cohort 2 superintendents had the most confidence in their abilities to think strategically about district improvement and serve as an effective instructional leader – in each case 96 percent of respondents rated themselves as excellent or good. They also give themselves strongly positive ratings for their abilities to create effective leadership teams, develop instructional leadership skills among school leaders, forge collaborative relationships with key constituencies, and manage resources in a strategic manner – each with more than 80 percent of respondents rating themselves as excellent or good. In contrast, in two areas (establishing effective systems for supervision and evaluation and thinking strategically about district improvement), nearly 40 percent of respondents rated their initial abilities as fair. No respondents selected poor in any areas.
Table 14: Cohort 2 – Superintendents’ Initial Abilities
(N=26)Excellent Good Fair Unsure
Serve as an effective instructional leader 42% 54% 4% 0%
Think strategically about district improvement 23% 73% 4% 0%
Conduct root cause analysis of instructional problems 19% 35% 39% 8%
Manage resources in a strategic manner 19% 65% 15% 0%
Develop instructional leadership skills among school leaders 27% 62% 12% 0%
Create effective leadership teams 23% 65% 12% 0%
Forge collaborative relationships with key constituencies 35% 50% 12% 4%
Establish effective systems for supervision and evaluation 12% 50% 39% 0%Notes: The survey also offered “poor” as rating, but it was not selected by any respondent
In terms of relationships with key constituencies, with the exception of one respondent who indicated it was too soon to tell, all cohort 2 superintendents felt that they had a positive relationship with school building leaders. Similarly, all but one felt that their relationship with the school committee was positive. Most also indicated that they had good relationships with their teachers unions. Although still generally perceived as positive, substantially fewer respondents indicated that their relationships with other community and business leaders were excellent.
Table 15: Cohort 2 – Relationship with Key Constituencies Excellent Good Fair Response Count
School committee 58% 39% 4% 26
School building leaders 60% 40% 0% 25
Teachers union 46% 42% 13% 24
Other community or business leaders 26% 65% 9% 23Notes:
The survey also offered “poor” as rating, but it was not selected by any respondent Response Count excludes superintendents left the item blank or selected “too soon to tell”
UMass Donahue Institute Research and Evaluation Group 21
Fall 2011 Superintendents Survey Cohort 2
The survey also asked respondents to approximate the proportion of their current work time focused on activities and initiatives that will have a direct impact on the quality of instruction in their district. As shown in Figure 9, about 28 percent of cohort 2 superintendents indicated that at least 60 percent of their time is focused on activities and initiatives that will have a direct impact on the quality of instruction in their district. About 40 percent spend between 40 to 59 percent of their time on such activities and about one-third spend 20 percent of less of their time focused on instructional improvement. Four superintendents offered related comments:
Figure 9: Cohort 2 – Focus on Instructional Improvement
8%
24%
40%
24%
4%
Proportion of Time Directly Impacting Quality of Instruction (N=25)
0-19 percent20-39 percent40-59 percent60-79 percent80-100 percent
o I am actively seeking ways to increase this amount of time and I have also begun a process of working with central office and site-based leaders to do the same!
o When you are new to a district there is a great deal to learn about the playing field which takes time. As I enter November I feel ready to begin the work of instructional leadership because I have taken the time to learn about the district.
o I wish it could be more, but there are so many fires to put out all the time.o I have begun increasing that percentage through my leadership team and conducting walkthroughs.
As shown in Table 16, cohort 2 superintendents’ ratings of their districts’ functioning on the ten targeted NSIP practices and capacities were most frequently rated as good (seven) or fair (three). The most positive ratings (excellent or good) were given to overall quality of instruction in the district (85 percent), district-level focus on instructional improvement (81 percent), and productivity of district leader team meetings (77 percent). The fewest positive ratings were given to administrative evaluation systems (16 percent), teacher evaluation systems (27 percent) and alignment of budget to overall district improvement strategy (43 percent).
Table 16: Cohort 2 – Current District Functioning(N=26)
Excellent Good Fair Poor Unsure
District-level focus on instructional improvement 12% 69% 19% 0% 0%
District-level strategy for instructional improvement 12% 46% 39% 4% 0%
School-level focus on instructional improvement 12% 58% 31% 0% 0%
Principal readiness to lead instructional improvement 15% 54% 31% 0% 0%
Overall quality of instruction in your district 8% 77% 15% 0% 0%
Alignment of budget to district improvement strategy 8% 35% 39% 19% 0%
Productivity of school committee meetings 15% 50% 19% 15% 0%
Productivity of district leader team meetings 31% 46% 23% 0% 0%
UMass Donahue Institute Research and Evaluation Group 22

Fall 2011 Superintendents Survey Cohort 2
Administrative evaluation systems 4% 12% 58% 23% 4%
Teacher evaluation systems 4% 23% 50% 19% 4%
Participant ExperienceSurvey results suggest a high degree of satisfaction among cohort 2 superintendents participating the New Superintendents Induction Program.
As shown in Figure 10, half of all the participants reported that overall they were highly satisfied with the program and 42 percent indicated that they were mostly satisfied. Only two individuals responded that they were mostly dissatisfied and none selected the highly dissatisfied response option. Similarly, as shown in Figure 11, 66 percent indicated without qualification that the program was a good fit for them and an additional 31 percent reported that it was a good fit, “but only to a point.” Only one respondent indicated that the program was not a good fit for them.
Figure 10: Cohort 2 – Overall Satisfaction with NSIP
50%42%
8%
Highly Satisfied Mostly Satisfied Mostly Dissatisfied0%
20%
40%
60%
80%
100%
Overall Satisfaction with NSIP (N=26)
Superintendents offered the following related comments:
o I believe it is about relationships. I have a great coach therefore it is a great program.
o The time constraints have been a challenge
o Time commitment. More 1:1 coaching would be better. Need regional focus.
o Too many assumptions about the “whole” group of superintendents and a one-sized curriculum.
Figure 11: Cohort 2 – Is NSIP a Good Fit for You?
65%
31%
4%
Yes, it is a good fit for me
Yes, but only to a point
No, it is not a good fit for me
0%
20%
40%
60%
80%
100%
Is NSIP a Good Fit for You? (N=26)
o More input from mentees and more choice collegial groups with expert mentors to share support in the first months.
o The content days are helpful and the opportunity to think through and plan for implementing research based best practices in fantastic. Perhaps consider a way to match new superintendents with coaches through some sort of survey prior to making assignments.
o While I have enjoyed the days together as a cohort, my experience with entry planning has not proven helpful. I was in the district prior to moving to the superintendency and I think I have a fair handle on various constituent beliefs about the system. I understand the value of listening and developing relationships that are different from when I was in my previous role, but I have still struggled with the entry plan process. To some degree, I feel the process is taking time away from more important challenges. Our district is also engaged in strategic planning now, so juggling the NSIP cohort and
UMass Donahue Institute Research and Evaluation Group 23
Fall 2011 Superintendents Survey Cohort 2
strategic planning at the same time has been a significant challenge. So, having said that, I am happy to complete year one of the program (and look forward to it), but at this point I may not commit to a second year.
o The coaching and small group work is incredibly helpful. The curriculum is very appropriate, but because so much of it is familiar turn, it is not helping me to grow particularly. However, it addresses the right topics at the right time of year, so lays the table for the rich coaching and small group discussions which are on target.
o Looking forward to additional content- particularly around budget creation and presentation strategies. Can use more in this area.
o There is a sense in this program that we are being told what to do based on what’s important to the program and not necessarily what’s important to the superintendent at a particular time. This is a bad combination. When you are new at your work, it is important to learn how to integrate what you already know and can do well with what you are just learning. This program makes WAY TOO MANY assumptions that there is a lack of capacity in instructional leadership and this makes people who know they are skilled in this area feel like the program is a waste of time, especially when there are other areas that we would actually be seeking help to learn more. The lack of a customized curriculum for this program is a huge flaw.
UMass Donahue Institute Research and Evaluation Group 24

Fall 2011 Superintendents Survey Conclusion
Conclusion
The following section summarizes key findings from surveys of both cohorts of superintendents.
I. District Context and Current Practice – Cohorts 1 and 2Initial Capacity – Cohort 2
Coming into their jobs, cohort 2 superintendents had the most confidence in their abilities to think strategically about district improvement and serve as an effective instructional leader. They also gave themselves strongly positive ratings for their abilities to create effective leadership teams, develop instructional leadership skills among school leaders, forge collaborative relationships with key constituencies, and manage resources in a strategic manner. In contrast, in the areas of establishing effective systems for supervision and evaluation as well as thinking strategically about district improvement, nearly 40 percent of cohort 2 superintendents rated their initial abilities as fair.
Leadership Team Turnover – Cohort 1
Survey data show that most cohort 1 superintendents are dealing with some degree of turnover among their leadership teams. Eleven reported that at least one-quarter of their combined leadership team (central office and building principals) was new to their positions this academic year. In three of these cases the turnover rate was 50 percent or more.
District Functioning – Cohorts 1 and 2
Overall, cohort 1 superintendents report improvement in several areas of district functioning. The areas of greatest improvement were district-level focus on instructional improvement where positive responses (good or excellent) increased from 35 percent to 96 percent and the productivity of district leader team meetings which improved from 43 percent positive to 96 positive. Other areas of improvement were principal readiness to lead instructional improvement, productivity of school committee meetings, and alignment of budget to the overall district improvement strategies. For all of these more than half of the fall 2011 ratings were positive.
Cohort 2 superintendents’ ratings of their districts’ functioning on the ten targeted NSIP practices and capacities were most frequently rated as good or fair. The most positive ratings (excellent or good) were given to overall quality of instruction in the district, district-level focus on instructional improvement, and productivity of district leader team meetings. The fewest positive ratings were given to administrative evaluation systems, teacher evaluation systems and alignment of budget to overall district improvement strategy.
Relationships with Key Constituencies – Cohorts 1 and 2
At the beginning of their second year, most cohort 1 superintendents report that they have positive (good or excellent) relationships with key constituencies. By far the strongest relationships are with the central office leadership team followed by both school building leaders and school committees. All but two respondents indicated that their relationships with other business and community leaders is positive, though only about one-quarter rated that relationship as excellent. Although 17 percent rated their relationship with the teachers as fair, more than one-third reported that it was excellent.
UMass Donahue Institute Research and Evaluation Group 25
Fall 2011 Superintendents Survey Conclusion
With the exception of one respondent who indicated it was too soon to tell, all cohort 2 superintendents felt that they had a positive relationship with school building leaders. Similarly, all but one felt that their relationship with the school committee was positive. Most also indicated that they had good relationships with their teachers unions. Although still generally perceived as positive, substantially fewer respondents indicated that their relationships with other community and business leaders were excellent.
II. NSIP Objectives – Cohort 2Cohort 2 survey data suggest that the NSIP objectives are generally very well aligned with superintendents’ priorities for improvement in their districts. The strongest alignment is in building instructional leadership, developing effective leadership teams and developing collaborative relationships with key constituencies. Other well-aligned objectives are strategic management of resources to support district improvement and developing effective systems for supervision and evaluation.
III. Curriculum and Content Days – Cohort 2Cohort 2 superintendents were asked to respond to several questions relating to their experience with the curriculum and content days. Overall, they offered an overwhelmingly positive view of the NSIP curriculum as delivered through the content days. All but a few agreed that the curriculum is integrated effectively as part of a coherent curriculum, sequenced in a manner that supports learning, and clear in its connection to NSIP’s year-end goals.
They provided strong ratings for quality of the facilitation, effectiveness of small group work as a format for learning. While still high, ratings for the connection between content days and assigned readings and the overall value of the content days were somewhat lower – each with 20 percent of respondents indicating that these aspects were fair or poor. Similarly, while generally positive about the clarity of expectations for work assignments, nearly 20 percent of cohort 2 superintendents rated this aspect as fair or poor.
When asked to comment about the most valuable aspects of the NSIP content days, by far the most commonly cited value was the opportunity to network and collaborate with other new superintendents and the coaches, particularly in a small group format.
IV. Coaching – Cohorts 1 and 2On the whole, NSIP participants were very positive about the support provided through the coaching component of the program. Many explicitly cite it as the most valuable aspect of NSIP expressing appreciation of their coach’s ability to actively listen, offer advice and help them devise solutions to problems.
At the time of the survey, 89 percent of cohort 2 superintendents indicated that they had established a high level of trust with their coaches. The others described their level of trust as moderate. Cohort 2 superintendents offered the highest ratings in relation to their coaches’ overall knowledge of the superintendency and support for district improvement work followed closely by knowledge of specific practices promoted by NSIP and support of implementation of NSIP practices. No coaches were rated as poor in any listed dimension.
Frequency of communication
All superintendents reported having substantive communication with their coach at least once a month. About two-thirds of cohort 1 superintendents and three-quarters of cohort 2 superintendents engaged with their coach on a bi-weekly or weekly basis.
Focus of meeting time
UMass Donahue Institute Research and Evaluation Group 26

Fall 2011 Superintendents Survey Conclusion
On average about half of cohort 1 coaching time and 42 percent of cohort 2 coaching time was focused on work directly related to the NSIP curriculum. However, about 25 percent of cohort 1 superintendents and 20 percent of cohort 2 superintendents reported spending less than one-quarter of their coaching time on work directly related to NSIP. On average, the next most common area of focus was other issues of concern to the superintendent (33 percent for cohort 1 and 40 percent for cohort 2).
Comparing the spring and fall means for cohort 1 shows little change in the average distribution of coaching focus. Yet an examination of changes in individual responses reveals real shifts in focus for individual superintendents. About half of the cohort 1 superintendents reported an increase in focus on NSIP related activities while about one-third reported a decrease. Nearly 40 percent reported an increase and about half reported a decrease in focus on other issues of concern to the superintendent. And 57 percent reported an increase in focus on other issues of concern to their coach.
If not already explicitly established, it may be useful for program managers to articulate broad expectations about the amount of formal coaching time that should be focused directly on work related to the NSIP curriculum and assignments while maintaining time to address some other important concerns identified by both superintendents and their knowledgeable coaches.
Cohort 1 survey data suggest that creating and implementing district improvement strategies are a substantial focus of coaching activities entering the second year of the program. This is followed closely by support for classroom observation activities. Refining the superintendent’s theory of action appears to receive less attention, which may be a valid reflection of superintendent’s current stages of program implementation. Given the launch of the District Governance Support Project (DGSP) and the intention for the two programs to be mutually reinforcing, it is noteworthy that five of the six who reported that school committee relationships are a strong focus of their coaching are from districts that are expected to participate in DGSP.
Cohort 2 superintendents report that leadership team development and entry planning are a substantial focus of their coaching activities. These are followed closely by support for classroom observation activities; although nearly one-quarter of cohort 2 superintendents report little or no coaching focus on classroom observation.
V. NSIP Activities – Cohorts 1 and 2Strategy for District Improvement – Cohort 1
All cohort 1 superintendents reported that they had developed a strategy for district improvement. It is interesting to note that only 87 percent reported that they had completed their theory of action – presumably a precursor to strategy development. About one-quarter of cohort 1 superintendents indicated that their school committee was substantially involved in the strategy development process. However, 30 percent indicated that this critical group had little or no involvement in the process. All but two cohort 1 superintendents reported that their district was actively implementing their improvement strategy with the majority indicating that they were deeply into the work.
Focus on Instructional Improvement – Cohorts 1 and 2
More than two-thirds of cohort 1 superintendents indicated that at least 60 percent of their time is focused on activities and initiatives that will have a direct impact on the quality of instruction in their district. About 20 percent spend between 40 to 59 percent of their time on such activities.
About 28 percent of cohort 2 superintendents indicated that at least 60 percent of their time is focused directly on the quality of instruction. About 40 percent spend between 40 to 59 percent of their time on such activities. However, about one-third reported focusing no more than 20 percent of their time on instructional improvement.
UMass Donahue Institute Research and Evaluation Group 27

Fall 2011 Superintendents Survey Conclusion
VI. Recommendations for ImprovementSurvey responses suggest that DESE and MASS should consider the following ideas for further strengthening the New Superintendent’s Induction Program.
Further develop the approach to small group work with an emphasis on differentiated instruction and collaborative problem solving. Gather more information to determine whether participants have a preference for establishing consistent small groups within and across content days or varying the group assignments. Consider establishing a formal mechanism for electronic collaboration (i.e., listserv, message board, wiki) as a means of collaboration among participants.
Strengthen the linkage between content days and assigned readings/activities. Connect curriculum content and assignments more explicitly to district priorities and initiatives.
Continue to strengthen the role of the coaches during and between content days. If not already established, it may be useful for program managers to articulate broad expectations about the amount of formal coaching time that should be focused directly on work related to the NSIP curriculum and assignments while maintaining time to address some other important concerns identified by both superintendents and their knowledgeable coaches.
Solicit additional input about what factors are most important in creating effective coaching relationships and consider defining a more formal approach for matching superintendents with coaches.
Many superintendents are hoping/waiting for NSIP to address more “nuts and bolts” issues including budgeting and time management. While the program is not intended to provide professional development on these issues, it may be advisable to regularly inform participants about such opportunities provided through agencies such as MASS.
Facilitate better relationships and understanding between superintendents and their school committees by increasing collaboration/coordination across the NSIP and DGSP programs.
UMass Donahue Institute Research and Evaluation Group 28
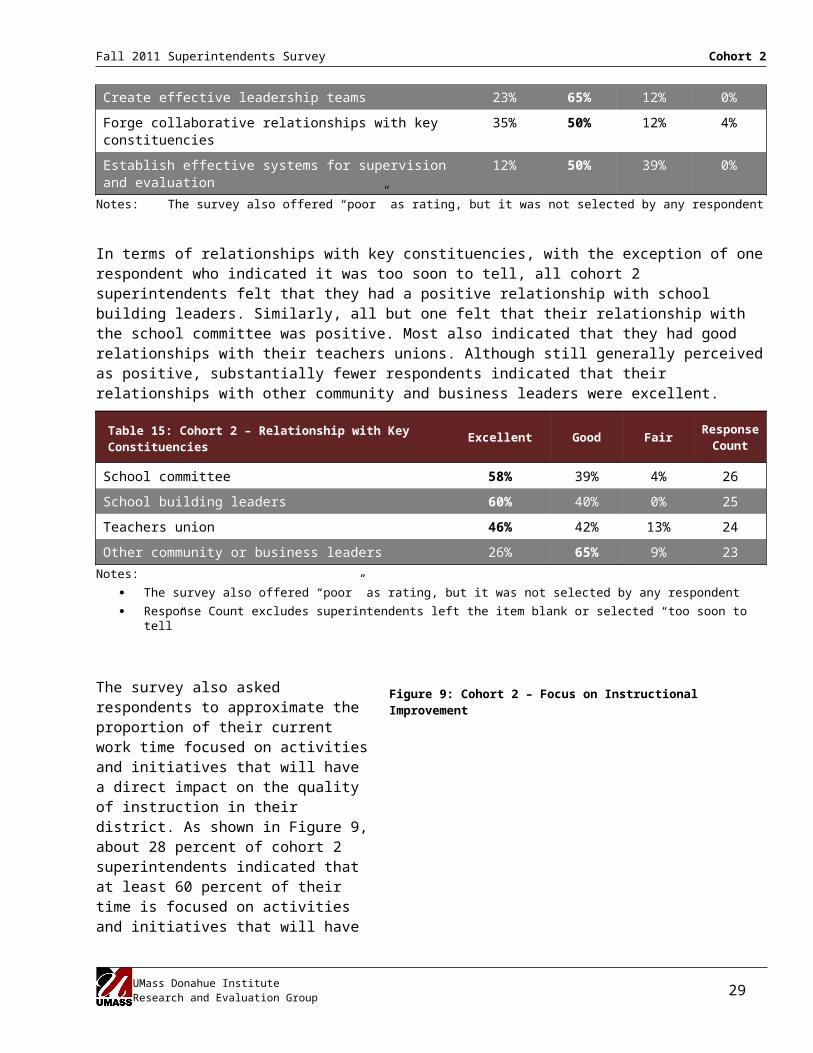
Fall 2011 Superintendents Survey Appendix A – Participating Superintendents
Appendix A – Participating Superintendents
The following is a list of superintendents participating at the time of survey administration in November 2011.
Cohort 1
Maria Geryk Amherst-Pelham Regional
Kathleen Bodie Arlington
Mary-Beth Hamel Ayer-Shirley Regional
Marie Galinski Beverly
Steven Lamarche Bourne
Jeff Granatino Canton
Mary Bourque Chelsea
Stacy Scott Dracut
Gordon Smith East Longmeadow
Nancy Follansbee Easthampton
John Lavoie Greater Lawrence Voc-Tech
David Dupont Holyoke
Elizabeth Zielinski King Philip Regional
Mary Lou Bergeron Lawrence
Michael Cozort Nantucket
Mary Lou Francis New Bedford
Mark Kerble Newburyport
James Hayden Norwood
Oscar Santos Randolph
John Doherty Reading
Eric Ely Southbridge
John O’Connor Tewksbury
Russell Johnson West Springfield
UMass Donahue Institute Research and Evaluation Group 29

Fall 2011 Superintendents Survey Appendix A – Participating Superintendents
Cohort 2
Michele Robinson Amesbury
Edward Fleury Bellingham
Barbara Cataldo Cohasset
Ana Riley Dartmouth
Debra Spinelli Foxborough
Nadine Ekstrom Gill-Montague
Richard Safier Gloucester
Jay Cummings Grafton
Linda Enos Greater New Bedford Voc-Tech
Jonathan Landman Hopkinton
James Jolicoeur Leominster
Jean Franco Lowell
David DeRuosi Malden
Scott Borstel Marshfield
Joseph Maruszczak Mendon-Upton Regional
Steven Sharek Montachusett Regional
John Provost North Brookfield
Brian Salzer Northampton
Timothy Farmer Sharon
Thomas Hickey South Shore Regional Voc-Tech
Anne Wilson Sudbury
Susan Nicholson Waltham
Paul Stein Wayland
Beth Schaper West Boylston
Suzanne Scallion Westfield
John Macero Winthrop
UMass Donahue Institute Research and Evaluation Group 30