new mexico state personnel · pdf filenew mexico state personnel office ... spo reviews and...
TRANSCRIPT

New Mexico
State Personnel Office FY15 3rd Quarter Workforce Report
Mission: To deliver human capital management programs that advance all State agency missions while protecting the
rights of our State employees

P a g e | 2
Contents Director’s Report ................................................................................................................................................................................................ 3
Classified Service at a Glance (March 31, 2015) .................................................................................................................................... 5
Total Compensation .......................................................................................................................................................................................... 5
Multiple Components of Pay (MCOP) ......................................................................................................................................................... 6
Annual Key Performance Measures ............................................................................................................................................................ 8
Overtime ................................................................................................................................................................................................................. 9
Sick Leave ........................................................................................................................................................................................................... 10
Annual Leave ...................................................................................................................................................................................................... 10
Classified Service Recruitment Trends .................................................................................................................................... 11
Continuous Advertisements ......................................................................................................................................................................... 12
Applications ........................................................................................................................................................................................................ 13
Average Days to Fill a Position by Answer Date by Agency ............................................................................................................ 15
Classified Service Hires and Separations ................................................................................................................................ 19
New Hires by Fiscal Year (FY11-FY14) ................................................................................................................................................... 19
FY15 New Hires & Separations by Quarter ........................................................................................................................................... 19
New Hire Compa-Ratio ................................................................................................................................................................................... 20
FY15 3rd Quarter New Hire Compa-Ratio by Pay Band .................................................................................................................... 21
New Hire Demographics ................................................................................................................................................................................ 22
FY15 Classified Separations by Reason ................................................................................................................................................... 22
FY15 3rd Quarter Classified Separations by Agency ........................................................................................................................... 23
Statewide Classified Turnover Rate .......................................................................................................................................... 24
Statewide Classified Turnover Rate by Agency ................................................................................................................................... 24
Vacancy Rates .................................................................................................................................................................................... 26
Quarterly Vacancy Rates for the 20 Key Agencies .............................................................................................................................. 26
Training ............................................................................................................................................................................................... 26
Instructor – Led Core Curriculum Classes.............................................................................................................................................. 26
ELearning Mandatory Classes ..................................................................................................................................................................... 28
Additional Training .......................................................................................................................................................................................... 28
Adjudication ...................................................................................................................................................................................... 29
Labor Relations ................................................................................................................................................................................ 30
Union Represented vs. Non Union ............................................................................................................................................................. 30
Quarterly Performance Measures ............................................................................................................................................. 33

P a g e | 3
Director’s Report
The State Personnel Office (SPO) mission is to provide the State of New Mexico with human resource (HR) leadership,
direction and service in order to maximize service to the citizens of New Mexico. A quarterly report is issued by SPO, as
required by the Accountability in Government Act (AGA), to address the HR metrics established within the General
Appropriations Act (GAA). The report is updated quarterly to provide timely metrics which are used to enhance the
State’s ability to address HR issues impacting management throughout State government.
SPO is required to conduct and lead workforce planning and policy development throughout State government on HR
issues. To accomplish this mission, SPO, in partnership with the State Personnel Board and State agencies, endeavors to:
• Provide timely and quality information and guidance to the Board, the Governor and State government
agencies on the delivery of HR programs;
• Recommend improvements in State government emphasizing economy, efficiency, compliance and
effectiveness; and,
• Conduct value-added reviews and projects as requested by the Board and/or Director.
SPO continues to focus on recruitment, including working with State agencies to decrease the amount of time to review
and refer applicants and improve overall hiring efficiency. Every year, the number of hits on posted applications grows,
highlighting the State’s increased visibility as an employer of choice. This quarter, posted applications on NeoGov were
viewed over 1 million times, bringing the year to date views to 3.3 million. Comparatively, in FY13 there were 3.7 million
views total. 52,065 applications were received this quarter, an increase of 14% from last quarter.
The number of days from the first day a job is advertised to the day a job is accepted was 46.8 days and the average days
to process and refer applications was 8.8 days this quarter. This quarter’s overall average days to hire was 70 days; last
year, the average was 76.
This quarter, 751 new hires were made while only 567 employees separated from State service. This trend is evidence of
the State’s continuing work to retain qualified employees. Of the entire State service, 2.7% of employees separated
voluntarily while only 0.5% separated involuntarily. The Statewide Vacancy Rate for the 3rd Quarter was 11.7%; SPO’s
Career Services Bureau and State agencies continue to work diligently to reduce vacancy rates by managing the time it
takes to advertise and fill a position.
Sincerely,
Justin R. Najaka
Interim Director

P a g e | 4
Workforce Overview
The State’s workforce demographics show change due to retirements, normal attrition and budgetary limitations. SPO
has initiated the following critical actions to stabilize and increase a qualified work force:
• An on-line application process (NEOGOV);
• Revision of classifications to closely align job duties with the requisite minimum qualifications required; and
• Continuation of a compensation review to make State classifications competitive with both the public and
private sector.
Executive branch employee levels have remained stable since FY12 as a result of careful assessment of the need to fill
vacant positions, improvements in business processes, revision of restrictive non-competitive compensation plans and
employee retirements and resignations. Legislative employee headcounts traditionally increase in the 3rd Quarter as a
result of hiring for the Legislative session.
25.1 24.1 22.6 22.2 22.7 22.8
0.0
5.0
10.0
15.0
20.0
25.0
30.0
FY10 FY11 FY12 FY13 FY14 FY15 (YTD)
Tho
usa
nd
s
Employee Headcount FY08-FY15
FY11 FY12 FY13 FY14 FY15
Executive -4.2% -6.6% -2.3% 2.7% -2.95%
Legislative -3.4% 0.6% 1.2% -4.6% 16.4%
Courts -1.4% -2.6% 0.4% -0.3% 2.2%
-8.0%
-3.0%
2.0%
7.0%
12.0%
17.0%
Pe
rce
nt
ch
an
ge
Fiscal Year Percent of Increase/Decrease (Employee Headcount)
P a g e | 5
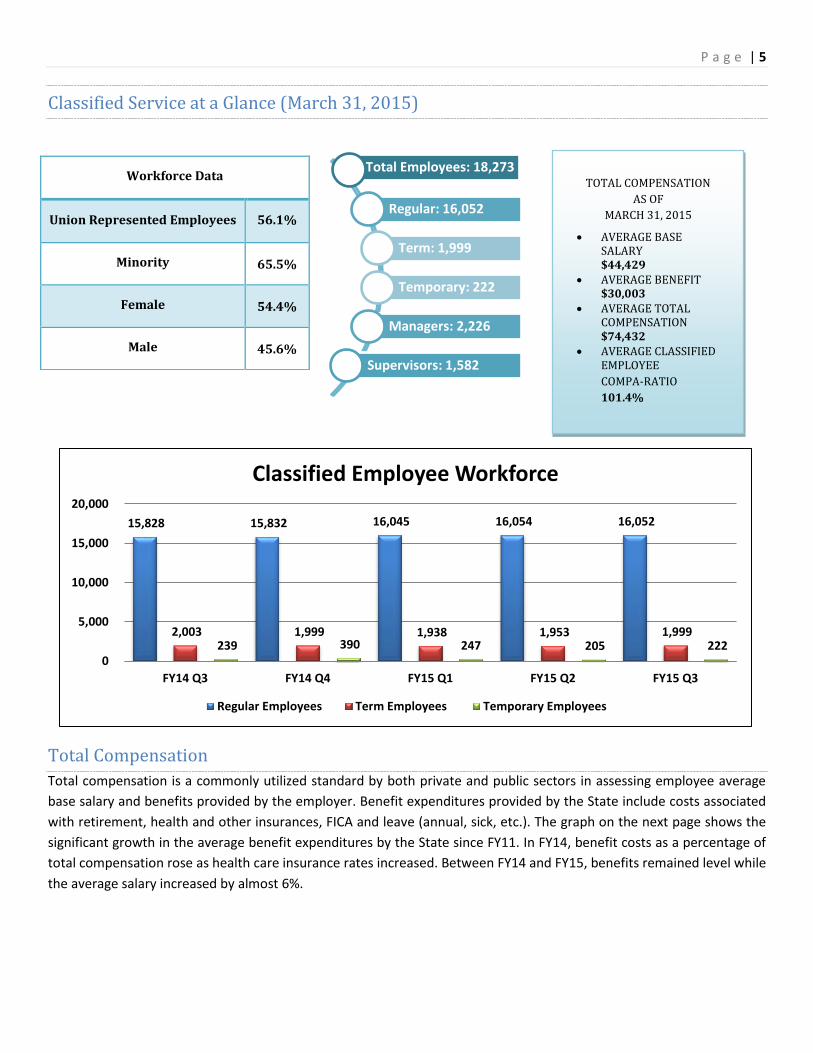
TOTAL COMPENSATION
AS OF
MARCH 31, 2015
AVERAGE BASE SALARY $44,429
AVERAGE BENEFIT $30,003
AVERAGE TOTAL COMPENSATION $74,432
AVERAGE CLASSIFIED EMPLOYEE
COMPA-RATIO
101.4%
Classified Service at a Glance (March 31, 2015)
Total Compensation
Total compensation is a commonly utilized standard by both private and public sectors in assessing employee average
base salary and benefits provided by the employer. Benefit expenditures provided by the State include costs associated
with retirement, health and other insurances, FICA and leave (annual, sick, etc.). The graph on the next page shows the
significant growth in the average benefit expenditures by the State since FY11. In FY14, benefit costs as a percentage of
total compensation rose as health care insurance rates increased. Between FY14 and FY15, benefits remained level while
the average salary increased by almost 6%.
15,828 15,832 16,045 16,054 16,052
2,003 1,999 1,938 1,953 1,999 239 390 247 205 222
0
5,000
10,000
15,000
20,000
FY14 Q3 FY14 Q4 FY15 Q1 FY15 Q2 FY15 Q3
Classified Employee Workforce
Regular Employees Term Employees Temporary Employees
Workforce Data
Union Represented Employees 56.1%
Minority 65.5%
Female 54.4%
Male 45.6%
Total Employees: 18,273
Regular: 16,052
Term: 1,999
Temporary: 222
Managers: 2,226
Supervisors: 1,582

P a g e | 6
Multiple Components of Pay (MCOP)
Various pay mechanisms permitted through the State Personnel Board (SPB) Rules were developed to enhance
recruitment and retention efforts. The following provisions within the SPB Rules are currently authorized:
Temporary Recruitment Differentials (TREC) are allowed for positions determined to be critical to meet the business needs of an agency experiencing difficulties in recruitment.
Temporary Retention Differentials (TRET) provide a methodology to retain an employee critical to meeting the business needs of an agency that would otherwise be disrupted if an employee left the position.
Temporary Salary Increases (TSI) are provided when an employee temporarily accepts and consistently performs additional duties characteristic of a job requiring greater responsibility and accountability, making it a higher valued job. A TSI is a short-term salary measure that may be used until the conditions of the additional duties and responsibilities cease to exist and may not be extended beyond a one-year period.
In-Pay Band Salary Adjustments (IPBs) are allowed to increase an employee’s base compensation up to 10% within a Fiscal Year, provided the employee’s performance has demonstrated placement at a higher compa-ratio. This is a permanent pay mechanism that allows for salary growth within the Pay Band. The Department of Finance and Administration (DFA) also must review IPBs to ensure agency budget availability.
SPO initiates various actions to ensure compliance with SPB rules. SPO reviews and correctly classifies positions that
have a minimal budgetary impact on agencies and complied with SPB rules. The State’s pay structure has not been
comprehensively addressed since 2001, resulting in the loss of employees in many critical positions, creating a negative
impact on the State’s ability to attract and retain qualified applicants. The graph on the next page shows the impact of
these efforts as a significant decrease in all temporary MCOPs.
$41,986 $41,912 $41,850 $41,912 $44,429
$27,867 $27,328 $28,107 $30,244 $30,003
$0
$10,000
$20,000
$30,000
$40,000
$50,000
$60,000
$70,000
$80,000
FY11 FY12 FY13 FY14 FY15 YTD
Total Classified Compensation
Average Base Salary Average Benefit
P a g e | 7
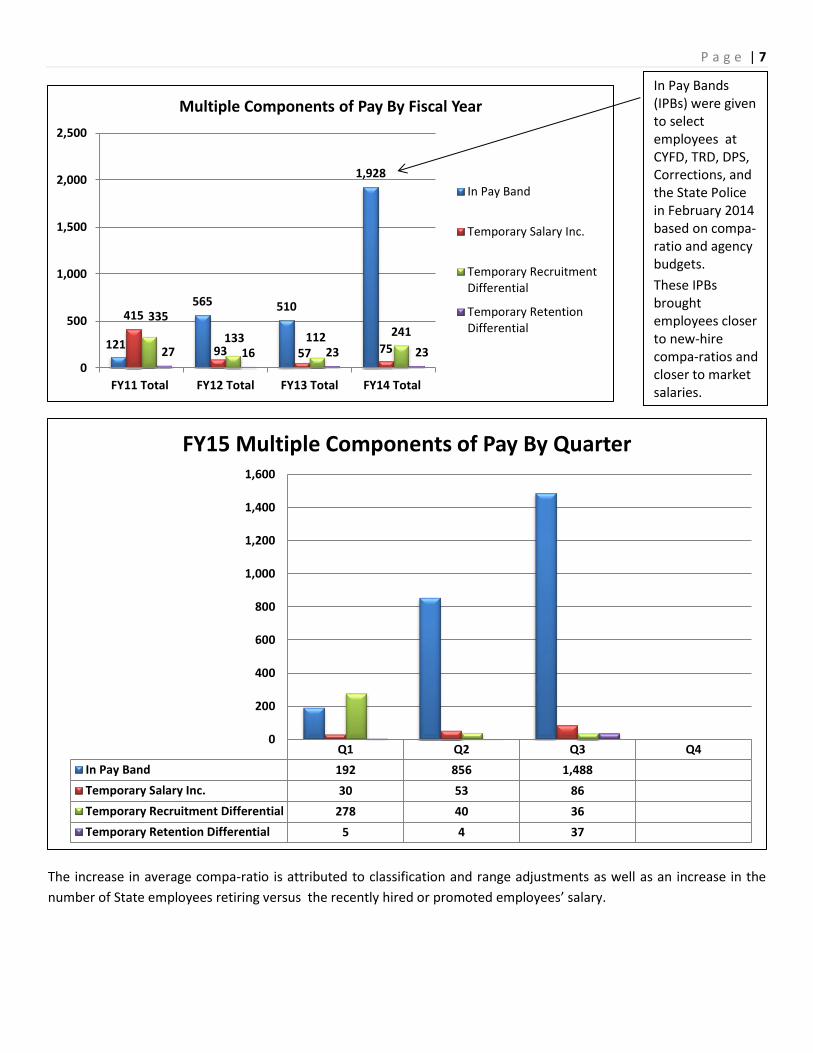
The increase in average compa-ratio is attributed to classification and range adjustments as well as an increase in the
number of State employees retiring versus the recently hired or promoted employees’ salary.
121
565 510
1,928
415
93 57 75
335
133 112 241
27 16 23 23 0
500
1,000
1,500
2,000
2,500
FY11 Total FY12 Total FY13 Total FY14 Total
Multiple Components of Pay By Fiscal Year
In Pay Band
Temporary Salary Inc.
Temporary RecruitmentDifferential
Temporary RetentionDifferential
Q1 Q2 Q3 Q4
In Pay Band 192 856 1,488
Temporary Salary Inc. 30 53 86
Temporary Recruitment Differential 278 40 36
Temporary Retention Differential 5 4 37
0
200
400
600
800
1,000
1,200
1,400
1,600
FY15 Multiple Components of Pay By Quarter
In Pay Bands (IPBs) were given to select employees at CYFD, TRD, DPS, Corrections, and the State Police in February 2014 based on compa-ratio and agency budgets.
These IPBs brought employees closer to new-hire compa-ratios and closer to market salaries.

P a g e | 8
Annual Key Performance Measures
The number of employees completing their probationary period has increased by 17% since FY13 as a result of
implementing strong minimum qualifications for jobs.
102.0% 101.0% 99.0% 100.0% 101.1%
0.0%
20.0%
40.0%
60.0%
80.0%
100.0%
120.0%
FY11 FY12 FY13 FY14 FY15 YTD
Average Employee Compa Ratio
65.9%
69.9%
68.2%
63.0%
64.0%
65.0%
66.0%
67.0%
68.0%
69.0%
70.0%
71.0%
Q1 Q2 Q3 Q4
New Employees Who Successfully Completed Their Probationary Period
(By Quarter)
61% 58% 58%
68%
0%
10%
20%
30%
40%
50%
60%
70%
80%
FY11 FY12 FY13 FY14
*This Number is based on New Hires in FY13 that completed probationary period durning FY14
New Employees Who Successfully Completed Their Probationary Period
(by Fiscal Year)

P a g e | 9
Overtime
When compared to the same time frame in FY14, all overtime metrics decreased for the 3rd Quarter of FY15.
*Note: The above graphs account for both overtime accrual and payout at straight time/time and a half.
357.1
465.3 457.6 486.7 475.6
390.1 396.6
0.0
100.0
200.0
300.0
400.0
500.0
600.0
Q1 Q2 Q3 Q4
Tho
usa
nd
s
Overtime Used
FY14 FY15
$8.3
$10.7 $10.5 $11.5 $11.6
$9.5 $9.7
$0.0
$2.0
$4.0
$6.0
$8.0
$10.0
$12.0
$14.0
Q1 Q2 Q3 Q4
Mill
ion
s
Overtime Cost
FY14 FY15
16.9 16.3 16.3 16.2 15.9 15.0 15.7
0.0
2.0
4.0
6.0
8.0
10.0
12.0
14.0
16.0
18.0
Q1 Q2 Q3 Q4
Monthly Average number of Overtime Hours Worked / Employee
FY14 FY15
13.2%
18.0% 17.8% 18.3% 18.2%
15.9% 15.3%
0.0%
2.0%
4.0%
6.0%
8.0%
10.0%
12.0%
14.0%
16.0%
18.0%
20.0%
Q1 Q2 Q3 Q4
Average Percentage of Employees Receiving Overtime / Month
FY14 FY15

P a g e | 10
Sick Leave
Sick leave usage increased slightly and costs decreased in the 3rd Quarter of FY15 compared to the 3rd Quarter of FY14.
Annual Leave
The following graphs show annual leave use and associated budgetary impact. During the 3rd Quarter of FY15, annual
leave use was approximately three days taken per employee.
354
344
390
350 355 356
397
310
320
330
340
350
360
370
380
390
400
410
Q1 Q2 Q3 Q4
Tho
usa
nd
s
Sick Leave Hours Used
FY14 FY15
$7.1 $7.0
$7.9
$7.2
$7.4 $7.5
$7.1
5.0
5.5
6.0
6.5
7.0
7.5
8.0
8.5
9.0
Q1 Q2 Q3 Q4
Mill
ion
s
Sick Leave Cost
FY14 FY15
518
579
341
454
505
602
358
0
100
200
300
400
500
600
700
Q1 Q2 Q3 Q4
Tho
usa
nd
s
Annual Leave Hours Used
FY14 FY15
$10.8 $12.5
$7.0
$9.5
$11.0
$13.5
$7.7
$0.0
$2.0
$4.0
$6.0
$8.0
$10.0
$12.0
$14.0
$16.0
Q1 Q2 Q3 Q4
Mill
ion
s
Annual Leave Cost
FY14 FY15

P a g e | 11
Classified Service Recruitment Trends The Career Services Bureau’s primary responsibility is to ensure compliance with the State Personnel Act and the SPB
Rules that require the “certification of the highest standing candidates to prospective employers (§10-9-13-F NMSA
1978).” Since November 2011, when the NEOGOV application system for managing recruitment for all classified
positions was initiated, there has been a 96% increase in both job advertisements and applications received. Every
position advertised through SPO follows the same process once an applicant submits their application. The graphic
below details this process.
Steps Followed Once an Applicant Applies for a Position
P a g e | 12
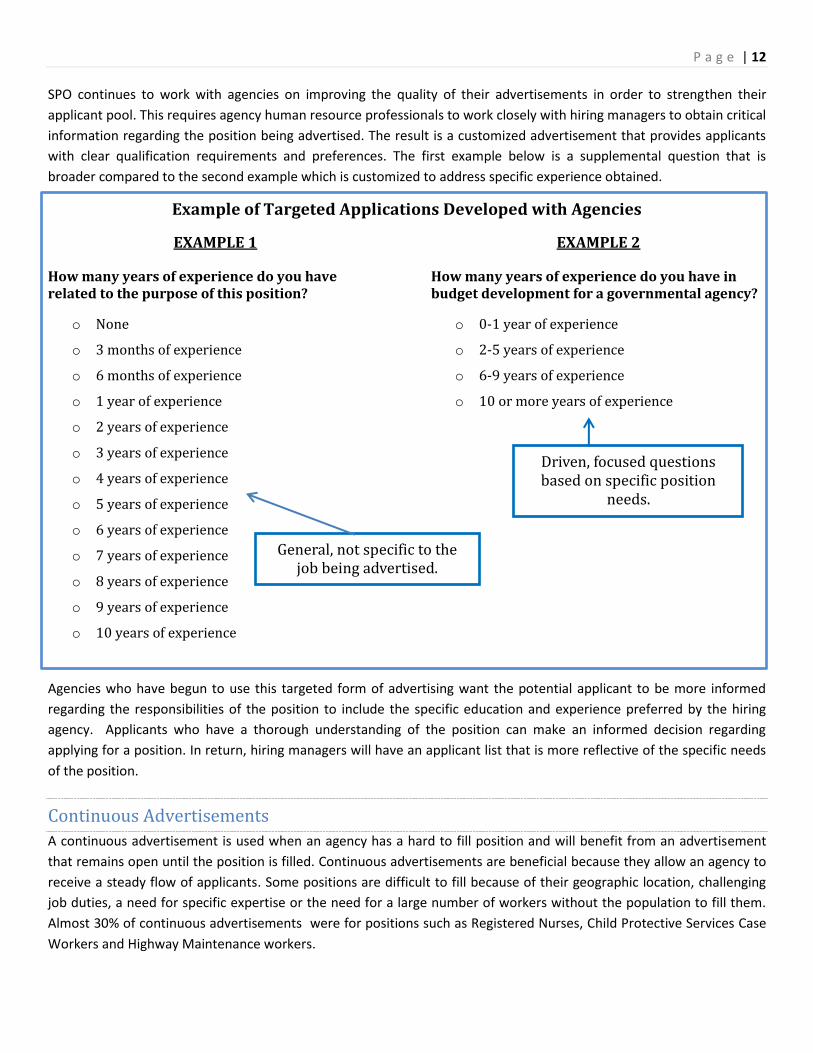
SPO continues to work with agencies on improving the quality of their advertisements in order to strengthen their
applicant pool. This requires agency human resource professionals to work closely with hiring managers to obtain critical
information regarding the position being advertised. The result is a customized advertisement that provides applicants
with clear qualification requirements and preferences. The first example below is a supplemental question that is
broader compared to the second example which is customized to address specific experience obtained.
Example of Targeted Applications Developed with Agencies
EXAMPLE 1
How many years of experience do you have related to the purpose of this position?
o None
o 3 months of experience
o 6 months of experience
o 1 year of experience
o 2 years of experience
o 3 years of experience
o 4 years of experience
o 5 years of experience
o 6 years of experience
o 7 years of experience
o 8 years of experience
o 9 years of experience
o 10 years of experience
EXAMPLE 2
How many years of experience do you have in budget development for a governmental agency?
o 0-1 year of experience
o 2-5 years of experience
o 6-9 years of experience
o 10 or more years of experience
Agencies who have begun to use this targeted form of advertising want the potential applicant to be more informed
regarding the responsibilities of the position to include the specific education and experience preferred by the hiring
agency. Applicants who have a thorough understanding of the position can make an informed decision regarding
applying for a position. In return, hiring managers will have an applicant list that is more reflective of the specific needs
of the position.
Continuous Advertisements
A continuous advertisement is used when an agency has a hard to fill position and will benefit from an advertisement
that remains open until the position is filled. Continuous advertisements are beneficial because they allow an agency to
receive a steady flow of applicants. Some positions are difficult to fill because of their geographic location, challenging
job duties, a need for specific expertise or the need for a large number of workers without the population to fill them.
Almost 30% of continuous advertisements were for positions such as Registered Nurses, Child Protective Services Case
Workers and Highway Maintenance workers.
Driven, focused questions based on specific position
needs.
General, not specific to the job being advertised.

P a g e | 13
Applications
The total views of posted applications has increased every year since 2012, as seen below. Year to date, posted
applications on NeoGov have been viewed 3,272,217 times. There have been 1,009,918 views this quarter.
Total Views on Posted Applications by Fiscal Year FY12 FY13 FY14 FY15 (YTD)
2,286,916 3,645,209 4,079,561 3,272,217
4% 7%
4%
5%
7%
73%
3rd Quarter Continuous Job Postings
Corrections/Public Safety
Social Work/Child Assistance
Highway Maintenance Workers
Business Operations/Finance
Office Support/HR
All Other
FY11 FY12 FY13 FY14
Applications 125,670 200,758 206,740 246,616
Postings 3,439 4,725 5,652 6,437
0
1,000
2,000
3,000
4,000
5,000
6,000
7,000
0
50,000
100,000
150,000
200,000
250,000
300,000
Job Postings & Applications Received - FY11 to FY14
96% increase in job applications and postings between FY11 and FY14.

P a g e | 14
The number of views each department’s job advertisements receives demonstrates an increased exposure of vacancies
and applicant interest in State positions. As can be seen in the pie chart below, six agencies represent 67% of all jobs
posted in this quarter.
58,810 58,164 57,729 54,677
45,598
52,065
0
10,000
20,000
30,000
40,000
50,000
60,000
70,000
FY14 Q2 FY14 Q3 FY14 Q4 FY15 Q1 FY15 Q2 FY15 Q3
Applications Received
Department of Health
18%
Department of Transportation
16%
Children, Youth & Families Dpt
11% Human Services Department
9%
New Mexico Corrections Dept
8%
Enrgy, Minrls & Ntrl Rsrcs Dpt
5%
All other 33%
3rd Quarter Postings by Agency

P a g e | 15
3rd
Quarter Highest Posting Agencies
Department Advertisements Hits Applications Received
Department of Health 295 187,205 7,110 Department of Transportation 260 119,435 4,778 Children, Youth & Families Department 180 141,235 5,637 Human Services Department 156 124,519 6,449 New Mexico Corrections Department 128 67,498 3,342 Energy, Minerals & Natural Resources Department 79 45,038 1,441 Taxation & Revenue Department 78 58,999 2,772 Department of Environment 49 42,999 1,449 Department of Game & Fish 46 33,872 1,573 Aging & Long-Term Services Department 31 23,276 1,218 Department of Vocational Rehabilitation 26 22,129 1,520 Department of Public Safety 25 25,162 1,228 Department of Cultural Affairs 24 29,017 1,550 Department of Workforce Solutions 24 25,784 1,441 General Services Department 23 12,433 666 Regulation & Licensing Department 22 18,380 952 Public Education Department 21 14,947 530 Miners Colfax Medical Center 18 7,211 106 Office of the State Engineer 15 9,829 498 Military Affairs 13 3,913 158 Total for 3rd Quarter Highest Posting Agencies 1,513 1,012,881 44,418
Average Days to Fill a Position by Answer Date by Agency
A number of factors impact the average number of days to fill a position. SPO continues to actively work with departments to decrease the amount of time to review and refer applications; the time has decreased significantly since NEOGOV implementation. The time to interview and process a hire (46.8 days) is the most significant portion of the hiring process.
Notes on graph above:
Date reported as of March 31, 2014.
Excludes Continuous Postings (Advertised 30 days or more)
Data for days advertised, referred and referral to hire are tied to the quarter in which the hire occurred.
Does not include hires that have not been entered in NEOGOV.
15.2 8.8
47.0
71.0
0.0
20.0
40.0
60.0
80.0
Average of Days Advertised Average of Days to Refer Average of Refer to Answer Average of Total Days to Filla Position
Average Days to Fill a Position *Reporting from Advertisement Start Date to Acceptance of Offer
Letter

P a g e | 16
In order to decrease the time taken to interview and process a hire, SPO has made the following recommendations to hiring agencies:
That the hiring manager review, upon receipt, the list of referred applicants within three business days to ensure they have an adequate pool to interview from and do not need additional applicants; and
That the agency interviews within two weeks of receiving the referred list of applicants.
SPO provides the agency Human Resource Manager with ongoing reports to inform them of any outstanding
advertisements that have not been filled and/or appropriately closed out within NEOGOV. Factors exist that may impact
the time to fill, such as background checks; however, by working on the recommendations outlined, there have been
positive changes within the time taken to fill positions.
How to interpret the graphs below:
Average of Days a Job is Advertised: the average amount of time a job (excluding continuous postings) is advertised on NEOGOV.
Average of Days to Refer Top Ranked Applicants to Hiring Manager: the average amount of time taken by Human Resource professionals to review the top ranked applicants and forward them to the Hiring Manager for review.
Average of Days from Applicant Referral to Job Offer Acceptance Date: the average amount of time taken for an agency to interview, process hire paperwork and receive an offer of acceptance from the top candidate.
Average Sum of Days to Fill a Position Across all Agencies: the sum of time between the first day a job is advertised to the selected candidate accepting in the position.
10.4
11.3 11
9.3
8.1 8.2 8.8
0.0
2.0
4.0
6.0
8.0
10.0
12.0
14.0
Q1 Q2 Q3 Q4
Average Days to Process and Refer Applications
2014 2015

P a g e | 17
Average Days to Fill a Position by Answer Date (Graph 1 of 2)
16.1
6.0
10.3
8.0
15.2
15.0
15.0
13.5
15.8
16.3
12.0
15.3
16.3
10.4
14.3
15.0
16.0
8.0
15.0
15.0
22.0
14.3
10.3
1.6
6.2
11.9
7.3
16.1
3.4
5.5
13.5
5.3
6.6
6.8
11.5
5.9
3.1
22.2
69.7
16.6
10.4
17.7
15.5
11.3
40.2
11.4
41.9
103.1
58.4
22.6
16.6
54.0
36.1
51.2
47.2
39.3
39.5
53.9
44.6
51.5
52.3
42.4
77.6
59.8
69.5
44.2
0.0 20.0 40.0 60.0 80.0 100.0 120.0 140.0
Human Services Department - 87
Governor's Comm. on Disability - 1
General Services Department - 25
Gaming Control Board - 2
Enrgy, Minrls & Ntrl Rsrcs Dpt - 20
Educational Retirement Board - 3
Economic Development Department - 1
Dept of Vocational Rehabilitation - 12
Dept of Workforce Solutions - 37
Department of Transportation - 137
Department of Public Safety - 20
Department of Health - 97
Department of Game & Fish - 10
Department of Finance & Admnst - 5
Department of Environment - 32
Department of Cultural Affairs - 20
Crime Victims Reparation Comm - 1
Commission of Public Records - 1
Commission for the Blind - 1
Children, Youth & Families Dpt - 70
Border Development Authority - 1
Aging & Long-Term Services Dpt - 16
Avg. Days Advertised Avg. Days to Refer Avg. Refer to AnswerAgency and Number of Advertisements Filled
Average Number of Days
Advertised: 15.2
Average of Days to Refer Top Ranked Applicants to HR:
8.8
Average of Days from
Applicant Referral to Job
Offer Acceptance Date:
47.0
Average Sum of Days to Fill a Position Across All
Agencies: 71.0
P a g e | 18
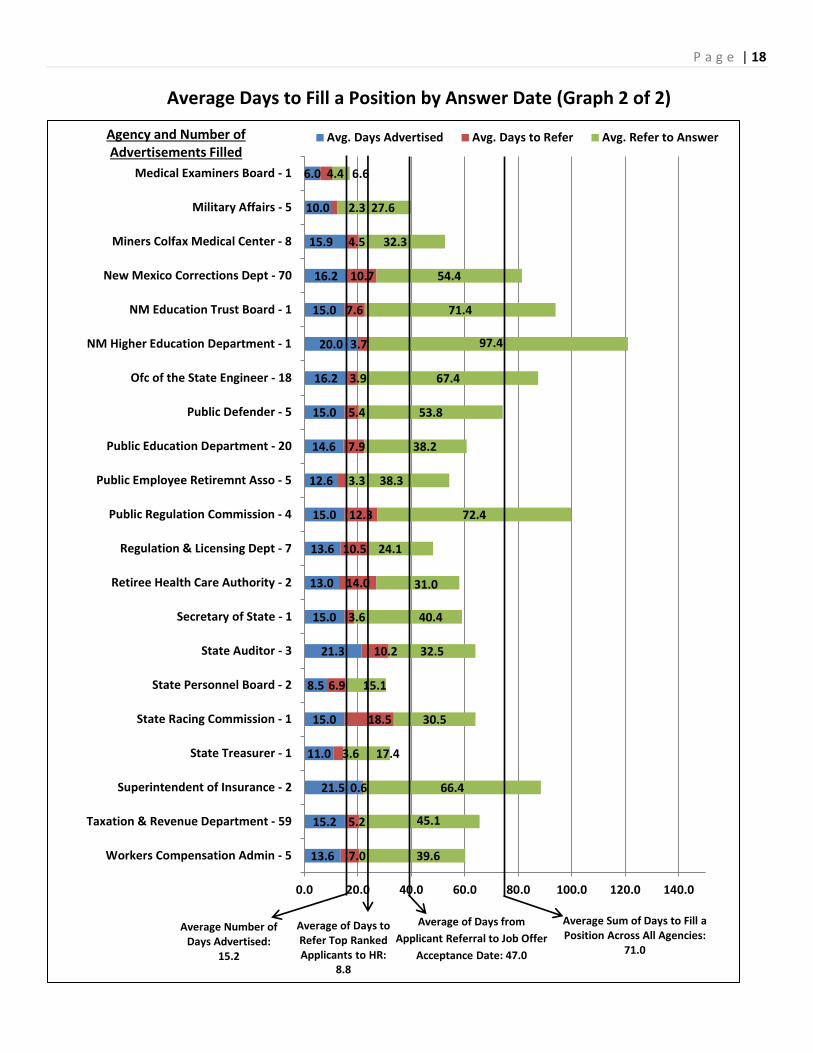
Average Days to Fill a Position by Answer Date (Graph 2 of 2)
13.6
15.2
21.5
11.0
15.0
8.5
21.3
15.0
13.0
13.6
15.0
12.6
14.6
15.0
16.2
20.0
15.0
16.2
15.9
10.0
6.0
7.0
5.2
0.6
3.6
18.5
6.9
10.2
3.6
14.0
10.5
12.3
3.3
7.9
5.4
3.9
3.7
7.6
10.7
4.5
2.3
4.4
39.6
45.1
66.4
17.4
30.5
15.1
32.5
40.4
31.0
24.1
72.4
38.3
38.2
53.8
67.4
97.4
71.4
54.4
32.3
27.6
6.6
0.0 20.0 40.0 60.0 80.0 100.0 120.0 140.0
Workers Compensation Admin - 5
Taxation & Revenue Department - 59
Superintendent of Insurance - 2
State Treasurer - 1
State Racing Commission - 1
State Personnel Board - 2
State Auditor - 3
Secretary of State - 1
Retiree Health Care Authority - 2
Regulation & Licensing Dept - 7
Public Regulation Commission - 4
Public Employee Retiremnt Asso - 5
Public Education Department - 20
Public Defender - 5
Ofc of the State Engineer - 18
NM Higher Education Department - 1
NM Education Trust Board - 1
New Mexico Corrections Dept - 70
Miners Colfax Medical Center - 8
Military Affairs - 5
Medical Examiners Board - 1
Avg. Days Advertised Avg. Days to Refer Avg. Refer to AnswerAgency and Number of Advertisements Filled
Average Sum of Days to Fill a Position Across All Agencies:
71.0
Average of Days from
Applicant Referral to Job Offer
Acceptance Date: 47.0
Average of Days to Refer Top Ranked Applicants to HR:
8.8
Average Number of Days Advertised:
15.2

P a g e | 19
Classified Service Hires and Separations In FY14, 3,227 positions in the State’s Classified Service were filled. This is directly attributed to continued efforts to fill and properly classify vacant, budgeted positions and has created a positive impact on the delivery of services and improved employee morale throughout State government.
The State’s hiring activity has dramatically increased since FY11 (by 156%), this effort only offsets the increased separations of State employees.
New Hires by Fiscal Year (FY11-FY14)
FY15 New Hires & Separations by Quarter
2,163 2,332
2,962 2,858
1,205
2,193
3,090 3,227
0
500
1,000
1,500
2,000
2,500
3,000
3,500
FY11 FY12 FY13 FY14
Classified Hires and Separations by Fiscal Year
Separations
Hires
779 744
922 782 746
631
751
0
200
400
600
800
1,000
Q1 Q2 Q3 Q4
New Hires By Quarter Fiscal Year Comparison
FY14 FY15
NOTE: Hires represent only new hires and do not include transfers or promotions of state employees
760
671 640
787 762
613 567
0
100
200
300
400
500
600
700
800
900
Q1 Q2 Q3 Q4
Separations By Quarter
FY14 FY15
In FY14, 3,227 positions within the classified service were filled,
positively impacting the quality of State services and morale.

P a g e | 20
The graph above shows the separation rate of classified employees as a percentage of the total Classified Service population. Of the 567 separations this quarter, 2.7% were voluntary and 0.5% involuntary.
Separation numbers represent classified employees who have separated or retired from State government or switched to a different salary plan.
New Hire Compa-Ratio
The Compa-Ratio of newly hired employees, in many situations, is above the minimum of the pay band. Without adjusting entry level pay rates within the existing salary plan, it is difficult for the State to compete in the labor market;
Q1 Q2 Q3 Q4
Voluntary 554 334 399
Retirement 97 174 81
Involuntary 111 105 87
RIF 0 0 0
0
100
200
300
400
500
600
Classified Separation Reason
3.6%
1.9%
2.7%
0.6% 0.6% 0.5%
0.0%
2.0%
4.0%
6.0%
8.0%
10.0%
Q1 Q2 Q3 Q4
Percent of the Total Classified Employee Population Leaving State Service Voluntarily and Involuntarily
Voluntary Involuntary

P a g e | 21
therefore, State agencies hire at rates in excess of the minimum of the pay band to attract qualified applicants. Agencies are applying the concepts and principles of “appropriate placement” to properly set employee pay relative to other employees in the same classification within the work unit. As a result, tenured employees are not progressing through the pay range. Non-adjustment of the salary plan is a factor in employee turnover and makes attracting well-qualified applicants difficult. SPO, with the Legislature, has budgeted current appropriations for vacant positions at mid-point levels rather than entry level as has been previous practice.
FY15 3rd Quarter New Hire Compa-Ratio by Pay Band
Pay Band Average Compa-Ratio # of Employees
25 91.3% 28 30 90.6% 36 35 85.5% 38 40 98.7% 60 45 98.9% 74 50 94.1% 106 55 93.5% 102 60 94.0% 67 65 100.1% 69 70 103.0% 58 75 107.5% 64 80 108.6% 17 85 105.7% 22 90 103.9% 7 95 127.0% 1 96 99.9% 1 99 122.9% 1
Grand Total 97.4% 751
95.0% 96.0% 96.0% 97.0% 94.0% 98.5% 97.4%
0.0%
20.0%
40.0%
60.0%
80.0%
100.0%
120.0%
Q1 Q2 Q3 Q4
New Hire Compa-Ratio
FY14 FY15 YTD
93.5%
94.4%
96.1% 96.2%
92.0%
92.5%
93.0%
93.5%
94.0%
94.5%
95.0%
95.5%
96.0%
96.5%
FY12 FY13 FY14 FY15 YTD
Average New Hire Compa-Ratio By Fiscal Year

P a g e | 22
New Hire Demographics
Ethnicity Female Male Grand Total % Per Ethnic Group
African American 10 12 22 3% American Indian 11 13 24 3% Asian 7 3 10 1% Caucasian 129 115 244 32% Hawaiian 0 1 1 0% Hispanic 198 175 373 50% Not Specified 49 28 77 10%
Grand Total 404 347 751 100%
% Per Gender Group 54% 46%
FY15 Classified Separations by Reason
Reason Q1 Q2 Q3 Q4
Accepted New Job (Competitor) 25 13 10 Accepted New Job (Non-Competitor) 19 7 13 Attendance 20 16 15 Completion of Contract 3 0 0 Death 7 12 6 Disability Retirement 5 6 6 Discharge 7 6 7 Dissatisfied w/Work Conditions 3 3 1 Dissatisfied w/Promotion Opportunities 0 0 0 Dissatisfied with Hours 1 0 0 Dissatisfied with Type of Work 0 0 0 Dissatisfied with Pay 1 0 0 Dissatisfied with Supervision 1 2 0 Early Retirement 0 2 1 End of Appointment 2 1 2 End Temporary Employment 1 2 0 Failed Condition of Employment 8 7 3 Falsified Qualifications 1 0 1 Family Reasons 5 2 4 Health Reasons 5 10 2 Illness in Family 3 0 0 Insubordination 5 3 1 Lack of Funding 0 0 0 Leave of Absence Expiration 0 0 0 Military 0 0 1 Misconduct 42 33 30 Mutual Consent 1 1 0 Non Job Connected Medical 4 2 2 Normal Retirement 91 158 69 Other Medical 2 5 5 Personal Reasons 60 44 54

P a g e | 23
Reason Q1 Q2 Q3 Q4
Position Discontinued 0 0 0
Probation Period not completed 0 0 0
Pregnancy 0 1 0 Quit without Notice 16 11 24 Relocation 14 6 9 Resignation 368 211 259 Resignation-Other Position 6 8 6 Return to School 8 1 4 RIF - SPO Board Approved 0 0 0 Unforeseen Circumstances 6 4 3 Unsatisfactory Performance 14 22 18 Vested Retirement 1 8 5 Violation of Rules 7 6 6 Grand Total 762 613 567
FY15 3rd Quarter Classified Separations by Agency
Agency Name Total
Aging & Long-Term Services Department 8 Children, Youth & Families Department 58
Commission for the Blind 3
Commission of Public Records 1 Crime Victims Reparation Commission 2
Department of Cultural Affairs 3
Department of Environment 14
Department of Finance & Administration 2
Department of Game & Fish 9
Department of Health 158
Department of Public Safety 13
Department of Transportation 44
Department of Workforce Solutions 11
Department of Information Technology 4
Department of Vocational Rehabilitation 10
Economic Development Department 3 Educational Retirement Board 1
Energy, Minerals & Natural Resources Department 3
Gaming Control Board 2
General Services Department 10
Higher Education Department 2
Homeland Security & Emergency Management 1 Human Services Department 49
Livestock Board 1
Military Affairs 2
Miners Colfax Medical Center 12
New Mexico Corrections Department 61
Ofc of the State Engineer 4 Public Defender 16
P a g e | 24
Agency Name Total
Public Education Department 8
Public Regulation Commission 4
Regulation & Licensing Department 9 Retiree Health Care Authority 1
Secretary of State 3
State Land Office 6
State Personnel Board 2
State Treasurer 1
Superintendent of Insurance 1 Taxation & Revenue Department 19
Tourism Department 1
Workers Compensation Admin 5
Grand Total 567
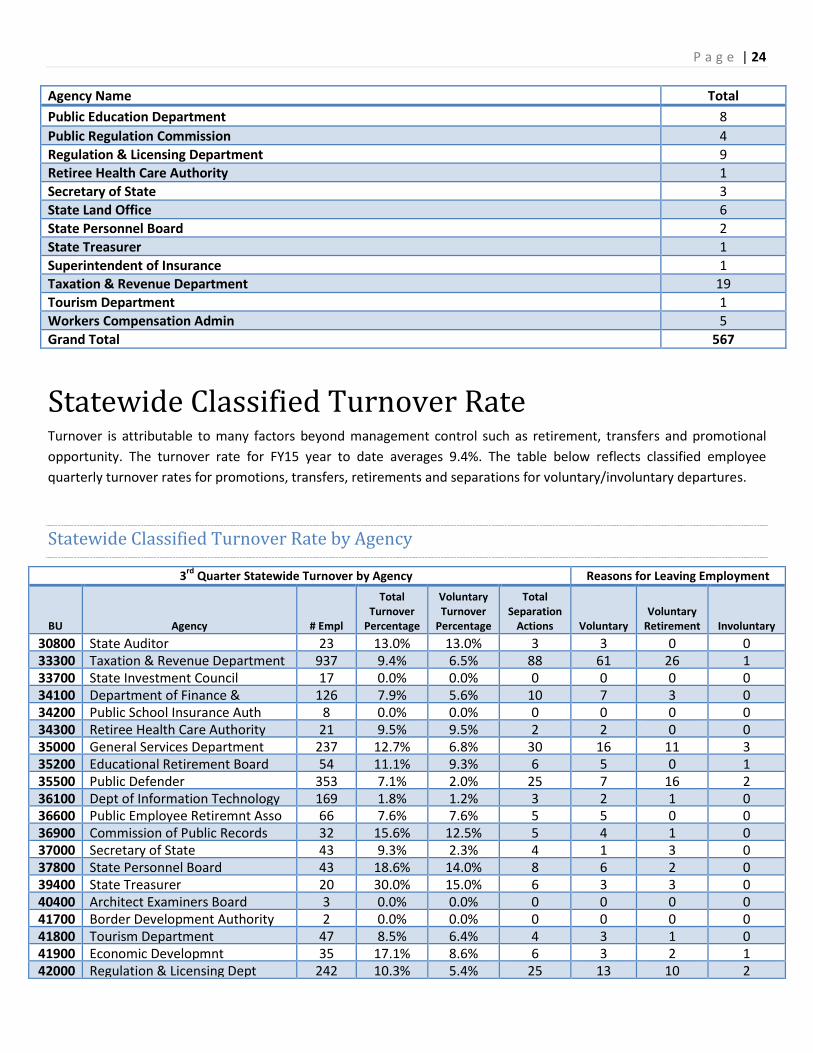
Statewide Classified Turnover Rate Turnover is attributable to many factors beyond management control such as retirement, transfers and promotional
opportunity. The turnover rate for FY15 year to date averages 9.4%. The table below reflects classified employee
quarterly turnover rates for promotions, transfers, retirements and separations for voluntary/involuntary departures.
Statewide Classified Turnover Rate by Agency
3rd
Quarter Statewide Turnover by Agency Reasons for Leaving Employment
BU Agency # Empl
Total Turnover
Percentage
Voluntary Turnover
Percentage
Total Separation
Actions Voluntary Voluntary
Retirement Involuntary
30800 State Auditor 23 13.0% 13.0% 3 3 0 0 33300 Taxation & Revenue Department 937 9.4% 6.5% 88 61 26 1 33700 State Investment Council 17 0.0% 0.0% 0 0 0 0 34100 Department of Finance &
Admnst 126 7.9% 5.6% 10 7 3 0
34200 Public School Insurance Auth 8 0.0% 0.0% 0 0 0 0 34300 Retiree Health Care Authority 21 9.5% 9.5% 2 2 0 0 35000 General Services Department 237 12.7% 6.8% 30 16 11 3 35200 Educational Retirement Board 54 11.1% 9.3% 6 5 0 1 35500 Public Defender 353 7.1% 2.0% 25 7 16 2 36100 Dept of Information Technology 169 1.8% 1.2% 3 2 1 0 36600 Public Employee Retiremnt Asso 66 7.6% 7.6% 5 5 0 0 36900 Commission of Public Records 32 15.6% 12.5% 5 4 1 0 37000 Secretary of State 43 9.3% 2.3% 4 1 3 0 37800 State Personnel Board 43 18.6% 14.0% 8 6 2 0 39400 State Treasurer 20 30.0% 15.0% 6 3 3 0 40400 Architect Examiners Board 3 0.0% 0.0% 0 0 0 0 41700 Border Development Authority 2 0.0% 0.0% 0 0 0 0 41800 Tourism Department 47 8.5% 6.4% 4 3 1 0 41900 Economic Developmnt
Department 35 17.1% 8.6% 6 3 2 1
42000 Regulation & Licensing Dept 242 10.3% 5.4% 25 13 10 2

P a g e | 25
BU Agency # Empl
Total Turnover
Percentage
Voluntary Turnover
Percentage
Total Separation
Actions Voluntary Voluntary
Retirement Involuntary
43000 Public Regulation Commission 123 9.8% 4.9% 12 6 6 0 44000 Superintendent of Insurance 70 2.9% 0.0% 2 0 2 0 44600 Medical Examiners Board 11 9.1% 9.1% 1 1 0 0 44900 Board of Nursing 17 0.0% 0.0% 0 0 0 0 46000 EXPO New Mexico 20 0.0% 0.0% 0 0 0 0 46400 Prof Engneers & Lnd Srvyrs Brd 5 0.0% 0.0% 0 0 0 0 46500 Gaming Control Board 43 9.3% 4.7% 4 2 0 2 46900 State Racing Commission 11 9.1% 9.1% 1 1 0 0 47900 Veterinary Examiners Board 2 0.0% 0.0% 0 0 0 0 49500 SpacePort Authority 8 0.0% 0.0% 0 0 0 0 50500 Department of Cultural Affairs 463 5.4% 3.7% 25 17 7 1 50800 Livestock Board 57 1.8% 1.8% 1 1 0 0 51600 Department of Game & Fish 251 6.8% 2.8% 17 7 10 0 52100 Enrgy, Minrls & Ntrl Rsrcs Dpt 393 9.7% 8.1% 38 32 6 0
52200 Youth Conservation Corps 2 0.0% 0.0% 0 0 0 0 53900 State Land Office 139 7.2% 4.3% 10 6 2 2 55000 Ofc of the State Engineer 288 7.3% 5.2% 21 15 5 1 60300 Office of African Amer Affairs 4 0.0% 0.0% 0 0 0 0 60400 Com for Deaf/Hard of Hearing 12 0.0% 0.0% 0 0 0 0 60600 Commission for the Blind 56 7.1% 1.8% 4 1 3 0 60900 Department of Indian Affairs 10 20.0% 20.0% 2 2 0 0 62400 Aging & Long-Term Services Dpt 200 13.5% 8.5% 27 17 8 2 63000 Human Services Department 1751 11.6% 8.3% 203 145 51 7 63100 Dept of Workforce Solutions 447 6.3% 3.8% 28 17 10 1 63200 Workers Compensation Admin 100 11.0% 6.0% 11 6 4 1 64400 Dept of Vocational Rehbltation 243 9.1% 5.3% 22 13 7 2 64500 Governor's Comm. on Disability 13 23.1% 23.1% 3 3 0 0 64700 Dev Disabilites Planning Comm 12 8.3% 8.3% 1 1 0 0 66200 Miners Colfax Medical Center 211 23.7% 21.3% 50 45 3 2 66500 Department of Health 3304 10.1% 6.8% 335 226 81 28 66700 Department of Environment 561 7.5% 3.6% 42 20 22 0 66800 Office of Natural Resc Trustee 3 0.0% 0.0% 0 0 0 0 67000 Department of Veteran Services 38 2.6% 2.6% 1 1 0 0 69000 Children, Youth & Families Dpt 1893 8.5% 5.1% 160 97 53 10 70500 Military Affairs 120 6.7% 4.2% 8 5 2 1 76000 Adult Parole Board 5 0.0% 0.0% 0 0 0 0 77000 NM Corrections Dept 1859 19.7% 16.5% 366 307 52 7 78000 Crime Victims Reparation Comm 16 18.8% 12.5% 3 2 1 0 79000 Department of Public Safety 547 6.0% 2.9% 33 16 15 2 79500 Homeland Security & Emgncy
Mgt 40 10.0% 10.0% 4 4 0 0
80500 Department of Transportation 2188 8.7% 6.7% 190 147 38 5 92400 Public Education Department 222 11.7% 8.1% 26 18 6 2 94900 NM Education Trust Board 2 0.0% 0.0% 0 0 0 0 95000 Higher Education Department 35 22.9% 17.1% 8 6 2 0 Totals 18,273 10.3% 7.3% 1,889 1,328 475 86
Percent Turnover by Reason 70.3% 25.1% 4.6%

P a g e | 26
Vacancy Rates
SPO acknowledges the importance of tracking vacancy data; however, it is difficult to ascertain what positions are
budgeted vs. authorized from the data available to the State Personnel Office. Determining the vacancy rate in each
agency is determined from Department of Finance and Administration (DFA) FY15 Operations Budget numbers for each
agency, since the FY15 General Appropriation Act does not contain information on authorized/funded FTE (equivalent
employees working full-time). The Career Services Bureau and agencies are working diligently to reduce vacancy rates by
managing the time it takes to advertise a position to the time it takes to fill the position.
Quarterly Vacancy Rates for the 20 Key Agencies
Business Unit
Agency 1st Qtr. 2nd Qtr. 3rd Qtr. 4th Qtr.
33300 Taxation & Revenue Department 14.0% 15.7% 15.2%
35000 General Services Department 22.5% 21.2% 20.5%
35500 Public Defender 9.1% 7.1% 10.3%
36100 Department of Information Technology 14.2% 16.6% 17.5%
42000 Regulation & Licensing Department 22.3% 22.3% 23.8%
50500 Department of Cultural Affairs 11.6% 12.0% 7.7%
51600 Department of Game & Fish 18.2% 20.4% 18.8%
52100 Energy Minerals & Natural Resources 22.3% 23.4% 22.2%
55000 Office of the State Engineer 14.7% 15.2% 13.8%
62400 Aging & Long-Term Services Dpt 9.6% 9.6% 14.3%
63000 Human Services Department 9.2% 10.5% 12.7%
63100 Department of Workforce Solutions 23.8% 22.7% 20.6%
64400 Department of Vocational Rehabilitation 17.5% 18.2% 18.2%
66500 Department of Health 14.5% 13.5% 12.4%
66700 Department of Environment 16.4% 15.4% 15.0%
69000 Children Youth & Families Department 15.3% 15.0% 12.6%
77000 New Mexico Corrections Department 22.0% 23.0% 23.6%
79000 Department of Public Safety 17.0% 16.8% 16.4%
80500 Department of Transportation 13.7% 12.4% 11.7%
92400 Public Education Department 8.8% 6.4% 3.4%
State Wide Vacancy Rate 13.9% 13.7% 11.7%
Training The Training and Development Division (TDD) mission, ‘to develop great leaders for State government in support of the
agencies we serve,’ continues to direct the provision of Statewide guidance and oversight for centralized leadership
development and organizational learning. The SPO TDD commitment is to develop leaders dedicated to public service
through learning that measurably transforms individuals and organizations.
Instructor – Led Core Curriculum Classes
The TDD delivers practitioner-oriented professional development in both mandatory and statutory instructor-led and
eLearning course blocks:
Managing Employee Performance (MEP): the MEP is mandated by the State Personnel Board Rules Subsection A of
1.7.9.9 NMAC. Topics of discussion include employee evaluations, communication and documentation in support of

P a g e | 27
teams and projects. This course promotes accountability and collaboration through all levels of management and
supervision. In the 3rd Quarter of FY15, the MEP Training was conducted for 237 managers and supervisors from
various agencies.
Cultural Competency: pursuant to the State-Tribal Collaboration Act (STCA), in collaboration with the Indian Affairs
Department (IAD), SPO developed a cultural competency statutory training program to be offered to all State
employees who have ongoing communication with Native American nations, tribes or pueblos. SPO’s efforts to
communicate, collaborate and consult with tribes as described in the Tribal Collaboration and Communication Policy
is to ensure that the training developed in collaboration with IAD remains aligned with the needs of tribal and State
governments. State agency employees are notified of the provisions of the STCA through the TDD and the IAD
websites. SPO maintains certification of the number of State employees from each State agency that have
completed the Cultural Competency training. The current Cultural Competency training curriculum includes:
o An introduction to the unique legal and political status of New Mexico Indian Nations, Pueblos, and
Tribes with a review of Federal Indian policies and laws;
o An examination of tribal governments and authorities;
o Collaboration/consultation principles and guidance;
o Communication skills; and
o Cultural competencies and best practices.
In the 3rd Quarter of FY15, 334 employees participated in the Cultural Competency training.
Fundamentals of Supervision: this course includes sections on supervision and leadership core values and practices,
strategies for coordinating powerful work with teams and stakeholders, and key considerations regarding
motivation and dealing with resistance effectively. Real scenarios are discussed and solutions are developed utilizing
the Facts, Objectives, Solutions, Actions (FOSA) method. A total of 230 State employees participated in the training
in the 3rd Quarter of FY15.
Developing an Americans with Disabilities Act (ADA) Successful Reasonable Accommodation Process: this course
includes relevant information that employers need in order to provide accommodations for applicants and
employees with disabilities. For many employers, understanding when and how they must comply can be, at times,
complex. Developing effective policies, procedures and practices can assure full compliance as well as help
management successfully respond to reasonable accommodation requests and needs. This 3-hour training, given by
102
35
105 100
517
58
106
58
291
187 131
289 274
195 237
0
100
200
300
400
500
600
Q1 Q2 Q3 Q4
Nu
mb
er
of
Emp
loye
es
Trai
ne
d
Managing Employee Performance
FY12 FY13 FY14 FY15
0
231
130
73 78 76 79 96
195 225
334
0
50
100
150
200
250
300
350
400
Q1 Q2 Q3 Q4
Nu
mb
er
of
Emp
loye
es
Trai
ne
d
Cultural Competency
FY13 FY14 FY15

P a g e | 28
the Southwest ADA Center, provides an overview of the ADA Amendments Act, extensive reasonable
accommodation and best practice approaches, useful ADA technical assistance resources and answers to key
questions. A total of 9 State employees participated in the training in the 3rd Quarter of FY15.
ELearning Mandatory Classes
Ethics for New Mexico State Government Employees: Ethics training helps State employees understand and be
held accountable for the Code of Ethical Conduct, thereby increasing the efficiency and efficacy of New Mexico State
government. The online Ethics Training for State employees is a collaborative project with the New Mexico State
University College of Business and the Daniels Foundation. Ethics training is still in the design and development
stages.
Civil Rights: the Civil Rights course strives to make public servants aware of the ethical standards and the social
responsibility necessary to act humanely and responsively in an intergovernmental system. The Civil Rights Training
has been made available to all new employees in concert with agency hires; agencies are responsible for delivering
this training to new employees within 90 days of hire. A total of 327 State employees participated in the training in
the 3rd Quarter of FY15.
All eLearning courses are available through an institutional learning management system (LMS) from Blackboard. SPO
Blackboard allows State employees to access course materials and conduct course activities anywhere and anytime they
can access World-Wide Web.
Additional Training
SHARE Human Capital Management (HCM) Training: The TDD partners with the Department of Information
Technology to manage training offered to State employees who are either new or current users of the SHARE
system. A Subject Matter Experts (SME) conducts the SHARE HCM training. A total of six State employees
participated in the training in the 3rd Quarter of FY15.
Discipline and Adjudication Training: The TDD is working closely with Subject Matter Experts (SMEs) to redesign the
Discipline and Adjudication Training. Faculty are instructors with expertise in discipline and adjudication as detailed
by administrative code, NMSA 1978, the New Mexico Governmental Dispute Prevention Resolution Statute and
33
15
32 25 26
0
107 108
45
5 6
0
20
40
60
80
100
120
Q1 Q2 Q3 Q4
SHARE HCM Training
FY13 FY14 FY15

P a g e | 29
Alternative Dispute Resolution methods. The SMEs will also be familiar with all forms and pleadings included in the
processes.
Workplace Violence Active Shooter Awareness Training: SPO, in collaboration with the Department of Public
Safety, Department of Homeland Security and Emergency Management and General Services Department
successfully deployed the Workplace Violence Active Shooter Awareness Training. In the 3rd Quarter of FY15, 110
employees participated in the training.
The intent of this course is to provide guidance to recognize the signs of potential workplace violence and to prepare
State employees who may be caught in an active shooter situation. In addition, GSD, SPO and the Department of
Tourism are developing an eLearning course that will be embedded in the New Employee Orientation.
New Employee Orientation: TDD has deployed an online New Employee Orientation. This course acquaints new
employees with State history, economy and fun facts. The training also covers the structure of State government,
the functions of State agencies, overview of labor unions in New Mexico State government and benefits available
through employment with the State.
Adjudication In compliance with the State Personnel Act, SPO’s Adjudication Division is responsible for conducting administrative
hearings on appeals filed by classified State employees who have completed their probationary period and against
whom formal disciplinary action (suspension, demotion, or dismissal) has been taken. Following pre-hearing discovery
and exchange of information, one of the Division’s two Administrative Law Judges (ALJs) conducts an evidentiary
hearing, at that the State agency imposing the discipline and the appealing employee present evidence and arguments
related to whether there was just cause for the disciplinary action. Following the hearing, the ALJ prepares a written
Recommended Decision for submission to the SPB. A Final Decision is then made by the SPB.
Although the District Attorney’s Association and the Department of Public Safety have their own personnel boards,
employees of those agencies (excluding State Police Officers) often select the SPB to decide appeals of their disciplinary
action. Additionally, if a classified State employee is “separated” from their job as a result of injury or illness (on or off
the job), the employee has the right to file an appeal with the SPB and have a hearing on the issue of whether the
employee was properly separated from employment. The SPB is also charged with making findings on complaints filed
against Workers’ Compensation Judges and forwarding its finding to the Director of the Workers’ Compensation
Administration. The Adjudication Division conducts evidentiary hearings for the
SPB for these purposes as well.
State classified employees covered by a collective bargaining agreement (CBA)
have the option of choosing an outside arbitrator to decide their disciplinary action
appeals. Employee requests for arbitration are provided to SPO’s Labor Relations
Division that provides notice to the employer and union of the request.
The majority of the Adjudication Division’s hearings are conducted at SPO in Santa Fe. To conduct hearings outside Santa
Fe, the ALJs continue to rely primarily on videoconferencing. The agency taking disciplinary action is typically directed to
arrange the videoconferencing between its Santa Fe office and the field office responsible for the disciplinary
action. The ALJ then conducts the hearing from Santa Fe, while the attorneys (and/or representatives) and witnesses
typically appear at the remote location. The Adjudication Division will consider requests for alternative hearing
arrangements on a case-by-case basis.
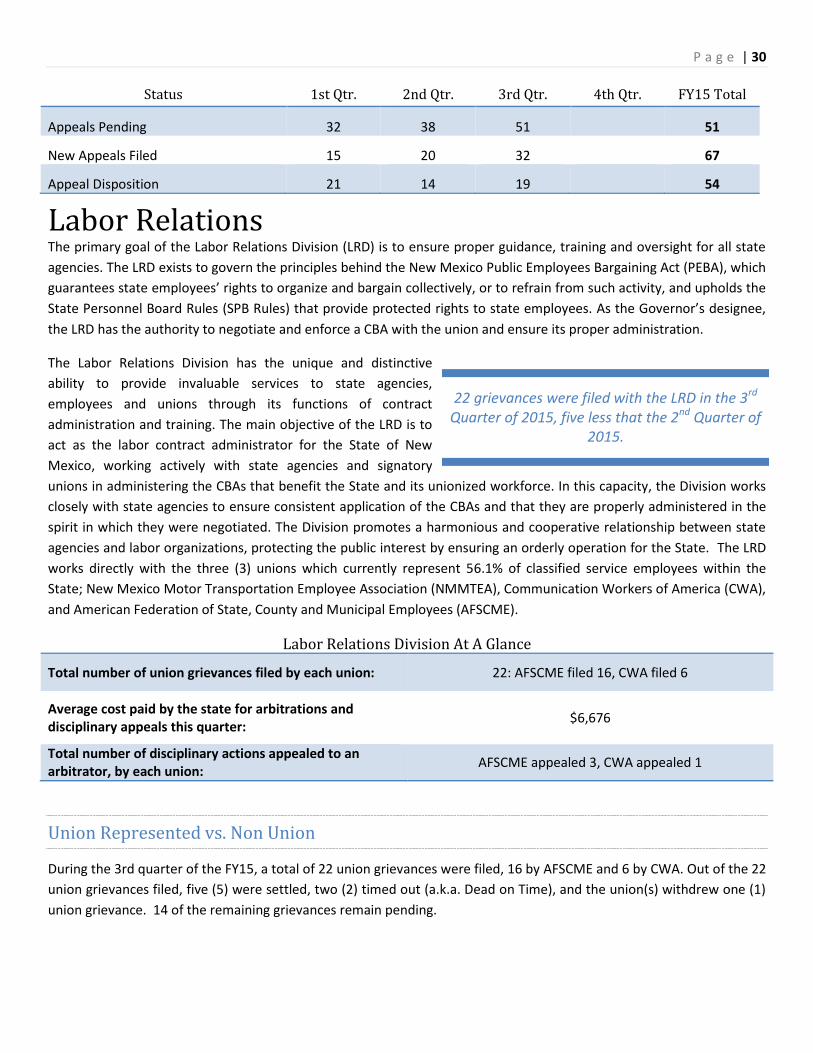
Adjudication reached final
disposition on 19 appeals in the
3rd Quarter of FY15.
P a g e | 30
Status 1st Qtr. 2nd Qtr. 3rd Qtr. 4th Qtr. FY15 Total
Appeals Pending 32 38 51 51
New Appeals Filed 15 20 32 67
Appeal Disposition 21 14 19 54
Labor Relations The primary goal of the Labor Relations Division (LRD) is to ensure proper guidance, training and oversight for all state
agencies. The LRD exists to govern the principles behind the New Mexico Public Employees Bargaining Act (PEBA), which
guarantees state employees’ rights to organize and bargain collectively, or to refrain from such activity, and upholds the
State Personnel Board Rules (SPB Rules) that provide protected rights to state employees. As the Governor’s designee,
the LRD has the authority to negotiate and enforce a CBA with the union and ensure its proper administration.
The Labor Relations Division has the unique and distinctive
ability to provide invaluable services to state agencies,
employees and unions through its functions of contract
administration and training. The main objective of the LRD is to
act as the labor contract administrator for the State of New
Mexico, working actively with state agencies and signatory
unions in administering the CBAs that benefit the State and its unionized workforce. In this capacity, the Division works
closely with state agencies to ensure consistent application of the CBAs and that they are properly administered in the
spirit in which they were negotiated. The Division promotes a harmonious and cooperative relationship between state
agencies and labor organizations, protecting the public interest by ensuring an orderly operation for the State. The LRD
works directly with the three (3) unions which currently represent 56.1% of classified service employees within the
State; New Mexico Motor Transportation Employee Association (NMMTEA), Communication Workers of America (CWA),
and American Federation of State, County and Municipal Employees (AFSCME).
Labor Relations Division At A Glance
Total number of union grievances filed by each union: 22: AFSCME filed 16, CWA filed 6
Average cost paid by the state for arbitrations and disciplinary appeals this quarter:
$6,676
Total number of disciplinary actions appealed to an arbitrator, by each union:
AFSCME appealed 3, CWA appealed 1
Union Represented vs. Non Union
During the 3rd quarter of the FY15, a total of 22 union grievances were filed, 16 by AFSCME and 6 by CWA. Out of the 22
union grievances filed, five (5) were settled, two (2) timed out (a.k.a. Dead on Time), and the union(s) withdrew one (1)
union grievance. 14 of the remaining grievances remain pending.
22 grievances were filed with the LRD in the 3rd Quarter of 2015, five less that the 2nd Quarter of
2015.

P a g e | 31
Two (2) grievances were not satisfactorily resolved at the agency level, the AFSCME invoked arbitration in both
instances. One agency served the union with a Dead on Time (DoT) letter, therefore, only one (1) grievance is scheduled
to be arbitrated.
There were four (4) disciplinary appeals before an arbitrator invoked by a bargaining unit employee and/or their union
representative during the 3rd quarter. Three (3) were invoked by AFSCME, and one (1) by CWA. In comparison, six (6)
bargaining unit employees chose to appeal their discipline to the State Personnel Board (SPB). All six (6) appellants
belong to AFSCME.
The LRD’s philosophy is that real success and teamwork is impossible without building collaborative relationships. In an
effort to build a relationship and an environment which creates a teamwork culture with other state agencies, the LRD
has implemented a process in which the LRD staff visit all newly hired Human Resources (HR) Managers/Directors and
their staff. One important objective of the visit is to inform the new hired HR Manager/Director of the specific ways the
LRD can help them. The Division approaches the visit from a perspective of, “it’s about what’s in it for them and not
what’s in it for us (LRD)”. In short, we strongly believe a great relationship is mutually beneficial.
This quarter the LRD met with two (2) newly hired HR Managers/Directors and their staff. LRD shared information,
offered guidance and direction, all of which are very important when building a long lasting and trusting relationship.
7,599
2,457
197
0
1,000
2,000
3,000
4,000
5,000
6,000
7,000
8,000
AFSCME CWA NMMTEA
Union Represented Employees
AFSCME 41.6%
CWA 13.4%
NMMTEA 1.1%
Non Union 43.9%
Classified Service Union vs. Non-Union
Q1 Q2 Q3 Q4
FY12 56 37 36 57
FY13 38 32 29 31
FY14 29 31 29 24
FY15 31 27 22
0
10
20
30
40
50
60Number of Grievances Filed

P a g e | 32
Soon after each of the visits the LRD received numerous calls and emails requesting advice and support about labor
related matters. Also, a large number of the agency HR staff signed up for our training classes.
The LRD believes that training for supervisors, managers, attorneys and HR Professionals is essential for organizational
development and success. Training is aimed at helping supervisors, managers, attorneys and HR Professionals acquire
the basic skills to efficiently and effectively perform their job as it relates to union matters including conducting
Workplace Investigations.
The LRD continues to support supervisors, managers, attorneys and HR Professionals by conducting labor related
training. This quarter the LRD trained two (2) Living in a Union Environment (LIUE) classes. A total of 58 managers,
supervisors, attorneys and HR Professionals attended this training during the 3rd quarter.
LRD also conducted one (1) Workplace Investigations Training. During this training session 15 supervisors, managers,
attorneys and HR Professionals were provided with the tools to conduct workplace investigations utilizing methods
applied by experienced workplace investigators. The information provided in this course promotes conducting quality,
prompt and fair investigations.
67
125 119
158 141
55
119
154
180
102
58
0
50
100
150
200
Q1 Q2 Q3 Q4
Number of Employees Attending LIUE Traning
FY13 FY14 FY15
6
14
6
8 7
9 8
2
7 8
4
0
5
10
15
Q1 Q2 Q3 Q4
Number of disciplinary actions (union covered) positions appealing to arbitration rather than
to SPB
FY13 FY14 FY15
$0.0
$3.0
$7.4
$0.0
$4.4 $4.7 $3.1
$16.7
$0.0
$8.0 $6.6
$0.0
$5.0
$10.0
$15.0
$20.0
Q1 Q2 Q3 Q4
Tho
usa
nd
s
Actual Cost Paid by the State for Arbitration
FY13 FY14 FY15
$4.7
$7.2
$4.9
$0.0
$1.0
$2.0
$3.0
$4.0
$5.0
$6.0
$7.0
$8.0
FY13 FY14 FY15 AverageYTD
Tho
usa
nd
s
Average cost paid by state for arbitration
P a g e | 33
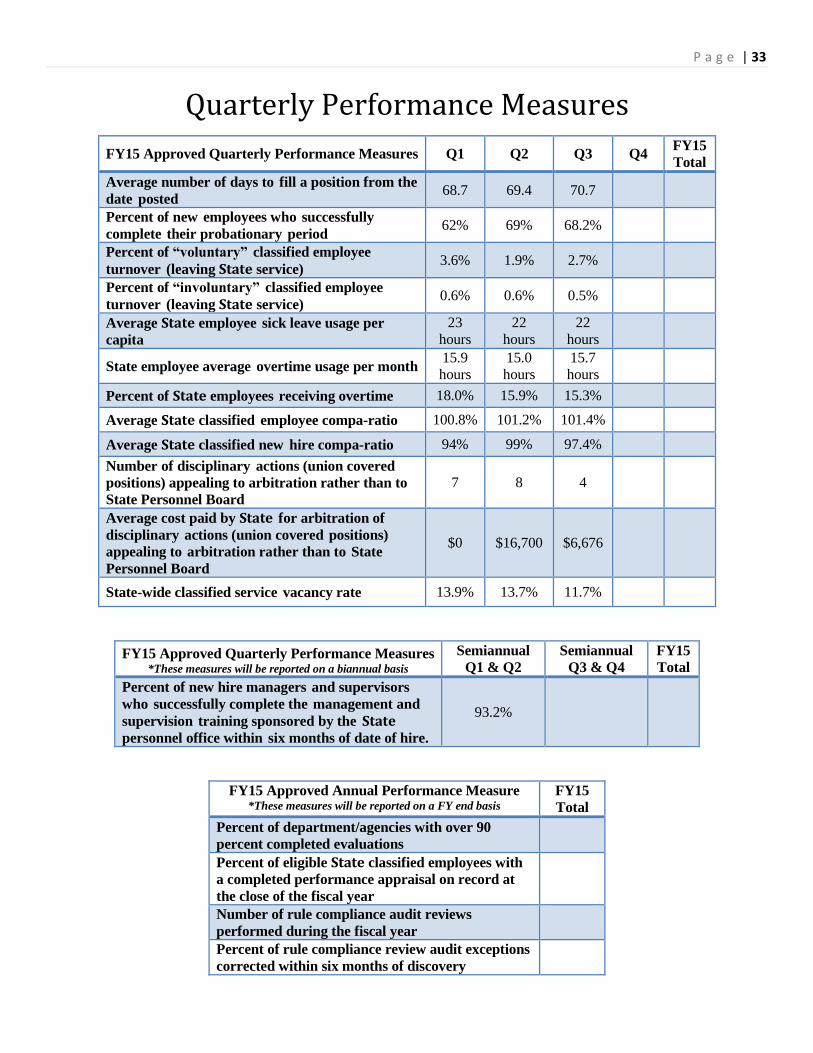
Quarterly Performance Measures
FY15 Approved Quarterly Performance Measures Q1 Q2 Q3 Q4 FY15
Total
Average number of days to fill a position from the
date posted 68.7 69.4 70.7
Percent of new employees who successfully
complete their probationary period 62% 69% 68.2%
Percent of “voluntary” classified employee
turnover (leaving State service) 3.6% 1.9% 2.7%
Percent of “involuntary” classified employee
turnover (leaving State service) 0.6% 0.6% 0.5%
Average State employee sick leave usage per
capita
23
hours
22
hours
22
hours
State employee average overtime usage per month 15.9
hours
15.0
hours
15.7
hours
Percent of State employees receiving overtime 18.0% 15.9% 15.3%
Average State classified employee compa-ratio 100.8% 101.2% 101.4%
Average State classified new hire compa-ratio 94% 99% 97.4%
Number of disciplinary actions (union covered
positions) appealing to arbitration rather than to
State Personnel Board
7 8 4
Average cost paid by State for arbitration of
disciplinary actions (union covered positions)
appealing to arbitration rather than to State
Personnel Board
$0 $16,700 $6,676
State-wide classified service vacancy rate 13.9% 13.7% 11.7%
FY15 Approved Quarterly Performance Measures *These measures will be reported on a biannual basis
Semiannual
Q1 & Q2
Semiannual
Q3 & Q4
FY15
Total
Percent of new hire managers and supervisors
who successfully complete the management and
supervision training sponsored by the State
personnel office within six months of date of hire.
93.2%
FY15 Approved Annual Performance Measure *These measures will be reported on a FY end basis
FY15
Total
Percent of department/agencies with over 90
percent completed evaluations
Percent of eligible State classified employees with
a completed performance appraisal on record at
the close of the fiscal year
Number of rule compliance audit reviews
performed during the fiscal year
Percent of rule compliance review audit exceptions
corrected within six months of discovery