new insights from historical information
TRANSCRIPT
New Insights from Historical Information Utah Department of Transportation
July 2016 Nathan Lee, P.E., Planning & Programming Director, UDOT Shourya Shukla, Vice President Business Solutions Architecture, ROLTA
Utah Department of Transportation Key Facts
Business Pavements and Bridges Roadway Projects
KA
OK
A RI
MA

Background
• UDOT has built a spatially enabled data warehouse that pulls together data from various systems
• Data Warehouse is incorporated with reporting structure
• Consolidated data includes historical information around roadway construction in the state for over 15 years.

History of Data Management at UDOT
• Prior to 2008, all data was stored within individual systems
• 2008 Data repository to address business requirements.
• In 2011, UDOT developed UGate to streamline management of spatial data.
• 2013 an integrated Data Warehouse need was determined and funded.

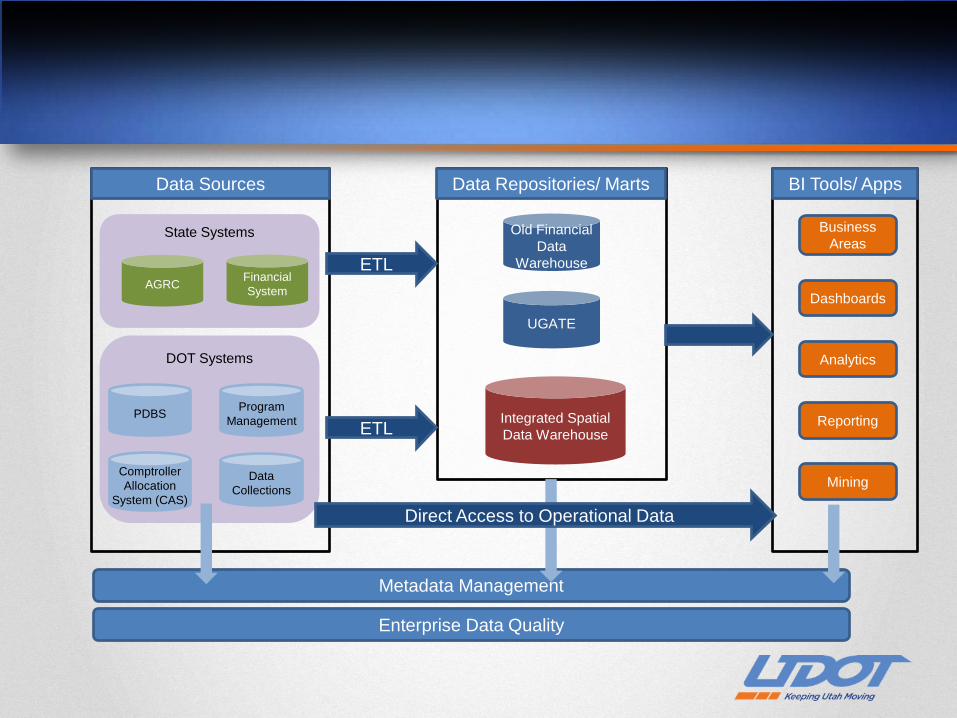
System Interactions
DOT Systems
Data Sources Data Repositories/ Marts
LRS
State Systems
Program Management
Financial System AGRC
PDBS
Comptroller Allocation System (CAS)
BI Tools/ Apps
ETL
UGATE
Business Areas
Dashboards
Analytics
Reporting
Mining
Metadata Management
Enterprise Data Quality
Old Financial Data Warehouse
Direct Access to Operational Data

Importance of Historical Data
• Most data generated and consumed within business units for their specific purposes and immediate needs.
• Most times data good enough for operational needs. • In some cases, DOT would like to combine data from multiple sources to
derive strategic insights. • For determining historical performance of assets, effectiveness of past
strategies and investment decisions. • Attempts to do so, typically ran into several challenges
–Individual systems have outdated copies of data sourced from other systems –Many source systems did not maintain history –Data meanings, assumptions and classifications change over time. The original definitions don't
translate to the today's context. –Dollars spent may not necessarily match dollars programmed
• To understand whether decisions had desired impact, need to bring data to current structure to be able to understand it.
Challenges with historical data
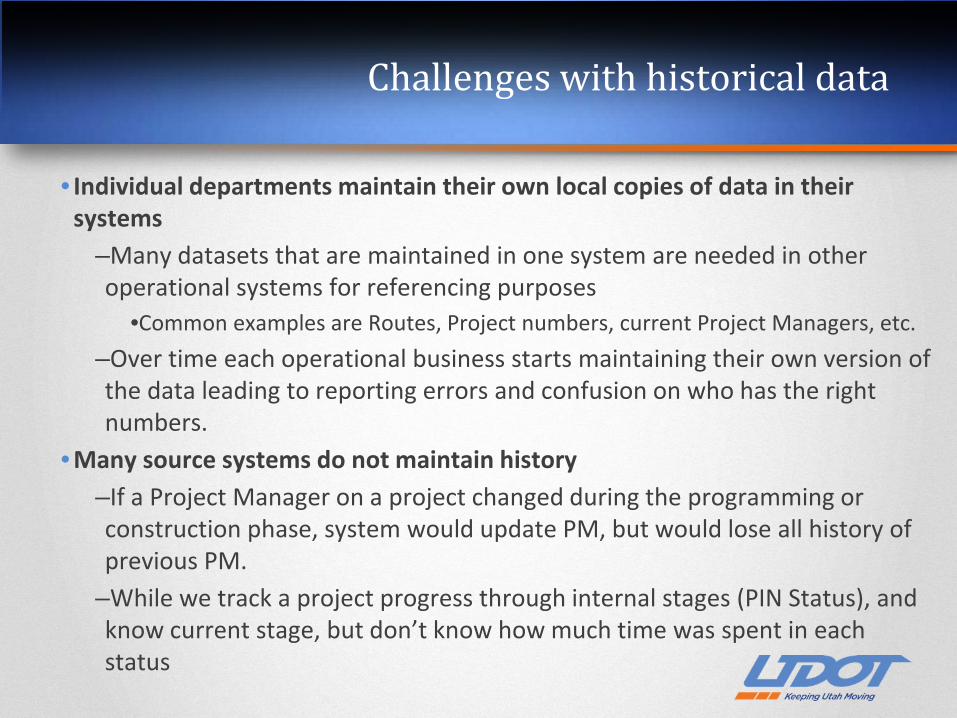
• Individual departments maintain their own local copies of data in their systems
–Many datasets that are maintained in one system are needed in other operational systems for referencing purposes
•Common examples are Routes, Project numbers, current Project Managers, etc. –Over time each operational business starts maintaining their own version of the data leading to reporting errors and confusion on who has the right numbers.
• Many source systems do not maintain history –If a Project Manager on a project changed during the programming or construction phase, system would update PM, but would lose all history of previous PM.
–While we track a project progress through internal stages (PIN Status), and know current stage, but don’t know how much time was spent in each status

Challenges with historical data
• Data Meanings and Assumptions Change over time –Subtle differences in which funds can be utilized for what use due to changes in policy –Looking at fund codes alone not adequate to relate to project type –Need to look at actual projects to understand how money actually spent
• Dollars programmed may not match Actual expenditures –Initial Dollars assigned/ obligated may sit idle due to efficient bids or sometimes due to
project delays –After each project milestone, unutilized funds moved to an “efficiency pot” for
utilization by groups who have ready to deliver projects –Funds may get utilized differently from way they were programmed.
• Work programmed may not match actual work done –Every year the pavement group determine optimal strategy for preserving asset based
on current condition and lifecycle cost of assets. –This is recommended to the Regions –Regions have greater local knowledge and can add input to the prioritization or delivery
of projects –It is through the project and expenditure data we can determine what the actual
treatment applied and actual cost incurred.

Challenges with spatial resolution
• Project locations change with reference to underlying routes –During programming stage, projects identified based on latest milepost location and
stored as part of Project definition –By construction phase, actual route definitions may change due to re-alignments and LRS
updates –When comparing historical investments on a pavement section, it is important to be able
to reference projects based on current mileposts.
• Projects span geographic and administrative boundaries –In the Project Management System (ePM), a project is tied to a specific county and region –To understand historical expenditure of funds across spatial administrative boundaries, it
was important to relate project locations to actual geographies, that themselves may change over time.
–Need to apportion project locations and dollars spent across spatial geography

Initial questions that UDOT wanted answered from historical data
• How did the actual expenditures differ from programmed dollars?
• Are we changing the way we spend our money?
• How many surface areas did we deliver by region, county, route?
• Are we getting better on how we deliver on our outcomes?
• Did we spend all the dollars we received/ allocated/ obligated?
• What is the typical cash flow for a project of a certain type and certain value?

Initial questions UDOT wanted answered:
On Rehabilitation ? How did the actual expenditure differ from programmed dollars?
• How many surface areas did we deliver by region, county, route? • Are we changing the way we spend our money? • Are we getting better on how we deliver on our outcomes? • Did we spend all the dollars we received/ allocated/ obligated? • What is the typical cash flow for a project of a certain type and certain value?
On Preservation ?
On Safety ?
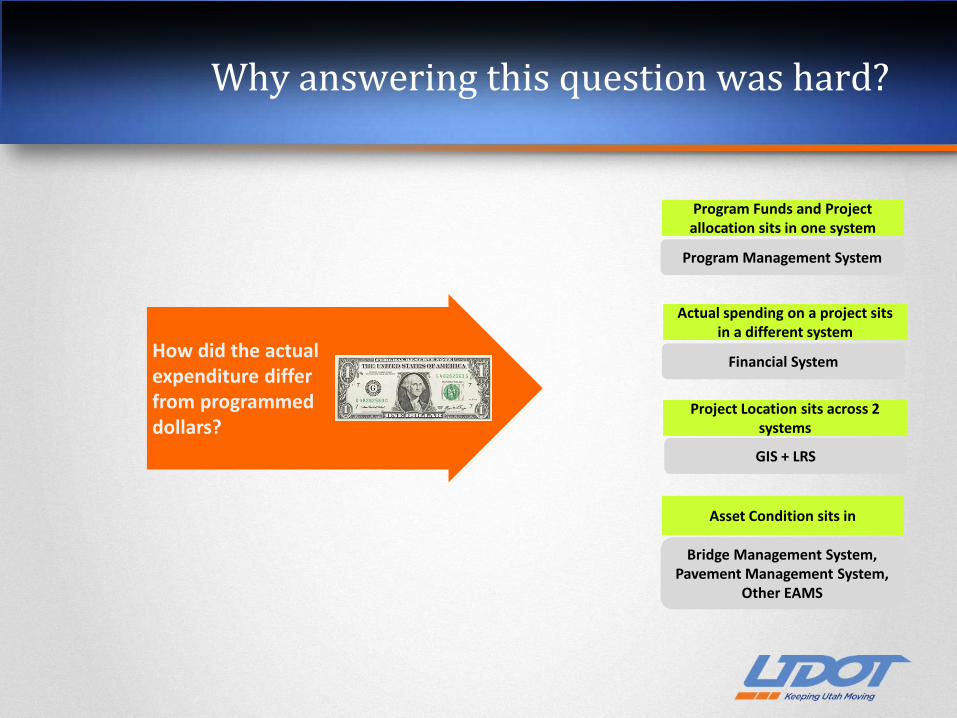
Why answering this question was hard?
Program Funds and Project allocation sits in one system
Actual spending on a project sits in a different system
Asset Condition sits in
How did the actual expenditure differ from programmed dollars?
Program Management System
Financial System
Bridge Management System, Pavement Management System,
Other EAMS
Project Location sits across 2 systems
GIS + LRS

The Solution
Bring data from above systems into a spatially enabled Data Warehouse.
Integrated Spatial DW Projects
Finance
Assets Spatial
DW
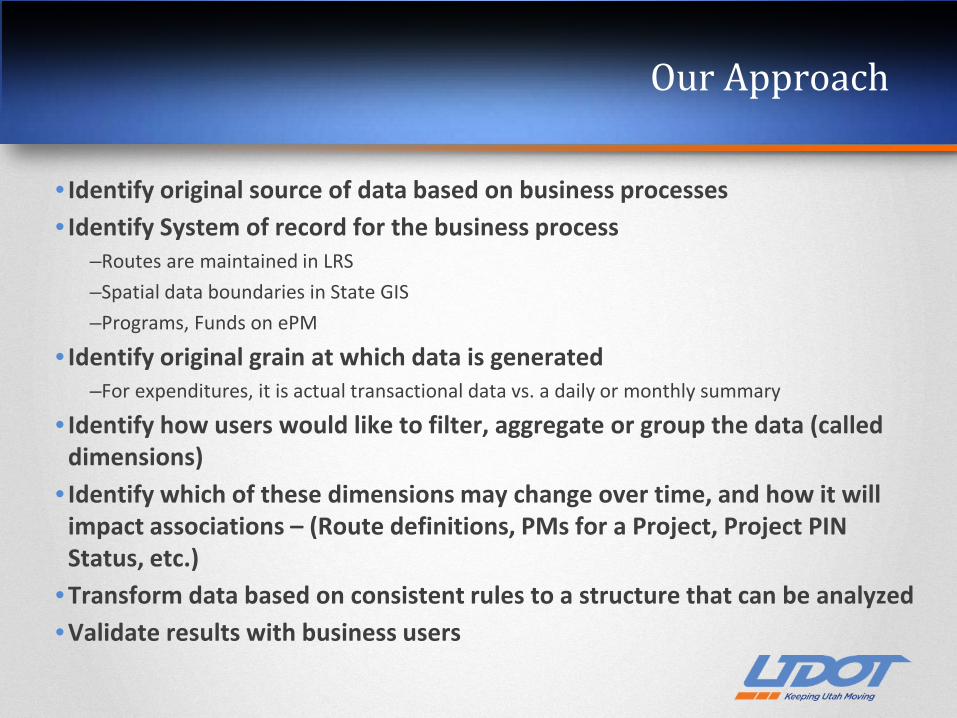
Our Approach
• Identify original source of data based on business processes • Identify System of record for the business process
–Routes are maintained in LRS –Spatial data boundaries in State GIS –Programs, Funds on ePM
• Identify original grain at which data is generated –For expenditures, it is actual transactional data vs. a daily or monthly summary
• Identify how users would like to filter, aggregate or group the data (called dimensions)
• Identify which of these dimensions may change over time, and how it will impact associations – (Route definitions, PMs for a Project, Project PIN Status, etc.)
• Transform data based on consistent rules to a structure that can be analyzed • Validate results with business users
DOT Systems
Data Sources Data Repositories/ Marts
Data Collections
State Systems
Program Management
Financial System AGRC
PDBS
Comptroller Allocation
System (CAS)
BI Tools/ Apps
ETL
UGATE
Business Areas
Dashboards
Analytics
Reporting
Mining
Metadata Management
Enterprise Data Quality
Old Financial Data
Warehouse
ETL
Direct Access to Operational Data
Integrated Spatial Data Warehouse

Initial questions that UDOT wanted answered from historical data were answered
• How did the actual expenditures differ from programmed dollars?
• Are we changing the way we spend our money?
• How many surface areas did we deliver by region, county, route?
• Are we getting better on how we deliver on our outcomes?
• Did we spend all the dollars we received/ allocated/ obligated?
• What is the typical cash flow for a project of a certain type and certain value?
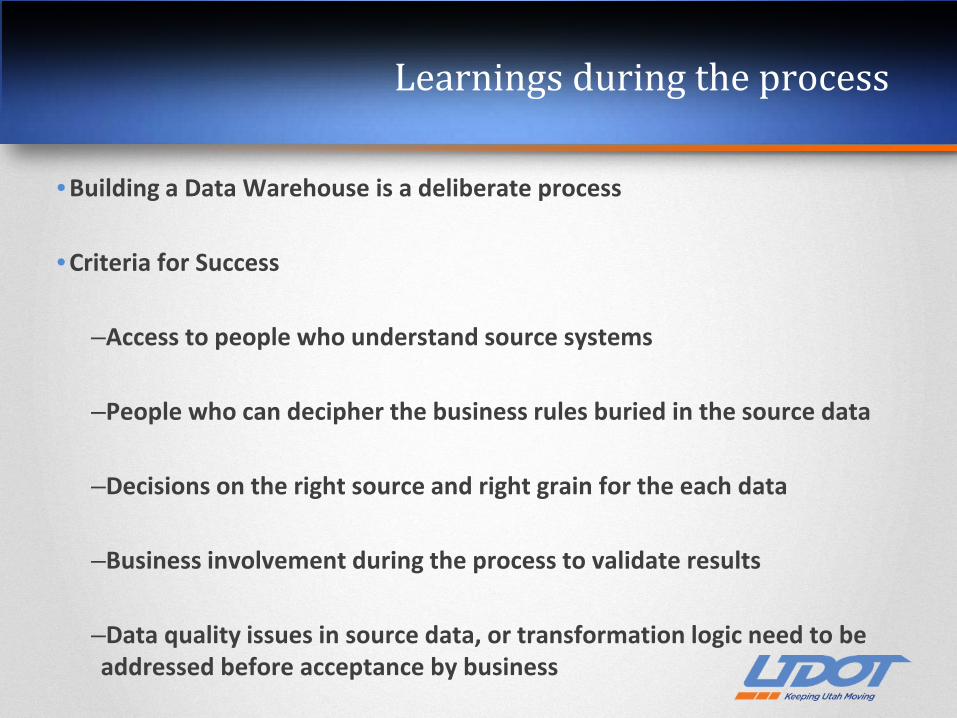
Learnings during the process
• Building a Data Warehouse is a deliberate process
• Criteria for Success
–Access to people who understand source systems
–People who can decipher the business rules buried in the source data
–Decisions on the right source and right grain for the each data
–Business involvement during the process to validate results
–Data quality issues in source data, or transformation logic need to be addressed before acceptance by business

Takeaways
• Not all data in the DOT Enterprise is equal
• Data warehousing is right strategy when – Answering questions that span business areas, time periods and underlying rules and
assumptions change over time – Need historical data but no history maintained by source system
• Standard data repositories good enough when
– Looking at data within a departmental dataset or operational dataset – Does not need historical information
• Ideal solution needs a mix of both approaches
– Manage foundational datasets in a DW – Manage operational datasets using data marts or directly within operational systems

DOT Systems
Data Sources Data Repositories/ Marts
LRS
State Systems
Program Management
Financial System
GIS
PDBS
Safety
Comptroller Allocation
System (CAS)
BI Tools/ Apps
Condition
Traffic
Structures
Integrated Spatial Data Warehouse
Business Areas
Dashboards
Analytics
Reporting
Mining
Projects
Direct Access to Operational Data
Metadata Management
Enterprise Data Quality
Financials
Others..
ETL ETL

UDOT Data Warehouse
July 2016 Nathan Lee, P.E., Planning & Programming Director, UDOT
Shourya Shukla, Vice President Business Solutions Architecture, ROLTA