new homes and red tape in ontario: residential land … · new homes and red tape in ontario...
TRANSCRIPT

NEW HOMES AND RED TAPE IN ONTARIO:
Residential Land-Use Regulation in the Greater Golden Horseshoe
OCTOBER 2016
Kenneth P. Green, Ian Herzog, and Josef Filipowicz


October 2016 • Fraser Institute
New Homes and Red Tape in Ontario
Residential Land-Use Regulation in the Greater Golden Horseshoe
by Kenneth P. Green, Josef Filipowicz, and Ian Herzog

fraserinstitute.org
Contents
Executive Summary / i
1 Introduction / 1
2 The Data / 3
3 Survey Results / 8
4 An Index of Residential Land-Use Regulation / 22
5 Professionals’ Concerns and Policy Recommendations / 24
6 Conclusion / 25
Appendix 1 Constructing the Index / 26
Appendix 2 Approval Timelines by Rezoning and Housing Type / 28
Appendix 3 Rezoning by Housing Type / 32
Appendix 4 Survey Questions / 34
References / 36
About the authors / 39
Acknowledgments / 40
About the Fraser Institute / 41
Publishing Information / 42
Supporting the Fraser Institute / 43
Purpose, Funding, and Independence / 43
Editorial Advisory Board / 44

Green, Filipowicz, and Herzog • New Homes and Red Tape in Ontario • i
fraserinstitute.org
Executive Summary
As an increasing number of people move to major Canadian cities, housing prices have continued to rise in its most desirable markets. With growing concern about housing availablility and prices, understanding how public policy affects the supply of new homes is critical. The Fraser Institute’s survey of housing developers and homebuilders provides new insight into this issue. This report is part of a series tallying survey data to represent industry professionals’ experi-ences and opinions of how residential development is regulated in cities across Canada. This report presents survey results for cities in Ontario’s Greater Golden Horseshoe (GGH).
Estimates of typical project approval timelines in GGH cities range from 14.4 months in Burlington and 15.1 months in Barrie, to 22.3 months in Clarington and 24.3 months in Georgina. Toronto’s estimated timeline is shorter than the regional average, at 17.7 months. Timeline uncertainty’s deterrent to homebuild-ing is strongest in Barrie.
Reported compliance costs and fees add up to a low of $21,000 per home built in Hamilton and a high of $60,500 per home in Oakville. Reported compliance costs in Toronto average $46,570 per unit.
The survey reports that zoning classifications need to be changed to accom-modate more than 50% percent of new residential development in 28 out of 32 cities. Estimates of rezoning’s effect on approval timelines range from under one additional month in King Township to 11.25 months in Hamilton.
Council and community opposition to residential development is perceived as strongest in cities where dwelling values are highest, raising questions about the causes and consequences of local resistance to new housing. The strongest opposition is reported in King Township, Toronto, and Oakville. This opposition is typically not perceived as a significant deterrent to building in Brampton, Oshawa, and Burlington.
While market forces tend to dominate development decisions, industry pro-fessionals also expressed a range of specific policy concerns. For example, survey respondents indicate that increasing stringency in municipal and provincial regu-lation limits consumer choice, and forces smaller builders out of the marketplace. The need for numerous reviews and permissions from various parties, rather than a single streamlined process, is another commonly expressed concern, and one that has grown in recent years. Finally, local real estate professionals suggest that

ii • New Homes and Red Tape in Ontario • Green, Filipowicz, and Herzog
fraserinstitute.org
housing affordability may be adversely affected by provincial land-use policies in years to come. The 7,200 km2 of rural land virutally withdrawn from development by Ontario’s Greenbelt can pose unique challenges to future growth in the Greater Golden Horseshoe.
The publication provides a summary index of residential land-use regu-lation that is calculated by tallying across five key components of regulation’s impact—Approval Timelines, Council and Community, Cost and Fees, Rezoning Prevalence, and Timeline Uncertainty—in the 23 cities that generated sufficient survey responses. This index ranks Burlington as the least regulated and the King Township as the most. Toronto, the GGH’s core, ranks worse than most at 20th of 23 municipalities.

Green, Filipowicz, and Herzog • New Homes and Red Tape in Ontario • 1
fraserinstitute.org
1 Introduction
As an increasing number of people move to Canada’s major cities, housing prices have continued to rise in its most desirable markets. With growing concern about housing availability and prices, understanding how public policy affects the sup-ply of new homes is critical. Evidence of the importance of land constraints for determining differences in the supply of new housing, and price growth, across American housing markets is mounting (see Saiz, 2010 and Saks, 2008 for exam-ples). Systematic comparisons of land-use regulations across Canadian cities can help identify where they are cost effective and efficient, and where these regula-tions burden local economies and aspiring home-owners.
Ontario’s Greater Golden Horseshoe (GGH), a region specifically addressed by current provincial land-use planning (Ontario Ministry of Infrastructure, 2006), encompasses over one hundred municipalities1 in Southern Ontario and was home to two thirds of Ontario’s population as of the 2011 census (see figure 1).
The GGH, Canada’s most populous urban area, is primarily located along the north and west shores of Lake Ontario, within a two hours’ drive from the United States border. Although this region is mostly surrounded by flat or rolling farm-land, presenting little geographical impediment to growth, much of it falls within the Greenbelt, a 7,200 km² band of protected rural land. The Greater Toronto housing market has seen prices rise by 79.3% between January 2006 and January 2016 (MLS, 2016) while consumer prices rose by 20% (Statistics Canada, 2016).
The Fraser Institute has conducted two surveys—one in 2014, one in 2016— of developers and homebuilders to assess how residential land-use regulation affects the supply of new housing. The data collected represent the experiences and opin-ions of industry professionals across Canada. This report presents survey results for cities in GGH, describing the length and uncertainty of approval timelines for residential development projects, compliance costs and fees, how frequently respondents must rezone property, and how they gauge local and political oppos-ition to their projects.
The Fraser Institute’s Survey of Land-Use Regulation continues work done in the United States, developing insights into policy outcomes in Canadian cities. Recent US work that inspired this survey includes Gyourko, Saiz, and Summers (2008),
1. The GGH includes 89 lower-tier municipalities (e.g. Mississauga, Niagara Falls), 11 upper-tier municipalities (e.g. York Region, Waterloo Region), and 10 single-tier municipalities (e.g. Toronto, Guelph).

2 • New Homes and Red Tape in Ontario • Green, Filipowicz, and Herzog
fraserinstitute.org
who conducted a nationwide survey measuring these regulatory processes and their outcomes. Another series of surveys was used to understand land-use regulation in the San Francisco Bay Area, incorporating perspectives of city officials and resi-dential developers (Calfee et al., 2007; Quigley, Raphael, and Rosenthal, 2007). For a more in-depth exploration of research into regulation’s economic impacts, see Green, Herzog, and Filipowicz, 2015b.
Hamilton
Niagara Falls
Port Hope
Burlington
Oakville
Thorold
Milton
Halton Hills
Caledon
Mono
Brampton
Mississauga
Toronto
King Township
Vaughan
Bradford West
Gwillimbury
Barrie
Georgina
Brock Township
East Gwillimbury
Newmarket
AuroraRichmond
Hill
Whitchurch-Stou�ville
MarkhamPickering
Ajax
Whitby
Oshawa
Clarington
Uxbridge Scugog
Figure 1: Jurisdictions from Ontario’s Greater Golden Horseshoe discussed in this report
7
401
QEW
401
400
11
40 Kilometers
N
W
S
E

Green, Filipowicz, and Herzog • New Homes and Red Tape in Ontario • 3
fraserinstitute.org
2 The Data
2.1 Survey questionnaire The Fraser Institute’s Survey of Residential Land-Use Regulation was designed to capture key insights into residential development and building professionals’ experiences with land-use regulation. Its design is an extension of work by Calfee et al. (2007). Their survey was meant to support data from city planning offi-cials. We have modified their methods to form a standalone survey of residential developers and home builders describing land-use regulation. Respondents were directed to focus on municipalities and types of residential development with which they were familiar, giving accounts of:
• the typical length and uncertainty of approval timelines;
• typical regulatory compliance costs and fees;
• the role of politicians and community groups in residential development;
• the effects of zoning bylaws and official plans;
• uncertainty in possible land uses prior to applications for building permit or rezoning
Responses were measured on scales that reflect directly measurable outcomes where possible (months, dollars, or proportion of projects affected), and clearly labeled 5-point scales otherwise. We distinguish single-family, clearly defined as single detached homes, from multiple-dwelling developments, which we specify as including townhouse, semi-detached, and apartment units2—consistent with the Canada Mortgage and Housing Corporation’s definition (CMHC, 2014). The survey was administered electronically and distributed through developer and homebuilder trade associations. For a list of survey questions, see Appendix 4.
Survey response and the sampleThe survey was conducted over two periods, in the Fall of 2014 and the Spring of 2016, and distributed primarily through industry associations. The regula-tory data used in this report were obtained from 93 respondents in the Greater Golden Horseshoe (GGH). The average respondent answered questions for 8.6
2. High-rise condominiums are included in the category of multiple-dwelling developments.
4 • New Homes and Red Tape in Ontario • Green, Filipowicz, and Herzog
fraserinstitute.org
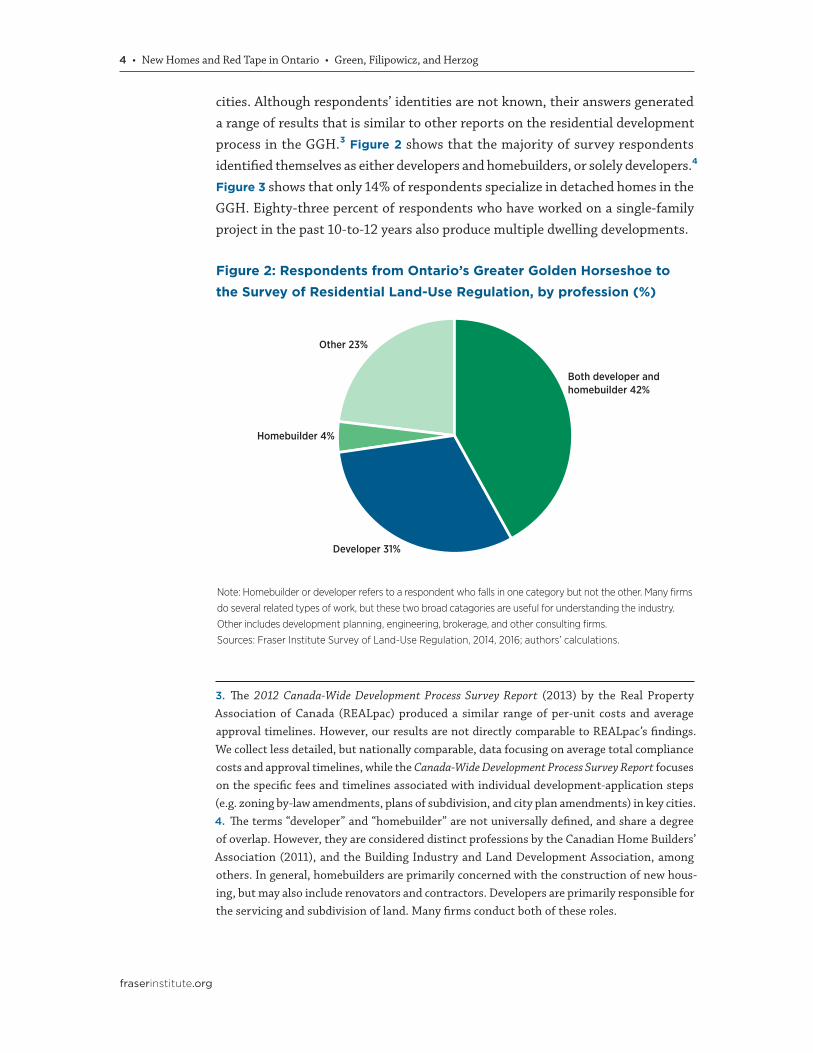
cities. Although respondents’ identities are not known, their answers generated a range of results that is similar to other reports on the residential development process in the GGH.3 Figure 2 shows that the majority of survey respondents identified themselves as either developers and homebuilders, or solely developers.4 Figure 3 shows that only 14% of respondents specialize in detached homes in the GGH. Eighty-three percent of respondents who have worked on a single-family project in the past 10-to-12 years also produce multiple dwelling developments.
3. The 2012 Canada-Wide Development Process Survey Report (2013) by the Real Property Association of Canada (REALpac) produced a similar range of per-unit costs and average approval timelines. However, our results are not directly comparable to REALpac’s findings. We collect less detailed, but nationally comparable, data focusing on average total compliance costs and approval timelines, while the Canada-Wide Development Process Survey Report focuses on the specific fees and timelines associated with individual development-application steps (e.g. zoning by-law amendments, plans of subdivision, and city plan amendments) in key cities.4. The terms “developer” and “homebuilder” are not universally defined, and share a degree of overlap. However, they are considered distinct professions by the Canadian Home Builders’ Association (2011), and the Building Industry and Land Development Association, among others. In general, homebuilders are primarily concerned with the construction of new hous-ing, but may also include renovators and contractors. Developers are primarily responsible for the servicing and subdivision of land. Many firms conduct both of these roles.
Figure 2: Respondents from Ontario’s Greater Golden Horseshoe to the Survey of Residential Land-Use Regulation, by profession (%)
Note: Homebuilder or developer refers to a respondent who falls in one category but not the other. Many firms
do several related types of work, but these two broad catagories are useful for understanding the industry.
Other includes development planning, engineering, brokerage, and other consulting firms.
Sources: Fraser Institute Survey of Land-Use Regulation, 2014, 2016; authors’ calculations.
Both developer and homebuilder 42%
Homebuilder 4%
Developer 31%
Other 23%

Green, Filipowicz, and Herzog • New Homes and Red Tape in Ontario • 5
fraserinstitute.org
This report presents several measures of regulation based on the survey data. We do not report results for categories based on fewer than three responses and we indicate where they are based on fewer than five. The number of cities presented in each section of our analysis varies alongside the number of responses to each ques-tion in our survey. Each figure presented in this study includes a regional average. This average is calculated across all responses from the GGH, rather than across cities. Since results are suppressed in cities with few respondents, the regional average of each indicator generally will not coincide with the average of city-level indexes presented.
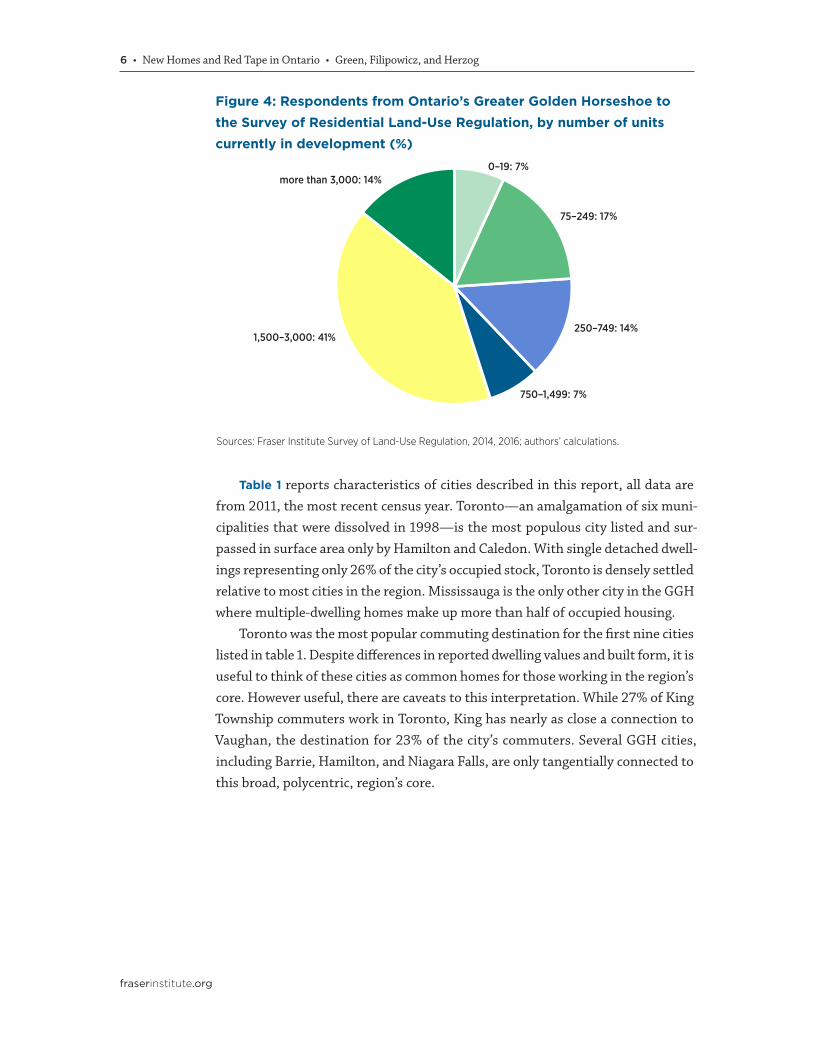
Without knowing the market shares of companies responding to the survey it is difficult to calculate a meaningful response rate. For example, if one developer represents 60% of new home-building in one city, that developer’s response is arguably more significant than all other responses from that city combined.5 Our survey attempts to approximate scale by asking respondents how many units they currently have in development. Of the respondents who disclosed the scale of their operations in the GGH, the largest portion by far have between 1,500 and 3,000 units underway (figure 4).
5. Conversely, one can speculate that it may be difficult for a new developer or homebuilder to compete successfully against incumbents, who know the nuances of each city’s regulatory pro-cess. If this is true, more highly regulated cities would have fewer developers (each with a large market share), making the experiences of smaller firms important for gauging barriers to access.
Figure 3: Respondents from Ontario’s Greater Golden Horseshoe to the Survey of Residential Land-Use Regulation, by type of development (%)
Sources: Fraser Institute Survey of Land-Use Regulation, 2014, 2016; authors’ calculations.
Multiple dwelling 16%
Single-family 14%
Both multiple dwelling and single-family 70%
6 • New Homes and Red Tape in Ontario • Green, Filipowicz, and Herzog
fraserinstitute.org
Table 1 reports characteristics of cities described in this report, all data are from 2011, the most recent census year. Toronto—an amalgamation of six muni-cipalities that were dissolved in 1998—is the most populous city listed and sur-passed in surface area only by Hamilton and Caledon. With single detached dwell-ings representing only 26% of the city’s occupied stock, Toronto is densely settled relative to most cities in the region. Mississauga is the only other city in the GGH where multiple-dwelling homes make up more than half of occupied housing.
Toronto was the most popular commuting destination for the first nine cities listed in table 1. Despite differences in reported dwelling values and built form, it is useful to think of these cities as common homes for those working in the region’s core. However useful, there are caveats to this interpretation. While 27% of King Township commuters work in Toronto, King has nearly as close a connection to Vaughan, the destination for 23% of the city’s commuters. Several GGH cities, including Barrie, Hamilton, and Niagara Falls, are only tangentially connected to this broad, polycentric, region’s core.
Figure 4: Respondents from Ontario’s Greater Golden Horseshoe to the Survey of Residential Land-Use Regulation, by number of units currently in development (%)
Sources: Fraser Institute Survey of Land-Use Regulation, 2014, 2016; authors’ calculations.
0–19: 7%
75–249: 17%
250–749: 14%
750–1,499: 7%
1,500–3,000: 41%
more than 3,000: 14%

Green, Filipowicz, and Herzog • New Homes and Red Tape in Ontario • 7
fraserinstitute.org
Table 1: Characteristics of cities in the GGH as of the 2011 census
Population Land area (km²)
Single detached
dwellings1 (%)
Median dwelling
value² ($)
Median commute (minutes)3
Most common place of work and percentage
of commuters
Toronto 2,615,060 630 26% $401,400 30.4
Toronto
81%
Markham 301,709 213 64% $500,741 30.4 48%
Vaughan 288,301 274 68% $527,560 30.1 43%
Richmond Hill 185,541 101 62% $550,573 30.6 41%
Whitby 122,022 147 71% $341,505 30.1 32%
Ajax 109,600 67 66% $333,486 35.1 49%
Pickering 88,721 232 63% $349,486 30.6 53%
Aurora 53,203 50 62% $448,626 30.4 28%
Whitchurch-Stouffville 37,628 206 79% $473,318 30.4 35%
King Township 19,899 333 92% $647,478 30.4 27%
Mississauga 713,443 292 39% $401,175 25.9Mississauga
55%
Milton 84,362 363 63% $420,324 30.5 29%
Newmarket 79,978 38 59% $399,632 25.9Newmarket
36%
East Gwillimbury 22,473 245 84% $400,857 30.0 25%
Mono 7,546 278 97% $558,161 30.1 Orangeville 33%
Thorold 17,931 83 72% $219,496 15.6 St Catharines 43%
Barrie 135,711 77 62% $276,279 20.1
within city
62%
Bradford West Gwillimbury 28,077 201 75% $348,511 30.4 24%
Brampton 523,911 266 53% $359,741 30.1 37%
Brock Township 11,341 423 87% $250,606 30.4 39%
Burlington 175,779 186 52% $399,402 20.7 44%
Caledon 59,460 688 85% $474,087 30.6 23%
Clarington 84,548 611 79% $275,315 21.0 27%
Georgina 43,517 288 83% $280,275 30.7 27%
Halton Hills 59,008 276 74% $400,491 30.1 33%
Hamilton 519,949 1,117 58% $275,620 20.6 69%
Niagara Falls 82,997 210 68% $200,611 15.3 66%
Oakville 182,520 139 63% $510,886 25.8 36%
Oshawa 149,607 146 56% $240,415 20.5 42%
Port Hope 16,214 279 75% $250,187 20.3 46%
Scugog 21,569 475 90% $341,433 30.1 34%
Uxbridge 20,623 421 83% $400,657 30.7 30%
Notes: 1. Percentage of occupied private dwellings The census defines single detached dwellings as those with open space on all sides, and no dwellings either above or below. 2. Dwelling value is dollar amount (in CDN$2011) expected by the owner if the dwelling were to be sold. Reported for owner-occupied, non-farm dwellings. 3. Commute time is how many minutes it took for a person to travel from home to work. Reported for individuals age 15 years and older in private house-holds who worked at some time between January 1, 2010 and May 2011. Typically refers to place of employment and resi-dence at the time of the survey.
Sources: Statistics Canada 2013a, 2013b, 2012; authors’ calculations.

8 • New Homes and Red Tape in Ontario • Green, Filipowicz, and Herzog
fraserinstitute.org
3 Survey Results
3.1 Approval timelinesSurvey respondents were asked to estimate approval timelines for standard sin-gle-family and multiple-dwelling projects that do and do not require rezoning (a process described in section 3.3). Between one and four timeline entries per city are recorded for each respondent, depending on the types of work that they do in each city. For each type of work, respondents were asked to select one of 7 ordered choices: 2 months or less, 3 to 6 months, 7 to 10 months, 11 to 14 months, 15 to 18 months, 19 to 23 months, and 24 months or more.
The Approval Timeline Index (ATI) is the city average of survey respondents’ timeline estimates. To calculate this average, each bin was assigned its midpoint,6 and those that input a timeline of three or more years were omitted from the Approval Timeline Index. These high outliers make up 3% of average approval timeline entries.
Of the 28 cities represented in figure 5, all but five have reported timelines in the range of 15 to 20 months. Substantial differences in timelines in cities at the low end (Burlington and Barrie) and high end (Uxbridge, Clarington, and Georgina) of the range are apparent. While municipalities with relatively short reported approval timelines are located across the region, those in the Regional Municipality of Halton7 are roughly concentrated in the shortest third of cities. Conversely, most municipalities in the long half of the GGH’s ATI ranking are located in the regional municipalities of York and Durham, to the north and east of Toronto8 (12 of 14 cities in the long half). Additional measures of approval timelines, broken down by housing type (single-family or multiple dwelling) and by projects requiring rezoning compared to those not requiring rezoning, are presented in Appendix 2.
6. Timelines in months were assigned to bins as follows: a period of 2 months or less is taken as 1 month, 3 to 6 months as 4.5 months, 7 to 10 months as 8.5 months, 11 to 14 months as 12.5 months, 15 to 18 months as 16.5 months, 19 to 23 months as 21 months, and 24 months or more as 28 months, unless the respondent opted to input a timeline estimate (which the survey encouraged, but was not always done).7. Regional municipalities are upper-tier municipal governments unique to Ontario. They are broadly comparable to counties in other provinces or the United States. Halton includes Burlington, Halton Hills, Milton, and Oakville.8. York includes Aurora, East Gwillimbury, Georgina, King Township, Markham, Newmarket, Richmond Hill, Vaughan, and Whitchurch–Stouffville. Durham includes Ajax, Brock Township, Clarington, Oshawa, Pickering, Scugog, Uxbridge, and Whitby.

Green, Filipowicz, and Herzog • New Homes and Red Tape in Ontario • 9
fraserinstitute.org
0 5 10 15 20 25
Georgina
Clarington
Uxbridge
Bradford West Gwilimbury
King Township
Aurora
Ajax
East Gwillimbury
Port Hope***
Oshawa
Whitchurch–Stou�ville
Vaughan
Pickering
Newmarket
Richmond Hill
Markham
Caledon
Mississauga
Oakville
Toronto
Halton Hills
Hamilton
Milton
Brampton
Whitby
Scugog Township***
Barrie***
Burlington
Figure 5: The Approval Timeline Index (2016) for Ontario’s Greater Golden Horseshoe—typical approval timeline, in months
Note: *** = 3 responses; ** = 4 responses; * = 5 responses.
Sources: Fraser Institute Survey of Land-Use Regulation, 2014, 2016; authors’ calculations.
14.4
16.7
16.7
17.0
17.5
17.6
17.7
17.8
18.2
18.4
18.4
18.5
18.8
19.0
19.0
19.3
19.7
20.1
19.9
19.8
15.1
17.2
17.9
18.6
18.7
20.3
22.3
24.3
Cross-respondent average for the GGH—18.2 months

10 • New Homes and Red Tape in Ontario • Green, Filipowicz, and Herzog
fraserinstitute.org
The Approval Timeline Index is influenced by the type of project done by sur-vey respondents, which varies across cities. In the example of an extreme case where no respondent describes single-family development, the ATI would be based entirely on accounts of the approval process for multiple-dwelling building. The ATI is deliberately constructed this way, to represent the average approval time-line for typical housing developments in each city.
3.2 Timeline uncertaintyIn addition to the average approval time for a project, developers may also take the variation in approval times into account when considering projects. To assess the effect of timeline uncertainty in each city, we asked developers how this uncer-tainty affects both multiple-dwelling and single-family development in each city. Responses are measured on a 5-point scale: [1] encourages development; [2] not a deterrent to development; [3] mild deterrent to development; [4] Strong deterrent to development; and [5] would not pursue development due to this factor. The Timeline Uncertainty Index is the average response to this question in each city (figure 6).
Average reported ratings of timeline uncertainty deviate little from the centre of this measure’s 5-point scale. Timeline uncertainty is rarely absent to a degree that would encourage development, but also tends not to present a strong deter-rent to development in this region. Vaughan presents the least uncertainty at 2.6 (between no deterrent and a mild deterrent on average), and Barrie presents the most at 3.5 (between a mild and strong deterrent). Toronto is in the high end of this range, presenting a mild deterrent to development.
Approval timelines are an important component of established measures of residential land-use regulation (Gyourko, Saiz, and Summers, 2008; Quigley, Raphael, and Rosenthal, 2007). Long and uncertain approval timelines can make the supply of new housing less responsive to demand, with negative consequences for anyone looking to enter the market (see Green, Herzog, and Filipowicz, 2015b, Green, Filipowicz, Lafleur, Herzog, 2016, and Mayer and Somerville, 2000 for a more detailed discussion).
3.3 Compliance costs and feesWe asked respondents to estimate the sum of regulatory compliance costs and fees accrued per dwelling unit built for standard single-family and multiple-dwelling projects.9 The survey offered 7 ordered choices: Less than $1,000 per unit; $1,000 to
9. Specifically, we asked for estimates of the cost (per dwelling unit) of the project approval and regulatory compliance process in each city. The survey specified that this includes all admin-istration, processing, and direct compliance costs. Appendix 4 presents the exact wording of the survey questionnaire.

Green, Filipowicz, and Herzog • New Homes and Red Tape in Ontario • 11
fraserinstitute.org
0 1 2 3 4 5
Barrie**
Hamilton
Oakville
Georgina***
Toronto
Bradford West Gwilimbury
Ajax
King Township
Caledon
Halton Hills
Richmond Hill
Oshawa**
Aurora
Whitchurch–Stou�ville
Whitby
Mississauga
Newmarket
Milton
Burlington
Pickering
Markham
East Gwillimbury
Brampton
Uxbridge**
Vaughan
Figure 6: The Timeline Uncertainty Index (2016) for Ontario's Greater Golden Horseshoe
Note: *** = 3 responses; ** = 4 responses; * = 5 responses.
Sources: Fraser Institute Survey of Land-Use Regulation, 2014, 2016; authors’ calculations.
2.6
2.7
2.7
2.8
2.8
2.8
2.8
2.8
2.9
3.0
3.0
3.0
3.0
3.1
3.1
3.1
3.2
3.3
3.5
3.3
3.3
2.6
2.8
3.0
3.0
Cross-respondent average for the GGH—2.9

12 • New Homes and Red Tape in Ontario • Green, Filipowicz, and Herzog
fraserinstitute.org
$9,999 per unit; $10,000 to $19,999 per unit; $20,000 to $34,999 per unit; $35,000 to $49,999 per unit; $50,000 to $75,000 per unit; and more than $75,000 per unit. Respondents had the option to specify a cost if they selected the highest bin.
The Cost and Fees Index (CFI) is the city average of survey respondents’ com-pliance costs and fee estimates. To calculate this average, each bin was assigned its midpoint10 and those who input a cost of $100,000 or more were omitted. In total these high outliers account for under 4% of all cost entries in the region.
Figure 7 shows CFI ratings in the 23 GGH municipalities where we have enough data to measure regulatory costs of residential development reliably. At just under $20,000 per unit, Hamilton’s CFI is by far the lowest in the region, followed by Burlington, with a CFI of $32,500. Oakville, Richmond HIll, and King Township have the highest reported compliance costs—all in the $55,000-to-$61,000 range. Perhaps most surprising is the difference in CFI between the neighbouring cities of Burlington and Oakville. The spread in regulatory costs between these cities is almost $30,000; Burlington’s costs are the second lowest in the region while Oakville’s are among the highest of these 23 cities. Regulatory costs and fees associated with residential development in Toronto are reported to be near the region’s average.
Servicing residential development can be subject to increasing returns to scale. Dense, inner-city development should generally be cheaper to service on a per-dwelling basis than homes built in new neighbourhoods (see Slack, 2002 for a dis-cussion in the Canadian context). If regulatory costs broadly aim to represent the capital cost of servicing new neighbourhoods with new roads, sewers, and other infrastructure, they should be lowest in cities that are intensifying—growing by making existing communities denser rather than creating new ones on greenfield land. However, Green, Herzog, and Filipowicz (2015b) show that trends in regu-latory costs across Canada are the opposite of what one would expect if the CFI measures reasonable servicing costs. Instead, the data suggest that intensifying cities often have regulatory frameworks that are costly to navigate.
3.4 RezoningThe need to change zoning bylaws can affect approval timelines and regulatory costs. Zoning bylaws “[state] exactly: how land may be used; where buildings and other structures can be located; the types of buildings that are permitted and how they may be used; [and] the lot sizes and dimensions, parking requirements, building
10. Costs and fees in dollars per dwelling unit built were assigned to bins as follows: Less than $1,000 per unit is taken as $500; $1,000 to $9,999 per unit as $5,000; $10,000 to $19,999 per unit as $15,000; $20,000 to $34,999 per unit as $27,500; $35,000 to $49,999 per unit as $42,500; $50,000 to $75,000 per unit as $62,500; and more than $75,000 per unit as $82,500.

Green, Filipowicz, and Herzog • New Homes and Red Tape in Ontario • 13
fraserinstitute.org
0 10,000 20,000 30,000 40,000 50,000 60,000 70,000
Oakville
Richmond Hill
King Township
Vaughan
Ajax
Mississauga
Halton Hills
Oshawa**
Aurora
Brampton
Milton
Newmarket
East Gwillimbury
Toronto
Markham
Caledon
Whitchurch–Stou�ville
Bradford West Gwilimbury**
Whitby
Pickering
Uxbridge**
Burlington*
Hamilton
Figure 7: The Cost and Fees Index (2016) for Ontario’s Greater Golden Horseshoe—typical regulatory cost, $ per dwelling unit
Note: *** = 3 responses; ** = 4 responses; * = 5 responses.
Sources: Fraser Institute Survey of Land-Use Regulation, 2014, 2016; authors’ calculations.
$20,962
$39,643
$40,500
$44,048
$44,375
$45,595
$46,190
$46,570
$47,188
$47,353
$50,313
$50,357
$51,471
$53,600
$54,318
$54,609
$60,543
$58,167
$55,000
$32,500
$46,532
$48,824
$49,018
Cross-respondent average for the GGH—$48,034

14 • New Homes and Red Tape in Ontario • Green, Filipowicz, and Herzog
fraserinstitute.org
heights and setbacks from the street” (Ontario, Ministry of Municipal Affairs and Housing, 2010). It is difficult to measure the impact of zoning on the housing sup-ply: we cannot observe how a city would grow without its current regulation. The prevalence of rezoning (the process of amending the zoning designation assigned to a given parcel) is our most objective measure of zoning’s impact on development.11
Our survey asked respondents whether they rezone property. Those who do were asked to estimate how frequently their multiple-dwelling and single-family projects require rezoning in each city by selecting one of five bins: Never; Rarely (about 25% of projects); Sometimes (about half of projects); Frequently (about 75% of projects); and Always. The Rezoning Index is the average percentage of respondents’ projects estimated to require rezoning in each city.12 It is reported in figure 8 and broken down by development type where possible in Appendix 3.
Our survey suggests that only 40% of projects in Scugog Township require rezoning. Conversely, almost all reported projects in Niagara Falls, Thorold, and Port Hope require this approval, although data for these cities are drawn from fewer resondents. A more meaningful result is found in Pickering, where a much larger number of respondents consistently report a high frequency of rezoning.13 In the GGH, the average reported proportion of new development requiring rezon-ing is 62%, far above the average of 46% in the rest of Canada.14
Survey respondents who describe approval timelines both with and with-out rezoning allow us to estimate the average effect of the rezoning process on approval timelines. We do this by calculating the differences in these timelines for each respondent in each city, then averaging across responses.15 Data from across
11. Conceptually, the prevalence of rezoning measures how compatible land-use regulation is with demand by counting the proportion of building done by survey respondents that requires amendment to existing zoning regulation. This measure does not capture zoning’s ability to prevent externalities; it indicates the amount of land with zoning regulation that developers and city representatives have agreed to change. 12. To compute the rezoning index, survey responses were coded as follows: never or indicated that respondent does not rezone land is taken as 0; rarely (about 25% of projects) is taken as 25%; sometimes (about half of projects) as 50%; frequently (about 75% of projects) as 75%; and always as 100%.13. When interpreting these results, it is important to remember the number of respondents these data are drawn from, and that this subset of respondents in any given city may exclu-sively rezone property.14. The national cross-respondent average of the rezoning index is 55% when the GGH is included.15. Differences between timelines with and without rezoning are calculated for every survey respondent in each city, separately for single-family and multiple-dwelling developments. Data from surveys without a response for either rezoning or non-rezoning timelines for a particular dwelling type and city are dropped. This statistic is only reported in cities where at least three respondents describe timelines with and without rezoning for either dwelling type.

Green, Filipowicz, and Herzog • New Homes and Red Tape in Ontario • 15
fraserinstitute.org
0 10 20 30 40 50 60 70 80 90 100
Niagara Falls***
Thorold***
Port Hope***
Pickering
Clarington
Toronto
Barrie*
Markham
Vaughan
East Gwillimbury
Aurora
Mississauga
Brampton
Whitby
Ajax
Richmond Hill
Caledon
Oshawa
Halton Hills
Whitchurch–Stou�ville
Newmarket
Mono**
King Township
Brock Township***
Oakville
Milton
Uxbridge
Burlington
Hamilton
Georgina
Bradford West Gwilimbury
Scugog Township
Figure 8: The Rezoning Index (2016) for Ontario’s Greater Golden Horseshoe—percentage of residential development requiring rezoning
Note: *** = 3 responses; ** = 4 responses; * = 5 responses.
Sources: Fraser Institute Survey of Land-Use Regulation, 2014, 2016; authors’ calculations.
40%
46%
50%
51%
55%
57%
57%
59%
60%
60%
60%
61%
64%
64%
62%
66%
67%
100%
71%
69%
70%
68%
44%
44%
53%
54%
57%
61%
62%
64%
95%
96%
Cross-respondent average for the GGH—62%

16 • New Homes and Red Tape in Ontario • Green, Filipowicz, and Herzog
fraserinstitute.org
Canada suggest that, for the average developer outside of the GGH, rezoning adds 4.0 months to a typical project’s approval timeline.16 In the GGH, this average rises to 4.3 months, increasing the incentive to avoid rezoning.
Figure 9 presents the estimated effect of each city’s rezoning process on the time needed to approve standard residential developments. In the neighbouring cities of Hamilton and Burlington, rezoning is reported to add over 8 months to the approval process. This effect is arguably more important in Toronto, how-ever, where over two thirds of development requires rezoning, a procedure that extends typical development projects by 7 months. Peel Region’s three municipal-ities (Mississauga, Brampton, and Caledon) share three of the top five rankings on this index, with rezoning adding between one and 4 months to the approval process.
3.5 Council and communityWe asked developers how local council and community groups affect single-family and multiple-dwelling development. Responses are measured on a 5-point scale: [1] encourages development; [2] not a deterrent to development; [3] mild deterrent to development; [4] Strong deterrent to development; and [5] would not pursue development due to this factor. The Council and Community Index (CCI) is the average response to these questions for each city (figure 10).
Council and community opposition does not seem to concentrate in any specific sub-region, in contrast to British Columbia’s Lower Mainland where it is reported to be strongest in the region’s North Shore (Green, Herzog, and Filipowicz, 2015b). The strongest opposition is reported in King Township, while the least is in Oshawa. In general, our survey suggests that council and community opposition presents a deterrent to development in only a handful of GGH cities. On the other hand, on average, no city shows a tendency to encourage development.
Some suggest that incumbent homeowners have an incentive to block new development, restricting the housing supply and increasing the market value of their property. Hilber and Robert-Nicoud (2013) formalize this argument, predicting that owners of developed land will favour stringent land-use regulation. Turning to data gathered from American metropolitan areas, the authors find a positive relation-ship between the share of developed land in 1992 and a measure of regulation in 2005; this evidence for their theory is supported by several statistical techniques.17 To the extent that this effect also occurs in Canada, it can be measured by the CCI.
16. The national average effect of rezoning on approval timelines is 4.11 months when the GGH is included.17. Hilber and Robert-Nicoud (2013) estimate the effect of historical share of developed land and homeownership rate on current measures of regulation by two stage least squares, using coastal access and the percentage of households with married couples and no children

Green, Filipowicz, and Herzog • New Homes and Red Tape in Ontario • 17
fraserinstitute.org
as instruments. In addition to a strong effect of developed land on regulation, Hilber and Robert-Nicoud (2013) find mixed evidence that past homeownership rates have led to more intense land-use regulation in the United States. The authors also control for household wages, population density, the Democratic Party’s vote share, and regional effects.
0 2 4 6 8 10 12
Hamilton**
Burlington***
Toronto
Oakville
Whitchurch–Stou�ville
Milton
Halton Hills
Whitby
East Gwillimbury
Ajax ***
Pickering
Newmarket*
Aurora
Vaughan
Markham
Mississauga
Richmond Hill
Brampton
Caledon
King Township*
Figure 9: The e�ect of the rezoning process on approval timelines in Ontario’s Greater Golden Horseshoe (2016)—city-level averages in months
Note: *** = 3 responses; ** = 4 responses; * = 5 responses.
Sources: Fraser Institute Survey of Land-Use Regulation, 2014, 2016; authors’ calculations.
0.7 Cross-respondent average for the GGH—4.3 months
1.2
2.1
3.1
3.4
3.5
4.0
4.4
4.6
4.7
5.0
5.7
5.8
6.0
6.0
6.0
6.5
7.1
8.0
11.3

18 • New Homes and Red Tape in Ontario • Green, Filipowicz, and Herzog
fraserinstitute.org
0 1 2 3 4 5
King Township
Toronto
Oakville
Caledon
Whitchurch–Stou�ville
Ajax
Aurora
Pickering
Hamilton
Bradford West Gwilimbury*
Richmond Hill
Newmarket
Mississauga
Uxbridge**
Whitby
Halton Hills
Milton
Markham
East Gwillimbury
Vaughan
Brampton
Burlington*
Oshawa**
Figure 10: The Council and Community Index (2016) for Ontario’s Greater Golden Horseshoe
Note: *** = 3 responses; ** = 4 responses; * = 5 responses.
Scale: [1] Encourages development; [2] Not a deterrent to development; [3] Mild deterrent to development;
[4] Strong deterrent to development; and, [5] Would not pursue development due to this factor.
Sources: Fraser Institute Survey of Land-Use Regulation 2014, 2016; authors’ calculations.
2.6
2.6
2.6
2.7
2.7
2.7
2.8
2.9
2.9
3.0
3.0
3.1
3.2
3.2
3.2
3.4
3.4
3.3
2.6
2.7
2.9
3.0
3.0
Cross-respondent average for the GGH—2.9

Green, Filipowicz, and Herzog • New Homes and Red Tape in Ontario • 19
fraserinstitute.org
Figure 11 shows that the CCI is positively correlated with dwelling values reported to the 2011 National Household Survey (with a correlation coefficient of 0.377).18 While this relationship is not necessarily causal—other factors such as neighbourhood attractiveness may be driving both the CCI and dwelling values—it is difficult to rule out the hypothesis that homeowners may deter residential development to increase their property values.
18. The OLS regression line shown has a slope indicating a $133,510 increase in dwelling values ratings for a one-point increase in the CCI. Assuming homoscedasticity—which is not rejected by a Breusch-Pagan (1979) test (P-value = 0.64)—the 95% confidence interval (CI) for this slope runs from −$15,532 to $282,553.
2.500 2.625 2.750 2.875 3.000 3.125 3.250 3.375 3.500200,000
250,000
300,000
350,000
400,000
450,000
500,000
550,000
600,000
650,000
Figure 11: Council and Community Index (2016) and median 2011 dwelling values ($) in Ontario’s Greater Golden Horseshoe
Med
ian dw
ellin
g value ($), 201
1
Notes 1. The correlation coe�cient between the CCI and city-level median dwelling values is 0.377 and the
trend line is fit by ordinary least squares. 2. The vertical and horizontal dotted lines indicate the mean
values of each axis.
Sources: Statistics Canada 2013a; Fraser Institute Survey of Land-Use Regulation, 2014. 2016; authors' calculations.
Oakville
Richmond Hill
Markham
Aurora
Caledon
Council and Community Index
King Township
Vaughan
Toronto
WhitbyAjax
Hamilton
Oshawa
Brampton
Milton
Whitchurch-Stou�ville
Bradford West Gwillimbury Pickering
East Gwillimbury
Burlington NewmarketMississauga
Halton Hills
Uxbridge

20 • New Homes and Red Tape in Ontario • Green, Filipowicz, and Herzog
fraserinstitute.org
Within cities, the effect of opposition captured by the CCI tends to be stronger against multiple-dwelling development. This tendency is presented in the 2015 edition of this report (Green, Herzog, and Filipowicz, 2015b).
3.6 Predictability of possible land usesThe effects of uncertainty, as measured by the TUI and CCI, tend to slow the supply of new housing in highly desirable neighbourhoods (Green, Filipowicz, Lafleur, and Herzog, 2016). In addition to these indices’ measures of uncertainty, we introduced a question asking 2016 respondents how uncertainty in the end uses of land allowed by the regulator, prior to applying for rezoning or building permits, affects development. For example, having a better idea of the possibility to build a residential community in a municipality may influence the likelihood of its construction. This question’s results are not included in the composite index.
As in the CCI and TUI, responses to this question are measured on a 5-point scale: [1] encourages development; [2] not a deterrent to development; [3] mild deterrent to development; [4] strong deterrent to development; and [5] would not pursue development due to this factor. The Land-Use Possibilities Index (LPI) is the average response to these questions for each city (figure 12).
The strongest deterrent to development due to less predictable land-use pos-sibilities is reported in Whitchurch-Stouffville, while this effect is least present in neighbouring Vaughan and Markham. The LPI detects a mild deterrent to develop-ment in most cities in the Greater Golden Horseshoe.

Green, Filipowicz, and Herzog • New Homes and Red Tape in Ontario • 21
fraserinstitute.org
0 1 2 3 4 5
Whitchurch–Stou�ville**
Pickering***
Bradford West Gwilimbury***
Caledon
Aurora
Toronto
Whitby**
Oakville
Mississauga*
King Township*
Hamilton***
East Gwillimbury**
Brampton
Richmond Hill
Halton Hills*
Milton**
Markham
Vaughan
Figure 12: The Land-Use Possibilities Index (2016) for Ontario's Greater Golden Horseshoe
Note: *** = 3 responses; ** = 4 responses; * = 5 responses.
Sources: Fraser Institute Survey of Land-Use Regulation, 2014, 2016; authors’ calculations.
2.4
2.7
2.8
2.8
2.8
2.9
3.0
3.0
3.0
3.0
3.0
3.0
3.1
3.1
3.2
3.3
3.3
3.5

22 • New Homes and Red Tape in Ontario • Green, Filipowicz, and Herzog
fraserinstitute.org
4 An Index of Residential Land-Use Regulation
In presenting results of the Survey of Residential Land-Use Regulation, we have described many important pathways through which regulation affects the hous-ing market in the Great Golden Horseshoe. It is useful to have a single measure of land-use regulation, summarizing all of these dimensions. In this section we construct and present an Index of Residential Land-Use Regulation for the GGH as a summary statistic of regulation. We use a common standardization technique to produce our index, which ranks cities by their relative performance on each dimension of regulation. Appendix 1 describes this process in detail.
We compute the index of regulation for the 23 GGH cities with at least three survey responses behind each of its five components.19 Thus, our ranking of cit-ies is dependent on the availability of high-quality data for each city. Some cities come in below our quality standard for only one of the index’s components, but are nonetheless omitted.
4.1 ResultsCondensing our survey-based measures of regulation into a single index has the advantage of creating a data-driven method to rank cities from least to most regu-lated. The Index of Residential Land-Use Regulation is negative in cities that are less regulated than average and positive in the GGH’s most regulated cities. It is presented alongside its component measures of regulation in table 2.
Of the GGH cities ranked, Burlington tops the Index of Residential Land-Use Regulation. This is driven by good ratings on timeline length, regulatory costs, and rezoning, and despite a moderately negative impact from timeline uncertainty and council and community. Oakville—Burlington’s neighbour—stands in contrast to Burlington’s relatively efficient and low-cost regulations, ranking worse on all indicators. King Township ranked the lowest, as it scored poorly on all measures except for the prevalence of rezoning.
Toronto’s shorter-than-average timelines are offset by its relatively high timeline uncertainty, and the impact of opposition. While their relative performance on individ-ual indicators varies, Toronto’s aggregate ranking is below all of its neighbouring muni-cipalites, which include Pickering, Markham, Vaughan, Brampton, and Mississauga.
19. These exclude the Land Use Possibilities Index as it was only introduced in 2016.

Green, Filipowicz, and Herzog • New Homes and Red Tape in Ontario • 23
fraserinstitute.org
Table 2: Index of Residential Land-Use RegulationApproval Timelines
Council and Community
Cost and Fees
Rezoning Prevalence
Timeline Uncertainty
Aggregate Index
1. Burlington 14.4 2.6 $32,500.00 50% 2.8 −2.71
2. Hamilton 17.5 3.0 $20,961.54 46% 3.3 −1.25
3. Milton 17.2 2.7 $48,823.53 53% 2.8 −1.03
4. Brampton 17.0 2.6 $49,017.86 64% 2.7 −0.90
5. Uxbridge 20.3 2.9 $39,642.86 51% 2.6 −0.87
6. Whitby 16.7 2.8 $44,047.62 62% 2.9 −0.68
7. East Gwillimbury 19.3 2.7 $47,187.50 64% 2.7 −0.30
8. Markham 18.4 2.7 $46,532.26 67% 2.8 −0.27
9. Vaughan 18.7 2.6 $54,609.38 66% 2.6 −0.27
10. Newmarket 18.5 2.9 $47,352.94 57% 2.8 −0.23
11. Halton Hills 17.6 2.7 $51,470.59 60% 3.0 −0.08
12. Oshawa 19.0 2.6 $50,357.14 60% 3.0 −0.05
13. Bradford-West Gwilimbury 20.1 3.0 $44,375.00 44% 3.1 0.03
14. Mississauga 17.9 2.9 $53,600.00 64% 2.8 0.13
15. Pickering 18.6 3.0 $40,500.00 71% 2.8 0.24
16. Whitchurch–Stouffville 18.8 3.2 $45,595.24 59% 3.0 0.45
17. Caledon 18.2 3.2 $46,190.48 60% 3.0 0.54
18. Richmond Hill 18.4 3.0 $58,166.67 61% 3.0 0.72
19. Aurora 19.8 3.1 $50,312.50 64% 3.0 1.11
20. Toronto 17.7 3.4 $46,569.77 69% 3.2 1.24
21. Oakville 17.8 3.3 $60,543.48 54% 3.3 1.25
22. Ajax 19.7 3.2 $54,318.18 61% 3.1 1.38
23. King Township 19.9 3.4 $55,000.00 57% 3.1 1.55
Cross-city average 18.5 2.9 $47,290 62% 3.0
Cross-respondent average 18.2 2.9 $48,034 62% 2.9
Note: The Index of Residential Land-Use Regulation is the standardized sum of its components, rescaled to have a standard deviation of one. It can be read as a Z-score.Sources: Fraser Institute Survey of Land-Use Regulation, 2014, 2016; authors’ calculations.

24 • New Homes and Red Tape in Ontario • Green, Filipowicz, and Herzog
fraserinstitute.org
5 Professionals’ Concerns and Policy Recommendations
The survey produced comments from twelve respondents in the Great Golden Horseshoe. The issues raised include the difficulties faced while navigating the application process and the stringency of regulation from multiple levels of gov-ernment. These comments identify specific concerns surrounding land-use regu-lation in the GGH.
The most frequent theme to arise in survey respondents’ comments is the regulatory stringency surrounding the development application process. Land-use regulations and intensification targets originating at the municipal and provincial levels are described as costly, preventing broader choice to consumers, and forcing smaller builders out of the marketplace.
Respondents argue that development procedures are not properly streamlined, reporting the need for numerous reviews and permissions from various parties, including conservation authorities at the local and provincial level. These “soft” requirements have multiplied in recent years, and can, in certain cases, represent up to half of the cost of development, excluding interest payments. Some claim that the presence of upper-level municipalities (regional municipalities or coun-ties) adds to this difficulty.
Ontario’s Greenbelt—7,200 km² of protected rural lands surrounding the Greater Toronto Area—is mentioned by respondents as a source of concern for the future affordability of housing. However, Burlington, a city partially covered by the Greenbelt, is mentioned for its ability to accommodate infill development compensating for its limited ability to grow outwards.
Additional comments point out the propensity for council, planning staff, and community groups to be at odds, and that regulation’s role in the decision to pur-sue residential development is generally overshadowed by market forces.

Green, Filipowicz, and Herzog • New Homes and Red Tape in Ontario • 25
fraserinstitute.org
6 Conclusion
Our data show strong variability in how homebuilders and developers experi-ence regulation across cities in Ontario’s Greater Golden Horseshoe. We find that reported approval timelines, and how they are affected by the rezoning process, vary significantly across cities. Equally strong variation is reported for regulatory costs and fees associated with the development process: large differences between neighbouring municipalities like Oakville and Burlington occur. Council and com-munity opposition to residential development is perceived as strongest in cities where dwelling values are highest, raising questions about the causes and conse-quences of local resistance to new housing.
Further work will analyse the results of the Survey of Residential Land-Use Regulation in major cities across Canada. The information produced will enable the systematic comparison of land-use regulation across municipalities, and can be used to understand regulation’s consequences for housing markets and regional economies.20 It can play a role in identifying situations where regulation con-stitutes a burden on the housing market, and those where regulations are cost-effective and efficient. Continued measurement will help us understand the role of public policy in Canada’s urban landscape.
20. Data from last year’s three publications in the New Homes and Red Tape series (Green, Herzog, and Filipowicz, 2015a, 2015b, 2015c) was at the heart of The Impact of Land-Use Regulation on Housing Supply in Canada (Green, Filipowicz, Lafleur, and Herzog, 2016), which compared regulation data with dwelling stock growth between 2006 and 2011. <check]

26 • New Homes and Red Tape in Ontario • Green, Filipowicz, and Herzog
fraserinstitute.org
Appendix 1. Constructing the Index
The first step in constructing the Index of Residential Land-Use Regulation is to carefully select its components. If any two components of the index are perfectly correlated, they may measure the same effect: adding them both would essentially be double counting. Table A.1 presents correlations between the five main, and single omitted,17 measures of regulation discussed in section 3.
The measures of regulation we derived from our survey are generally positively related across the cities for which we compute an index of regulation. As noted at the end of section 3.6 (p. 20), responses to a question about planning objectives are highly correlated with the council and community index. We do not to use our measure of the effect of planning objectives when constructing an aggregate index. The rezoning index appears to be unique, positively correlated with our measures of approval timelines and regulatory costs while exhibiting a negative relationship with timeline uncertainty. While approval timelines and council and community opposition are both correlated with regulatory costs, the two meas-ures lack a strong linear relationship with each other.
We use the standardized sum18 of the Average Approval Timelines, Cost and Fees, Rezoning, Council and Community, and Timeline Uncertainty Indices as our Index of Residential Land-Use Regulation. For each city, this index captures the frequency and severity of deviations from average levels of each of its compon-ents in the GGH. This index is centered around zero, positive for cities that score worse than average on many components of regulation, and negative for cities that score better than average.
17. See the conclusion of section 3.4 and the discussion below of the omitted measure of regulation.18. We standardize each component of our index by subtracting its mean (calculated using cities included in the overall index) and dividing by its standard deviation (calculated using the same cities). Each city is assigned an index value by summing across the standardized components.

Green, Filipowicz, and Herzog • New Homes and Red Tape in Ontario • 27
fraserinstitute.org
Table A.1: Correlations between measures of regulation for Ontario’s Greater Golden Horseshoe (GGH)
Approval Timelines
Cost and Fees
Council and Community
Timeline Uncertainty
Planning Objectives
Rezoning Index
Approval Timelines 1
Costs and Fees 0.33 1
Council and Community 0.04 0.23 1
Timeline Uncertainty 0.06 −0.08 0.56 1
Planning Objectives 0.04 0.23 1 0.56 1
Rezoning Index 0.20 0.14 0 −0.23 0 1
Note: This table presents pearson correlation coefficients computed across cities of the GGH.
Sources: Fraser Institute Survey of Land-Use Regulation; authors’ calculations.

28 • New Homes and Red Tape in Ontario • Green, Filipowicz, and Herzog
fraserinstitute.org
Appendix 2. Approval Timelines by Rezoning and Housing Type
0 5 10 15 20 25 30
Ajax***
Newmarket*
Halton Hills
Oakville
Milton
Toronto
King Township*
Mississauga
Richmond Hill
Whitchurch–Stou�ville
East Gwillimbury
Hamilton**
Vaughan
Aurora
Pickering
Markham
Brampton
Caledon
Whitby
Burlington***
Figure A2.1: Average approval timelines (months) for development in Ontario’s Greater Golden Horseshoe requiring rezoning, 2016
Note: *** = 3 responses; ** = 4 responses; * = 5 responses.
Sources: Fraser Institute Survey of Land-Use Regulation, 2014, 2016; authors’ calculations.
16.5
17.8
19.9
20.5
20.9
21.0
21.1
21.9
21.9
22.0
22.4
23.2
23.4
23.8
26.3
17.6
20.5
21.2
22.6
22.8

Green, Filipowicz, and Herzog • New Homes and Red Tape in Ontario • 29
fraserinstitute.org
0 5 10 15 20 25 30
King Township*
Ajax***
Newmarket*
Richmond Hill
Mississauga
Brampton
Halton Hills
Vaughan
Markham
Milton
Oakville
Caledon
Aurora
Whitchurch–Stou�ville
Pickering
Toronto
East Gwillimbury
Whitby
Hamilton**
Burlington***
Figure A2.2: Average approval timelines (months) for development in Ontario’s Greater Golden Horseshoe not requiring rezoning, 2016
Note: *** = 3 responses; ** = 4 responses; * = 5 responses.
Sources: Fraser Institute Survey of Land-Use Regulation, 2014, 2016; authors’ calculations.
8.5
11.9
15.6
15.6
15.9
16.5
16.6
16.8
17.0
17.0
17.4
18.8
19.2
21.3
21.7
9.8
15.8
16.7
17.8
18.5

30 • New Homes and Red Tape in Ontario • Green, Filipowicz, and Herzog
fraserinstitute.org
0 5 10 15 20 25 30
Georgina*
Clarington*
King Township
Ajax
Uxbridge
Bradford West Gwilimbury
Oshawa
Aurora
Milton
Halton Hills
East Gwillimbury
Markham
Newmarket
Toronto
Vaughan
Richmond Hill
Pickering
Mississauga
Oakville
Whitchurch–Stou�ville
Hamilton
Scugog Township***
Brampton
Whitby
Caledon
Burlington
Barrie***
Figure A2.3: Average approval timelines (months) for multiple-dwelling development in Ontario’s Greater Golden Horseshoe, 2016
Note: *** = 3 responses; ** = 4 responses; * = 5 responses.
Sources: Fraser Institute Survey of Land-Use Regulation, 2014, 2016; authors’ calculations.
15.1
15.9
16.7
17.7
18.1
18.6
18.7
18.8
18.9
19.0
19.1
19.5
19.5
19.7
19.8
20.4
21.0
21.3
22.7
24.3
26.1
20.0
15.8
17.8
18.8
19.4
19.4
Green, Filipowicz, and Herzog • New Homes and Red Tape in Ontario • 31
fraserinstitute.org
0 5 10 15 20 25 30
Georgina
Clarington
Caledon
Bradford West Gwilimbury
Uxbridge
Aurora
Port Hope***
East Gwillimbury
Whitchurch–Stou�ville
Vaughan
Pickering
Ajax
Oshawa
Richmond Hill
King Township
Newmarket
Markham
Hamilton
Mississauga
Oakville
Whitby
Brampton
Toronto
Halton Hills
Scugog Township***
Milton
Barrie***
Burlington
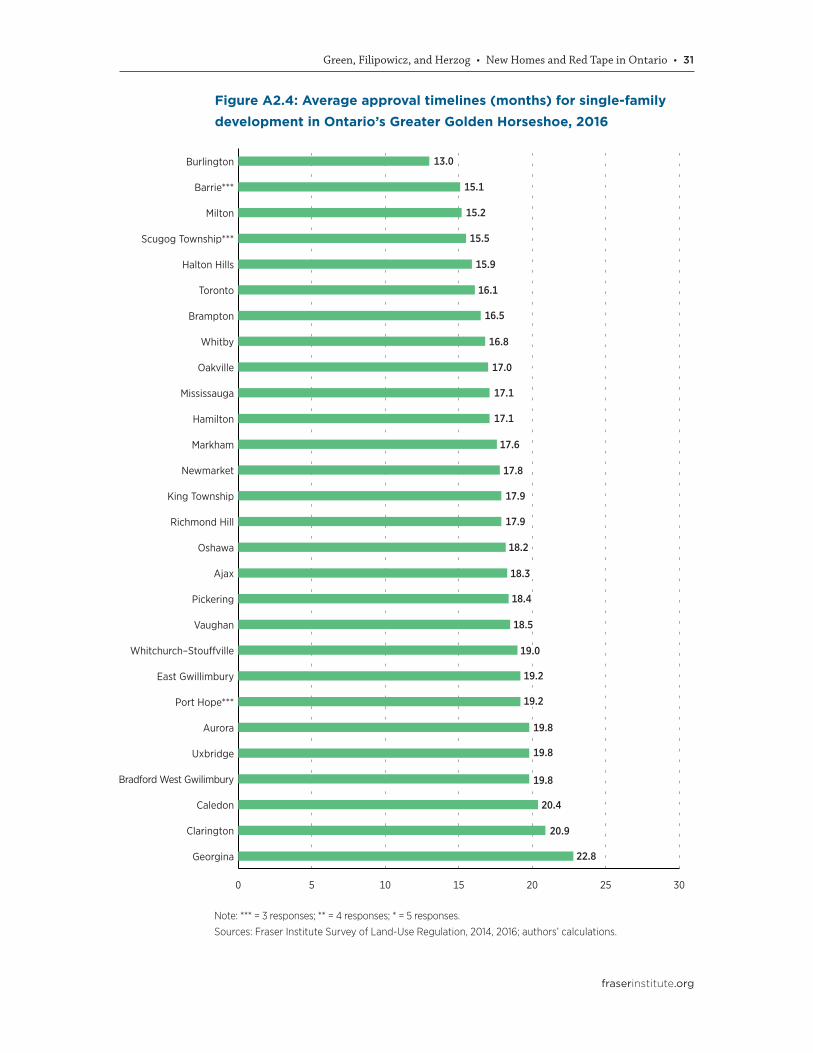
Figure A2.4: Average approval timelines (months) for single-family development in Ontario’s Greater Golden Horseshoe, 2016
Note: *** = 3 responses; ** = 4 responses; * = 5 responses.
Sources: Fraser Institute Survey of Land-Use Regulation, 2014, 2016; authors’ calculations.
13.0
15.2
15.5
15.9
16.5
16.8
17.0
17.1
17.6
17.8
17.9
17.9
18.4
18.5
19.0
19.2
19.2
19.8
19.8
19.8
15.1
16.1
17.1
18.2
18.3
20.4
20.9
22.8

32 • New Homes and Red Tape in Ontario • Green, Filipowicz, and Herzog
fraserinstitute.org
Appendix 3. Rezoning by Housing Type
0 10 20 30 40 50 60 70 80 90 100
Thorold***
Toronto
Clarington
Markham
Vaughan
Pickering
Ajax
Mississauga
Richmond Hill
Brampton
Aurora
Whitby
Barrie**
Halton Hills
Oshawa
East Gwillimbury
Oakville
Whitchurch–Stou�ville
Newmarket
Mono***
Hamilton
Milton
Burlington
King Township
Caledon
Uxbridge
Scugog Township**
Georgina
Bradford West Gwilimbury
Figure A3.1: The Rezoning Index (%) for multiple-dwelling development in Ontario’s Greater Golden Horseshoe, 2016
Note: *** = 3 responses; ** = 4 responses; * = 5 responses.
Sources: Fraser Institute Survey of Land-Use Regulation, 2014, 2016; authors’ calculations.
32%
50%
53%
53%
55%
56%
58%
57%
59%
59%
61%
61%
64%
65%
67%
68%
70%
70%
70%
71%
73%
78%
38%
55%
58%
62%
64%
63%
100%

Green, Filipowicz, and Herzog • New Homes and Red Tape in Ontario • 33
fraserinstitute.org
0 10 20 30 40 50 60 70 80 90 100
Thorold***
Port Hope***
Barrie***
Pickering
Clarington
East Gwillimbury
Caledon
Markham
Aurora
Vaughan
Brampton
Whitby
Mississauga
Whitchurch–Stou�ville
Toronto
Oshawa
Brock Township***
King Township
Halton Hills
Newmarket
Mono**
Richmond Hill
Ajax
Bradford West Gwilimbury
Milton
Uxbridge
Oakville
Georgina
Burlington
Hamilton
Scugog Township
Figure A3.2: The Rezoning Index (%) for single-family developmentin Ontario’s Greater Golden Horseshoe, 2016
Note: *** = 3 responses; ** = 4 responses; * = 5 responses.
Sources: Fraser Institute Survey of Land-Use Regulation 2014, 2016; authors’ calculations.
33%
46%
49%
48%
50%
51%
54%
55%
56%
58%
58%
58%
58%
59%
61%
62%
62%
64%
64%
92%
68%
73%
66%
66%
39%
51%
57%
59%
59%
75%
92%

34 • New Homes and Red Tape in Ontario • Green, Filipowicz, and Herzog
fraserinstitute.org
Appendix 4. Survey Questions
Note: questions 6, 7, 8, 9, 10, and 11 are replicated for MULTIPLE DWELLING developments.
1 Please go through the following regions and select those with cities that you are FAMILIAR with (in terms of residential development). Please select AS MANY AS POSSIBLE.Respondents were presented with 19 regions to choose from.
2 What type of work does your organization do? (Check all that apply)The options include land development, new home building, legal services, engineering,
architecture and design, and other.
3 What TYPES of development projects has your organization worked on in the past 10 years? (Check all that apply)The options include “Single-Family” and “Multiple Dwelling”, both of which were described in
more detail.
4 Please go through the following cities and select those that you are FAMILIAR with. Please select AS MANY AS POSSIBLE. Respondents were presented with all cities available within the region(s) selected.
5 Does your organization rezone property?Yes/no answer.
6 Approximately how often do your SINGLE-FAMILY developments REQUIRE REZONING in each city?Respondents select from a 5-bin range from “Never” to “Always”.
7 Approximately how much TIME do you expect to spend getting PROJECT APPROVAL for standard SINGLE-FAMILY projects that REQUIRE REZONING in each city? From the filing date of the first stage of the approval process to the day you would be allowed to begin construction.Respondents select from a 7-bin range from “2 months or less” to “24 months or more”, with
the option of manually inputting a longer timeline.
8 Approximately how much TIME do you expect to spend getting PROJECT APPROVAL for standard SINGLE-FAMILY projects that DO NOT REQUIRE

Green, Filipowicz, and Herzog • New Homes and Red Tape in Ontario • 35
fraserinstitute.org
REZONING in each city? From the filing date of the first stage of the approval process to the day you would be allowed to begin construction.Respondents select from a 7-bin range from “2 months or less” to “24 months or more”, with
the option of manually inputting a longer timeline.
9 At the outset of your standard SINGLE-FAMILY projects, how does the amount of UNCERTAINTY in the TIME needed for the project APPROVAL PROCESS affect development in each city?Respondents select from a 5-bin range from “Encourages development” to “Would not pursue
development due to this factor”.
10 For your standard SINGLE-FAMILY projects, which of the following BEST APPROXIMATES the COST (per dwelling unit) of the PROJECT APPROVAL and REGULATORY COMPLIANCE process in each city? Please give a rough estimate that includes All ADMINISTRATION, PROCESSING, and DIRECT COMPLIANCE COSTS (permitting and review fees, community amenity contributions, development cost levies, inspection costs, relevant legal fees, etc.). There is no need to refer to a pro forma or other detailed records; a thoughtful estimate is sufficient.Respondents select from a 7-bin range from “Less than $1,000 per unit” to “More than
$75,000 per unit”, with the option of manually inputting a higher per-unit cost.
11 How do local COUNCIL and COMMUNITY groups affect your SINGLE-FAMILY development in each city?Respondents select from a 5-bin range from “Encourages development” to “Would not pursue
development due to this factor”.
12 Before applying for rezoning or building permits, how does uncertainty in the end uses of land allowed by the regulator affect development in each city?Respondents select from a 5-bin range from “Encourages development” to “Would not pursue
development due to this factor”.
13 Are there any other comments or relevant information that you wish to add?An open comment box was provided to respondents.

36 • New Homes and Red Tape in Ontario • Green, Filipowicz, and Herzog
fraserinstitute.org
References
Building Industry and Land Development Association [BILD] (2015). Who Is BILD? <http://www.bildgta.ca/about_bild.asp>, as of April 24, 2015.
Breusch, T.S., and A.R. Pagan (1979). A Simple Test for Heteroscedasticity and Random Coefficient Variation. Econometrica 47, 5: 1287–1294.
Calfee, Corie, Paavo Monkkonen, John M. Quigley, Stephen Raphael, Larry A. Rosenthal, and Joseph Wright (2007). Measuring Land-Use Regulation: Report to the MacArthur Foundation. <http://urbanpolicy.berkeley.edu/pdf/MacArthur_Report_2007.pdf>.
Canadian Home Builders’ Association [CHBA] (2011). About Our Members. <http://www.chba.ca/members.aspx>, as of April 24, 2015.
Canada Mortgage and Housing Corporation [CMHC] (2014). Canadian Housing Outlook: Canada Highlights Edition. <http://www.cmhc-schl.gc.ca/odpub/
esub/64591/64591_2014_Q01.pdf?lang=en>.
Green, Kenneth P., Josef Filipowicz, Steve Lafleur, and Ian Herzog (2016). The Impact of Land-Use Regulation on Housing Supply in Canada. Fraser Institute. <http://www.fraserinstitute.org>.
Green, Kenneth P., Ian Herzog, and Josef Filipowicz (2015a). New Homes and Red Tape: Residential Land-Use Regulation in Alberta’s Calgary-Edmonton Corridor. Fraser Institute. <http://www.fraserinstitute.org>.
Green, Kenneth P., Ian Herzog, and Josef Filipowicz (2015b). New Homes and Red Tape: Residential Land-Use Regulation in BC’s Lower Mainland. Fraser Institute. <http://www.fraserinstitute.org>.
Green, Kenneth P., Ian Herzog, and Josef Filipowicz (2015c). New Homes and Red Tape: Residential Land-Use Regulation in Ontario’s Greater Golden Horseshoe. Fraser Institute. <http://www.fraserinstitute.org>.
Gyourko, Joseph, Albert Saiz, and Anita Summers (2008). A New Measure of the Local Regulatory Environment for Housing Markets: The Wharton Residential Land Use Regulatory Index. Urban Studies 45, 3: 693–729.

Green, Filipowicz, and Herzog • New Homes and Red Tape in Ontario • 37
fraserinstitute.org
Hilber, Christian A.L., and Frédéric Robert-Nicoud (2013). On the Origins of Land Use Regulations: Theory and Evidence from US Metro Areas. Journal of Urban Economics 75: 29–43.
Mayer, Christopher J., and C. Tsuriel Somerville (2000). Land Use Regulation and New Construction. Regional Science and Urban Economics 30, 6: 639–662.
Multiple Listing Service [MLS] (2016). MLS Home Price Index. MLS. <http://
homepriceindex.ca/hpi_tool_en.html>, as of August 3, 2016.
Ontario Association of Architects [OAA] (2013). A Review of the Site Plan Approval Process in Ontario. Bousfields Inc. and Altus Group.
Ontario, Ministry of Infrastructure (2006). Growth Plan for the Greater Golden Horseshoe. <https://www.placestogrow.ca/content/ggh/plan-cons-english-all-web.pdf>, as of August 13, 2015.
Ontario, Ministry of Municipal Affairs and Housing (2010). 3. Zoning By-laws. <http://www.mah.gov.on.ca/Page1758.aspx>, as of March 19, 2015.
Quigley, John M., and Steven Raphael (2005). Regulation and the High Cost of Housing in California. American Economic Review 95, 2: 323–328.
Quigley, John M., Steven Raphael, and Larry A. Rosenthal (2008). Measuring Land-Use Regulation: An Examination of the San Francisco Bay Area, 1992-2007. BPHUP working paper # W08-004. <http://urbanpolicy.berkeley.edu/pdf/QRR_Lincoln_060208.pdf>.
Real Property Association of Canada [REALpac] (2013). 2012 Canada-wide Development Process Survey Report. REALpac.
Saiz, Albert (2010). The Geographic Determinants of Housing Supply. Quarterly Journal of Economics 125, 3: 1253–1296.
Saks, Raven E. (2008). Job Creation and Housing Construction: Constraints on Metropolitan Area Employment Growth. Journal of Urban Economics 64, 1: 178–195.
Statistics Canada (2011) GeoSuite, 2011 Census. Statistics Canada Catalogue no. 92-150-X.
Statistics Canada (2006) GeoSuite, 2006 Census. Statistics Canada Catalogue no. 92-150-X.

38 • New Homes and Red Tape in Ontario • Green, Filipowicz, and Herzog
fraserinstitute.org
Statistics Canada (2012). Census Profile: Census Subdivisions. 2011 Census. Catalogue no. 98-316-XWE.
Statistics Canada (2013a). National Household Survey (NHS) Profile: Census Subdivisions. 2011 National Household Survey. Catalogue no. 99-004-XWE.
Statistics Canada (2013b). Commuting Flow - Census Subdivisions: Sex (3) for the Employed Labour Force Aged 15 Years and Over Having a Usual Place of Work, for Census Subdivisions, Flows Greater than or Equal to 20. 2011 National Household Survey. Catalogue no. 99-012-X2011032.
Statistics Canada (2016). Table 326-0020. Consumer Price Index (CPI), 2016 basket, monthly. <http://www5.statcan.gc.ca/cansim/a05?lang=eng&id=3260020>, as of August 3, 2016.

Green, Filipowicz, and Herzog • New Homes and Red Tape in Ontario • 39
fraserinstitute.org
About the authors
Kenneth P. GreenKenneth P. Green is Senior Director of Natural Resources at the Fraser Institute. He received his doctorate in Environmental Science and Engineering from the University of California, Los Angeles (UCLA), an M.S. in Molecular Genetics from San Diego State University, and a B.S. Biology from UCLA. Mr. Green has studied public policy involving risk, regulation, and the environment for more than 16 years at public-policy research institu-tions across North America. He has an extensive publication list of policy studies, magazine articles, opinion columns, book and encyclopedia chapters, and two supplementary text books on climate change and energy policy. Mr Green’s writ-ing has appeared in major newspapers across the United States and Canada, and he is a regular presence on both Canadian and American radio and television.
Josef FilipowiczJosef Filipowicz is a Policy Analyst in the Fraser Institute's Centre for Risk and Regulation. He holds an M.A. in Political Science from Wilfrid Laurier University, and a Bachelor of Urban and Regional Planning from Ryerson University. His work with the Fraser Institute includes the New Homes and Red Tape series focusing on the regulatory landscape sur-rounding home-building in Canada’s municipalities. He continues to work on municipal topics including housing, policing, and governance.
Ian HerzogIan Herzog is currently pursuing graduate studies at the University of Toronto. He holds an M.A. in Economics from the University of Toronto and a B.Sc. from the University of Guelph. Mr Herzog worked as an Economist in the Fraser Institute’s Center for Risk and Regulation from 2014 to 2016 and his publications while at the Institute include New Homes and Red Tape, The Impact of Land-Use Regulation on Housing Supply in Canada, and Compulsory Government Pensions vs. Private Savings: The Effect of Previous Expansion to the Canada Pension Plan. His research spans a wide range of public policy issues, particularly the economics of urban policy, energy, and the environment.

40 • New Homes and Red Tape in Ontario • Green, Filipowicz, and Herzog
fraserinstitute.org
Acknowledgments
The authors would like to acknowledge the helpful comments and insights of sev-eral anonymous reviewers. We also thank our former colleagues, Joel Wood and Frazier Fathers, who initiated this research, and provided valuable insight and expertise to this project.
As the researchers have worked independently, the views and conclusions expressed in this paper do not necessarily reflect those of the Board of Directors of the Fraser Institute, the staff, or supporters.

Green, Filipowicz, and Herzog • New Homes and Red Tape in Ontario • 41
fraserinstitute.org
About the Fraser Institute
Our mission is to improve the quality of life for Canadians, their families and fu-ture generations by studying, measuring and broadly communicating the effects of government policies, entrepreneurship and choice on their well-being.
Notre mission consiste à améliorer la qualité de vie des Canadiens et des géné-rations à venir en étudiant, en mesurant et en diffusant les effets des politiques gouvernementales, de l’entrepreneuriat et des choix sur leur bien-être.
Peer review —validating the accuracy of our researchThe Fraser Institute maintains a rigorous peer review process for its research. New research, major research projects, and substantively modified research conducted by the Fraser Institute are reviewed by experts with a recognized expertise in the topic area being addressed. Whenever possible, external review is a blind process. Updates to previously reviewed research or new editions of previously reviewed research are not reviewed unless the update includes substantive or material changes in the methodology.
The review process is overseen by the directors of the Institute’s research de-partments who are responsible for ensuring all research published by the Institute passes through the appropriate peer review. If a dispute about the recommenda-tions of the reviewers should arise during the Institute’s peer review process, the Institute has an Editorial Advisory Board, a panel of scholars from Canada, the United States, and Europe to whom it can turn for help in resolving the dispute.

42 • New Homes and Red Tape in Ontario • Green, Filipowicz, and Herzog
fraserinstitute.org
Publishing Information
DistributionThese publications are available from <http://www.fraserinstitute.org> in Portable Document Format (PDF) and can be read with Adobe Acrobat® or Adobe Reader®, versions 7 or later. Adobe Acrobat Reader® DC, the most recent version, is available free of charge from Adobe Systems Inc. at <http://get.adobe.com/reader/>. Readers having trouble viewing or printing our PDF files using applications from other manufacturers (e.g., Apple’s Preview) should use Reader® or Acrobat®.
Ordering publicationsTo order printed publications from the Fraser Institute, please contact us via e-mail: [email protected]; telephone: 604.688.0221, ext. 580 or, toll free, 1.800.665.3558, ext. 580; or fax: 604.688.8539.
MediaFor media enquiries, please contact our communications department via e-mail: [email protected]; telephone: 604.714.4582. In Toronto, contact our media specialist via telephone at 416.363.6575, ext. 238.
CopyrightCopyright © 2016 by the Fraser Institute. All rights reserved. No part of this pub-lication may be reproduced in any manner whatsoever without written permission except in the case of brief passages quoted in critical articles and reviews.
Date of issueOctober 2016
ISBN978-0-88975-419-5
CitationKenneth P. Green, Josef Filipowicz Ian Herzog, and (2016). New Homes and Red Tape in Ontario: Residential Land-Use Regulation in the Great Golden Horseshoe. Fraser Institute. <http://www.fraserinstitute.org>.

Green, Filipowicz, and Herzog • New Homes and Red Tape in Ontario • 43
fraserinstitute.org
Supporting the Fraser Institute
To learn how to support the Fraser Institute, please contact us via post: Development Department, Fraser Institute, Fourth Floor, 1770 Burrard Street, Vancouver, British Columbia, V6J 3G7, Canada; telephone: toll-free to 1.800.665.3558, ext. 548; e-mail: [email protected]; or visit our webpage: <http://www.
fraserinstitute.org/support-us/overview.aspx>.
Purpose, Funding, and Independence
The Fraser Institute provides a useful public service. We report objective informa-tion about the economic and social effects of current public policies, and we offer evidence-based research and education about policy options that can improve the quality of life.
The Institute is a non-profit organization. Our activities are funded by chari-table donations, unrestricted grants, ticket sales, and sponsorships from events, the licensing of products for public distribution, and the sale of publications.
All research is subject to rigorous review by external experts, and is conducted and published separately from the Institute’s Board of Directors and its donors.
The opinions expressed by authors are their own, and do not necessarily reflect those of the Institute, its Board of Directors, its donors and supporters, or its staff. This publication in no way implies that the Fraser Institute, its directors, or staff are in favour of, or oppose the passage of, any bill; or that they support or oppose any particular political party or candidate.
As a healthy part of public discussion among fellow citizens who desire to improve the lives of people through better public policy, the Institute welcomes evidence-focused scrutiny of the research we publish, including verification of data sources, replication of analytical methods, and intelligent debate about the practical effects of policy recommendations.

44 • New Homes and Red Tape in Ontario • Green, Filipowicz, and Herzog
fraserinstitute.org
Members
Past members
Editorial Advisory Board
* deceased; † Nobel Laureate
Prof. Terry L. Anderson
Prof. Robert Barro
Prof. Michael Bliss
Prof. Jean-Pierre Centi
Prof. John Chant
Prof. Bev Dahlby
Prof. Erwin Diewert
Prof. Stephen Easton
Prof. J.C. Herbert Emery
Prof. Jack L. Granatstein
Prof. Herbert G. Grubel
Prof. James Gwartney
Prof. Ronald W. Jones
Dr. Jerry Jordan
Prof. Ross McKitrick
Prof. Michael Parkin
Prof. Friedrich Schneider
Prof. Lawrence B. Smith
Dr. Vito Tanzi
Prof. Armen Alchian*
Prof. James M. Buchanan* †
Prof. Friedrich A. Hayek* †
Prof. H.G. Johnson*
Prof. F.G. Pennance*
Prof. George Stigler* †
Sir Alan Walters*
Prof. Edwin G. West*