new guidelines for the diagnosis of diabetes mellitus guidelines.pdf · new guidelines for the...
TRANSCRIPT

Joely Straseski, PhD, DABCC, FACB Assistant Professor and Medical Director
Endocrinology and Automated Core Laboratory University of Utah and ARUP Laboratories
New Guidelines for the Diagnosis of Diabetes Mellitus
Park City Pathology Workshop February 2013

Overview:
• Background and statistics
• Guidelines for diagnosis of DM
• Laboratory measurements
– Hemoglobin A1c
– Standardization and Controversy
• Guidelines for prediabetes
• Guidelines for gestational DM

DIABETES MELLITUS: BACKGROUND AND STATISTICS

• β-cell destruction – Immune-mediated (most) – Idiopathic (few)
• Acute presentation: polyuria, polydipsia, rapid weight loss
• Insulin dependent • “IDDM,” “juvenile”
Type 1 DM: 5-10% Type 2 DM: 90-95%
Etiologic Classification: Diabetes Mellitus
• Depressed insulin secretion and/or insulin resistance
• Minimal symptoms; highly correlated with obesity
• Not insulin dependent • “NIDDM,” “adult”

• 27% of diabetics are not diagnosed yet • 79 million people are prediabetic (25%)
http://www.cdc.gov/diabetes/pubs/pdf/ndfs_2011.pdf

CDC National diabetes fact sheet. Atlanta, GA: 2011

CDC National diabetes fact sheet. Atlanta, GA: 2011

Diabetes Diagnosis: Children • Type 2 DM increasing in younger populations • Linked to obesity • Projections (Diab Care 2012;35:2515)
– 2001 to 2050 – < 20 years of age – At current prevalence rates:
• T2DM increases 49% • T1DM increases 23%
– At increased prevalence rates (expected): • T2DM nearly quadruples • T1DM nearly triples
– Greatest increase in racial/ethnic groups

• Age-adjusted median prevalence of diagnosed diabetes increased from 4.5% to 8.2% – 1995: prevalence ≥ 6% in 3 areas* – 2010: prevalence ≥ 6% in all areas*
• Relative increase in prevalence ranged 9% - 227% – ≥ 50% increase in 42 states – ≥ 100% increase in 18 states
• Largest increases in Southern and Appalachian states
• In tandem with obesity
• Includes both T1 and T2 * All US states, DC, Puerto Rico

• Why increased incidence of DM? – Improved survival of DM patients
• Mortality in DM patients declined substantially 1997 – 2006 • Faster decline than adults without DM
– Improved diagnostics – Improved health, health care
• Why increases since 1995? – Demographic changes (increased elderly, minorities) – Increase in risk factors (obesity, sedentary lifestyle) – Changes in diagnostic criteria – Detecting previously undiagnosed DM

DIAGNOSIS OF DM: GUIDELINES

American Diabetes Association

ADA, AACE, EASD 2010
CDA, WHO, NACB 2011
Updated DM Diagnosis Guidelines:

What has changed?
• Frequency of blood sugar testing for multi-dose insulin/pump therapies – Previously: SMBG “three or more times daily” – Now: SMBG “at least prior to meals and snacks, occasionally
postprandially, at bedtime, prior to exercise, when they suspect low BG, after treating low BG…, and prior to critical tasks such as driving.”
– SMBG should be dictated by patient needs and treatment goals
• Assess CV risk factors in prediabetics
• Systolic blood pressure goal – Increased from 130 mm/Hg to 140 mm/Hg – Lower targets may be appropriate in some individuals

DIAGNOSIS OF DM: LABORATORY ASSAYS

Laboratory Assays Used in DM: • Glucose
– Random – Fasting – Oral glucose tolerance test
• Hemoglobin A1c – Estimated average glucose
• Others – Fructosamine, glycated albumin – C-peptide, insulin – Microalbumin

Glycation of Hemoglobin: Background
• Glycated hemoglobin A: “HbA1”
– HbA1a: fructose-1,6-diphosphate (HbA1a1) or glucose-6-phosphate (HbA1a2) at N-terminus of β chain
– HbA1b: pyruvate at N-terminus of β chain
– HbA1c: glucose at N-terminus of β chain (>80% of HbA1)

Clinical Utility of HbA1c:
• Red blood cell life-span is approximately 120 days
• Therefore, glycated hemoglobin reflects weighted average of plasma glucose concentration over the preceding 2-3 months
– What you ate that morning won’t affect this test
• HbA1c tells you how high blood glucose is, and how long it has been elevated
• It is the only marker that correlates well with long term complications

Diabetes Control & Complications Trial (DCCT):
• Type 1 diabetic patients, no and mild retinopathy • Two groups, 7 year avg study period, n = 1441 • HbA1c measured by HPLC
Study Group Mean Blood
Glucose (mg/dL) HbA1c (%)
Conventional ~ 240 ~ 9 Intensive
Treatment ~ 180 7.2 Non-
diabetics ~ 100 < 6.1 NEJM 1993;329:977

DCCT: Intensive Treatment Group
• 60% reduction in retinopathy, nephropathy, and neuropathy
• Threefold greater risk of hypoglycemia
• HbA1c linked to retinopathy, cardiovascular disease
• Increased costs of intensive control offset by decreased complications and more productive lives
• Unequivocally established value of HbA1c measurements
NEJM 1993;329:977

Intensive vs. Conventional Therapy:
Urine albumin
>300 mg/24hr
>40 mg/24hr
NEJM 1993;329:977
Solid bars = Intensive Hatched bars = Conventional

Retinopathy (sustained change)
NEJM 1993;329:977
Intensive vs. Conventional Therapy:

Retinopathy and HbA1c:
The International Expert Committee, Diabetes Care 2009;32:1327-34

United Kingdom Prospective Diabetes Study (UKPDS):
• Type 2 diabetic patients, followed 10 years, n = 3867
• HbA1c method calibrated to DCCT HPLC method
• Conventional group HbA1c = 7.9%; Intensive = 7.0%
• Link between HbA1c and risk reduction – For every 1% decrease in HbA1c:
• Microvascular disease 37%
• MI 14%
• Death 21%
Lancet 1998;352:837; BMJ 2000;321:405

Conclusions from DCCT & UKPDS:
• Small changes in HbA1c related to reduced risk of complications in T1 and T2 DM
• HbA1c measurements are useful
• Accurate, standardized HbA1c test methods are required

DIAGNOSIS OF DM: HBA1C STANDARDIZATION & CONTROVERSY

National Glycohemoglobin Standardization Program (NGSP): 1993
• Goal: certify results from individual methods are comparable to the HbA1c method used in DCCT/UKPDS
• Central reference lab uses DCCT/UKPDS HPLC method; 8 secondary reference lab (commercial) methods calibrated to central result; those methods used to assist manufacturers
• Result: more labs report HbA1c, better accuracy, reduced variability

IFCC Standardization Effort: 1995
• International Federation of Clinical Chemistry and Laboratory Medicine
• Goal: Develop true reference method for HbA1c – Rather than harmonizing to previous methods – Jeppsson et al., Clin Chem Lab Med 2002;40:78-89
• Separation with HPLC, quantitation with MS or CE
• Reference materials also produced

NGSP vs. IFCC:
• Complementary roles: – IFCC establishes traceable methods – NGSP establishes limits of acceptable method
performance
• Linear relationship between values – “Master equation” relates them
• NGSP = 0.09148(IFCC) + 2.152
– IFCC method 1.5-2% lower

NGSP vs. IFCC:
Diabetes Care 2012;35:2674

NGSP vs. IFCC:
Diabetes Care 2012;35:2674

Moving forward…
• Diabetes Care journal now requires both units: – % (NGSP) – mmol/mol (IFCC, SI)
• Rationale – Units are controversial – Compare past and future studies – Compare across countries – Global journal contributors

HbA1c Controversy: • Imperfect concordance between HbA1c
and FPG or 2hrPG: – “Glycation Gap”
– NHANES: HbA1c cutpoint of 6.5% identified 1/3 fewer cases of undiagnosed diabetes than FG cutpoint of 126 mg/dL
– IRAS: HbA1c detected fewer diabetics than OGTT, FPG, or these tests in combination (Lorenzo et al., Diab Care 2010;33:2104)
– Patients with elevated HbA1c and FPG were 32 times more likely to progress to diabetes than those with one test alone (Heianza et al., Lancet 2011;378:147)

• However… • Ease of use of HbA1c promotes widespread
application • May still increase number of diagnoses by sheer
numbers, despite lower sensitivity
HbA1c Controversy:

HbA1c: Why now?
• Standardization – NGSP standardization program (1993) – “Reference method” (HPLC used in DCCT) did
not use pure HbA1c for calibration
• IFCC-developed MS reference method – 1.5-2.0% lower than DCCT – IFCC calibrators recalculated to DCCT methods
to eliminate bias (master equation) – “DCCT-aligned” calibrators
Problem #1:
Resolution #1:
Been in use since early ‘90s for monitoring… but not considered robust enough for diagnosis.

• Inconsistent units – IFCC units are mmol/mol
• “mmol of per mole of Hb” – Current HbA1c reporting is % – Glucose reported mg/dL
• Linear relationship between HbA1c and
glucose methods established – Nathan et al., Diabetes Care 2008;31:1473-8 – Report both HbA1c (%) and eAG, which can be
related to daily glucose levels (mg/dL)
Problem #2:
Resolution #2:
HbA1c: Why now?

• Loose proficiency testing standards for HbA1c
• CAP tightened variance requirements – 2007: ± 15% of target value – 2011: ± 7% of target value
Problem #3:
Resolution #3:
HbA1c: Why now?

DIAGNOSIS OF DM: PREDIABETES

Intermediate Diagnosis: Prediabetes

Prediabetes: Outcomes
Diabetic
Prediabetic
Normal
Undiagnosed or
prediabetes
1/3
1/3
1/3

Perreault L et al., The Lancet 2012;379:2243
• Outcomes from Diabetes Prevention Program (DPP)
• 3 groups – Lifestyle intervention,
metformin, placebo • Diabetes risk was 56% lower
for those that returned to normal glucose regulation – Over 6 years – Lifestyle intervention OR
medication
• Increased risk for stroke (21%), other complications
– Lee et al., BMJ 2012;344:e3564
Prediabetes: Outcomes

Retinopathy and HbA1c:
The International Expert Committee, Diabetes Care 2009;32:1327-34

DIAGNOSIS OF DM: GESTATIONAL DIABETES MELLITUS

Gestational DM: 1-14%
Etiologic Classification: Diabetes Mellitus
• Diabetes diagnosed during pregnancy
• Immediately after pregnancy: 5-10% of women with GDM are diagnosed with T2DM
• GDM = 35-60% chance of DM in next 10-20 years
• New criteria will classify increased numbers of GDM

U.S. GDM Trends:
AJOG 2008;198:525.e1-5

Diabetes Care 2010;33:768–773
All diabetes
GDM
Type 1 diabetes
Type 2 diabetes
U.S. Diabetes Trends:

Diagnosis: Gestational DM
• Woman has risk factors for T2DM? – Test at first prenatal visit
• No risk factors? Screen at 24-28 weeks
• Previously: – Low risk groups were not
screened – Two tests required for
diagnosis

Diagnosis GDM: Foundations
• Hyperglycemia and Adverse Pregnancy Outcome (HAPO) study – NEJM 2008;358:1991 – 25,000 pregnant women, 3rd trimester – Established relationship between maternal glycemia and
adverse pregnancy outcomes • High birth weight • Cesarean section delivery • Neonatal hypoglycemia • Preeclampsia, preterm delivery, hyperbili
• International Association of Diabetes and Pregnancy Study Groups (IADPSG) put out criteria in 2010; ADA & NACB adopted 2011 – WHO disagrees; ACOG guidelines differ (Obs&Gyn 2011;118:751)

ADA OGTT Guidelines: Patient Status Glucose Load Time Points Cutoffs (mg/dL) Fasting 75 g Fasting
1 hour 2 hours
< 92 < 180 < 153
ACOG OGTT Guidelines: Patient Status Glucose Load Time Points Cutoffs (mg/dL) SCREEN: Fasting or Non-fasting
50 g 1 hour < 130
DIAGNOSIS: Fasting
100 g
Fasting 1 hour 2 hour 3 hour
< 95 < 180 < 155 < 140
Adapted from: D. Stickle, NACBlog, 8/30/2011
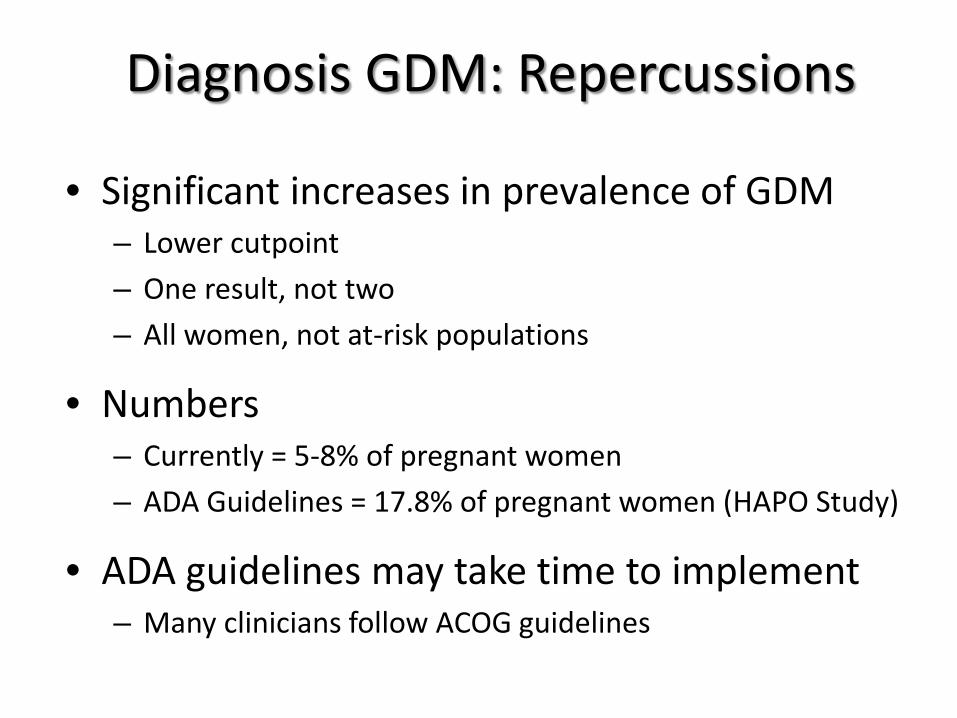
Diagnosis GDM: Repercussions
• Significant increases in prevalence of GDM – Lower cutpoint – One result, not two – All women, not at-risk populations
• Numbers – Currently = 5-8% of pregnant women – ADA Guidelines = 17.8% of pregnant women (HAPO Study)
• ADA guidelines may take time to implement – Many clinicians follow ACOG guidelines

Summary Points:
• DM diagnosis and prevalence continues to increase
• HbA1c values are considered diagnostic for DM – ADA, 2010
• HbA1c assays have been standardized (NGSP), but controversy over reporting units continues
• Diagnosis of the pre-diabetic state is important for long term outcomes
• Lack of consensus regarding GDM diagnostic criteria

Questions?
Joely Straseski, PhD, DABCC, FACB Assistant Professor of Pathology Medical Director, Endocrinology
Co-Medical Director, Automated Core Laboratory ARUP Laboratories and University of Utah