new forms of political participation - anu - digital collections
TRANSCRIPT
B.J.Pol.S. 38, 247–272 Copyright © 2008 Cambridge University Press
doi:10.1017/S0007123408000136 Printed in the United Kingdom
New Forms of Political Participation: Searching forExpert Citizens and Everyday Makers
YAOJUN LI A N D DAVID MARSH*
Declining political participation has caused much concern among political scientists and politicians. Thisarticle builds upon Henrik Bang’s conceptualization of Expert Citizens and Everyday Makers as new formsof political participation. Using the 2001 Home Office Citizenship Survey, we identify four types of politicalparticipant: Political Activists, Expert Citizens, Everyday Makers and Non-Participants. We assess thesocio-demographic and cultural factors underlying these different types of participant. We then move on toexplore the association between the types of political participation and two domains of political beliefs/actions:political trust and efficacy; and political contacting and voice. Our analysis shows significant differencesbetween the types of participant in the two domains under investigation and thus lends support to ourdevelopment of Bang’s conceptualization of new forms of political participation as useful tools in empiricalresearch.
The issue of political participation has received a great deal of attention in recent yearsfrom academics, journalists and politicians across most liberal democracies. To a largeextent, this reflects concerns about the decline in voting, party membership and othermainstream political activity.1 In this context, it is perhaps unsurprising that there is agrowing body of work on political participation.2
In Britain, Pattie, Seyd and Whiteley have provided the most recent quantitative studyof participation and we discuss it at points throughout this article.3 However, as Marsh,O’Toole and Jones argue, they operate with a narrow conceptualization of ‘the political’and political participation.4 In addition, it is interesting that Pattie, Seyd and Whiteley pay
* Institute for Social Change, Manchester University; and Department of Sociology, Birmingham University,respectively.
1 In Britain, for example, the turnout in the 2001 general election was 59 per cent, 12 percentage points lowerthan in 1997 and 25 points lower than the post-war high of 84 per cent in 1950. It did rise in the 2005 election,but only to 61 per cent. In relation to young people, the picture was even more disturbing: MORI’s figures suggestthat the turnout rate for 18–24 year-olds dropped from 39 per cent in 2001 to 37 per cent in 2005, see� www.mori.com/polls/2005/election-aggregate.shtml � . In a similar vein, the combined membership ofBritish political parties is little more than a half that of the largest British interest group, the Royal Societyfor the Protection of Birds, see D. Marsh T. O’Toole and S. Jones, Young People and Politics in the UK(Basingstoke: Palgrave, 2006), p. 2.
2 See, for example, M. Henn, M. Weinstein and D. Wring, ‘A Generation Apart? Youth and PoliticalParticipation in Britain’, British Journal of Politics and International Relations, 4 (2002), 167–92.
3 C. Pattie, P. Seyd and P. Whiteley, Citizenship in Britain: Values, Participation and Democracy (Cambridge:Cambridge University Press, 2004); and P. Norris, The Demographic Phoenix (Cambridge: Cambridge UniversityPress, 2002).
4 Marsh, O’Toole and Jones, Young People and Politics in the UK, develop four criticisms of the existingliterature on political participation and only partially exempt Pattie, Seyd and Whiteley from the first and fourthof these. They contend that the literature (i) operates with a narrow definition of politics; (ii) imposes this narrowdefinition of politics on respondents; (iii) sees apathy as participation’s main, if not only, ‘other’, when manycitizens are not apathetic, but rather alienated from formal politics; and (iv) imposes a particular, largely top-down,view of citizenship and democracy on respondents which many do not accept. See also T. O’Toole, D. Marsh andS. Jones, ‘Political Literacy Cuts Both Ways: The Politics of Non-Participation Among Young People’, PoliticalQuarterly, 74 (2003), 349–60.
248 L I A N D M A R S H
little attention to the more recent critical literature about the limits of political participationresearch and, in particular, make no reference to the work of Henrik Bang which is thefocus here.5
Henrik Bang’s work represents an interesting development in the political participationliterature because it acknowledges the weaknesses of the existing literature and seeksto move beyond it.6 Unfortunately, in our view it has been insufficiently considered.7
Bang contends that most of the mainstream political participation literature focuses onwhat can be viewed as a ‘free-rider’ problem: people don’t participate, but they do ‘enjoy’the benefits of citizenship.8 In crude terms, the view is that the key problem lies with thecitizens, rather than the state; they are apathetic and need to be encouraged to participate.However, this view reflects the weaknesses in the literature that Marsh, O’Toole and Jonesidentify.9
As we shall see in more detail below, Bang urges us to move beyond this focus on thefree-rider problem towards a focus upon exclusion. In his view, citizens are not apathetic;rather, they are alienated from a political system which does not allow them a ‘real’, thatis effective, voice. Consequently, if they participate, they do it on their own terms, ratherthan on terms established by the state. As such, Bang argues that contemporary liberaldemocracies are characterized, not by increasing political apathy, but by differenttypes/forms of political participation. This is an interesting and important argument.However, it has not been effectively tested empirically and that is the aim of this article.
This article is divided into four main sections: the first section introduces, and brieflycritiques, Bang’s work, to pave the way for our own approach and empirical analysis; the
5 They make only one reference to Marsh, O’Toole and Jones’s work, but almost wilfully misunderstand it.See Pattie, Seyd and Whiteley, Citizenship in Britain, p. 76, fn. 1, and for a reply, see Marsh, O’Toole and Jones,Young People and Politics, pp. 24–5.
6 See, among others, H. Bang and E. Sorensen, ‘The Everyday Maker: Building Social rather than PoliticalCapital’, in P. Dekker and E. Uslaner, eds, Social Capital and Participation in Everyday Life (London: Routledge,2001), pp. 148–61; H. Bang, ‘A New Ruler Makes a New Citizen: Cultural Governance and Everyday Making’,in H. Bang, ed., Governance as Social and Political Communication (Manchester: Manchester University Press,2003), pp. 241–66; H. Bang, ‘Everyday Makers and Expert Citizens: Building Political not Social Capital’(unpublished paper, ANU School of Social Science, 2004); H. Bang, ‘Among Everyday Makers and ExpertCitizens’, in J. Newman, ed., Remaking Governance: Peoples, Politics and the Public Sphere (Bristol: The PolicyPress, 2005), pp. 159–79.
7 This is not to say that it has received no attention. Rather, it has been seized upon by authors from variouscountries and disciplines who are concerned with broader issues of governance. See, for example: M. Bevir,‘Government and Interpretation: What are the Implications of Postfoundationalism?’ Public Administration,82 (2004), 605–25; M. Bevir and R. Rhodes, ‘Studying British Government: Reconstructing the Research Agenda’,British Journal of Politics and International Relations, 1 (1999), 215–39; M. Blanc and J. Beaumont, ‘LocalDemocracy within European Urban Development Programmes’, Social and Economic Geography, 96 (2005),409–20; P. Bogason and J. Musso, ‘The Democratic Prospects of Network Governance’, American Review ofPublic Administration, 36 (2006), 3–18; R. Edmondson, ‘Social Capital: A Strategy for Enhancing Health?’ SocialScience and Medicine, 57 (2003), 1723–33; F. Forno and L. Ceccarini, ‘From the Street to the Shops: The Riseof New Forms of Political Actions in Italy’, South European Society & Politics, 11 (2006), 197–222; P. Mouritsen,‘What’s the Civil in Civil Society? Robert Putnam, Italy and the Republican Tradition’, Political Studies,51 (2003), 650–68; R. Rhodes, ‘Putting People Back into Networks’, Australian Journal of Political Science,37 (2002), 399–416; H. Tapio and K. Auli, ‘Preconditions of Democratic e-governance? A Critical Approach’,in Ari-Veikko Anttiroiko and Antti Kasvio, eds, e-City. Analysing Efforts to Generate Local Dynamism in theCity of Tampere (Tampere: Tampere University Press, 2005), pp. 409–48; and L. Torpe, ‘Social Capital inDenmark: A Deviant Case?’ Scandinavian Political Studies, 26 (2003), 27–48.
8 Here, Bang may be unfair to the best rational choice theorists, who do deal more effectively with the freerider problem, but we would argue that his critique does apply to Pattie, Seyd and Whiteley.
9 Marsh, O’Toole and Jones, Young People and Politics.
New Forms of Political Participation 249
second section discusses the dataset and methods we use; the third reports our findings;and the fourth summarizes the key findings relating them to our central research question.
INTRODUCING BANG
Bang, like others before him, acknowledges the individualization of politics and the declineof citizen-orientated participation, which many people associate with a ‘thinning’ of socialand political community.10 More specifically, he identifies two versions of this argument.First, there is Putnam’s view on what he terms the ‘mysterious disengagement’.11 Overall,Putnam’s argument is that this weaker civil engagement will lead to weaker, less effectiveand less responsive government. Secondly, and in contrast, the work of Norris and of Pattie,Seyd and Whiteley highlights the growth of new forms of participation: what Norris calls‘cause-orientated’ participation. So, Pattie, Seyd and Whiteley argue that atomization isreflected, not in broad disengagement, but rather in a decline in collective participation anda rise in individualized or micro-political participation.12
However, to Bang, these approaches share two assumptions: first, that citizenparticipation is aimed at influencing the decisions of public authorities; and, secondly, thatthe core of citizen identity revolves around ‘the creation of strong, affective moral ties,committing citizens to act normatively, responsibly and in the name of the commongood’.13 In Bang’s view, this inevitably means that, from this perspective, the key problemthat an atomized citizenry raises for liberal democracies is a free-riding problem.
In contrast, while Bang does not doubt that free-riding is a problem, he does not see itas the key problem. In his view, individualization leads to more than atomization. Morebroadly, there is not just one core political problem for democracy – but ratherever-changing problems and challenges that stem from diversity, and this diversity is thekey to understanding democracy. To Bang, participation involves ‘the matching of politicalpower and values in the situated interaction between political authorities and laypeople’.14
He argues, and this is absolutely crucial to his position, that ‘a democratic politicalrelationship of authority … is one where everybody has the right and the possibility tomake a difference to the constitution of politics and policy.’ This leads him to make adistinction between political and social solidarity: political solidarity is thinner and,crucially, not based on any conception of the common good. All you need for politicalsolidarity is that: ‘each and everybody in a political authority relationship hold the generalpolitical value that democracy requires the mutual acceptance and recognition ofdifference’.15
Given this view, Bang argues, the crucial problem of contemporary politics is politicalexclusion, rather than ‘free-riding’. What is occurring is the uncoupling of the politicalauthorities from what he terms ‘the laypeople’ and a consequent undermining of thepolitical system. The increased complexity of late-modernity makes governing much more
10 Bang, ‘Everyday Makers and Expert Citizens’, p. 1.11 Robert Putnam, ‘Bowling Alone: America’s Declining Social Capital’, Journal of Democracy, 6 (1995),
65–78; ‘Tuning In, Tuning Out: The Strange Disappearance of Social Capital in America’, PS: Political Scienceand Politics, 28 (2005), 664–83; ‘The Strange Disappearance of Civic America’, American Prospect, 24 (1996),34–48; Bowling Alone: The Collapse and Revival of American Community (New York: Simon & Schuster, 2000).
12 Pattie, Seyd and Whiteley, Citizenship in Britain, chap. 3, especially Table 2.3, p. 81.13 Bang, ‘Everyday Makers and Expert Citizens’, p. 3.14 Bang, ‘Everyday Makers and Expert Citizens’, p. 3.15 Bang, ‘Everyday Makers and Expert Citizens’, p. 4.
250 L I A N D M A R S H
difficult and the reaction of politicians, bureaucrats and corporatist interests is to excludesome groups/individuals, that is laypeople, from the process of deliberation. The weakestand the most vulnerable are the most excluded from the local, national and global level.Yet, political authorities ‘cannot make and implement authoritative decisions for a societyunless laypeople accept them and recognise themselves as bounded by them’.16
In this context, Bang sees two new political identities as emerging as the response oflaypeople to the uncoupling problem: Expert Citizens; and Everyday Makers. Crucially,Expert Citizens and Everyday Makers do not have a legitimating or an oppositional rolein relation to political authorities. Indeed, their political participation is not focused uponthe state (i.e., they do not engage in state-driven or society-driven activity), but rather theyengage in building and running governance networks and reflexive political communities,either full-time (as Expert Citizens) or part-time (as Everyday Makers).
Overall, to Bang, as the world is changing, so are the patterns of participation. ExpertCitizens and Everyday Makers are the two new types of political participants which sharecertain characteristics, but are also very different.
The Expert Citizen
These are most often new professionals, particularly in voluntary organizations, but notwithin political parties, trade unions or private firms, who feel they can do politics and makeand implement policy as well as the old authorities. They deal with all types of elites andsub-elites, both political and corporatist. In fact, Bang suggests, many Expert Citizens werepreviously grassroots activists. Expert Citizens thus need:
—a wide conception of the political as a discursive construct—a full-time, overlapping, project identity reflecting their overall lifestyle—the necessary expertise for exercising influence in elite networks—to place negotiation and dialogue before antagonism and opposition—to consider themselves as part of the system, rather than external and oppositional to
it.
To Expert Citizens, politics is a fusion between representation and participation in a newform of political participation where you use your knowledge, skills and strategicjudgement to influence others. Expert Citizens build networks of negotiation andco-operation with politicians, administrators, interest groups and the media; they develop‘network consciousness’. As compared with when they were grassroots activists, they havea weakening antagonism to the system; their aim is to make it an effective partner.Consequently, Expert Citizens are also a resource or political capital for democracy. Inparticular, they have a fund of everyday experience about how to deal with problems ofexclusion based on ethnicity, gender, class/poverty etc.
The Everyday Maker
In many ways, Bang argues, the Everyday Maker is a response to the Expert Citizen.Everyday Makers do not feel defined by the state; they are neither apathetic about, noropposed to, it. They do not want to waste time getting involved with the state; they preferto be involved at the lowest possible, local, level. Everyday Makers typically think
16 Bang, ‘Everyday Makers and Expert Citizens’, p. 4.

New Forms of Political Participation 251
globally, but act locally. They have no interest in producing a new form of interestrepresentation and have minimal interest in party politics. They are also sceptical of newExpert Citizens because they pursue their own interests: ‘They (Everyday Makers) drawa clear distinction within the realm of politics between elite networks and their own politicsof the ordinary in the locality’.17 Similarly, they are not driven by a sense of duty, nor arethey interested in gaining influence; rather, they wish to feel involved and developthemselves. They aim to encourage what Bang terms ‘small local narratives’. Unlike theExpert Citizens, they don’t want to mould identity; this, in particular, leads to conflictbetween Expert Citizens and Everyday Makers on the ground.
Bang argues that Everyday Makers live by a credo of everyday experience:18
—Do it yourself—Do it where you are—Do it for fun, but also because you find it necessary—Do it ad hoc or part-time—Do it concretely, instead of ideologically—Do it with self-confidence and show trust in yourself—Do it with the system, if need be.
Like Expert Citizens, Everyday Makers do not believe that representative democracycan be rescued, either by steering from above or accumulating social capital from below.In their view, there is a practical alternative to Putnam’s notion of ‘strong government’and ‘thick community’. Everyday Makers are likely to vote and to be informed about ‘highpolitics’, but they do not get their political identities from being citizens of the state ormembers of an interest group or a social movement. They (like Expert Citizens) areconcerned to enhance their personal capacities for self-governance and co-governance. InBang’s view: ‘They prefer a “thin” form of democratic political community that allowsfor the reciprocal acceptance and recognition of difference. They also consider “strong”,effective and responsive government from above as a permanent threat to their self-governance and co-governance’.19
For our present purposes, the main thrust of Bang’s work is his putative identificationof these two new types of participant. He argues both that these new forms of politicalparticipation reflect key changes in society and that they will lead to changes in the natureof liberal democracies like Britain. These are big questions that deserve attention and oneof us has, to an extent, engaged with these issues elsewhere.20 However, there are, of course,a number of prior questions which inform our analysis here:
—Does Bang’s classification of new forms of political participation exhaust all thepossibilities?
—Is it possible to identify a significant number of Expert Citizens and Everyday Makersin a liberal democracy like Britain?
—If so, what leads people to become involved in the different forms of participation?—Do these different types of participant have different relationships to the political
system, more specifically, different levels of political trust and efficacy, and differentlevels of contact (with public officials) and voice (for the expression of disaffection) inthe interests of public affairs?
17 Bang, ‘Everyday Makers and Expert Citizens’, p. 24.18 Bang, ‘Everyday Makers and Expert Citizens’, p. 28.19 Bang, ‘Everyday Makers and Expert Citizens’, p. 26.20 Marsh, O’Toole and Jones, Young People and Politics, pp. 46–51, 93–5, 101–10 and 215–17.
252 L I A N D M A R S H
This article is concerned with these questions. The first question is conceptual, as well asempirical, and is dealt with in the next sub-section. The other three questions are empiricaland form the core of our analysis.
BEYOND BANG
There are a number of criticisms of Bang’s work, but two are particularly important herebecause they partly inform our empirical work.21 First, in our view, it is implausible tofocus, as Bang does, effectively on Expert Citizens and Everyday Makers only, althoughimplicitly in his account there is recognition of a category of people active in conventionalpolitics. In particular, while we would agree that most literature overplays non-participation and apathy, there are people who are very unlikely to participate under anycircumstances. Secondly, Bang’s category of Everyday Makers is difficult to operational-ize, at least in quantitative terms. To Bang, Everyday Makers move in and out of politics,so if they are not involved in politics at a given time we do not know if that is becausethey are inactive Everyday Makers. As such, to undertake a quantitative analysis it isessential to know whether a person is currently or has previously been engaged. As such,we identify four types of participant which we specify below: Political Activists, ExpertCitizens, Everyday Makers and Non-Participants. Secondly, Bang says nothing about thedemographic characteristics of Expert Citizens and Everyday Makers, although theliterature makes it clear that education, class, gender, age and ethnicity are, to varyingextents, related to levels or types of socio-political participation.
Here, in the light of the general political participation literature, two points are important.First, although minority ethnic groups now constitute a significant proportion of thepopulation, around 8 per cent in the 2001 Census,22 and faith groups, particularly Muslims,are increasingly important politically, there has been little discussion of the relationshipbetween political participation and ethnicity or faith. For instance, because of their smallsample size (N � 3,145), Pattie, Seyd and Whiteley only conducted binary analysis onethnicity and religion (White/Non-White, and Religious/Non-Religious). In contrast,Fahmy used the same dataset as we do here, but still collapsed ethnicity into four groups(White, Black, Asian and Other) and undertook no analysis of faith groups.23 Given thelarge amount of research evidence on ethnic diversity and ethnic disadvantage, a morecomprehensive analysis is overdue,24 and we undertake that here. Secondly, although there
21 See Marsh, O’Toole and Jones, Young People and Politics.22 A. Heath and S. Cheung, ‘Ethnic Minority Disadvantage in the Labour Market: Britain’, in A. Heath and
S. Cheung, eds, Ethnic Differences Across Countries (Oxford: Oxford University Press, 2007).23 E. Fahmy, ‘Ethnicity, Citizenship and Political Participation in Britain: Findings from the 2001 Home Office
Citizenship Survey’ (University of Bristol: Citizenship and Attitudes to Government in Britain: Project WorkingPaper 3, 2004).
24 Much research has shown significant differences in various important aspects of life chances between ethnicgroups. See, for example, V. Karn, ed., Ethnicity in the 1991 Census (London: The Stationery Office, 1997); F.Carmichael and R. Woods, ‘Ethnic Penalties in Unemployment and Occupational Attainment: Evidence forBritain’, International Review of Applied Economics, 14 (2000), 71–98; A. White, Social Focus in Brief: Ethnicity(London: Office for National Statistics, 2002); Y. Li, ‘Social Capital, Ethnicity and the Labour Market’,Proceedings on Engaging Community � http://engagingcommunities2005.org/abstracts/Li-Yaojun-final.pdf,2005 � ; Y. Li, ‘Samples of Anonymised Records (SARs) from the UK Censuses: A Unique Source for SocialScience Research’, Sociology, 38 (2004), 553–72.
New Forms of Political Participation 253
has been a strong tradition of class analysis of voting in Britain,25 the utility of class asan explanatory variable has been heavily challenged in recent years. For example, Pakulskiand Waters have proclaimed ‘the death of class,’ while Beck and Beck-Gernsheim see itas a ‘zombie category’.26 Given that we are highly critical of that position,27 class featuresstrongly in our analysis.
DATA AND METHODS
As we have argued, Bang’s work is interesting, but, to date, it has not been systematicallytested. Bang himself undertook a study of political participation in Inner Noerrebro, an areaof Copenhagen, Denmark, which historically was a stronghold of left-wing parties andgrassroots movements fighting the system.28 This led to the development of his ideas onthe new types of political participation. Similarly, Marsh, Jones and O’Toole used theirdata on political participation in Birmingham, England, to try to establish whether therewere Everyday Makers among their respondents.29 However, both studies are qualitative.Here, the aim is different. We use the best and most relevant data to establish in quantitativeterms whether we can identify Expert Citizens and Everyday Makers among therespondents; if we can, how these groups, and our Political Activists and Non-Participantsdiffer, if at all, in terms of socio-demographic characteristics; and what effects thesedifferent types of political participant have upon levels of political trust and efficacy onthe one hand, and of contact and voice on the other (see below for details of the twodomains).
We need to make it clear from the outset that we do not claim to have produced afoolproof empirical test of Bang’s arguments and, indeed, we explore the limitations ofour data below. Rather, our modest claim is that we used the best data available anddeveloped Bang’s notions in a way which is conceptually vigorous and empiricallytestable. As such, the merit of this piece stands, or falls, on whether the reader thinksBang’s work and, more importantly, our development of it, is important enough todeserve examining empirically and, if it is, whether our analysis provides a useful, ifimperfect, examination. We have already given our answer to the first question,namely, that in our view, Bang’s work is important and deserves rigorous empirical(quantitative) investigation. The second question needs a more detailed considerationand we return to it once we have introduced our data and outlined our analyticalframework.
25 See, for instance, A. Heath, R. Jowell and J. Curtice, How Britain Votes (Oxford: Pergamon, 1985); A. Heath,R. Jowell and J. Curtice, The Rise of New Labour: Party Politics and Voter Choices (Oxford: Oxford UniversityPress, 2001); R. Andersen and A. Heath, ‘Class Matters: The Persisting Effects of Contextual Social Class onIndividual Voting in Britain, 1964–97’, European Sociological Review, 18 (2002), 125–38; J. Goldthorpe, ‘Classand Politics in Advanced Industrial Societies’, in D. Lee and B. Turner, eds, Conflict about Class: DebatingInequality in Late Industrialism (London: Longman, 1996), pp. 196–208; G. Evans, ed., The End of Class Politics?Class Voting in Comparative Context (Oxford: Oxford University Press, 1999).
26 J. Pakulski and M. Waters, The Death of Class (London: Sage, 1996); U. Beck and E. Beck-Gernsheim,The Normal Chaos of Love (Cambridge: Polity, 1995).
27 See Marsh, O’Toole and Jones, Young People and Politics, chap 5.28 Reported in Bang and Sorensen, ‘The Everyday Maker’, and Bang, ‘Everyday Makers and Expert
Citizens’.29 Marsh, O’Toole and Jones, Young People and Politics, chap 4.
254 L I A N D M A R S H
The Data
There are no extant data specifically designed to test Bang’s arguments. Consequently,we had to decide if there was any dataset which allowed us to examine Bang’s analysis,even if in a less than perfect way. After some consideration, we decided to use the2001 Home Office Citizenship Survey (HOCS). The survey contains a total of 15,475respondents (a core sample of 10,015 respondents and a minority ethnic boost sample of5,460 respondents) aged 16 and over and resident in private households in England andWales at the time of interview.30 The HOCS has rich data on, among other things:socio-demographic attributes; types of formal and informal political participation fromwhich we can construct our political participation variable; trust in different politicalinstitutions; feelings of efficacy at local and national levels; contact with public officials;and voicing of dissatisfaction with politics and politicians.31 Given the large sample size,especially as regards ethnic and faith groups, and the very rich socio-cultural and politicalparticipation data, we believe that the HOCS is a better dataset than that provided by otherBritish datasets on political participation, including that of Pattie, Seyd and Whiteley.
The Analytical Framework
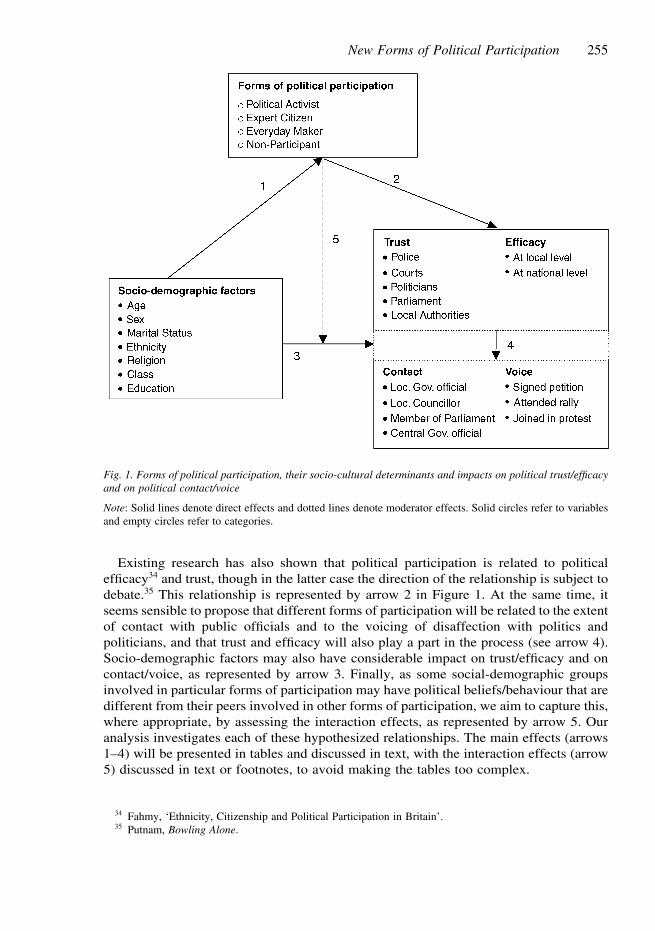
Our purpose in this article is to explore the main determinants of the various forms ofpolitical participation/types of political participant and their impact upon politicaltrust/efficacy and, in turn, upon political contact and voice. For this purpose, we shall beusing types of political participant first as an outcome and then as an explanatory variable.In the first stage of our analysis the aim is to explain why individuals become involvedin different forms of participation. Here, the explanatory variables we use are the ones thatprevious research on social capital32 and on political participation has identified asimportant: age, sex and marital status as demographic variables; ethnicity and religionas cultural variables; and class and educational qualifications as social stratificationvariables.33 This is shown by arrow 1 in Figure 1.
30 We shall use the terms ‘Britain’ and ‘British’ as shorthand in the following discussion, although we do notnecessarily mean that the patterns revealed in the data can be generalized to Scotland. For a similar practice,see J. Goldthorpe (with C. Llewellyn and C. Payne), Social Mobility and Class Structure in Modern Britain(Oxford: Clarendon Press, 1987).
31 More details of the survey, including the questionnaire, coding and weighting schemes, can be foundat � http://www.data-archive.ac.uk/findingData/snDescription.asp?sn � 4754#doc � . See also C. Attwood, G.Singh, D. Prime, R. Creasey and others, 2001 Home Office Citizenship Survey: People, Families and Communities(London: Home Office Research, Development and Statistics Directorate, 2003).
32 P. Hall, ‘Social Capital in Britain’, British Journal of Political Science, 29 (1999), 417–61; P. Paxton, ‘IsSocial Capital Declining in the United States? A Multiple Indicator Assessment’, American Journal of Sociology,105 (1999), 88–127, and ‘Social Capital and Democracy: An Interdependent Relationship’, American SociologicalReview, 67 (2002), 254–77; Putnam, Bowling Alone; Y. Li, M. Savage and A. Pickles, ‘Social Capital and SocialExclusion in England and Wales (1972–1999)’, British Journal of Sociology, 54 (2003), 497–526; Y. Li, A. Picklesand M. Savage, ‘Social Capital and Social Trust in Britain’, European Sociological Review, 21 (2005), 109–23;Y. Li ‘Social Capital, Social Exclusion and Public Health’, in A. Scriven and G. Sebastian, eds, Public Health:Social Context and Action (London: Sage, 2007).
33 There is no unanimous agreement on the terminology of these variables. For instance, ‘sex’ can be regardedas a demographic or a social attribute. Similarly, ethnicity and religion can be viewed as cultural or demographic.Education is sometimes used as an indicator of cultural capital (A. Sullivan, ‘Cultural Capital and EducationalAttainment’, Sociology, 35 (2001), 893–912) and sometimes as part of social stratification factors (T. Chan andJ. Goldthorpe, ‘The Social Stratification of Theatre, Dance and Cinema Attendance’, Cultural Trends, 14 (2005),193–212). We do not wish to get embroiled into any terminological debates and we just use these terms in theconventional sense.
New Forms of Political Participation 255
Fig. 1. Forms of political participation, their socio-cultural determinants and impacts on political trust/efficacyand on political contact/voice
Note: Solid lines denote direct effects and dotted lines denote moderator effects. Solid circles refer to variablesand empty circles refer to categories.
Existing research has also shown that political participation is related to politicalefficacy34 and trust, though in the latter case the direction of the relationship is subject todebate.35 This relationship is represented by arrow 2 in Figure 1. At the same time, itseems sensible to propose that different forms of participation will be related to the extentof contact with public officials and to the voicing of disaffection with politics andpoliticians, and that trust and efficacy will also play a part in the process (see arrow 4).Socio-demographic factors may also have considerable impact on trust/efficacy and oncontact/voice, as represented by arrow 3. Finally, as some social-demographic groupsinvolved in particular forms of participation may have political beliefs/behaviour that aredifferent from their peers involved in other forms of participation, we aim to capture this,where appropriate, by assessing the interaction effects, as represented by arrow 5. Ouranalysis investigates each of these hypothesized relationships. The main effects (arrows1–4) will be presented in tables and discussed in text, with the interaction effects (arrow5) discussed in text or footnotes, to avoid making the tables too complex.
34 Fahmy, ‘Ethnicity, Citizenship and Political Participation in Britain’.35 Putnam, Bowling Alone.
256 L I A N D M A R S H
Specifying the Variables
The key problem we have is whether the data allow us adequately to specify the categoriesof our main variable of interest, namely, forms of political participation, in a way whichdoes enough justice to Bang’s arguments and which enables us to develop his ideas.
Of course, there are always limitations in mapping quantitative data on to conceptualnotions and using data not purposely designed to examine the concepts in which one isinterested. Here, the specific problem is that the HOCS data in the main only allows usto identify the structural characteristics of Expert Citizens and Everyday Makers, not theattitudinal ones. So, we can identify what type of participation the respondents are involvedin, and whether that activity fits broadly well with Bang’s discussion of the ‘new’ formsof participation, but we cannot ascertain what the respondents were thinking and how theywere feeling about their participation. For example, we do not know whether therespondents participated for concrete or instrumental, rather than ideological, reasons, orwhether they were doing it with self-confidence or for fun, both of which are, accordingto Bang, key features of the participation of Everyday Makers. However, to reiterate, thereis no dataset which would allow us fully to tap into those aspects of Bang’s thesis and wewould argue that our specifications capture enough of Bang’s distinctions to be empiricallyuseful.
As such, the construction of the participation variable proceeded as follows. In the 2001HOCS, there are data on current (in the previous twelve months) formal involvement interms of ‘group, club or organisation’. Questions were asked of such involvement in fifteenorganizations [V3.1f] covering: (1) children’s education/schools; (2) youth/children’sactivities (outside school); (3) education for adults; (4) sports/exercise; (5) religion; (6)politics; (7) health, disability and social welfare; (8) the elderly; (9) safety, first aid; (10)the environment, animals; (11) justice and human rights; (12) local community orneighbourhood groups; (13) citizen’s groups; (14) hobbies/recreation/arts/social clubs;and (15) trade-union activity. Within each of these organizations, there were furtherquestions on eleven fields of interest [V3.2b] covering: (1) raising or handling money; (2)leading the group/member of a committee; (3) organizing or helping to run an activity orevent; (4) visiting/befriending people; (5) giving advice/information/counselling; (6)secretarial, administrative or clerical work; (7) providing transport/driving; (8) represent-ing; (9) campaigning; (10) other practical help; and (11) any other help. Moreover, thesector [V3.7] of the organization that the volunteers had helped was also asked: (1) publicsector; (2) private sector; (3) voluntary and community sector; and (4) other. Forrespondents who were not currently involved but who had been involved more than twelvemonths ago, the same questions were asked on the eleven fields of interest in their previousformal involvement [V5.1].
Using these codes, we constructed our participation variable with four categories asshown in Figure 1. First, we specified Political Activists as those involved in what onemight call conventional politics, namely, those who are currently engaged in organizationscharacterized by politics or trade-union activity (category 6 or 15 in V3.1f).36 Secondly,in the remaining sample, we specified Expert Citizens as those who acted in the capacity
36 There is no data on voting, but as far as Bang is concerned, Expert Citizens and Everyday Makers are notless likely to vote than other participants. We would also stress here that we do have a narrow definition of standardpolitical participators, but that reflects the existing literature and the whole point about the article is that we alsodifferentiate two other types of participator as the focus of the article, namely, Expert Citizens and EverydayMakers.
New Forms of Political Participation 257
of leaders or representatives in terms of fields of interest in current or previous formalinvolvement (category 2 or 8 in V3.2b or V5.1) and, for those currently involved, whohelped organizations that were outside the private sector (category 1, 3 or 4 in V3.7).Thirdly, Everyday Makers are defined as those who are currently or previously involvedbut not in the capacity of Political Activists or Expert Citizens as defined above. Finally,Non-Participants are those who did not volunteer in the last twelve months or over twelvemonths ago in any of the three activist capacities.37
As shown in Figure 1, we also explore the relationship between the types of politicalparticipant and two domains of political beliefs/actions: trust/efficacy; and contact/voice.Each of the two domains consists of two subsets with a differing number of variables. Trustis assessed in relation to police, courts, politicians, parliament and local authorities;efficacy refers to the feeling that one can influence decisions affecting the local and thenational levels; contact involves contacting a public official working for the local council,contacting a local councillor, contacting a Member of Parliament, or contacting a publicofficial working for the central government; and voice involves signing petitions, attendingpublic meetings or rallies, or joining in public demonstrations or protests.38
We shall explore the association between our four groups of political participants andthe two domains of political beliefs/actions in terms of both descriptive analysis andstatistical modelling. With regard to modelling, as the space limit of this article does notallow us to present results for each of the fourteen variables in the two domains, we usedtechniques based on item response theory (IRT)39 to obtain latent variable scores forcategorical indicator variables for each of the domains.40 The scores thus obtained werethen standardized (with a mean of 0 and a standard deviation of 1) so that we could easilycompare the relative effects of different socio-demographic attributes and of types ofpolitical participant.
We give a brief account here of the socio-demographic variables. Ethnicity isoperationalized according to the 1991 Census as an eight-way variable: White, Black
37 The four groups of political participants were constructed by using a combination of questions on V3.1f,V3.2b, V3.7 and V5.1 in the 2001 HOCS. The details of the questions are available at � http://www.data-archive.ac.uk/doc/4754/mrdoc/pdf/4754userguide1.pdf � (last accessed on 12 October 2006) at pp. 150, 154, 157and 162 respectively, including detailed definitions and explanations to the interviewers. Because of the spacelimit, we do not reproduce the details here but interested readers can easily find out. Twenty respondents who gaveno valid information to these questions were dropped from analysis.
38 See � http://www.data-archive.ac.uk/doc/4754/mrdoc/pdf/4754userguide1.pdf � p. 148 on trust [V2.5].Note that trust in employers, the Welsh Assembly and the Greater London Assembly are not analysed. Questionson efficacy are asked in [V2.4], available at p. 147. Again, efficacy on Wales and Greater London are not analysed.Questions on contact and voice are asked in [V2.1a-V2.1c], available at pp. 145–6. Responses in [V2.1a-V2.1c]specific to Wales or London are not analysed. All the explanations to the questions are also available in these pages.The instructions to the respondents and to the interviewers made it clear that these questions are about ‘publicaffairs’ and thus contact for personal issues or contact through work is not to be coded.
39 See Appendix 2 (available at � http://www.ccsr.ac.uk/staff/yaojun.htm � ) for a brief discussion of the IRTmodelling. For a classical account, see F. Lord and M. Novick, Statistical Theories of Mental Test Scores (Boston,Mass.: Addison-Wesley, 1968). For a recent definitive account, see A. Skrondal and S. Rabe-Hesketh, GeneralizedLatent Variable Modeling: Multilevel, Longitudinal, and Structural Equation Models (London: Chapman &Hall/CRC, 2004). See also Li, Pickles and Savage, ‘Social Capital and Social Trust’, for an application of the IRTmodelling to social capital research.
40 See D. Rubin, ‘Inference and Missing Data’, Biometrika, 63 (1976), 581–92; and B. Muthen, ‘Latent VariableAnalysis: Growth Mixture Modelling and Related Techniques for Longitudinal Data’, in D. Kaplan, ed., Handbookof Quantitative Methodology for the Social Sciences (Newbury Park, Calif.: Sage Publications, 2004), pp. 345–68.
258 L I A N D M A R S H
Caribbean, Black African, Indian, Pakistani, Bangladeshi, Chinese and Other.41 Religionis also coded as an eight-way variable: Christian, Buddhist, Hindu, Jewish, Muslim,Sikh, Other and None. As such, our approach marks a significant step forward in thetreatment of these variables in the political participation literature42 and our categories arenot only sociologically more meaningful than those used in existing literature, but alsooperationally amenable to multivariate analysis.
Class is measured using a three-way Goldthorpe class schema, differentiating betweenthe service class (professionals, administrators and managers), the intermediate class(petty bourgeois, routine non-manual, and forepersons and lower technicians) and theworking class (skilled, semi-skilled and unskilled manual workers, including agriculturallabourers).43 As the data are collected from people aged 16 and over, a sizeable numberof our respondents are still in education and they are assigned to a separate category:students. Our focus in the following analysis is, however, on the contrast between theservice and the working classes. As regards educational qualifications, we differentiated,on the basis of the respondent’s highest qualification: first-degree or above; diploma/A-levels; trade apprenticeships/O-levels; and primary/none.
In order to address the issues of unequal selection probabilities, differentialnon-response among subgroups and the over-representation of minority ethnic groups, weused the appropriate weighting variable for the individual-level analysis of the combinedsample, with analytical weights in the descriptive, and probability weights in theinferential, analysis.
ANALYSIS
We present our findings following the procedure suggested in Figure 1. With regard to theassociation between socio-demographic factors and forms of political participation (arrow1), the issue not considered by Bang, we present a general picture, before looking at theresults in terms of net effects. Subsequently, we shall look at the latent factor scores forthe two domains of political beliefs/actions and use them in the multivariate analysis tounpack the relative effects between forms of participation and socio-demographic factors.
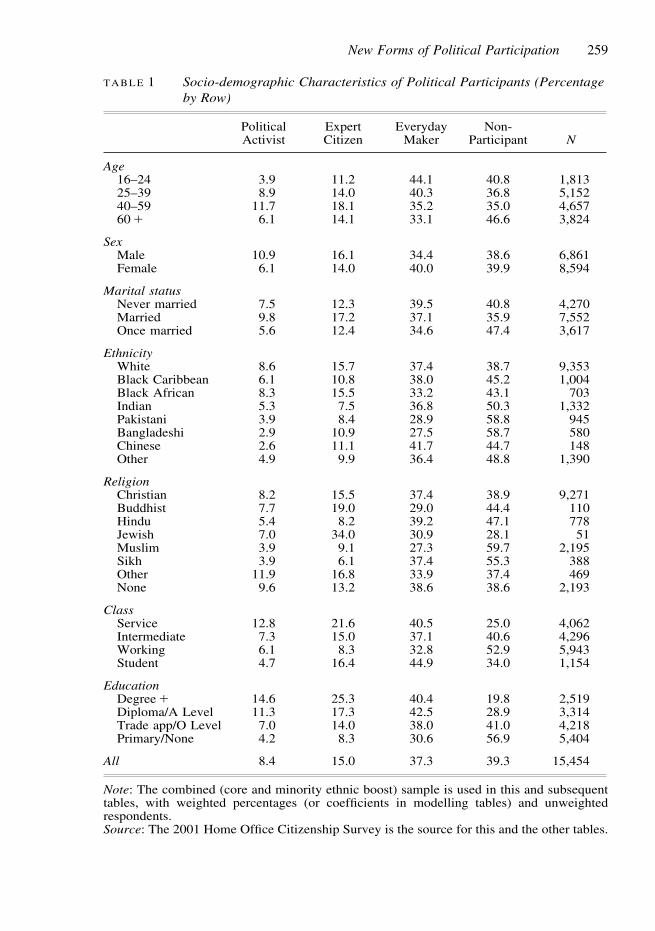
The data in Table 1 show the association between the socio-demographic variables andforms of political participation. At the bottom of the table, we can see that, of the 15,454respondents who gave information on political participation, 8.4 per cent are PoliticalActivists, 15.0 per cent Expert Citizens and 37.3 per cent Everyday Makers. Thus, 60.7per cent of the respondents were participating in forms of ‘political’ activities, while 39.3per cent were Non-Participants.
With regard to the socio-demographic characteristics of the four groups of politicalparticipants, we find that age is a crucial factor in a predictable way.44 The middle-aged
41 It is noted here that even though both Attwood et al., Home Office Citizenship Survey, and Fahmy, ‘Ethnicity,Citizenship and Political Participation in Britain’, use the same data as we do here, there are significant differencesbetween their and our analyses. Attwood et al. were mainly interested in exploring the basic association as revealedin crosstabulations and were not focused on any particular theoretical or sociological theme (see, for instance, theirTable 5.2 and associated discussions). Fahmy, as noted earlier, only used a four-way ethnic variable and did notanalyse faith groups.
42 Pattie, Seyd and Whiteley, Citizenship in Britain.43 Goldthorpe, Social Mobility.44 The result confirms the conclusion by Pattie, Seyd and Whiteley, Citizenship in Britain, that the middle-aged
are more likely to participate, Table 3.4, p. 27.
New Forms of Political Participation 259
TABLE 1 Socio-demographic Characteristics of Political Participants (Percentageby Row)
Political Expert Everyday Non-Activist Citizen Maker Participant N
Age16–24 3.9 11.2 44.1 40.8 1,81325–39 8.9 14.0 40.3 36.8 5,15240–59 11.7 18.1 35.2 35.0 4,65760 � 6.1 14.1 33.1 46.6 3,824
SexMale 10.9 16.1 34.4 38.6 6,861Female 6.1 14.0 40.0 39.9 8,594
Marital statusNever married 7.5 12.3 39.5 40.8 4,270Married 9.8 17.2 37.1 35.9 7,552Once married 5.6 12.4 34.6 47.4 3,617
EthnicityWhite 8.6 15.7 37.4 38.7 9,353Black Caribbean 6.1 10.8 38.0 45.2 1,004Black African 8.3 15.5 33.2 43.1 703Indian 5.3 7.5 36.8 50.3 1,332Pakistani 3.9 8.4 28.9 58.8 945Bangladeshi 2.9 10.9 27.5 58.7 580Chinese 2.6 11.1 41.7 44.7 148Other 4.9 9.9 36.4 48.8 1,390
ReligionChristian 8.2 15.5 37.4 38.9 9,271Buddhist 7.7 19.0 29.0 44.4 110Hindu 5.4 8.2 39.2 47.1 778Jewish 7.0 34.0 30.9 28.1 51Muslim 3.9 9.1 27.3 59.7 2,195Sikh 3.9 6.1 37.4 55.3 388Other 11.9 16.8 33.9 37.4 469None 9.6 13.2 38.6 38.6 2,193
ClassService 12.8 21.6 40.5 25.0 4,062Intermediate 7.3 15.0 37.1 40.6 4,296Working 6.1 8.3 32.8 52.9 5,943Student 4.7 16.4 44.9 34.0 1,154
EducationDegree � 14.6 25.3 40.4 19.8 2,519Diploma/A Level 11.3 17.3 42.5 28.9 3,314Trade app/O Level 7.0 14.0 38.0 41.0 4,218Primary/None 4.2 8.3 30.6 56.9 5,404
All 8.4 15.0 37.3 39.3 15,454
Note: The combined (core and minority ethnic boost) sample is used in this and subsequenttables, with weighted percentages (or coefficients in modelling tables) and unweightedrespondents.Source: The 2001 Home Office Citizenship Survey is the source for this and the other tables.
260 L I A N D M A R S H
are much more likely than the other age groups to be a Political Activist or Expert Citizen.The younger groups are more likely to be rank-and-file followers (Everyday Makers),whilst the oldest group are most likely to be absent from involvement. The pattern hereechoes recent research findings that young people in Britain are more engaged inloosely-knit social connections than in formal civic organizations.45 Gender differences areless pronounced, although men (10.9 per cent) are somewhat more likely than women (6.1per cent) to be Political Activists and women are similarly more likely than men to beEveryday Makers. The noticeable differences with regard to marital status manifestthemselves in two aspects.46 First, married people are generally more likely than thenon-married (never married or once married) to be Political Activists or Expert Citizens.Secondly, the once married (widowed, divorced and separated) are most likely to be in theNon-Participant category, which is probably a reflection of their age profile. Indeed, furtheranalysis shows that over half of the once married are over 60 years of age.
As pointed out earlier, owing to the lack of data, studies of political participation inBritain have had relatively little to say about ethnic or religious background. We have thefirst data that can fully explore that relationship. Our analysis here shows some interestingfeatures. First, there seem to be more ethno-religious differences than ones based on age,gender or marital status.47 With regard to ethnicity, among the minority groups people ofBlack African origin are most likely to be Political Activists and Expert Citizens (8.3 and15.5 per cent respectively), and people of Chinese origin are most likely to be EverydayMakers (41.7 per cent), whilst people of Pakistani and Bangladeshi origins are most likelyto be Non-Participants (nearly 59 per cent each). With regard to religion, people of Jewishdescent are by far the most likely to be Expert Citizens (34 per cent), as compared withthe 6.1 per cent of the Sikhs. Muslims and Sikhs are the least likely to be politicalparticipants (59.7 and 55.3 per cent respectively). There is, of course, a close associationhere and further analysis shows that 97 per cent of the respondents of Pakistani andBangladeshi origins are Muslims, while 13 per cent of the respondents of Indian origin arealso Muslims.
Class and educational differences have a far more pronounced effect than the otherpersonal attributes considered to date and, interestingly, the effect of class is much greaterthan reported by Pattie, Seyd and Whiteley.48 Thus, 34.4 per cent of the respondents in theservice class were ‘Political Activists’ or ‘Expert Citizens,’ as compared with only 14.4per cent of the working class. On the other hand, nearly 53 per cent of the latter and only25 per cent of the former were in the Non-Participant group. Certainly, class seems to
45 Y. Li, M. Savage and A. Warde, ‘Social Stratification’ (unpublished paper, Institute for Social Change,University of Manchester). There are also data in the HOCS on informal help, namely, unpaid help given tonon-relatives in the last twelve months, in [V6.1] � http://www.data-archive.ac.uk/doc/4754/mrdoc/pdf/4754userguide1.pdf � at p. 165. Further analysis shows that around 72.4 per cent of the two younger groups gaveone kind or another of unpaid informal help to non-relatives, as compared with 56.8 per cent of the oldest group.
46 The conceptual link between marital status and participation lies in the fact that some of the fifteenorganizations have a very close bearing on family life. As married people are more likely to have children andto be residentially stable than the never married or the once married, they are more involved in children’seducation/schools and/or in neighbourhood groups. Further analysis confirms this (details are available on request).
47 Further analysis confirms this. Putting all the socio-demographic factors in the table as explanatory variablesand political participation as the outcome variable in an ordinal logit regression analysis, we find that theethno-religious variables yield greater chi-square values (�2 � 158.89 with 14 degrees of freedom) than do theage-sex-marital variables (�2 � 90.09 with 6 degrees of freedom), and the difference between the two sets ofvariables is statistically significant at the 0.05 level (�2 � 10.45 with 1 degree of freedom, p � 0.001).
48 Pattie, Seyd and Whiteley, Citizenship in Britain, Table 3.4, p. 86 and Table 6.12, p. 182.
New Forms of Political Participation 261
matter here. The differences between the educational groups are even starker. People withdegree or higher qualifications are around three times more likely than those with onlyprimary or no formal educational qualifications to be Political Activists or Expert Citizens(39.9 as against 12.5 per cent), and the latter are similarly more likely than the former tobe Non-Participants (nearly 57 as against nearly 20 per cent).
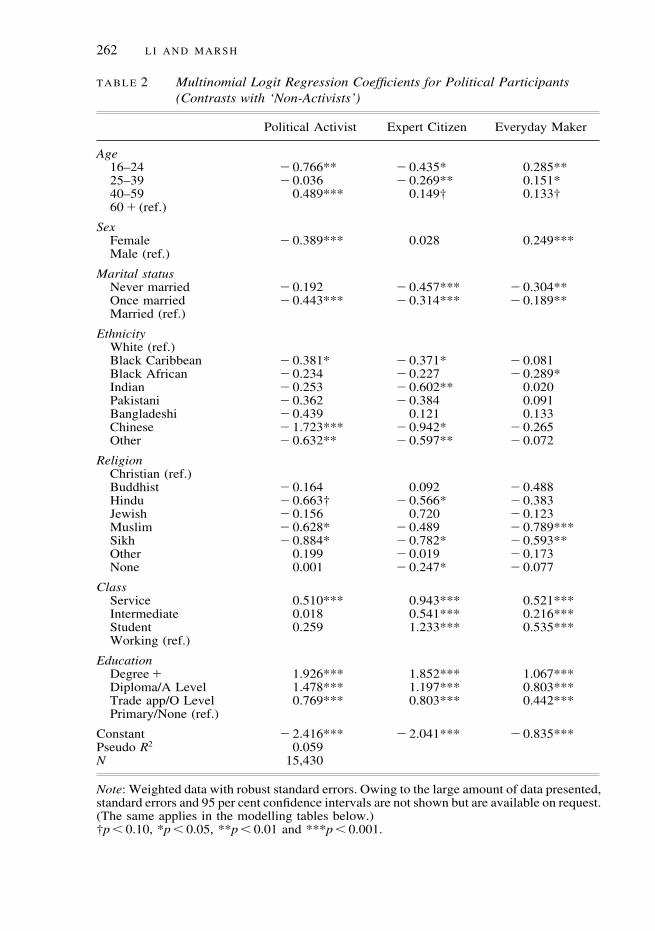
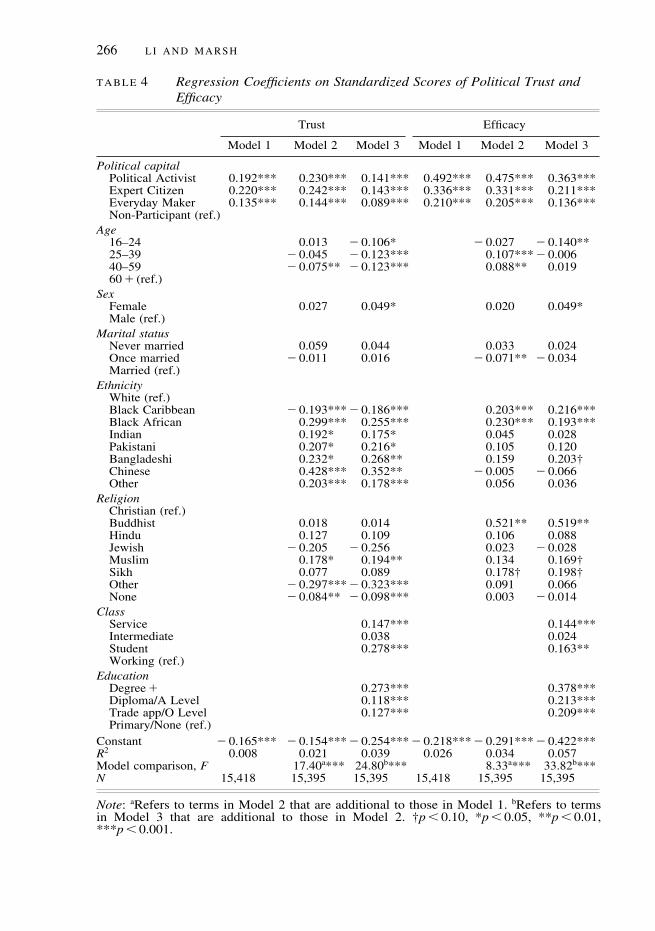
We have described the association between socio-demographic groups and forms ofpolitical participation. However, many of these variables are obviously interrelated.49 Inorder to see the net effects, we show, in Table 2, results of a multinomial logit regression.50
We used ‘Non-Participants’ as the base group and each of the other groups – PoliticalActivists, Expert Citizens and Everyday Makers – is contrasted with Non-Participants. Wefind that the patterns generally reinforce those that emerged in Table 1. Holding constantall other variables in the model, we find the younger cohorts less likely to be involved intraditional politics (party politics or trade unions where the 40–59 cohort takes a prominentrole) or to assume formal leadership roles, but much more likely to be Everyday Makers.51
Women are less likely than men to partake in conventional politics but more likely to beengaged in other capacities, particularly as rank-and-file participants. It is also noted herethat statistical modelling can reveal patterns which would remain obscure, or hidden, indescriptive analysis. Thus, both the ‘never-married’ group and the ‘once-married’ groupare, holding constant the other variables in the models, less likely than the married groupto be in each of the three activist groups, a pattern barely noticeable in Table 1. Religion,rather than ethnicity, seems to be a more important factor underpinning participation. Thus,holding constant all other socio-demographic factors, Muslims are consistently less likely,and significantly so in two out of the three contrasts, to be in any of the activist group,whereas their ethnic origins did not make any marked difference. Indeed, further analysisshows that Muslims from India, Pakistan or Bangladesh were not significantly differentin any of the three contrasts. With regard to Expert Citizens, it must be pointed out thatthe Jewish respondents were the most active, with the largest positive coefficient amongstall faith groups (0.720).52
The most salient patterns in Table 2 concern class and education. Controlling for all otherfactors in the model, we find that class, and education in particular, have a very importanteffect. In terms of the magnitude of the coefficients, the differences between degree holdersand those with least educational qualifications, and between the service and the workingclasses, are generally, and consistently, larger than those found for categories in the othervariables. Another notable feature of Table 2 is that class effects are most stronglyassociated with Expert Citizens and educational effects with both Political Activists andExpert Citizens. Thus, controlling for all other variables in the models, the coefficients forthe service class (as compared with the working class whose value is set at 0 in the model)are 0.510, 0.943 and 0.521, and those for degree holders (as compared with thenon-qualified) are 1.926, 1.852 and 1.067 respectively for Political Activists, Expert
49 For instance, further analysis shows that over three quarters of those with degrees are found in the serviceclass, whilst nearly 60 per cent of the least educationally qualified group are in the working class.
50 We also carried out an ordinal logit regression analysis as noted above on the assumption that the fourcategories take an inherent order such that ‘Political Activists’ have greater political capital than ‘Expert Citizens’who in turn have greater political capital than ‘Everyday Makers’, etc. The patterns are the same but multinomiallogit analysis discloses features not shown in ordinal logit analysis, hence, our preference for the former.
51 This confirms the conclusion of Pattie, Seyd and Whiteley, Citizenship in Britain, Table 3.4, p. 86.52 Even though the coefficient did not reach the significance level (p � 0.24), we must remember that there are
only fifty-one respondents of Jewish faith in the sample, as shown in Table 1.
262 L I A N D M A R S H
TABLE 2 Multinomial Logit Regression Coefficients for Political Participants(Contrasts with ‘Non-Activists’)
Political Activist Expert Citizen Everyday Maker
Age16–24 � 0.766** � 0.435* 0.285**25–39 � 0.036 � 0.269** 0.151*40–59 0.489*** 0.149† 0.133†60 � (ref.)
SexFemale � 0.389*** 0.028 0.249***Male (ref.)
Marital statusNever married � 0.192 � 0.457*** � 0.304**Once married � 0.443*** � 0.314*** � 0.189**Married (ref.)
EthnicityWhite (ref.)Black Caribbean � 0.381* � 0.371* � 0.081Black African � 0.234 � 0.227 � 0.289*Indian � 0.253 � 0.602** 0.020Pakistani � 0.362 � 0.384 0.091Bangladeshi � 0.439 0.121 0.133Chinese � 1.723*** � 0.942* � 0.265Other � 0.632** � 0.597** � 0.072
ReligionChristian (ref.)Buddhist � 0.164 0.092 � 0.488Hindu � 0.663† � 0.566* � 0.383Jewish � 0.156 0.720 � 0.123Muslim � 0.628* � 0.489 � 0.789***Sikh � 0.884* � 0.782* � 0.593**Other 0.199 � 0.019 � 0.173None 0.001 � 0.247* � 0.077
ClassService 0.510*** 0.943*** 0.521***Intermediate 0.018 0.541*** 0.216***Student 0.259 1.233*** 0.535***Working (ref.)
EducationDegree � 1.926*** 1.852*** 1.067***Diploma/A Level 1.478*** 1.197*** 0.803***Trade app/O Level 0.769*** 0.803*** 0.442***Primary/None (ref.)
Constant � 2.416*** � 2.041*** � 0.835***Pseudo R2 0.059N 15,430
Note: Weighted data with robust standard errors. Owing to the large amount of data presented,standard errors and 95 per cent confidence intervals are not shown but are available on request.(The same applies in the modelling tables below.)†p � 0.10, *p � 0.05, **p � 0.01 and ***p � 0.001.
New Forms of Political Participation 263
Citizens and Everyday Makers. It is also worth noting that party politics and trade-unionactivities used to be home to working-class men in Britain but over the last thirty years,it has gradually shifted ground so that it has been increasingly, and is currentlypredominantly, composed of people in middle-class positions.53
A third important feature of Table 2 concerns the relatively weak political participationof some ethno-religious groups, when all other factors in the models are taken into account.For instance, people of Chinese origin are notably absent both from conventional politicsand from assuming leadership roles in new forms of participation. Equally notable is thelack of participation by Muslim, Sikh and Hindu communities. Black Caribbeans are alsounderrepresented in party or trade-union activities, and in leadership roles of new formsof participation.
Of course, the results we present in Table 2 are main effects. As such, there may beinteraction effects involved which our models did not investigate; that is, one may arguethat it is not being Chinese, Muslim or Black per se which hinders respondents from beingPolitical Activists, Expert Citizens or Everyday Makers, but rather there are other factors,perhaps their relatively weak socio-economic positions, which made them less involved.We carried out further analysis to test this hypothesis. The results gave a partialconfirmation. For instance, with all other factors controlled for in the model, of people fromBlack Caribbean or Black African or Chinese ethnic origins or Muslim faith who are inservice-class positions or who have degree qualifications, there is no statistical differenceto their White peers; yet Indians with degree level qualifications were found significantlyless likely than the White counterparts to be active participants ( � 1.368, � 1.089 and� 0.996 in the three contrasts respectively).
In sum, the patterns show that socio-demographic factors, particularly class andeducation, are of paramount importance in the generation of different forms of politicalparticipation. Age, sex, marital status and religious affiliation are also of considerableimportance, but ethnic differences have relatively little effect. While such patternsdemonstrate the continued explanatory power of social stratification, as mainstream classanalysts would expect, they present an empirical challenge to poststructuralists who havelong proclaimed the death of class replaced by divisions based on lifestyle or culturalidentity.54
Having discussed at some lengths the relative impacts of socio-demographic factorson the generation of forms of political participation, we now turn to the impacts ofsocio-demographic factors and forms of political participation upon the two domainsof political beliefs/actions as shown in Figure 1. We first analyse the domain of beliefs withthe subsets of political trust and efficacy, and then come to that of actions with the subsetsof political contact and voice. As earlier noted, we shall explore the associations at adescriptive level in the first instance before proceeding to the statistical modelling.
53 Using the most recent British Household Panel Survey of 2004, we find 47 per cent of trade-union membersare drawn from the service class and only 27 per cent from the working class. For further discussion in this regard,see M. Savage, Y. Li and G. Tampubolon, ‘Rethinking the Politics of Social Capital: Challenging TocquevillianPerspectives’, in R. Edwards, J. Franklin and J. Holland, eds, Social Capital: Concepts, Policy and Practice(London: Sage, 2006), pp. 70–94; Hall, ‘Social Capital in Britain’; Li, Savage and Pickles, ‘Social Capital andSocial Exclusion’; and Y. Li and A. Pollert, The Unorganized Worker in WERS 2004: Socio-demographicAttributes, Workplace Characteristics and Work-life Experience (London: DTI and RSS, 2006).
54 Pakulski and Waters, The Death of Class; A. Elliott and C. Lemert, The New Individualism (London:Routledge, 2006); and D. Denney, Risk and Society (London: Sage, 2005).
264 L I A N D M A R S H
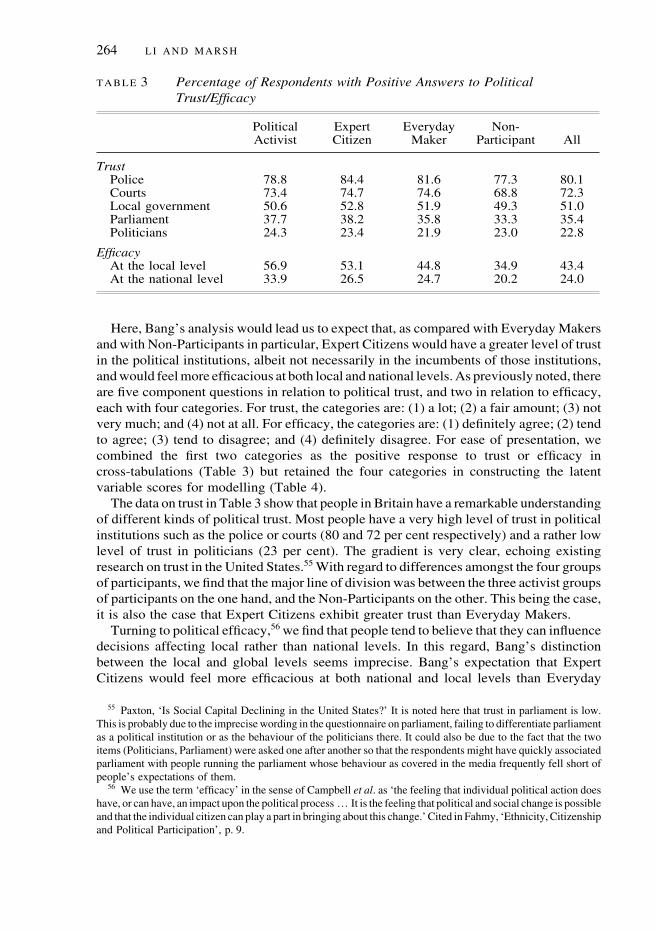
TABLE 3 Percentage of Respondents with Positive Answers to PoliticalTrust/Efficacy
Political Expert Everyday Non-Activist Citizen Maker Participant All
TrustPolice 78.8 84.4 81.6 77.3 80.1Courts 73.4 74.7 74.6 68.8 72.3Local government 50.6 52.8 51.9 49.3 51.0Parliament 37.7 38.2 35.8 33.3 35.4Politicians 24.3 23.4 21.9 23.0 22.8
EfficacyAt the local level 56.9 53.1 44.8 34.9 43.4At the national level 33.9 26.5 24.7 20.2 24.0
Here, Bang’s analysis would lead us to expect that, as compared with Everyday Makersand with Non-Participants in particular, Expert Citizens would have a greater level of trustin the political institutions, albeit not necessarily in the incumbents of those institutions,and would feel more efficacious at both local and national levels. As previously noted, thereare five component questions in relation to political trust, and two in relation to efficacy,each with four categories. For trust, the categories are: (1) a lot; (2) a fair amount; (3) notvery much; and (4) not at all. For efficacy, the categories are: (1) definitely agree; (2) tendto agree; (3) tend to disagree; and (4) definitely disagree. For ease of presentation, wecombined the first two categories as the positive response to trust or efficacy incross-tabulations (Table 3) but retained the four categories in constructing the latentvariable scores for modelling (Table 4).
The data on trust in Table 3 show that people in Britain have a remarkable understandingof different kinds of political trust. Most people have a very high level of trust in politicalinstitutions such as the police or courts (80 and 72 per cent respectively) and a rather lowlevel of trust in politicians (23 per cent). The gradient is very clear, echoing existingresearch on trust in the United States.55 With regard to differences amongst the four groupsof participants, we find that the major line of division was between the three activist groupsof participants on the one hand, and the Non-Participants on the other. This being the case,it is also the case that Expert Citizens exhibit greater trust than Everyday Makers.
Turning to political efficacy,56 we find that people tend to believe that they can influencedecisions affecting local rather than national levels. In this regard, Bang’s distinctionbetween the local and global levels seems imprecise. Bang’s expectation that ExpertCitizens would feel more efficacious at both national and local levels than Everyday
55 Paxton, ‘Is Social Capital Declining in the United States?’ It is noted here that trust in parliament is low.This is probably due to the imprecise wording in the questionnaire on parliament, failing to differentiate parliamentas a political institution or as the behaviour of the politicians there. It could also be due to the fact that the twoitems (Politicians, Parliament) were asked one after another so that the respondents might have quickly associatedparliament with people running the parliament whose behaviour as covered in the media frequently fell short ofpeople’s expectations of them.
56 We use the term ‘efficacy’ in the sense of Campbell et al. as ‘the feeling that individual political action doeshave, or can have, an impact upon the political process … It is the feeling that political and social change is possibleand that the individual citizen can play a part in bringing about this change.’ Cited in Fahmy, ‘Ethnicity, Citizenshipand Political Participation’, p. 9.
New Forms of Political Participation 265
Makers has empirical support, but his notion that the latter would act locally, but thinkglobally, is ill-defined and hence hard to substantiate. The much higher levels of efficacyat the local than the national level suggest, unsurprisingly, that people feel that decisionmaking in Whitehall is remote, little influenced by their own efforts.57
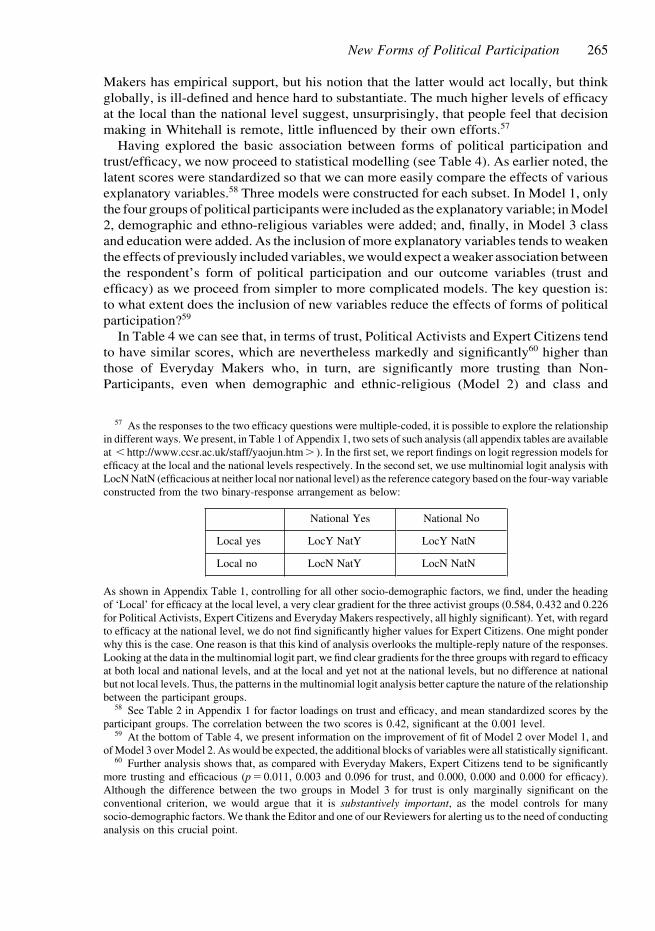
Having explored the basic association between forms of political participation andtrust/efficacy, we now proceed to statistical modelling (see Table 4). As earlier noted, thelatent scores were standardized so that we can more easily compare the effects of variousexplanatory variables.58 Three models were constructed for each subset. In Model 1, onlythe four groups of political participants were included as the explanatory variable; in Model2, demographic and ethno-religious variables were added; and, finally, in Model 3 classand education were added. As the inclusion of more explanatory variables tends to weakenthe effects of previously included variables, we would expect a weaker association betweenthe respondent’s form of political participation and our outcome variables (trust andefficacy) as we proceed from simpler to more complicated models. The key question is:to what extent does the inclusion of new variables reduce the effects of forms of politicalparticipation?59
In Table 4 we can see that, in terms of trust, Political Activists and Expert Citizens tendto have similar scores, which are nevertheless markedly and significantly60 higher thanthose of Everyday Makers who, in turn, are significantly more trusting than Non-Participants, even when demographic and ethnic-religious (Model 2) and class and
57 As the responses to the two efficacy questions were multiple-coded, it is possible to explore the relationshipin different ways. We present, in Table 1 of Appendix 1, two sets of such analysis (all appendix tables are availableat � http://www.ccsr.ac.uk/staff/yaojun.htm � ). In the first set, we report findings on logit regression models forefficacy at the local and the national levels respectively. In the second set, we use multinomial logit analysis withLocN NatN (efficacious at neither local nor national level) as the reference category based on the four-way variableconstructed from the two binary-response arrangement as below:
National Yes National No
Local yes LocY NatY LocY NatN
Local no LocN NatY LocN NatN
As shown in Appendix Table 1, controlling for all other socio-demographic factors, we find, under the headingof ‘Local’ for efficacy at the local level, a very clear gradient for the three activist groups (0.584, 0.432 and 0.226for Political Activists, Expert Citizens and Everyday Makers respectively, all highly significant). Yet, with regardto efficacy at the national level, we do not find significantly higher values for Expert Citizens. One might ponderwhy this is the case. One reason is that this kind of analysis overlooks the multiple-reply nature of the responses.Looking at the data in the multinomial logit part, we find clear gradients for the three groups with regard to efficacyat both local and national levels, and at the local and yet not at the national levels, but no difference at nationalbut not local levels. Thus, the patterns in the multinomial logit analysis better capture the nature of the relationshipbetween the participant groups.
58 See Table 2 in Appendix 1 for factor loadings on trust and efficacy, and mean standardized scores by theparticipant groups. The correlation between the two scores is 0.42, significant at the 0.001 level.
59 At the bottom of Table 4, we present information on the improvement of fit of Model 2 over Model 1, andof Model 3 over Model 2. As would be expected, the additional blocks of variables were all statistically significant.
60 Further analysis shows that, as compared with Everyday Makers, Expert Citizens tend to be significantlymore trusting and efficacious (p � 0.011, 0.003 and 0.096 for trust, and 0.000, 0.000 and 0.000 for efficacy).Although the difference between the two groups in Model 3 for trust is only marginally significant on theconventional criterion, we would argue that it is substantively important, as the model controls for manysocio-demographic factors. We thank the Editor and one of our Reviewers for alerting us to the need of conductinganalysis on this crucial point.
266 L I A N D M A R S H
TABLE 4 Regression Coefficients on Standardized Scores of Political Trust andEfficacy
Trust Efficacy
Model 1 Model 2 Model 3 Model 1 Model 2 Model 3
Political capitalPolitical Activist 0.192*** 0.230*** 0.141*** 0.492*** 0.475*** 0.363***Expert Citizen 0.220*** 0.242*** 0.143*** 0.336*** 0.331*** 0.211***Everyday Maker 0.135*** 0.144*** 0.089*** 0.210*** 0.205*** 0.136***Non-Participant (ref.)
Age16–24 0.013 � 0.106* � 0.027 � 0.140**25–39 � 0.045 � 0.123*** 0.107*** � 0.00640–59 � 0.075** � 0.123*** 0.088** 0.01960 � (ref.)
SexFemale 0.027 0.049* 0.020 0.049*Male (ref.)
Marital statusNever married 0.059 0.044 0.033 0.024Once married � 0.011 0.016 � 0.071** � 0.034Married (ref.)
EthnicityWhite (ref.)Black Caribbean � 0.193*** � 0.186*** 0.203*** 0.216***Black African 0.299*** 0.255*** 0.230*** 0.193***Indian 0.192* 0.175* 0.045 0.028Pakistani 0.207* 0.216* 0.105 0.120Bangladeshi 0.232* 0.268** 0.159 0.203†Chinese 0.428*** 0.352** � 0.005 � 0.066Other 0.203*** 0.178*** 0.056 0.036
ReligionChristian (ref.)Buddhist 0.018 0.014 0.521** 0.519**Hindu 0.127 0.109 0.106 0.088Jewish � 0.205 � 0.256 0.023 � 0.028Muslim 0.178* 0.194** 0.134 0.169†Sikh 0.077 0.089 0.178† 0.198†Other � 0.297*** � 0.323*** 0.091 0.066None � 0.084** � 0.098*** 0.003 � 0.014
ClassService 0.147*** 0.144***Intermediate 0.038 0.024Student 0.278*** 0.163**Working (ref.)
EducationDegree � 0.273*** 0.378***Diploma/A Level 0.118*** 0.213***Trade app/O Level 0.127*** 0.209***Primary/None (ref.)
Constant � 0.165*** � 0.154*** � 0.254*** � 0.218*** � 0.291*** � 0.422***R2 0.008 0.021 0.039 0.026 0.034 0.057Model comparison, F 17.40a*** 24.80b*** 8.33a*** 33.82b***N 15,418 15,395 15,395 15,418 15,395 15,395
Note: aRefers to terms in Model 2 that are additional to those in Model 1. bRefers to termsin Model 3 that are additional to those in Model 2. †p � 0.10, *p � 0.05, **p � 0.01,***p � 0.001.
New Forms of Political Participation 267
education (Model 3) are taken into account. The evidence here lends support to Bang’sdistinction between Expert Citizens and Everyday Makers. With regard to patternsassociated with socio-demographic factors, one could discern a somewhat concave shapefor age. Moreover, people from Black Caribbean origins, and those with ‘other’ or noreligious affiliations tend to have lower trust. Finally, people in higher class positions andwith higher educational qualifications in particular tend to have higher levels of trust,holding constant all other variables in the models.
Turning to data on efficacy in Table 4, we find, first of all, a much sharper gradientassociated with different forms of political participation than was the case with trust.Political Activists have higher scores than Expert Citizens, who in turn have (significantly– see fn. 60) higher scores than Everyday Makers, who in turn have significantly higherscores than Non-Participants. Moreover, as the scores on trust and efficacy arestandardized, one can clearly see that the magnitudes of coefficients on efficacy associatedwith each of the activist groups are higher than those on trust. In other words, differentforms of political participation seem to be more closely related to efficacy than to trust.The patterns here again lend support to the heuristic value of Bang’s distinction, althoughour development of his work resulting in a four-category variable appears more useful.
A comparison between the patterns on efficacy and those on trust as revealed by thevarious socio-demographic groups is also of interest here. While, for trust, age displaysa clearly concave shape as noted above, a somewhat convex shape is found for efficacy.That means that, as compared with the youngest and the oldest groups, those aged 25–59,are, other things being equal, less trusting, but believe themselves to be more efficacious.61
People of Black Caribbean origins are less trusting, but have more belief in their ownefficacy, than the White reference group. People of Black African origins are at oncetrusting and efficacious. As for the other ethnic groups, their patterns of higher levels oftrust do not hold for efficacy. The effects of class are similar in the two subsets, whilst thoseof education are stronger as regards efficacy than trust. The notable effects of education,which are of comparable sizes to those of forms of political participation, suggest thathighly educated people tend to have higher levels of information-processing, critical andanalytical abilities which are essential for political participation, just as they are for civicengagement.62
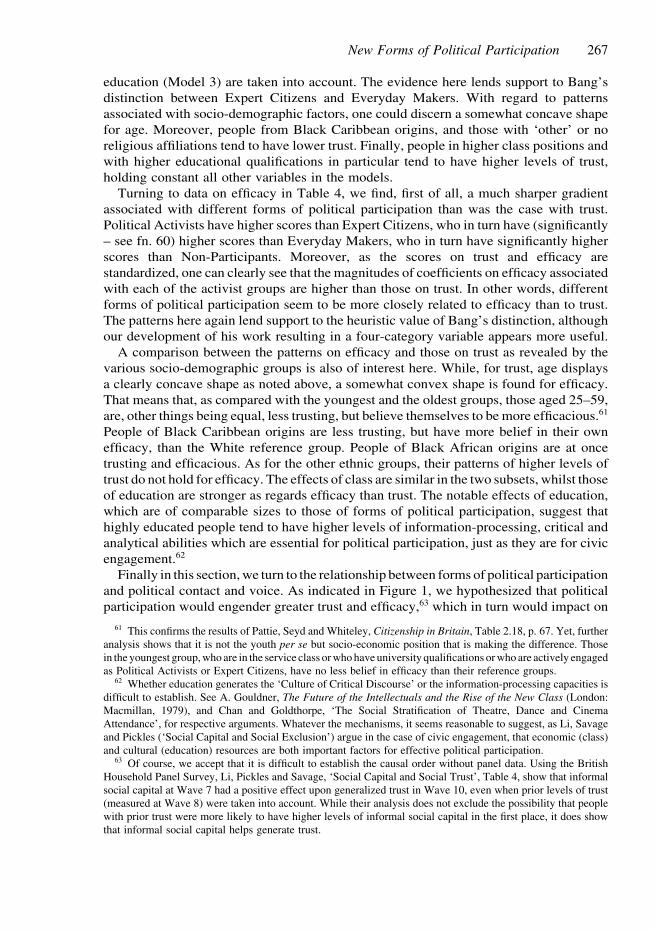
Finally in this section, we turn to the relationship between forms of political participationand political contact and voice. As indicated in Figure 1, we hypothesized that politicalparticipation would engender greater trust and efficacy,63 which in turn would impact on
61 This confirms the results of Pattie, Seyd and Whiteley, Citizenship in Britain, Table 2.18, p. 67. Yet, furtheranalysis shows that it is not the youth per se but socio-economic position that is making the difference. Thosein the youngest group, who are in the service class or who have university qualifications or who are actively engagedas Political Activists or Expert Citizens, have no less belief in efficacy than their reference groups.
62 Whether education generates the ‘Culture of Critical Discourse’ or the information-processing capacities isdifficult to establish. See A. Gouldner, The Future of the Intellectuals and the Rise of the New Class (London:Macmillan, 1979), and Chan and Goldthorpe, ‘The Social Stratification of Theatre, Dance and CinemaAttendance’, for respective arguments. Whatever the mechanisms, it seems reasonable to suggest, as Li, Savageand Pickles (‘Social Capital and Social Exclusion’) argue in the case of civic engagement, that economic (class)and cultural (education) resources are both important factors for effective political participation.
63 Of course, we accept that it is difficult to establish the causal order without panel data. Using the BritishHousehold Panel Survey, Li, Pickles and Savage, ‘Social Capital and Social Trust’, Table 4, show that informalsocial capital at Wave 7 had a positive effect upon generalized trust in Wave 10, even when prior levels of trust(measured at Wave 8) were taken into account. While their analysis does not exclude the possibility that peoplewith prior trust were more likely to have higher levels of informal social capital in the first place, it does showthat informal social capital helps generate trust.
268 L I A N D M A R S H
TABLE 5 Participation in Civic Activities in the Last Twelve Months (PercentageGiving Positive Answers)
Political Expert Everyday Non-Activist Citizen Maker Participant All
Contacted a public official workingfor your local council 28.1 22.0 14.8 9.5 14.8
Contacted a local councilor 20.2 13.7 9.1 5.3 9.2Contacted a Member of Parliament 14.4 8.7 5.1 2.0 5.2Contacted a public official working
for part of central government 8.7 5.0 2.4 1.0 2.8
Signed a petition 40.0 29.6 26.2 12.6 22.5Attended a public meeting or rally 20.8 12.7 6.7 2.1 7.0Taken part in a public demonstration
or protest 6.6 2.3 1.2 0.6 1.6
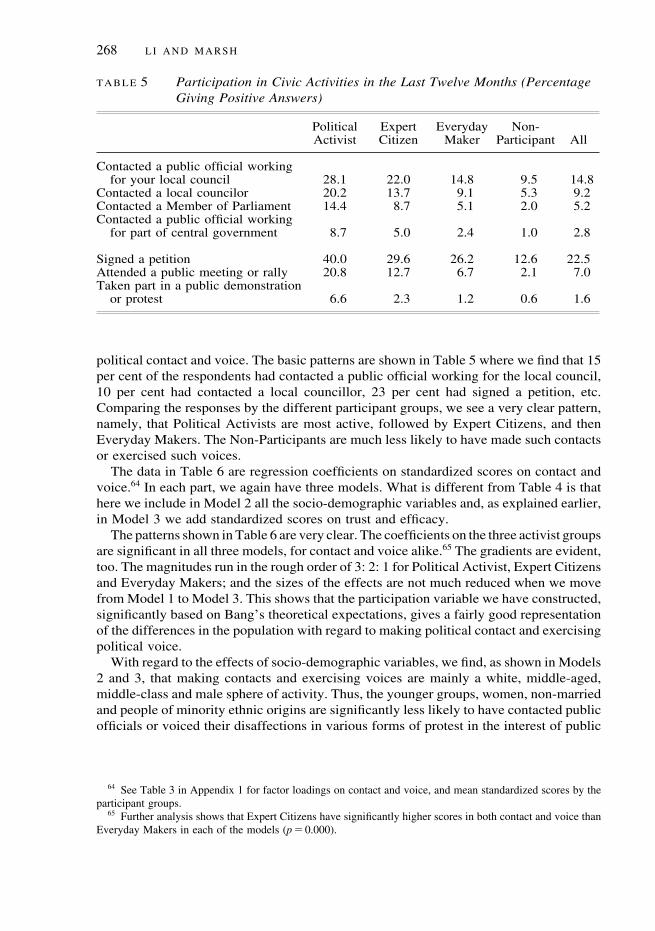
political contact and voice. The basic patterns are shown in Table 5 where we find that 15per cent of the respondents had contacted a public official working for the local council,10 per cent had contacted a local councillor, 23 per cent had signed a petition, etc.Comparing the responses by the different participant groups, we see a very clear pattern,namely, that Political Activists are most active, followed by Expert Citizens, and thenEveryday Makers. The Non-Participants are much less likely to have made such contactsor exercised such voices.
The data in Table 6 are regression coefficients on standardized scores on contact andvoice.64 In each part, we again have three models. What is different from Table 4 is thathere we include in Model 2 all the socio-demographic variables and, as explained earlier,in Model 3 we add standardized scores on trust and efficacy.
The patterns shown in Table 6 are very clear. The coefficients on the three activist groupsare significant in all three models, for contact and voice alike.65 The gradients are evident,too. The magnitudes run in the rough order of 3: 2: 1 for Political Activist, Expert Citizensand Everyday Makers; and the sizes of the effects are not much reduced when we movefrom Model 1 to Model 3. This shows that the participation variable we have constructed,significantly based on Bang’s theoretical expectations, gives a fairly good representationof the differences in the population with regard to making political contact and exercisingpolitical voice.
With regard to the effects of socio-demographic variables, we find, as shown in Models2 and 3, that making contacts and exercising voices are mainly a white, middle-aged,middle-class and male sphere of activity. Thus, the younger groups, women, non-marriedand people of minority ethnic origins are significantly less likely to have contacted publicofficials or voiced their disaffections in various forms of protest in the interest of public
64 See Table 3 in Appendix 1 for factor loadings on contact and voice, and mean standardized scores by theparticipant groups.
65 Further analysis shows that Expert Citizens have significantly higher scores in both contact and voice thanEveryday Makers in each of the models (p � 0.000).
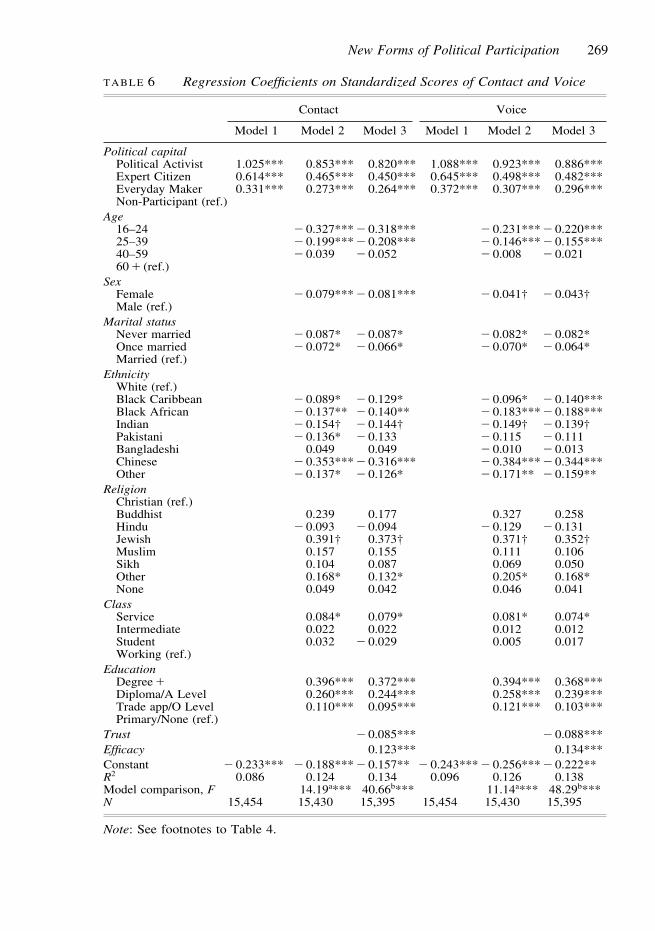
New Forms of Political Participation 269
TABLE 6 Regression Coefficients on Standardized Scores of Contact and Voice
Contact Voice
Model 1 Model 2 Model 3 Model 1 Model 2 Model 3
Political capitalPolitical Activist 1.025*** 0.853*** 0.820*** 1.088*** 0.923*** 0.886***Expert Citizen 0.614*** 0.465*** 0.450*** 0.645*** 0.498*** 0.482***Everyday Maker 0.331*** 0.273*** 0.264*** 0.372*** 0.307*** 0.296***Non-Participant (ref.)
Age16–24 � 0.327*** � 0.318*** � 0.231*** � 0.220***25–39 � 0.199*** � 0.208*** � 0.146*** � 0.155***40–59 � 0.039 � 0.052 � 0.008 � 0.02160 � (ref.)
SexFemale � 0.079*** � 0.081*** � 0.041† � 0.043†Male (ref.)
Marital statusNever married � 0.087* � 0.087* � 0.082* � 0.082*Once married � 0.072* � 0.066* � 0.070* � 0.064*Married (ref.)
EthnicityWhite (ref.)Black Caribbean � 0.089* � 0.129* � 0.096* � 0.140***Black African � 0.137** � 0.140** � 0.183*** � 0.188***Indian � 0.154† � 0.144† � 0.149† � 0.139†Pakistani � 0.136* � 0.133 � 0.115 � 0.111Bangladeshi 0.049 0.049 � 0.010 � 0.013Chinese � 0.353*** � 0.316*** � 0.384*** � 0.344***Other � 0.137* � 0.126* � 0.171** � 0.159**
ReligionChristian (ref.)Buddhist 0.239 0.177 0.327 0.258Hindu � 0.093 � 0.094 � 0.129 � 0.131Jewish 0.391† 0.373† 0.371† 0.352†Muslim 0.157 0.155 0.111 0.106Sikh 0.104 0.087 0.069 0.050Other 0.168* 0.132* 0.205* 0.168*None 0.049 0.042 0.046 0.041
ClassService 0.084* 0.079* 0.081* 0.074*Intermediate 0.022 0.022 0.012 0.012Student 0.032 � 0.029 0.005 0.017Working (ref.)
EducationDegree � 0.396*** 0.372*** 0.394*** 0.368***Diploma/A Level 0.260*** 0.244*** 0.258*** 0.239***Trade app/O Level 0.110*** 0.095*** 0.121*** 0.103***Primary/None (ref.)
Trust � 0.085*** � 0.088***Efficacy 0.123*** 0.134***Constant � 0.233*** � 0.188*** � 0.157** � 0.243*** � 0.256*** � 0.222**R2 0.086 0.124 0.134 0.096 0.126 0.138Model comparison, F 14.19a*** 40.66b*** 11.14a*** 48.29b***N 15,454 15,430 15,395 15,454 15,430 15,395
Note: See footnotes to Table 4.
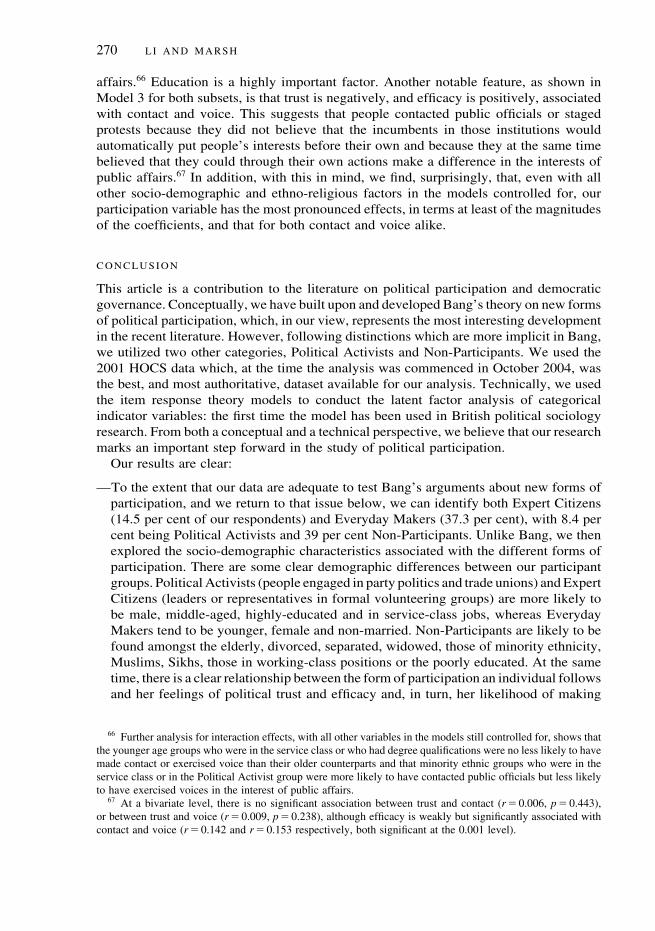
270 L I A N D M A R S H
affairs.66 Education is a highly important factor. Another notable feature, as shown inModel 3 for both subsets, is that trust is negatively, and efficacy is positively, associatedwith contact and voice. This suggests that people contacted public officials or stagedprotests because they did not believe that the incumbents in those institutions wouldautomatically put people’s interests before their own and because they at the same timebelieved that they could through their own actions make a difference in the interests ofpublic affairs.67 In addition, with this in mind, we find, surprisingly, that, even with allother socio-demographic and ethno-religious factors in the models controlled for, ourparticipation variable has the most pronounced effects, in terms at least of the magnitudesof the coefficients, and that for both contact and voice alike.
CONCLUSION
This article is a contribution to the literature on political participation and democraticgovernance. Conceptually, we have built upon and developed Bang’s theory on new formsof political participation, which, in our view, represents the most interesting developmentin the recent literature. However, following distinctions which are more implicit in Bang,we utilized two other categories, Political Activists and Non-Participants. We used the2001 HOCS data which, at the time the analysis was commenced in October 2004, wasthe best, and most authoritative, dataset available for our analysis. Technically, we usedthe item response theory models to conduct the latent factor analysis of categoricalindicator variables: the first time the model has been used in British political sociologyresearch. From both a conceptual and a technical perspective, we believe that our researchmarks an important step forward in the study of political participation.
Our results are clear:
—To the extent that our data are adequate to test Bang’s arguments about new forms ofparticipation, and we return to that issue below, we can identify both Expert Citizens(14.5 per cent of our respondents) and Everyday Makers (37.3 per cent), with 8.4 percent being Political Activists and 39 per cent Non-Participants. Unlike Bang, we thenexplored the socio-demographic characteristics associated with the different forms ofparticipation. There are some clear demographic differences between our participantgroups. Political Activists (people engaged in party politics and trade unions) and ExpertCitizens (leaders or representatives in formal volunteering groups) are more likely tobe male, middle-aged, highly-educated and in service-class jobs, whereas EverydayMakers tend to be younger, female and non-married. Non-Participants are likely to befound amongst the elderly, divorced, separated, widowed, those of minority ethnicity,Muslims, Sikhs, those in working-class positions or the poorly educated. At the sametime, there is a clear relationship between the form of participation an individual followsand her feelings of political trust and efficacy and, in turn, her likelihood of making
66 Further analysis for interaction effects, with all other variables in the models still controlled for, shows thatthe younger age groups who were in the service class or who had degree qualifications were no less likely to havemade contact or exercised voice than their older counterparts and that minority ethnic groups who were in theservice class or in the Political Activist group were more likely to have contacted public officials but less likelyto have exercised voices in the interest of public affairs.
67 At a bivariate level, there is no significant association between trust and contact (r � 0.006, p � 0.443),or between trust and voice (r � 0.009, p � 0.238), although efficacy is weakly but significantly associated withcontact and voice (r � 0.142 and r � 0.153 respectively, both significant at the 0.001 level).
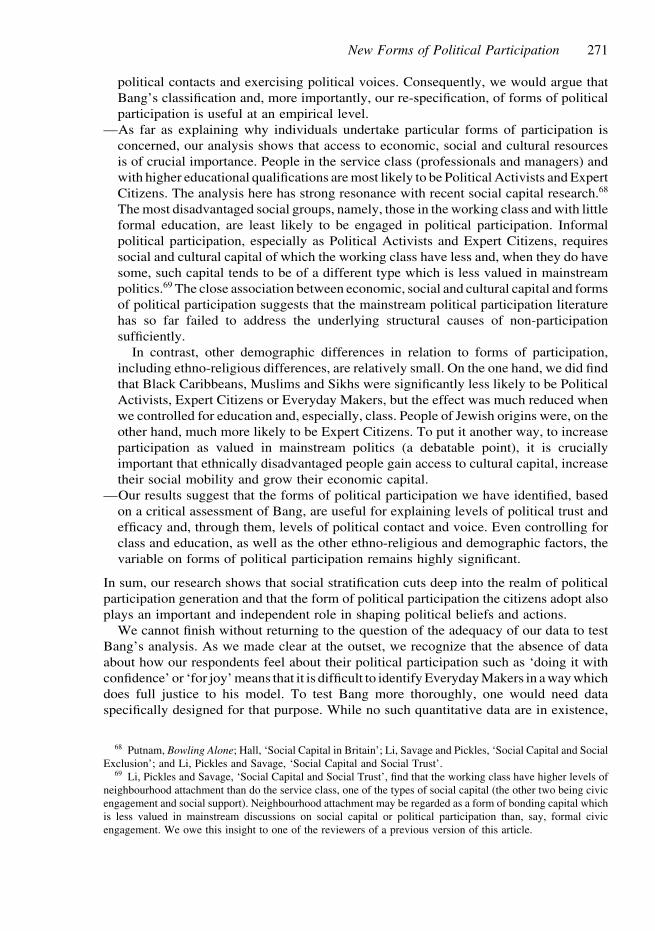
New Forms of Political Participation 271
political contacts and exercising political voices. Consequently, we would argue thatBang’s classification and, more importantly, our re-specification, of forms of politicalparticipation is useful at an empirical level.
—As far as explaining why individuals undertake particular forms of participation isconcerned, our analysis shows that access to economic, social and cultural resourcesis of crucial importance. People in the service class (professionals and managers) andwith higher educational qualifications are most likely to be Political Activists and ExpertCitizens. The analysis here has strong resonance with recent social capital research.68
The most disadvantaged social groups, namely, those in the working class and with littleformal education, are least likely to be engaged in political participation. Informalpolitical participation, especially as Political Activists and Expert Citizens, requiressocial and cultural capital of which the working class have less and, when they do havesome, such capital tends to be of a different type which is less valued in mainstreampolitics.69 The close association between economic, social and cultural capital and formsof political participation suggests that the mainstream political participation literaturehas so far failed to address the underlying structural causes of non-participationsufficiently.
In contrast, other demographic differences in relation to forms of participation,including ethno-religious differences, are relatively small. On the one hand, we did findthat Black Caribbeans, Muslims and Sikhs were significantly less likely to be PoliticalActivists, Expert Citizens or Everyday Makers, but the effect was much reduced whenwe controlled for education and, especially, class. People of Jewish origins were, on theother hand, much more likely to be Expert Citizens. To put it another way, to increaseparticipation as valued in mainstream politics (a debatable point), it is cruciallyimportant that ethnically disadvantaged people gain access to cultural capital, increasetheir social mobility and grow their economic capital.
—Our results suggest that the forms of political participation we have identified, basedon a critical assessment of Bang, are useful for explaining levels of political trust andefficacy and, through them, levels of political contact and voice. Even controlling forclass and education, as well as the other ethno-religious and demographic factors, thevariable on forms of political participation remains highly significant.
In sum, our research shows that social stratification cuts deep into the realm of politicalparticipation generation and that the form of political participation the citizens adopt alsoplays an important and independent role in shaping political beliefs and actions.
We cannot finish without returning to the question of the adequacy of our data to testBang’s analysis. As we made clear at the outset, we recognize that the absence of dataabout how our respondents feel about their political participation such as ‘doing it withconfidence’ or ‘for joy’ means that it is difficult to identify Everyday Makers in a way whichdoes full justice to his model. To test Bang more thoroughly, one would need dataspecifically designed for that purpose. While no such quantitative data are in existence,
68 Putnam, Bowling Alone; Hall, ‘Social Capital in Britain’; Li, Savage and Pickles, ‘Social Capital and SocialExclusion’; and Li, Pickles and Savage, ‘Social Capital and Social Trust’.
69 Li, Pickles and Savage, ‘Social Capital and Social Trust’, find that the working class have higher levels ofneighbourhood attachment than do the service class, one of the types of social capital (the other two being civicengagement and social support). Neighbourhood attachment may be regarded as a form of bonding capital whichis less valued in mainstream discussions on social capital or political participation than, say, formal civicengagement. We owe this insight to one of the reviewers of a previous version of this article.
272 L I A N D M A R S H
our claim here is that we have used the best data available and that our work has conceptualcogency and empirical support. It is particularly important to emphasize that ourclassification of forms of participation/types of participant has empirical purchase in a wayBang would expect, namely, that Expert Citizens feel less efficacious than PoliticalActivists, but are significantly more trusting and efficacious than Everyday Makers; andthat they use contact and voice more than Everyday Makers. So, we would argue thatBang’s work and our development of it deserve further attention.