new developments in the field of anti-psma tracers for...
TRANSCRIPT

7-7-2017
New Developments in the Field of anti-PSMA Tracers for mCRPC and
Bioanalysis of [68Ga]Ga-PSMA-11 in Human Plasma and Human
Microsomes
Kamp, J UNIVERSITAIR MEDISCH CENTRUM GRONINGEN

Kamp, J
MASTER THESIS MEDICAL PHARMACEUTICAL SCIENCES

Kamp, J
MASTER THESIS MEDICAL PHARMACEUTICAL SCIENCES
Medical Pharmaceutical Sciences
Faculty of Science & Engineering
Master Thesis:
New Developments in the Field of anti-PSMA
Tracers for mCRPC and Bioanalysis of [68Ga]Ga-PSMA-11 in Human Plasma and Human
Microsomes
Author: Jasper Kamp (s1853155)
July 2017
Supervisors: Dr. G. Luurtsema (UMCG) Dr. H.H. Boersma (UMCG)
MPS Examiner:
Dr. ir. I.A.M. de Graaf (RuG)

Kamp, J
MASTER THESIS MEDICAL PHARMACEUTICAL SCIENCES
Table of Contents
Prologue ........................................................................................................................................................................... 6
General introduction .................................................................................................................................................. 7
References .................................................................................................................................................................. 8
Chapter I ....................................................................................................................................................................... 10
Abstract .................................................................................................................................................................... 11
1. Introduction....................................................................................................................................................... 11
2. Methods ............................................................................................................................................................... 12
2.1 Literature acquisition ............................................................................................................................ 12
2.2 PubMed searches ..................................................................................................................................... 12
2.3 Inclusion and Exclusion criteria ........................................................................................................ 12
2.4 Literature selection ................................................................................................................................. 13
3. Results.................................................................................................................................................................. 13
4. 64Cu-labeled tracers for prostate cancer imaging and therapy .................................................... 13
4.1 Recent developments in 64Cu-labeling and Copper-64 anti-PSMA tracers ...................... 13
4.2 Preclinical studies .................................................................................................................................... 14
4.3 Clinical studies .......................................................................................................................................... 15
4.4 Comparison with the gold standard: [68Ga]Ga-PSMA-11 ........................................................ 15
5. 18F-labeled tracers for prostate cancer imaging ................................................................................. 17
5.1 Recent developments in 18F-labeling and Fluorine-18 anti-PSMA tracers ...................... 17
5.2 Pre-clinical studies .................................................................................................................................. 18
5.3 Clinical studies .......................................................................................................................................... 20
5.4 Comparison with the gold standard: [68Ga]Ga-PSMA-11 ........................................................ 21
6. 177Lu-labeled tracers for prostate cancer imaging and therapy .................................................. 22
6.1 Recent developments in 177Lu-labeling and 177Lu- PSMA tracers ........................................ 22
6.2 Pre-clinical studies .................................................................................................................................. 23
6.3 Clinical studies .......................................................................................................................................... 24
7. Outcomes and future perspectives ......................................................................................................... 25
7.1 Theranostic couples ................................................................................................................................ 25
7.2 Shortcomings in the current tracer development process ..................................................... 25
7.3 Future perspectives ................................................................................................................................ 28
8. Conclusions ........................................................................................................................................................ 28
9. References .......................................................................................................................................................... 29
Chapter II ...................................................................................................................................................................... 31
Abstract .................................................................................................................................................................... 32
1. Introduction....................................................................................................................................................... 32
2. Methods ............................................................................................................................................................... 33
2.1 Software ....................................................................................................................................................... 33

Kamp, J
MASTER THESIS MEDICAL PHARMACEUTICAL SCIENCES
2.2 [68Ga]Ga-PSMA-11 preparation ......................................................................................................... 33
2.3 Bioanalysis .................................................................................................................................................. 33
2.4 Metabolism and stability ...................................................................................................................... 36
3. Results.................................................................................................................................................................. 37
3.1 Bioanalysis .................................................................................................................................................. 37
3.2 Metabolism and Stability ...................................................................................................................... 47
4. Discussion........................................................................................................................................................... 48
4.1 Bioanalysis .................................................................................................................................................. 50
4.2 Metabolism ................................................................................................................................................. 53
4.3 Study limitations and Future studies .............................................................................................. 54
5. Conclusions ........................................................................................................................................................ 56
6. References .......................................................................................................................................................... 56
Appendices ...................................................................................................................................................................... I
Appendix I: PSMA-11 calibration chromatograms and calculations ................................................ II
Appendix II: SOP microsome studies ............................................................................................................ XI
Appendix III: Overview sample sequence for recovery studies ..................................................... XIX
Appendix IV: Raw data recovery studies ................................................................................................... XX
Appendix V: LC/MS-TOF settings ............................................................................................................. XXIII
Appendix VI: LC/MS/MS settings ............................................................................................................. XXIV
Appendix VII: LC/MS/MS transitions ....................................................................................................... XXV
Appendix VIII: LC/MS/MS mass chromatograms: XBridge column ....................................... XXVIII
Appendix IX: UPLC chromatograms PSMA-11 and natGa-PSMA-11 ............................................ XXXI
Appendix X: Raw data in vitro metabolic stability studies ........................................................... XXXII
Appendix XI: Raw data patient studies ....................................................................................................... XL
Appendix XII: LC/MS-TOF calibration data with natGa-PSMA-11 .................................................. XLV

Kamp, J
MASTER THESIS MEDICAL PHARMACEUTICAL SCIENCES
6 | P a g e
Prologue
lthough prostate cancer is a disease only seen in (elderly) men, it is responsible for a high dis-ease burden on our society. In 2012, 1,1 million new cases were diagnosed worldwide and –despite several major advances in prostate cancer diagnosis, staging and therapy – an estimated
307 000 men died because of this disease worldwide in 2012. These numbers indicate the need for improved tools to battle prostate cancer. One of these tools is
positron emission tomography (PET) combined with computed tomography (CT). PET/CT is a relative-ly new method that can be used for the diagnosis and staging of prostate cancer. This method relies on the accumulation of a radioactive tracer in target tissues, which can then be detected and localised with the PET scan. The combination of the PET with CT enables medical professionals to obtain de-tailed information about tumour location and/or staging.
In this thesis, we will be discussing several of the most promising new developments in the field of radio tracers for prostate cancer and try to elucidate what makes these new developments different from the current gold standard for prostate cancer PET imaging: [68Ga]Ga-PSMA-11.
The second chapter of this thesis will discuss several of the fist studies concerning the bioanalysis and metabolism of [68Ga]Ga-PSMA-11. This tracer was first described in 2012, after which it evolved ̶ only within a matter of years ̶ to become the gold standard for metastatic prostate cancer PET imag-ing.
Eventually, the findings discussed in this thesis may serve as a basis for future studies, aimed at de-veloping new PET tracers for prostate cancer or studies that aim to increase our knowledge concerning tracer metabolism.
A

Kamp, J
MASTER THESIS MEDICAL PHARMACEUTICAL SCIENCES
7 | P a g e
General introduction
rostate cancer (PCa) is the second most often diagnosed type of cancer worldwide, and it is the most common type of non-skin cancer in males above 70 years of age (1,2) with an estimated 1,1 million new cases and 307 000 deaths in 2012 (3). Geographical and racial/ethnic factors are
shown to be important variables for the incidence rates of PCa, with the highest incidence rates in Af-ro-Americans and the lowest incidence rates in Asians (1). The incidental detection of PCa via Trans Urethral Resection of the Prostate (TURP) in patients with benign prostate hyperplasia and later the upcoming of prostate specific antigen (PSA) testing, have both influenced the temporary increase in the detection rates of PCa in high-income countries (1,4,5).
Epidemiological studies have shown strong evidence for the role of genetic predisposition to PCa. Approximately 9% of the PCa patients have a form of hereditary PCa. Furthermore, patients with he-reditary PCa often show an earlier upset of the disease than patients who do not suffer from hereditary PCa (6). In addition, other, non-genetic factors, such as sexual behaviour, diet and alcohol consumption have shown to influence the disease progression (7,8). However, there is yet insufficient evidence to define certain lifestyle changes that would decrease the risk of developing clinical PCa (2).
To be able to compare different patients and treatment outcomes, several staging systems are pro-posed for PCa. A widely-used method for staging PCa is the Gleason grading. The Gleason grading sys-tem is based solely on the architectural pattern of the PCa tumour and is determined by the most abundant pattern and the second most abundant pattern (9). When more than two types of grades are found in tumour tissue, the Gleason score is determined by the highest grade and by the most abun-dant grade (2).
PCa is most commonly found in patients by a digital rectal examination (DRE) or by elevated pros-tate specific antigen (PSA) levels. Approximately 18% of the PCa cases is diagnosed by DRE only, with-out consideration of PSA levels (10). Since most PCas are situated in the peripheral zone (zone of the prostate located closest to the rectum), these cancers may be detected by DRE when the volume of the cancer is ≥0,2 ml (2). Studies showed that PCas found by DRE are often associated with aggressive forms of PCa (Gleason score ≥ 7)(11,12). Therefore, an abnormal DRE is an indication for a prostate biopsy (2). A prostate biopsy may be indicated when abnormal PSA levels are found or/and when abnormalities are found by DRE (2) to confirm the diagnosis of PCa. In addition, a risk assessment can be performed to reduce the number of unnecessary biopsies (13).
The introduction of PSA as a biomarker for the diagnosis has drastically changed the way of diag-nosing PCa. PSA is an antigen produced by the prostate, which generally reaches blood concentrations of maximum 4 ng/ml in men without PCa (14,15). However, studies have shown that in some cases no PSA elevation is seen, despite the presence of PCa (15,16). In contrast, since PSA is an organ specific marker, but not a cancer specific marker, elevated PSA levels may also be found in patients with non-malignant conditions of the prostate, such as BPH (2).
Another important tool for diagnosis and staging of PCa is imaging. Multiparametric magnetic reso-nance imaging (mpMRI) is a sensitive tool for the detection and localization of high risk PCa (Gleason ≥ 7)(17,18). Although mpMRI currently is an important method for the staging and the localization of specific types of high-risk PCa, the results are still largely influenced by the experience of the reader (2). This is shown by the large inter-reader variability (19). Therefore, new and more sensitive imaging methods are needed, to be able to accurately localize and stage PCa lesions.
A relatively new development in the field of PCa imaging is the upcoming of PET/CT. Examples of PCa tracers for PET/CT are 11C- or 18F-Choline, 18F-FDG or 18F-acetate (20,21), all of which are targeting tumour tissue, based on metabolic changes in these tissues. Although PET/CT imaging with such trac-ers can provide useful information about tumour biology and diversity (21), the sensitivity and speci-ficity of many of these radiotracers are highly variable between studies (2,21). An example of a tracer which shows such a high variability, is choline PET/CT, for which the sensitivity for the detection of nodal metastases varies from 10% to 73%(2).
Targeting the prostate specific membrane antigen (PSMA), also known as glutamate carboxypepti-dase II (22), is shown to be a promising method to specifically target PCa tumours (21). PSMA is a transmembrane protein of which the largest part, which also includes the binding motif, is situated in the extracellular domain (23). Since almost 95% of the PCa cells overexpress PSMA (24), it is a promis-ing target for tracers. Especially the 68Ga-labeled small molecule PSMA inhibitor showed promising results with a higher sensitivity than 18F-choline PET/CT in patients with recurrent PCa (21,25). This small molecule PSMA inhibitor , also known as PSMA-11, consists out of a Glu-urea-Lys motif, com-bined with a N,N′-bis [2-hydroxy-5-(carboxyethyl)benzyl] ethylenediamine- N,N′- diacetic acid (HBED-CC) chelator , to bind the 68Ga (fig. 1)(26).
P

Kamp, J
MASTER THESIS MEDICAL PHARMACEUTICAL SCIENCES
8 | P a g e
[68Ga]Ga-PSMA-11 was first described by M. Eder et. al. in 2012 (26). Only a few years after this first report, [68Ga]Ga-PSMA-11 is considered to be the gold standard as it comes to PET/CT imaging of metastatic castrate resistant prostate cancer (mCRPC). However, no reports addressing the [68Ga]Ga-PSMA-11 metabolism and pharmaco-kinetics (PK) are published. Furthermore, although [68Ga]Ga-PSMA-11 is a significant leap forward compared to the older types of tracers – such as 18F-choline – a new generation of promising tracers is already on its way.
This thesis is divided in two chapters. In the first chapter of this thesis, we will discuss sev-eral exciting, new developments in the field of PET radiotracers. In addition, this chapter will be used to address a very important shortcoming in the ‘standard’ way newly developed PET-tracers are being evaluated – namely the lack of decent metabolism and PK studies. As will be discussed in more detail later in this thesis, a broad understanding of tracer metabolism and PK may greatly benefit the interpretation of imaging data. Therefore, the second chapter in this thesis will discuss the several of the first studies addressing the metabolism of [68Ga]Ga-PSMA-11. These studies are the first steps of a larger research project, that is aimed to eventually elucidate the metabolism and PK of the [68Ga]Ga-PSMA-11 tracer.
References
1. Zhou CK, Check DP, Lortet-Tieulent J, Laversanne M, Jemal A, Ferlay J, et al. Prostate cancer incidence in 43 populations worldwide: An analysis of time trends overall and by age group. Int J Cancer. 2016;138(6):1388–400.
2. Heidenreich A, Aus G, Bolla M, Joniau S, Matveev VB, Schmid HP, et al. EAU Guidelines on Prostate Cancer. Eur Urol [Internet]. 2016 Jan;53(1):68–80. Available from: http://www.uroweb.org/fileadmin/tx_eauguidelines/2005/Pocket/Prostate_Cancer.pdf
3. Ferlay J, Soerjomataram I, Dikshit R, Eser S, Mathers C, Rebelo M, et al. Cancer incidence and mortality worldwide: sources, methods and major patterns in GLOBOCAN 2012. Int J cancer [Internet]. 2015 Mar 1;136(5):E359-86. Available from: http://arxiv.org/abs/1011.1669
4. Potosky AL, Miller BA, Albertsen PC, Kramer BS. The Role of Increasing Detection in the Rising Incidence of Prostate Ca ... The Role of Increasing Detection in the Rising Incidence of Prostate Cancer. Jama. 1995;7344:20892.
5. Potosky AL, Kessler L, Gridley G, Brown C, Horm W. Rise in Prostatic Cancer Incidence Associted With Increased Use of Transurethral Resection. J Natl Cancer Inst. 1991;
6. Hemminki K. Familial risk and familial survival in prostate cancer. World J Urol [Internet]. 2012 Apr 25;30(2):143–8. Available from: http://link.springer.com/10.1007/s00345-011-0801-1
7. Leitzmann M, Rohrmann S. Risk factors for the onset of prostatic cancer: age, location, and behavioral correlates. Clin Epidemiol [Internet]. 2012 Jan;4(1):1. Available from: http://www.dovepress.com/risk-factors-for-the-onset-of-prostatic-cancer-age-location-and-behavi-peer-reviewed-article-CLEP
8. Attard G, Parker C, Eeles RA, Schröder F, Tomlins SA, Tannock I, et al. Prostate cancer. Lancet (London, England) [Internet]. 2016 Jan 2;387(10013):70–82. Available from: http://www.sciencedirect.com/science/article/pii/S1357303915002662
9. Epstein JI, Allsbrook WCJ, Amin MB, Egevad LL. The 2005 International
Society of Urological Pathology (ISUP) Consensus Conference on Gleason Grading of Prostatic Carcinoma. Am J Surg Pathol [Internet]. 2005;29(9):1228–42. Available from: http://www.ncbi.nlm.nih.gov/pubmed/26492179
10. Richie JP, Catalona WJ, Ahmann FR, Hudson MA, Scardino PT, Flanigan RC, et al. Effect of patient age on early detection of prostate cancer with serum prostate-specific antigen and digital rectal examination. Urology. 1993;42(4):365–74.
11. Okotie OT, Roehl KA, Han M, Loeb S, Gashti SN, Catalona WJ. Characteristics of Prostate Cancer Detected by Digital Rectal Examination Only. Urology. 2007;70(6):1117–20.
12. Gosselaar C, Roobol MJ, Roemeling S, Schröder FH. The Role of the Digital Rectal Examination in Subsequent Screening Visits in the European Randomized Study of Screening for Prostate Cancer (ERSPC), Rotterdam. Eur Urol. 2008;54(3):581–8.
13. Schmid M, Trinh Q-D, Graefen M, Fisch M, Chun FK, Hansen J. The role of biomarkers in the assessment of prostate cancer risk prior to prostate biopsy: Which markers matter and how should they be used? World J Urol [Internet]. 2014 Aug 14;32(4):871–80. Available from: http://link.springer.com/10.1007/s00345-014-1317-2
14. Society AC. http://www.cancer.org/ [Internet]. 2016. Available from: http://www.cancer.org/cancer/prostatecancer/moreinformation/prostatecancerearlydetection/prostate-cancer-early-detection-tests
15. Sasaki M, Ishidoya S, Ito A, Saito H, Yamada S, Mitsuzuka K, et al. Low Percentage of Free Prostate-specific Antigen (PSA) Is a Strong Predictor of Later Detection of Prostate Cancer Among Japanese Men With Serum Levels of Total PSA of 4.0 ng/mL or Less. Urology [Internet]. 2014 Nov;84(5):1163–7. Available from: http://dx.doi.org/10.1016/j.urology.2014.04.055
16. Thompson IM, Pauler DK, Goodman PJ, Tangen CM, Lucia SPHM, Parnes HL, et al. Prevalence of Prostate Cancer among Men with a Prostate-Specific Antigen Level ≤ 4.0 ng per Milliliter. N Engl J Med [Internet]. 2004 Jul 14;350. Available from: http://www.ncbi.nlm.nih.gov/pubmed/16014882
Fig. 1: Chemical structure of the small molecule PSMA-11. Adopted from M. Eder et.al. (26).

Kamp, J
MASTER THESIS MEDICAL PHARMACEUTICAL SCIENCES
9 | P a g e
17. Turkbey B, Pinto PA, Mani H, Bernardo M, Pang Y, McKinney YL, et al. Prostate cancer: value of multiparametric MR imaging at 3 T for detection--histopathologic correlation. Radiology [Internet]. 2010;255(1):89–99. Available from: http://www.pubmedcentral.nih.gov/articlerender.fcgi?artid=2843833&tool=pmcentrez&rendertype=abstract
18. Bratan F, Niaf E, Melodelima C, Chesnais AL, Souchon R, Mège-Lechevallier F, et al. Influence of imaging and histological factors on prostate cancer detection and localisation on multiparametric MRI: A prospective study. Eur Radiol. 2013;23(7):2019–29.
19. Heijmink SWTPJ, Fütterer JJ, Hambrock T, Takahashi S, Scheenen TWJ, Huisman HJ, et al. Prostate cancer: body-array versus endorectal coil MR imaging at 3 T--comparison of image quality, localization, and staging performance. Radiology. 2007;244(1):184–95.
20. Jadvar H. Molecular Imaging of Prostate Cancer: PET Radiotracers. Natl Inst Heal. 2012;199(2):278–91.
21. Wibner AG, Burger IA, Sala E, Hricak H, Weber WA, Vargas HA. Molecular Imaging of Prostate Cancer. Radiographics. 2016;36(1):142–59.
22. Weineisen M, Schottelius M, Simecek J, Baum RP, Yildiz A, Beykan S, et al. 68Ga- and 177Lu-Labeled PSMA I&T: Optimization of a PSMA-Targeted
Theranostic Concept and First Proof-of-Concept Human Studies. J Nucl Med [Internet]. 2015;56(8):1169–76. Available from: http://www.ncbi.nlm.nih.gov/pubmed/26089548
23. Ristau BT, O’Keefe DS, Bacich DJ. The prostate-specific membrane antigen: Lessons and current clinical implications from 20 years of research. Urol Oncol Semin Orig Investig [Internet]. 2014;32(3):272–9. Available from: http://dx.doi.org/10.1016/j.urolonc.2013.09.003
24. Liolios C, Schäfer M, Haberkorn U, Eder M, Kopka K. Novel Bispecific PSMA/GRPr Targeting Radioligands with Optimized Pharmacokinetics for Improved PET Imaging of Prostate Cancer. Bioconjug Chem. 2016;27(3):737–51.
25. Morigi JJ, Stricker PD, van Leeuwen PJ, Tang R, Ho B, Nguyen Q, et al. Prospective Comparison of 18F-Fluoromethylcholine Versus 68Ga-PSMA PET/CT in Prostate Cancer Patients Who Have Rising PSA After Curative Treatment and Are Being Considered for Targeted Therapy. J Nucl Med [Internet]. 2015;56(8):1185–90. Available from: http://www.ncbi.nlm.nih.gov/pubmed/26112024
26. Eder M, Schäfer M, Bauder-Wüst U, Hull WE, Wängler C, Mier W, et al. 68Ga-complex lipophilicity and the targeting property of a urea-based PSMA inhibitor for PET imaging. Bioconjug Chem. 2012;23(4):688–97.

10 | P a g e
Chapter I
The Role of Lutetium-177, Copper-64 and Fluorine-18 in state of the art Theranostic
PSMA Targeting Tracers for Prostate Cancer: A Systematic Review

Kamp, J
SYSTEMATIC REVIEW
11 | P a g e
Abstract
In this review, we discuss several state-of-the-art, PSMA targeting radiotracers for the imaging and/or radiotherapy of prostate cancer (PCa). We mainly focus on the most recent developments in the field of 18F-, 64Cu- and 177Lu-labeled anti-PSMA tracers, since these types of tracers have the poten-tial to form new theranostic couples with Gallium-68 tracers (Lutetium-177 and Copper-64) or to ena-ble improved PET image quality, compared to [68Ga]Ga-PSMA-11 (Copper-64 and Fluorine-18). Fur-thermore, we aim to compare several of these tracers with the current gold standard for metastatic castration resistant prostate cancer (mCRPC) PET imaging, [68Ga]Ga-PSMA-11.
PubMed was systematically searched for relevant articles concerning Fluorine-18, Copper-64, Lute-tium-177, PSMA and prostate cancer. Duplicates, reviews and publications that were not relevant, were excluded. In addition, secondary references were acquired by including relevant references from the initial literature selection.
Initially, 769 articles were acquired from PubMed, including 498 unique articles. After screening for exclusion and inclusion criteria, 37 relevant articles were acquired. In addition, 16 articles were ob-tained by screening the included articles for relevant references.
177Lu-labeled PSMA conjugates showed promising results for radionuclide therapy (RNT) in heavily pre-treated patients. 18F- and 64Cu-labeled PSMA tracers showed promising results for PET imaging of mCRPC. Furthermore, 64Cu-labeled PSMA tracers are potential candidates for future RNT. For the fu-ture, radiolabeled PSMA inhibitors are likely to have a large impact on the treatment and diagnosis of prostate cancer. However, more extensive pharmacokinetic and metabolic studies are needed to better understand the behaviour of these tracers in the human body and to be able to optimize their use, pos-sibly in combination with other targeting tracers such as GRPR.
Keywords: PSMA, Lutetium-177, Copper-64, Fluorine-18, prostate cancer, PET
1. Introduction
PET/CT imaging is a relatively new imaging technique, which uses tracers such as 11C- or 18F- labeled choline, 18F-labeled FDG or 18F-labeled acetate to image cancer lesions (1,2). This type of imaging is useful for selecting patients with biochemical relapse after previous radio-therapy (3). The mechanism of action of these conven-tional tracers is mainly based on changes in metabolism in cancer cells. However, since these modalities are not only cancer specific, uptake can also be observed in inflammatory tissue, benign tumours or benign pros-tate hyperplasia (2). Therefore, tracers that specifically target cancer tissues are needed. In addition, although PET/CT imaging with these tracers can provide useful information about tumour biology and diversity (2), the sensitivity and specificity of many of these conventional tracers are highly variable between studies (3,2).
Targeting the prostate specific membrane antigen (PSMA), also known as glutamate carboxypeptidase II (4), is shown to be a promising method to target PCa tumours (2). PSMA is overexpressed on PCa cells and in the neovasculature of other types of cancer, such as breast cancer, bladder cancer and glioblastomas (5). Furthermore, it is expressed, although to a smaller ex-tent, in the kidneys, salivary glands and in the small
intestine (6). PSMA is a promising target for tracers, because almost 95% over the PCa cells overexpress PSMA (7). However, PSMA negative areas can someti-mes be observed in PSMA positive tumours, because of the high heterogeneity of the tumours (7). The high heterogeneity of the tumours can complicate PCa imag-ing, since it can affect the image quality. Therefore, targets such as the gastrin-releasing peptide receptor (GRPr) may be used complementary to PSMA, to be able to additionally image the PSMA-negative regions. In addition, the GRPr expression is shown to be increased in early stage PCa, while PSMA expression is mainly enhanced in the later stages of PCa (8).
Only a few years after the introduction of [68Ga]Ga-PSMA-11 (9) , this tracer is considered to be the gold standard if it comes to the PET imaging of metastatic castrate resistant prostate cancer (mCRPC) patients. Although results from studies concerning [68Ga]Ga-PSMA-11 are promising, the tracer also has some limi-tations. Examples of these are the relatively short half-life, and the high β+ energy in comparison to other iso-topes such as Fluorine-18 and Copper-64. Therefore, new PSMA targeting tracers are being developed (4,10–12). These new and promising developments include the use of Fluorine-18 for imaging (13) or the use of Copper-64 for both imaging and therapy. Furthermore, Lutetium-177 labeled anti-PSMA tracers have shown to be an exciting new development in the field of mCRPC radio nuclide therapy (RNT) (10,11). In addition, sever-

Kamp, J
SYSTEMATIC REVIEW
12 | P a g e
al of the newly developed tracers can be used for both imaging and therapy. These types of tracers are also known as theranostics (14).
This systematic review aims to give an overview of several new developments in the field of PSMA target-ing tracers which are based on the same Glu-urea-Lys motif as [68Ga]Ga-PSMA-11. The focus will be especially on Fluorine-18 , Copper-64 and Lutetium-177 contain-ing tracers, since these types of tracers have the poten-tial to form new theranostic couples with Gallium-68 tracers (Lutetium-177 and Copper-64) or to enable improved PET image quality, compared to [68Ga]Ga-PSMA-11 (Copper-64 and Fluorine-18). This review will discuss several important tracer characteristics, such as radiolabeling properties, tracer sensitivity, tracer specificity and the metabolic stability. Further-more, the differences between the gold standard [68Ga]Ga-PSMA-11 and new types of anti-PSMA tracers that are currently being developed, will be evaluated. Finally, this review will briefly discuss the current way of how most tracers are being developed and evaluated, in an attempt to elucidate potential shortcomings of this current development proces.
2. Methods
2.1 Literature acquisition The PubMed database was used to search for rele-
vant publications. Generally, PubMed was screened for publications concerning Copper-64 , Fluorine-18 and
Lutetium-177. In addition, since [68Ga]-Ga-PSMA-11 is
regarded as the current gold standard in prostate can-cer imaging, several publications about [68Ga]Ga-PSMA-11 were used to evaluate how new tracers, containing one of the isotopes described above, compare to the gold standard [68Ga]Ga-PSMA-11.
2.2 PubMed searches Several searches were used for each type of isotope.
To search for literature regarding Copper-64, the fol-lowing searches were used: ’64-Cu AND PSMA’, ’64-Cu AND Prostate AND Cancer’, ’64-Cu AND Ligand AND Prostate’, ’64-Cu AND Chelators’, ‘64-Cu AND Labeling’ and ’64-Cu AND PSMA NOT Anti-body’. For the screen-ing for publications regarding Fluorine-18 and PSMA, the searches ’18-F OR 18F OR F-18 AND PSMA’, ’18-F OR 18F OR F-18 AND PSMA AND Labeling’, and ’18-F OR 18F OR F-18 AND Prostate AND Cancer AND Imag-ing AND PSMA’ were used. Finally, PubMed was screened for publications regarding PSMA and Luteti-um-177 by using ‘Lutetium AND PSMA’, ‘Lutetium AND Prostate AND Cancer’, ‘Lutetium AND Therapy AND Prostate’, ‘Lutetium AND Imaging AND PET’, ‘Lutetium AND Ligand AND Prostate AND Cancer’, ‘Lutetium AND Kinetics’ and ‘PSMA AND chelator’. In addition, the ‘PSMA AND Chelator’ search was also relevant for the other isotopes.
2.3 Inclusion and Exclusion criteria Articles were excluded when none of the words of
the PubMed searches were mentioned in the title or in
Fig. 1: Schematic overview of the literature acquisition.

Kamp, J
SYSTEMATIC REVIEW
13 | P a g e
the abstract. Because of the character of the current study, only original studies were included for this re-view. Letters to the editor, reports on scientific con-gresses or (systematic) reviews were excluded from the selection. Finally, publications that could not be used to answer the research questions were excluded.
2.4 Literature selection After PubMed was screened for relevant articles, all
titles were exported from PubMed to a database (Mi-crosoft Excel). First, all duplicate articles were removed from the database. After removing the duplicates, the titles were selected according to the inclusion and ex-clusion criteria. In addition, publications that did not concern original studies (e.g. reviews, congress reports, letters to the editor) were removed from the selection. Articles from the final selection were used for this re-view. In addition, when it deemed necessary for the discussion of this review, relevant articles referred to in the ‘relevant articles’ publications were used. A schematic overview of the literature acquisition in shown in fig. 2.
3. Results The initial PubMed search resulted in 471, 173 and
125 articles for Lutetium-177, Copper-64 and Fluorine-18 respectively, with a total of 769 articles. After the first screening, 253 duplicates were removed from the three literature databases (the Lutetium-177, Copper-64 and Fluorine-18 databases). In addition, pooling of these databases showed another 18 duplicates between the three databases. Screening for the inclusion and exclusion criteria resulted in the exclusion of 467 arti-cles of which two letters to the editor, and 465 articles that were not relevant for this review and/or did not describe an original study (reviews). Articles were con-sidered irrelevant when the article only concerned new developments in the area of PET scan technologies (software, crystals etc.) , when the article did not dis-cuss one of the isotopes mentioned above and when the article did not concern prostate cancer and PSMA tar-geting. Furthermore, since the focus of this review is on the anti-PSMA Glu-urea-Lys peptide, references con-cerning antibodies were excluded. However, we decid-ed to include some references concerning antibodies, when the reference provided valuable background in-formation or when references concerning the anti-PSMA peptide were lacking. Initially, a total of 37 rele-vant articles were acquired from the initial PubMed search (fig. 1). In addition, 16 secondary articles were acquired by screening the references from the ‘relevant articles’ .
4. 64Cu-labeled tracers for prostate cancer imaging and therapy
4.1 Recent developments in 64Cu-labeling and Cop-per-64 anti-PSMA tracers
The PubMed search for chelators for Copper-64 and PSMA (the Glu-urea-Lys motif) specifically, resulted in a limited number of publications. Therefore, publications about 64Cu-chelators for ligands other than the Glu-urea-Lys peptide were also included, to search for che-lators that may also be applicable for PSMA.
Three types of chelators were identified: (1) acyclic chelators, (2) macrocyclic chelators and (3) cross-bridged macrocylic chelators (15,16) of which the mac-rocyclic DOTA (1,4,7,10-tetraazacyclododecane-1,4,7,10-tetraacetic acid) and TETA (1,4,8,11-tetraazacyclotetradecane-1,4,8,11-tetraacetic acid) are currently the most used chelators (16,17). The stability of 64Cu-labeled tracers mainly depends on the stability of the 64Cu-chelator complex (15). Although DOTA and TETA have shown to be more stable in vivo than the acyclic chelators such as EDTA and DTPA, these macro-cyclic chelators only show a moderate in vivo stability (15,18,19). This moderate in vivo stability is thought to cause trans chelation of Copper-64 from the original chelator to endogenous proteins. Superoxide dismutase (SOD) is thought to be the one of the most important copper binding proteins (16,20). This protein removes oxygen radicals from the body, by a reaction catalysed by copper, which is incorporated in the SOD protein (16). Furthermore, transchelation of Copper-64 can occur to metallothionein or albumin in the liver or blood respectively (21).This transchelation leads to a lower image contrast, which is caused by a higher up-
take of Copper-64 in non-target tissues (22,23). NOTA (1,4,7-triazacyclononane-1,4,7-triacetic acid),
a macrocylic chelator, is shown to have a more favoura-ble in vivo stability than the other macrocyclic chelators such as DOTA, OXO-DO3A and PCTA (15,24). Research has shown that the size of the macrocycle influences the complex in vivo stability, which may explain why the relatively compact NOTA forms a more stable complex with Copper-64 than other macrocyclic chelators such as DOTA, OXO-DO3A and PCTA (16,24).
Furthermore, several studies showed high in vivo stability of cross-bridged tetraamine bicyclic polyam-inocarboxylates, especially for CB-TE2A (1,4,8,11-tetraazabicyclo[6.6.2]- hexadecane-4,11-diacetic acid) (15,16). However, the harsh conditions needed for the complexation of Copper-64 with this chelators poses a challenge, since biomolecules –such as antibodies or peptides –are often vulnerable for high temperatures. To solve this problem, click chemistry might offer a solution (19).
The use of Copper-64 for PET imaging is thoroughly studied. However, our literature research resulted in only two studies concerning 64Cu-labeled Glu-urea-Lys peptide specifically (10,15). Because of the lack of pub-lications about this 64Cu-labeled peptide, it is hard to

Kamp, J
SYSTEMATIC REVIEW
14 | P a g e
draw clear conclusions about which types of chelators are suited best to bind Copper-64 to the Glu-urea-Lys peptide. However, we were able to identify several chelator types that showed high in vivo stability when bound to biomolecules other than the Glu-urea-Lys moiety.
Especially the cross-bridged type chelators TE2A and TE1K1P showed promising results when combined with an anti-body and with the Glu-urea-Lys motif (for TE2A). In addition, the NODAGA chelator is shown to have a high stability in vivo. Although NODAGA is slight-ly less stable than the cross-bridged chelators, it is an attractive complexating agent, since the complexation process can be easily performed under mild conditions (17). This enables radiolabeling of relatively instable molecules, such as antibodies. In addition, R. Ferdani et. al. showed that the CB-TE2A chelator can be easily la-beled under mild conditions (21). This in contrast to the TE2A chelator, which is usually radiolabeled in harsh conditions or by using complicated click chemistry (19,21).
Although we were able to identify several chelating agents for 64Cu-labeling, the large heterogeneity of the data causes that direct comparison of characteristics, such as stability or PSMA binding affinity, between chelating agents, is a challenge. However, it is possible to elucidate certain trends. First of all, in general, acy-clic chelators are less stable than the macrocyclic chela-tors. In addition, cross-bridged macrocyclic chelators are, in general, more stable than macrocyclic chelators. Furthermore, the macrocyclic chelator NODAGA showed almost a similar stability as cross-bridged che-lators. CB-TE2A and CB-TE1K1P showed an excellent stability in comparison with the other chelators. NODAGA, CB-TE2A and CB-TE1K1P are therefore con-sidered to be currently the best options for the devel-opment of new 64Cu-labeled PSMA tracers.
4.2 Preclinical studies The biodistribution of 64Cu-labeled tracer molecules
is largely influenced by the charge and lipophilicity of the 64Cu-chelator complex (25). Studies have shown that a positive charge of the copper complex leads to a high uptake in the liver and the kidneys resulting in a lower clearance relative to neutral or negatively charged complexes (19,25,26). B. Rogers et. al. exam-ined the biodistribution of several types of 64Cu-chelators conjugated with the 1A3-F(ab′)2 antibody, in hamsters and rats (27). This study showed that, in
comparison to neutral or negatively charged complexes, conjugates with positively charged and/or lipophilic complexes showed an increased accumulation in the liver and kidneys and a decreased clearance. Similar results were reported by T. Jones-Wilson et. al. (28). These studies suggest that neutral or negatively charged 64Cu-complexes have most favourable in vivo properties. The exact mechanism which causes accumu-lation of positively charged complexes in the liver and kidneys is still unknown. However, it is suggested that positively charged moieties could be attracted to the negatively charged basal cells in the glomerulus and the negatively charged podocytes in the kidneys (29,30).
S.R. Banerjee et. al. studied the in vitro and in vivo behaviour of several 64Cu-chelator complexes, bonded to the Glu-urea-Lys anti-PSMA motif (15). To our knowledge, this is the only report comparing several types of copper chelates bonded to the Glu-urea-Lys motif. The main results are summarized in table 1. All Ki values ranged between 3,98 nM for CB-TE2A, to 13,26 nM for the DOTA conjugate, which is similar to that of natGa-PSMA-11 (12,0 ± 2,8 nM)(9). The in vivo evaluation was performed in severe-combined immu-nodeficient (SCID) mice, which were injected with PSMA + PC3 PIP cell and with PSMA – PC3 flu cells. Micro PET/CT scans were used for the imaging studies. All tracers were able to clearly show the PSMA+ tu-mours. Furthermore, all tracers showed uptake in the kidneys, which is due to the renal clearance and be-cause of the PSMA expression in the kidneys. A signifi-cant accumulation in the liver was shown by the PCTA, Oxo-DO2A and DOTA copper conjugates. Furthermore, the Oxo-DO3A and DOTA conjugates showed a signifi-cantly higher background uptake, which was likely to be caused by the transchelation of the Copper-64 from the tracer. These findings thus indicate a lower stability of these compounds. However, M.S. Cooper et. al. com-pared several types of 64Cu-complexes bonded to ritux-imab (31) and found that 64Cu-PCTA and 64Cu-DOTA conjugates were stable for 48 hours in human serum. This difference can be explained by the absence of ac-tive metabolic enzymes, such as Superoxide Dismutase (SOD) in the in vitro model. This example clearly illus-trates the additional value of in vivo metabolic studies, since, in the human body, tracers are subjected to a more complex array of metabolic pathways, than can be simulated in a simple in vitro stability study.

Kamp, J
SYSTEMATIC REVIEW
15 | P a g e
The two CB-TE2A diasteriomers and the NOTA con-jugate showed a high uptake in the PSMA+ tumour and in the kidneys. Furthermore, both CB-TE2 conjugates showed a low liver uptake, which is likely to be the result of a high complex stability. However, the NOTA conjugate showed some accumulation was observed in the liver, which indicates a lower in vivo stability than CB-TE2A. Furthermore, the CB-TE2A diasteriomers showed a higher renal clearance than the NOTA conju-gates. Because of the higher renal clearance and higher stability CB-TE2A was considered to be the most suita-ble chelator (15).
4.3 Clinical studies Although the application of Copper-64 for the PET imaging of cancer has been studied by many research groups, to our knowledge, only one human study with 64Cu-labeled PSMA has been published so far. In this study from B. Grubmüller et. al . (10), a total of 29 pa-tients with high suspicion for recurrent PCa or who were planned for surgery or PSMA RNT, was included. In 23 of these patients, PET/CT imaging with 64Cu-labeled PSMA showed at least 1 lesion suspicious for PCa. The images showed excellent contrast at 1 hour p.i. (fig. 2), even at low PSA levels. Because the small num-ber of patients included in this study, more clinical studies will be needed to evaluate the use and the po-tential benefits of 64Cu-labeled PSMA in patients. How-
ever, this study showed that 64Cu-labeled PSMA is a promising tracer for PET/CT imaging for PCa, because of its favourable nuclear properties resulting in high image resolution due to the favourable β+ energy of and delayed imaging due to the half-life of 12,7 hours.
4.4 Comparison with the gold standard: [68Ga]Ga-PSMA-11
Since the development of [68Ga]Ga-PSMA-11 in 2012 (9) and the introduction as the gold standard in the clinic, the search continues for new anti-PSMA tracers with improved imaging characteristics and with an improved availability compared to [68Ga]Ga-PSMA-11. Because of the favourable nuclear properties of Copper-64 (T1/2 = 12,7 h; Eβ+
max = 656KeV), Copper-64 is of high interest for the development of tracers for PET imaging. Although the possibilities for Copper-64 in the field of cancer imaging are being thoroughly studied, the use of Copper-64 in anti-PSMA tracers is still lim-ited. A 64Cu-containing anti-PSMA tracer would, howev-er, have several advantages compared to the current gold standard.
Image resolution Because of the relatively low Eβ+
max of Copper-64, a higher spatial image resolution would be expected for 64Cu-containing tracers, compared to those labeled with Gallium-68 (Eβ+
max 1899,1 KeV). In addition, because of
Fig. 2: In Human 64Cu-labeled PSMA PET/CT imaging showed nodal and skeletal metastases. (A) 64Cu-labeled PSMA PET; (B,C) Axial PET images; (D,E) Axial CT images; (F,G) corresponding PET/CT images. Images are adopted from B. Grubmüller et. al. (10).

Kamp, J
SYSTEMATIC REVIEW
16 | P a g e
the long half-life of Copper-64, scanning can be per-formed at later time points than when using shorter lived isotopes such as Gallium-68. Therefore, more activity can be cleared from the blood, which has a posi-tive effect on the image contrast. The increase in image resolution and image contrast, compared to that of images obtained with Gallium-68, will improve the diagnostic value of the scans, because smaller lesions could be detected. A report from J. Johnbeck et. al. dis-cussed a head-to-head comparison between [64Cu]Cu-DOTATATE and [68Ga]Ga-DOTATOC in patients with neuroendocrine tumours (fig. 3) (32). The [64Cu]Cu-DOTATATE showed substantially higher lesion detec-tion rates than [68Ga]Ga-DOTATOC. Although the trac-ers were not identical, the authors mention that [68Ga]Ga-DOTATOC and [68Ga]Ga-DOTATATE are both known to show similar sensitivities. Furthermore, the authors state that no evidence for the superiority of one of these tracers has been published, and that it is there-
fore possible to use these two different tracers to eval-uate the spatial resolution.
Theranostics The development of so called Theranostics is a relative-ly new and exciting development in the field of PET imaging and RNT. Theranostic tracers enable both im-aging and therapy with one single tracer. Because of the types of radiation emitted by Copper-64 (β+ 17,8%; β- 38,4%; Auger electron 43%), tracers labeled with this isotope are also suggested for RNT (15,33). However, to our knowledge, no reports concerning Copper-64 for RNT of PCa are published. Furthermore, Copper-64 could be exchanged for RNT by Copper-67, which is a promising candidate for RNT because the pure β- emis-sion. Copper-64 and Copper-67 could therefore make up an interesting theranostic couple. A recent study, in which the transmembrane cell adhesion receptor αVβ3 integrin was targeted with a 64Cu-containing tracer
Fig. 3: Comparison between PET/CT scans (left) and CT scans (right) with [64Cu]Cu-DOTATATE and [68Ga]Ga-DOTATOC in a patient with neuroendocrine tumours and metastases. Adopted from J. Johnbeck et. al. (32).

Kamp, J
SYSTEMATIC REVIEW
17 | P a g e
(64Cu-cyclam-RAFT-c(-RGDfK-)), already showed prom-ising results for the application of Copper-64 for RNT against cancer (33). The 64Cu-tracer used in this study showed a delay in tumour growth in tumours express-ing the αVβ3 receptor. Therefore, it would be interest-ing to investigate the possibilities of 64Cu-labeled trac-ers for targeting PSMA.
Availability The relatively long T1/2 of 12,7 hours, makes that
64Cu-tracers are suitable for distribution from a nuclear facility to hospitals that do not have a facility for the production of tracers. This is a large advantage com-pared to Gallium-68, because the area to which 68Ga-tracers can be distributed is substantially smaller than that of 64Cu-tracers, due to the shorter half-life of Galli-um-68 (68 minutes). In addition, only a few patient doses per elution are obtained by 68Ga-generators, which makes the wide-spread distribution even more complicated. However, the fact that Gallium-68 can be produced in a generator can also be an advantage, since generators can be relatively easily installed in almost every hospital. This is not the case with a cyclotron, which needs highly specialized personnel to operate the cyclotron and much more strict safety regulations. Fur-thermore, currently there are only a few nuclear facili-ties that are able to produce high quality Copper-64. For a broader application of this radionuclide in nuclear medicine and imaging, an increase in production capac-ities is warranted.
5. 18F-labeled tracers for prostate cancer imaging
5.1 Recent developments in 18F-labeling and Flu-orine-18 anti-PSMA tracers
In contrast to Copper-64 , Fluorine-18 can be both directly bound to a spacer moiety by covalent bonding or it can be complexated by using aluminium monofluo-ride [Al18F]2+ (12,34–37). Literature search showed 4 reports in which Fluorine-18 was covalently bonded to a Glu-urea-Lys anti-PSMA motif via a spacer molecule.
The Heidelberg research group developed and eval-uated the [18F]F-PSMA-1007 tracer, which showed a very similar structure and in vivo behaviour as PSMA-617 (12,34). PSMA-617 was originally developed to link Lutetium-177 to the Glu-urea-Lys PSMA binding motif (38). A Fluorine-18 tracer with similar properties as PSMA-617, was developed in order to form a theranostic couple with [177Lu]Lu-PSMA-617 (12). The PSMA-1007 precursor was labeled with Fluorine-18 by a reaction of 6-(18)F-F-Py-TFP (6-(18)F-fluoronicotinic acid 2,3,5,6-tetrafluorophenyl ester) with the PSMA-1007 precursor (2 mg/ml in DSMO). Furthermore, in vitro stability testing, showed that [18F]F-PSMA-1007 was stable for 4 hours in human serum.
In another study, from J. Kelly et. al., click chemistry was used for 18F-labeling in a pre-clinical study (35) . In this study, two new classes of [18F]fluoroethyltriazolylphenyl urea-based PSMA lig-ands were developed and evaluated. Six types of trazol-ylphenyl urea compounds were synthesized by derivat-ization with [18F]triazoles, by using a Cu(I) catalysed click-reaction (100°C, 20 min). Unfortunately, no data concerning the in vitro or in vivo stability of the tracers was reported.
Y. Chen et. al. reported about several types of Glu-urea-Lys PSMA inhibitors for PET or SPECT, containing Fluorine-18 or iodine-123 (36). The 18F-containing tracer [18F]6 (2-[3-[1-carboxy-5-(4-[18F]fluoro-benzoylamino)-pentyl]-ureido]-pentanedioic acid) was synthesized by the reaction of a tri-PBM Gly-C(O)-Lys ester with N- hydroxysuccinimidyl-4-[18F]fluorobenzoate, after which the PBM groups were removed by a reaction with trifluoroacetic acid and anisole. The radiochemical yield varied between 30%-35%.
18F-SFB (succinimidyl 4-18F-fluorobenzoate) is a commonly used method 18F-labeling, which has shown to produce a high radiochemical yield (39). However, the literature acquisition showed only one report about this type of labeling of an anti-PSMA binding motif (Cys-urea-Glu) (39). This research group previously report-ed about the development of a high affinity anti-PSMA tracer, containing Iodine-123. In the current study, this
Chelator1 Ki (nM) Imaging results Tumor visualitation
NOTA 6,23 High tracer concentrations in both tumor and kidneys. Low liver uptake. Yes
PCTA 10,76 Moderate/High tumor uptake. Significant uptake in the liver at 2,5h p.i. Yes
Oxo-DO3A 5,47Moderate/High tumor uptake. Significant uptake in the liver at 2,5h p.i.. Significantly
higher background uptake. Yes
CB-TE2A2 3,98High tracer concentrations in both tumor and kidneys. Clear tumor delineation at
early timepoints. Low liver uptake.Yes
CB-TE2A2 4,65High tracer concentrations in both tumor and kidneys. Clear tumor delineation at
early timepoints. Low liver uptake.Yes
DOTA 13,26Moderate/High tumor uptake. Significant uptake in the liver at 2,5h p.i.. Significantly
higher background uptake. Yes
1 All chelators were bonded to the Glu-urea-Lys PSMA binding moiety. All tracers were labeled with 63/65 Cu . 2 Diasteriomers of CB-
TE2A.
Table 1: Comparison of different types of chelators for copper labeling. 4Cu-labeled inhibitors of prostate-specific membrane antigen for PET imaging of prostate cancer (15).

Kamp, J
SYSTEMATIC REVIEW
18 | P a g e
tracer, 123I-IGLCE ((2S)-2-(3-((1R)-1-carboxy- 2-((1-((R)-5-carboxy-5-(2-(3-123I-iodobenzamido)acetamido)pentyl)-2,5-dioxopyrrolidin-3yl)thio)ethyl) ureido)pentanedioic acid), was used to synthesize a similar, 18F-containing tracers. The 18F-containing tracers were synthesized by substituting the iodobenzamido group of 123I-IGLCE by a fluorobenzamido group, using 18F-SFB. Several types of tracers, with slight modifications, were pre-pared by the reaction of 18F-SFB with maleimide based precursor molecules at room temperature for 5 minutes. After this, the Cys-CO-Glu peptide was added to the reaction mixture to acquire the final tracer mole-cule. The four tracers that were tested for in vitro stabil-ity in mouse serum, showed no decomposition of the tracers after 1 hour incubation.
Another approach to link Fluorine-18 to the Glu-urea-Lys motif is by complexation of [Al18F]2+ with a chelator. However, a disadvantage of this approach is that the complexation process often needs high tem-peratures, which can cause damage to molecules, espe-cially biological molecules such as peptides or antibod-ies. Although the Glu-urea-Lys PSMA inhibitor is able to sustain high temperature labeling (37), many other biomolecules may be damaged by the heating. There-fore F. Cleeren et. al. developed and evaluated several new polydentate chelators which could be labeled with [Al18F]2+ at moderate temperatures (37). F. Cleeren et. al. synthesized 8 chelators, of which 4 were evaluated. To evaluate the influence of the temperature on the radiochemical yield, labeling was performed at 5 differ-ent temperatures. Compound H3L2 ((2,2'-(ethane-1,2-diylbis((2-hydroxybenzyl)azanediyl))diacetic acid tri-fluoroacetate salt) and H3L3 ((2-(benzyl(2-((carboxymethyl)(2-hydroxybenzyl)amino)ethyl)amino)acetic acid tri-fluoroacetate salt) showed a substantial increase in radiochemical yield when labeling at 40°C. However, increasing the temperature above 40°C did not result in a higher radiochemical yield. Furthermore, com-pound H3L1 showed similar radiochemical yields for all temperatures. Compound H2L4 (2-(benzyl(2-((carboxymethyl)(pyridin-2-ylmethyl)amino)ethyl)amino)acetic acid trifluoroace-tate salt) showed an increase in radiochemical yield with increasing temperatures.
Stability testing showed a relatively high stability for the [Al18F]L3 complex, relative to that of [Al18F]L1, [Al18F]L2 and [Al18F]L4. [Al18F]L3 showed stable con-centrations in vitro in rat serum up to 60 minutes. After 60 minutes, slow decomposition was seen for [Al18F]L3. After 4 hours, 66% of the [Al18F]L3 was still intact. In contrast, [Al18F]L1, [Al18F]L2 and [Al18F]L4 showed a high degradation between 10-30 minutes of incubation. This indicates a high instability of the L1, L2 and L4 compounds.
Another promising method for Fluorine-18 labeling was reported by N. Malik et. al.(40) . This study showed that the precursor PSMA-11, which is already used for Gallium-68 labeling (41,42), can also be used for the
labeling of [Al18F]2+. In vitro stability testing of the [Al18F] PSMA-11 complex in human serum showed no degradation after 4 hours. Similar results were found in a more recent study, which reported 91% and 94% intact [Al18F]PSMA-11 after 2 hours in mouse and hu-man serum respectively (43) .
[18F]DCFPyL (2-(3-{1-Carboxy-5-[(6-[18F]Fluoro-Pyridine-3-Carbonyl)-Amino]-Pentyl}-Ureido)-Pentanedioic Acid) is a new PSMA based PCa tracer, which was developed by Y. Chen et. al. (44). [18F]DCFPyL was synthesized by a reaction of [18F]Py-TFP ([18F]6-Fluoro-nicotinic acid-2,3,5,6- tetrafluoro-phenyl ester) with a lys-C(O)-glu urea precursor pro-tected by a p-methoxybenzyl (PMB) group (44). In a more recent study, the radio labeling process was au-tomated by using an automated synthesis unit. This method enables GPM production and direct 18F-labeling with Fluorine-18 produced in a cyclotron (45).
The literature that is discussed above, shows that there are several ways –click chemistry, [Al18F]2+ com-plexation and 18F-SFB labeling –for labeling tracers with Fluorine-18. Although the labeling with [Al18F]2+ with chelators such as NOTA and NODA usually require high temperatures, new methods are being developed to enable labeling at lower temperatures (37). However, as shown by F. Cleeren et. al., ensuring sufficient radio-chemical stability can be challenging. Therefore, click chemistry might produce more stable tracers, because of the covalently bonded Fluorine-18. However, N. Ma-lik et. al. showed that the, already available PSMA-11, is able to form highly stable complex with [Al18F]2+, which makes [Al18F]PSMA-11 a very attractive 18F-containing PET tracer. Furthermore, the development of the auto-mated, GMP [18F]DCFPyL radiolabeling process (45), will greatly benefit the availability of this tracer.
5.2 Pre-clinical studies J. Cardinale et. al. recently published a preclinical
evaluation of [18F]F-PSMA-1007 (12). In this study, the tracer binding affinity and tumour internalization were evaluated in vitro. In addition, biodistribution studies were performed in mice. The studies showed that [18F]F-PSMA-1007 had a very high in vitro internaliza-tion ratio (67±13%) and showed a high affinity for PSMA (Ki = 6.7±1.7nM) . Furthermore, a low uptake in non-target tissue was observed in, which resulted in a clear image of the tumour in mice 40 minutes p.i. (12).
The ligands developed by J. Kelly et. al. (35) showed high tumour uptake in mice bearing LNCaP tumour cells, with a peak uptake at 2 hours p.i.. Uptake values remained stable up to 4 hours p.i.. In contrast, uptake in non-target tissue started to decrease as early as 1 hour p.i., which resulted in high contrast images. Further-more, all compounds were mainly renally cleared. Es-pecially [18F] RPS-040 ((((S)-1-Carboxy-5-(3-(3-(1-(2-fluoroethyl)-1H-1,2,3-triazol-4-yl)phenyl)ureido)pentyl) carbamoyl) -L-glutamic acid) and [18F]RPS-041 ((((S)-1-Carboxy-5-(3-(4-(1-(2-fluoroethyl)-1H-1,2,3-triazol-4- yl)phenyl)ureido)pentyl)carbamoyl)-L-glutamic acid)

Kamp, J
SYSTEMATIC REVIEW
19 | P a g e
showed favourable characteristics, as they showed a high tumour uptake and a high tumour to kidney and tumour to background ratios. Unfortunately, no data was reported concerning the in vitro or in vivo stability of the tracers.
The [18F]6 compound developed by Y. Chen et. al.(36) showed a high affinity for PSMA with a Ki
of 0,256 nM with a NAALADase inhibition assay and 0,194 nM with a fluorescence based inhibition assay. In addi-tion, a specific and rapid uptake was observed in PSMA positive tumour cells in mice. Furthermore, the authors stated that [18F]6 showed a similar tumour uptake, but slower clearance from non-target tissue, compared to [18F]DCFBC, which was previously reported by this
research group. The [Al18F]L3 devel-
oped by F. Cleeren et. al. was conjugated to Glu-urea-Lys PSMA and evaluated in healthy mice. The low activity uptake in the bones indicates a high in vivo stability of [Al18F]L3. However, the authors mention that the fast clearance of PSMA from the blood and healthy tissues dictates the need for in vivo stability studies with conjugates
that circulate for a longer period in the blood. In vitro Studies with [Al18F]PSMA-11 showed a simi-
lar binding affinity as [68Ga]Ga-PSMA-11 (KD 10,3±2,2 nM vs. 12,58±1,09 nM for [Al18F]PSMA-11 and [68Ga]Ga-PSMA-11 respectively) (40). In the more re-cent pre-clinical study in mice, a significantly higher activity uptake was observed in tumours with high PSMA expression than in tumours with a low PSMA expression (55,7 ± 11,8 %ID/g and 3,1 ± 0.9 %ID/g respectively) (43). Furthermore, some bone uptake was observed, which indicates some defluorination. Since the hydroxyl ions of the hydroxyapatite in the bones are exchanged with free 18F-ions, free fluorine tends to
Fig. 4: Radio-HPLC evaluation of the metabolic stability of [18F]DCFPyL in mice. Adopted from V. Bouvet et. al. (45).
Fig. 5: HPLC chromatograms of the DCFPyL tracer. UV chromatogram from the DCFPyL reference (up-per) and the activity chromatogram from a patient sample 173 min p.i.. Adopted from Z. Szabo et. al. (47).

Kamp, J
SYSTEMATIC REVIEW
20 | P a g e
accumulate in bone tissue (46). Two studies concerning pre-clinical studies with
[18F]DCFPyL were found (44,45). Y. Chen et. al. found a high affinity for PSMA (Ki = 1,1 ± 0,1 nM), which seems it to give it a higher affinity for PSMA than the gold standard [68Ga]Ga-PSMA-11. The high in vitro stability was supported by the findings of the biodistribution studies, which showed a maximum uptake of 46,7% ID/g 30 minutes p.i. in PSMA positive xenographs. At 4 hours p.i., the uptake was decreased with only 10%. Other pre-clinical studies were performed by V. Bouvet et. al. (45). In this study, a clear uptake of activity was observed in the PSMA positive tumours in mice up to 60 minutes p.i.. Although some uptake was observed in the PSMA negative tumours, these tumours were char-acterized by a rapid clearance of activity. Furthermore, a rapid clearance from the muscle tissue and blood was observed, which resulted in high tumour to tissue and tumour to blood ratios (17,0 ± 3,4 and 8,9 ± 1,9 respec-tively). In addition, metabolic studies in mice revealed no radio metabolites in plasma and urine up to 60 min p.i. (fig. 4).
As shown above, there is a high variability in com-plex stability, PSMA affinity and biodistribution be-tween tracer molecules. Therefore, only few of these tracers or chelators will have in vivo properties that are favourable enough to be applied in the clinic. [18F]F-PSMA-1007 was shown to have favourable imaging qualities. In addition, since the precursor for [Al18F]-PSMA-11 (PSMA-11) is already available on the mar-ket, [Al18F]-PSMA-11 could be easily made available. However, human studies are lacking for [Al18F]-PSMA-11. Furthermore, data about [Al18F]-PSMA-11 PET image quality –such as sensitivity or tumour to back-ground ratios – is still limited. In a recent study, S. Boschi et. al. suggested that, because of the favourable results in pre-clinical studies and because of the availa-bility of PSMA-11, human studies with [Al18F]-PSMA-11 are feasible and needed (43). In addition, the authors emphasize the importance of studies in which [Al18F]PSMA-11 is compared with other types of 18F-labeled PSMA inhibitors, to elucidate which of the 18F-labeled PSMA tracers has the optimal imaging proper-ties. Furthermore, extrapolation from dosimetry studies in mice suggest activities of up to 564 MBq for human application (43). Finally, [18F]DCFPyL was shown to be a very suitable candidate for clinical application, due to its high potential metabolic stability, its high uptake in PSMA positive tumour tissue, its rapid clearance and because the possibility of automated (GPM) labeling.
5.3 Clinical studies Although Fluorine-18 is a well-known radionuclide
for PET imaging, our literature search resulted in only a limited number of publications concerning human stud-ies with a 18F-labeled Glu-urea-Lys binding motif.
F. Giesel et. al. reported about an evaluation of the kinetics and uptake of [18F]F-PSMA-1007 in three healthy volunteers and in eight PCa patients (34). This study showed a reduced renal clearance in comparison
with other PSMA tracers, which was caused by a tem-porary retaining of the tracer in the kidney parenchy-ma. Therefore, the activity in the bladder was lower than is seen for other tracers such as [68Ga]Ga-PSMA-11 or [68Ga]Ga-PSMA-617. The lower bladder activity ena-bled a better visualization of the prostate tracer uptake. Furthermore, kinetics were found to be similar to that of [18F]DCFPyL and PSMA-11, although clearance of [18F]F-PSMA-1007 was slightly slower than that of [68Ga]Ga-PSMA-11. In addition, F. Giesel et. al. found a favourable tumour to background ratio for [18F]F-PSMA-1007. In total, 18 of 19 metastatic pelvic lymph nodes were identified by [18F]F-PSMA-1007 PET/CT, including nodes as small as 1 mm.
Findings concerning the reduced renal clearance of [18F]F-PSMA-1007 were not in agreement with the find-ings of the, previously discussed, pre-clinical study from J. Cardinale et. al.(12). The latter report stated that the [18F]F-PSMA-1007 showed a typical renal clearance, whereas F. Giesel et. al. concluded that [18F]F-PSMA-1007 showed a reduced renal clearance, caused by the temporary retaining of the tracer in the kidney paren-chyma. The latter was supported by the low SUVmax
found in the bladder by F. Giesel et. al. for [18F]F-PSMA-1007, relative to that of [68Ga]Ga-PSMA-11 and [68Ga]Ga-PSMA-617 (SUVmax values of 5, 100 and 40 respectively). In addition, F. Giesel et. al. found that [18F]F-PSMA-1007 clearance via the urinary tract was only 1,2% and 0,7% at 0-2h and 2-4 respectively. This delayed renal clearance that is shown in the human study, prevents high activity in the bladder area, and therefore enables a better visualization of the prostate tumour. However, as mentioned by F. Giesel et. al., the interpretation of SUV values between the different trac-ers should be done with caution, since the patient selec-tion between the [68Ga]Ga-PSMA-11, [68Ga]Ga-PSMA-617 and [18F]F-PSMA-1007 studies were different. Fur-thermore, the differences in findings between the two studies might be explained by the different types of in vivo studies (human vs. mice). Since the study in hu-mans only included 8 patients, future clinical studies with a larger number of patients are needed .
Although [18F]DCFPyL is not used in clinical practice yet, several reports concerning clinical studies were found. S. Szabo et. al. reported in 2015 about a first-in-human study (47). The study included 9 patients with new or progressive metastatic disease with PSA values ≥ 1 ng/ml, with the exception of one patient, which showed a PSA value of 0,1 ng/ml. Patients showed Gleason scores of 7 (n = 4), 9 (n = 4) and 10 (n = 1).
Biodistribution studies showed high uptake in the salivary glands, the lacrimal glands, the liver, the spleen and – predominantly – in the small intestine. Further-more, a significant renal clearance and a rapid clear-ance from the blood were shown. In contrast to many other clinical studies in this review, this study also in-cluded a study of the metabolism in human. Plasma samples from 3 patients were evaluated for the pres-ence of radio metabolites. Radio-HPLC did not show any other radioactive compounds besides the parent com-

Kamp, J
SYSTEMATIC REVIEW
21 | P a g e
pound [18F]DCFPyL up to 173 min p.i. (fig. 5). Further-more, average urinary[18F]DCFPyL excretions of 11% and 16% after 2h p.i. and 3h p.i respectively were found. The findings concerning [18F]DCFPyL metabo-lism are in agreement with the findings from previous pre-clinical studies (45).
Three of the patients suffered from grade I side ef-fects, although the authors state that these side effects are unlikely to be caused by the administration of [18F]DCFPyL. Biodistribution showed patterns that were to be expected, based on the known regions were PSMA is expressed, such as the small intestine and the salivary glands. Furthermore, [18F]DCFPyL showed a rapid clearance from the blood, which is often seen for small molecule tracers. High SUVmax values of up to 102, 100,3 and 71,6 were shown by bone lesions, lymph node lesions and lesions caused by the primary disease respectively. However, because of the high renal clear-ance, especially at later time point, the tissues sur-rounding the bladder may become obscured, so that it becomes harder to detect lesions in this region.
A study from M. Dietlein et. al. directly compared the imaging of recurrent PCa patients with both [18F]DCFPyL and [68Ga]Ga-PSMA-11 (48). The study included 14 patients with a biochemical relapse. First all patients were subjected to a [68Ga]Ga-PSMA-11 PET/CT scan, followed three weeks later by a [18F]DCFPyL PET/CT scan. The outcomes of both meth-ods were then compared for the differences in the number of lesions, the SUVmax values and the tumour to background ratios.
Lesions were detected in 10 of the 14 patients with both methods. [18F]DCFPyL PET/CT scans showed addi-tional lesions in 3 patients (21%). SUVmax values in the, up to three hottest lesions, differed significantly, with a mean SUVmax for [68Ga]Ga-PSMA-11 of 12,3 versus a SUVmax for [18F]DCFPyL 14,5. Although in three patients, one or more additional lesions were found with [18F]DCFPyL, compared to [68Ga]Ga-PSMA-11, these findings did not influence the treatment strategies that were based on the outcomes of the [68Ga]Ga-PSMA-11 scans.
M. Dietlein et. al. clearly showed that [18F]DCFPyL is a suitable candidate when it comes to the imaging of PCa in patients with a biochemical relapse. Further-more, the study showed a high sensitivity for [18F]DCFPyL and it showed that [18F]DCFPyL image qualities seem to be at least comparable to that of [68Ga]Ga-PSMA-11. However, it is also important to be aware of the limitations of this study, such as the differ-ences in activities administered (mean 123,3 MBq for [68Ga]Ga-PSMA-11 versus 318,4MBq for [18F]DCFPyL). Furthermore, the additional lesions found with [18F]DCFPyL could not be verified by histological exam-inations. Therefore, it could be possible that the addi-tional lesions contain some false-positives. The high mean SUVmax values of the lesions found in this study, are supported by the results of the clinical study re-ported by S. Szabo et. al. (47).
Although not many Fluorine-18 containing anti-PSMA tracers are being used in clinical practice yet, the literature discussed above showed some highly promis-ing developments, which have the potential make it to the clinic. Especially the tracers containing covalently bonded Fluorine-18, [18F]F-PSMA-1007 and [18F]DCFPyL showed excellent imaging qualities in hu-mans, including high SUVmax values of the lesions, fast clearance from the blood and non-target tissue and high sensitivities. It is however, important to mention that direct comparison between tracers is often difficult, because of the high variety in scan protocols and of the types of PET/CT scanners being used.
Besides the [18F]DCFPyL and [18F]F-PSMA-1007 tracers, the development of tracers that are making use of existing precursor molecules, such as described by N. Malik et. al. (40) may have a high potential to make it to the clinic, within considerable time. This is because precursor molecules such as PSMA-11 are already available on the marked. However, for [Al18F]PSMA-11, no reports concerning clinical studies were found. Therefore, clinical studies with this tracer are feasible.
5.4 Comparison with the gold standard: [68Ga]Ga-PSMA-11
Fluorine-18 is a radioactive isotope that is often used for PET/CT imaging and that can be produced in large quantities. Examples of 18F-tracers for PET/CT are [18F]Choline, [18F]FDG and [18F]DCFPyL (13,49). Fluo-rine-18 is a suitable radioisotope for PET imaging, be-cause of its low, favourable, Eβ+
max (96,7%, 633,5 KeV) and its favourable half-life (T1/2
= 110 min)(50).
Image resolution Because of the lower Eβ+
max of Fluorine-18 ̶ which is similar to that of Copper-64 ̶ compared to that of Gallium-68, a higher resolution is to be expected for Fluorine-18. In addition, Gallium-68 has a lower posi-tron yield than Fluorine-18 (89,14% vs. 96,86% respec-tively), which causes the detection sensitivity of Galli-um-68 to be lower than that of Fluorine-18 (50). This might cause that small lesions are overseen with a 68Ga-tracer, while a 18F-tracer might be able to visualize it.
A direct comparison between the contrast, sensitivi-ty and resolution of Fluorine-18 and Gallium-68 was performed by A. Sanchez-Crespo et. al. (50). In this study, the authors used SPECT/PET dummies to study the difference in image quality between these two iso-topes (fig. 6). The study showed a lower resolution and sensitivity of Gallium-68 compared to Fluorine-18. This lower resolution makes it more difficult to quantify 68Ga-containing tracers on PET images. So far, 68Ga-tracers outperformed tracers such as [18F]FDG, because 68Ga-tracers are mainly targeting specific targets (such as PSMA)(50). However, since the development of trac-ers such as [18F]DCFPyL, that specifically target PSMA, it is possible to combine a highly specific targeting and a high spatial resolution.

Kamp, J
SYSTEMATIC REVIEW
22 | P a g e
Availability As mentioned earlier, the
availability of Gallium-68 is lim-ited because of the relatively short half-life, but also because the 68Ga-generator only enables elution of a few patient doses. This is in contrast to Fluorine-18, which can be produced in large quantities with a cyclotron. Although it is important to men-tion that new developments concerning Gallium-68 produc-tion in cyclotrons showed prom-ising results (51). Large scale isotope production in cyclotrons, combined with sufficient GMP production facilities, enables the production of larger tracer quantities, so that these tracers can be distributed over distance to PET centers that do not have the facilities for tracer produc-tion.
6. 177Lu-labeled tracers for prostate cancer im-aging and therapy
6.1 Recent developments in 177Lu-labeling and 177Lu- PSMA tracers
The development of RNT for the treatment of mCRPC has had a large impact on the treatment of mCRPC. However, these metastases are not targeted by conventional, bone seeking, tracers such as 223Ra-labeled tracers (11,52). Therefore, new tracers are needed to enable RNT for nodal and visceral metasta-ses. Literature research showed two reports in which new PSMA targeting tracers for imaging and therapy were developed (4,38). Both research groups reported about PSMA targeting tracers based on the same PSMA targeting moiety as is incorporated in [68Ga]Ga-PSMA-11. Due to the long half-life of Lutetium-177 (6,7 days), a high complex stability is warranted for radiotherapy to limit severe toxicity (53).
H. Chong et. al. (54) reported about the development and evaluation of two new bifunctional chelators (DE4TA and 3p-C-NE3TA). Furthermore, this study described the evaluation of three known chelators, 3p-C-NETA, 3p-C-DEPA and 3p-C-NOTA. 177Lu-complex stability was evaluated in human serum for 14 days.
The 3p-C-DE4TA, 3p-C-NE3TA and 3p-C-NETA com-plexes were shown to be stable for two weeks. For 3p-C-NETA, no free activity was found in serum after 14 days. Similar results for the NETA chelator were found by C. Kang et. al. (55), who reported about the 5p-C-
NETA chelator. For the 3p-C-DE4TA and 3p-C-NE3TA complexes, respectively 5% and 3% free activity was found after 14 days. This indicates a high complex sta-bility. Furthermore, 3p-C-DE4TA, 3p-C-NE3TA and 3p-C-NETA stability was evaluated in mice. The low activi-ty found in blood for all these complexes (<0,5% ID/g) indicate a high in vivo stability, supporting the results found with the in vitro stability evaluation. 3p-C-DEPA and 3p-C-NOTA showed 45% in vitro transchelation after 72h and 36% in vitro transchelation after 7 days respectively. This indicates a relatively low stability in human serum, compared to 3p-C-NE3TA and 3p-C-DE4TA.
M. Weineisen et. al. reported about an evaluation of two tracers with the DOTAGA chelator, which were used for the labeling of Lutetium-177 and Gallium-68 (56). For the two tracers, similar spacer moieties were used (FFK (L-Phe-L-Phe-L-Lys) and ffk (D-Phe-D-Phe-D-Lys)). In vitro stability evaluation of the 177Lu-complexes in human serum showed no release of radio-activity after 48h. Subtle differences in PSMA binding affinity between compounds were reported, with ei-ther the L-amino or D-amino spacer. Furthermore, dif-ferences in tracer internalization were observed be-
Fig. 6: Reconstructed PET images of the SPECT/PET phantom with Fluorine-18 (A,B) and Gallium-68 (C, D). Adopted from A. Sanches-Crespo et. al. (50).

Kamp, J
SYSTEMATIC REVIEW
23 | P a g e
tween the L-amino and D-amino tracers. Although this study did not report a statistical analysis to evaluate whether these latter two differences were significant, these observations may indicate that the spacer mole-cule is also plays a role in the PSMA binding affinity and tracer internalization.
In a subsequent study, the initial DOTAGA anti-PSMA tracer was optimized (4). In this study, the pep-tidic linker described above, was modified to increase the affinity for PSMA, by altering the lipophilic interac-tion between the tracer and PSMA. The tracer was mod-ified by substituting one of the D-phenylalanine groups of the spacer, by 3-iodo-D-tyrosine. Compared to the previous tracer, the new tracer – PSMA I&T– showed a higher affinity for PSMA (IC50 values of 15, ± 0,5 nM and 13,1 ± 2,2 nM for natGa-and natLu-DOTAGA-ffk-(Sub-KuE) vs. 9,3 ± 3,3 nM and 7,9 ± 2,4 nM for natGa- and natLu-PSMA I&T respectively). Furthermore, the new PSMA I&T showed higher internalization ratios for both 68Ga- and 177Lu-PSMA I&T, compared to DOTAGA-ffk-(Sub-KuE), of which 177Lu-PSMA I&T was internalized more rapidly than the 68Ga-PSMA I&T .
Another tracer, is the DOTA anti-PSMA tracer PSMA-617 (11,57,58) . M. Benešová et. al. reported in 2015 about the development of this new DOTA-conjugated PSMA inhibitor for imaging and RNT (38). Similar to DOTAGA, DOTA can be used for the labeling with Gallium-68 and Lutetium-177, and can therefore be used as a for the development of a theranostic trac-er. Stability evaluations with in human serum showed 4% free activity after 24h for [68Ga]Ga-PSMA-617 and less than 0,6% of free activity for [177Lu]Lu-PSMA-617 (RP-TLC). Furthermore, gel filtration did not show any transfer of activity to endogenous proteins. Although both DOTA complexes show an acceptable in vitro sta-bility, this study showed that complex stability can vary between isotopes.
In contrast to the previously described studies, B. Baur et. al. evaluated the acyclic chelating agents CHX-A''-DTPA, which was bonded to the Glu-urea-Glu (DU-PA) binding motif (53). However, it was only reported that the [177Lu]Lu-CHX-A''-DTPA-DUPA-pep conjugate was stable for 72h, thus lacking concrete data on com-plex stability. Although this study shows the potential favourable properties of CHX-A''-DTPA, more concrete data is needed to assess the in vitro and in vivo stability of the complex.
As mentioned above, the radiochemical stability of Lutetium-177 is extremely important to limit severe radio toxicity. Since free 177Lu3+ tends to accumulate in bone tissue, and since substantial amounts of activity are administered for RNT purposes, even small amounts of free 177Lu3+ can lead to unwanted irradia-tion of the bone marrow (59). As mentioned above, 3p-C-DE4TA, 3p-C-NE3TA, 3p-C-NETA and 5p-C-NETA form highly stable complexes up to 14 days in vitro. In addition, DOTAGA and DOTA also showed high radio-chemical stability. However, because radiochemical stability was only evaluated up to 2 days and 3 days respectively, no direct comparison can be made with
3p-C-DE4TA, 3p-C-NE3TA, 3p-C-NETA and 5p-C-NETA, which were tested for 14 days. The same applies for CHX-A’’-DTPA, which is also only evaluated up to 3 days. Furthermore, for CHX-A’’-DTPA, concrete stability data is lacking. Although in vitro evaluation of the radi-ochemical stability might give an indication of the in vivo radiochemical stability, exact data concerning the complex stability in the human body is lacking. In addi-tion, in vitro stability tests only give limited information about the metabolic stability that the tracer shows in the body.
6.2 Pre-clinical studies Biodistribution studies with the optimized tracer,
PSMA I&T, were performed in CD-1 nu/nu mice, inject-ed with PSMA+ LNCaP tumour cells (4). Both 177Lu- and 68Ga-PSMA I&T showed a rapid clearance from the blood at 1h p.i.. However, 177Lu-PSMA I&T showed a higher uptake in PSMA expressing tissues, such as the lung, spleen. In addition, it showed a significantly (P < 0,05) higher uptake in tumour tissue and the kidneys. However, no data is presented about the uptake in the salivary glands –an organ that is also known to express PSMA (6) and which is known for its uptake of PSMA tracers (10,11,34).
M. Benešová et. al. did not report about any in vivo metabolism studies. The affinity (Ki) for PSMA was determined by a cell-based assay. [68Ga]Ga-PSMA-617 showed a inhibition constant (Ki) of 6,4 ± 1,02 nM, which is lower than was found for [68Ga]Ga-PSMA-11 (12,0 ± 2,8 nM).
Dynamic PET showed a 1h p.i. tumour over muscle ratio of 8,5 and it showed a rapid renal clearance. An increasing tumour uptake was found up to 2h p.i. for the 68Ga-labeled tracer. The [177Lu]Lu-PSMA-617, showed similar organ distribution as the 68Ga-labeled tracer. However, tumour to blood ratios at 1h p.i. were higher for [177Lu]Lu-PSMA-617 than for [68Ga]Ga-PSMA-617 (22,1 vs. 7,8). Furthermore, [177Lu]Lu-PSMA-617 showed that most activity was cleared from the kidneys 24h p.i., whereas the tumour uptake at 24h p.i. re-mained relatively stable. The slight differences found between the 68Ga-labeled and 177Lu-labeled tracers, show that the type of isotope influences the pharmaco-kinetics of the tracer.
Body fluids were analysed for radiometabolites of the second generation 68Ga-DOTAGA tracer, by radio-HPLC (56). All in vivo studies were performed on mice injected with LNCaP PSMA+ cells. Evaluation of the biodistribution of the two tracers showed a small dif-ference in biodistribution. However, a substantial dif-ference was found for the in vivo metabolic stability of the two tracers. The tracer containing the L-amino spacer showed only 21% intact tracer in blood 0,5h p.i.. In contrast, the D-amino spacer showed no degradation in blood after 0,5h. These results clearly illustrated the potential impact of the spacer choice on the metabolic stability.
Biodistribution studies were performed by both static and dynamic micro-PET studies with mice (56).

Kamp, J
SYSTEMATIC REVIEW
24 | P a g e
In these studies, the biodistribution of the two newly developed DOTAGA tracers were compared to a DOTA anti-PSMA tracer and the gold standard [68Ga]Ga-PSMA-11. Both DOTAGA tracers showed higher tumour to background ratios than the DOTA tracer. The tracer with the D-amino spacer, showed a lower unspecific uptake, a higher tumour uptake and thus a higher tu-mour to background ratio than the [68Ga]Ga-PSMA-11 in the static micro-PET scan. The difference in biodis-tribution between the D-amino DOTAGA tracer and the L-amino DOTAGA tracer can be explained by the higher stability of the D-amino DOTAGA tracer
6.3 Clinical studies M. Weineisen et. al. reported about the first human
studies of PSMA I&T (4). Two mCRPC patients were administered [177Lu]Lu-PSMA I&T (5,7 GBq and 8,0 GBq for patient 1 and 2 respectively). Both patients experi-enced pain relief. In addition, the effects of [177Lu]Lu-PSMA I&T were clinically shown by a drop in PSA levels and by the decreased disease burden, as was shown by [68Ga]Ga-PSMA-11 PET/CT. Safety evaluation showed that [177Lu]Lu-PSMA I&T RNT was well tolerated and showed no adverse effects in either the kidneys or sali-vary glands. Furthermore, no hematotoxicity was ob-served.
In a study with a larger mCRPC patient population of 22 patients, similar outcomes were observed (60) (fig. 8). However, some grade 1 and 2 adverse were ob-served. In addition, 37% of the patients experienced a dry mouth, although this persisted only in the first few days after RNT. Anaemia and thrombopenia were ob-served in 32% and 25% of the cases respectively. Fur-thermore, no grade 3 of 4 adverse effects were ob-
served during this study. In addition, similar clinical effects as in the study of M. Weineisen et. al., such as a drop in PSA levels, were observed.
The first report concerning [177Lu]Lu-PSMA-617 was published in May 2015 by C. Kratochwil et. al. (61), although [177Lu]Lu-PSMA-617 was already used for the treatment of mCRPC since 2013 in several centers (14). The first dosimetry study concerning [177Lu]Lu-PSMA-617 was published in 2016 by A. Delker et. al. (11).
In this study, in which the absorbed dose was calcu-lated (image-based), five mCRPC patients received two cycles of [177Lu]Lu-PSMA-617 (average 3,6GBq per cycle) (11). SPECT/CT images were taken at 1h, 24h, 48h and 72h p.i.. The calculated mean absorbed doses per cycle in visceral lesions (n = 4) was 7,5 ± 2,7Gy (range: 5,9-11,5 Gy), 19,4 ± 13,5Gy (range: 5,6 - 46,0) in bone lesions (n = 21) and 15,1 ± 19,2Gy (range: 1,2 - 47,5) in lymph metastases (n = 7). Because PSMA is also expressed in the kidneys and salivary glands, some uptake was to be expected in these organs. Although absorbed doses of up to 16 Gy in the salivary glands were observed, no cases of xerostomia were reported. Bone marrow and kidney toxicity can be limiting fac-tors for RNT. However, this study showed that the ab-sorbed doses in the bone marrow (44,0 ± 18,8 mGy) and kidneys (2,2 ± 0,6 Gy), were below the critical dose values of 2 Gy and 23 Gy respectively (11). Because de absorbed doses in the critical organs were below the limits, the authors suggest that it is safe to administer a higher activity (6 GBq) than was used in this study.
The same research group reported about a subse-quent study in which safety and efficacy of an initial activity of 6,0 GBq was compared with an initial activity of 3,7 GBq in mCRPC patients (n = 10 and n = 5 respec-
Fig. 7: Geometric mean images of scans with the PSMA inhibitor [99mTc]Tc-MIP1427 (A) before and (B) after 3 treatment cycles with 6 GBq [177Lu]Lu-PSMA-617. MIP scan images with the PSMA inhibitor [68Ga]Ga-PSMA-11 (C) before and (D) after 3 treatment cycles with 6 GBq [177Lu]Lu-PSMA-617. Adopted from C. Kratochwil et. al. (67).

Kamp, J
SYSTEMATIC REVIEW
25 | P a g e
tively) (58). The occurrence of grade 1 and 2 was found to be similar for both groups. Furthermore, in the 6,0 GBq group, one patient showed a grade 3 anaemia and one patient showed a grade 3 leukocytopenia. These adverse effects were reported to be improved without intervention. In addition, one patient from the 3,7 GBq group showed grade 3 nausea, which was improved after antiemetic treatment. Efficacy showed to be prom-ising, since a disease control rate of 67% was reported and approximately half of the patients experienced an increased quality of life and pain relief.
W. Fendler et. al. concluded that, according to the re-results of this clinical study, three or more cycles of 6.0 GBq may be performed within an acceptable safety range (58). This is in accordance with the activity that was previously suggested by A. Delker et. al.(11). How-ever, although the results from these two studies are promising, the impact was limited because of the small sample size (n = 5 and n = 15). Therefore, a larger clini-cal study was very recently published by K. Rahbar et. al. (57) .
In the multi center study, 148 mCRPC patients were included, of which 19 died during the study period (57). Grade 3-4 hematotoxicity was shown in 12% of the patients. Dry mouth was reported in 8% of the patients. The overall biochemical response rate for all RNT cycles was 45%, of which 40% of the patients had a response after the first cycle. Furthermore, the authors mention that the frequency of hematotoxicity is significant lower compared to the frequency that is often seen for radia-tion therapy with antibodies or for second line chemo-therapy (57).
The German multicenter study was a large step for-ward for the application of [177Lu]Lu-PSMA-617 for the treatment of mCRPC patients, because it was the first clinical study with included a relatively large number of patients. However, as has also been stated by the au-thors, the retrospective character of this study is a sub-stantial limitation. This is mainly due to the large heter-ogeneity of the data provided by the 12 different treat-ment centers.
Both [177Lu]Lu-PSMA I&T and [177Lu]Lu-PSMA-617 have shown to have favourable safety profiles and to have a promising efficacy. However, more studies will be needed, especially for [177Lu]Lu-PSMA I&T to be able to conclude which of the two is the superior tracer. Interestingly, both tracers have been reported to have only limited hematotoxicity, which is an important ben-efit compared to 177Lu-labeled antibodies such as [177Lu]Lu-J591 (11,57,60). The common hematotoxicity seen for 177Lu-labeled antibodies is likely to be due to the longer circulatory half-life of antibodies, compared to small molecules (60), which is responsible for the higher damage to non-target tissue seen for radio la-beled antibodies.
Other radionuclides such as Yttrium-90 and Iodine-131 have been suggested for RNT (54). However, Io-dine-131 emits a relatively larger proportion of γ radia-tion than Lutetium-177, which may increase the risk for hematotoxicity. Furthermore, the time patients are
hospitalized (38) could be reduced because of the re-duced radioactivity outside the body of the patient, due to the lower γ emission of Lutetium-177. Yttrium-90 is a pure β- emitter, with a higher Eβ- than Lutetium-177 (Eβ-
max = 2,3MeV vs. Eβ-max = 0,5MeV) (54). Because of
its lower β- energy, Lutetium-177 has a range in tissue of approximately 2 mm, which is shorter than that of Yttrium-90 . The shorter range of Lutetium-177 is a benefit when selectively treating small tumours, be-cause it reduces damage to the tissues surrounding the target tissue. Furthermore, in contrast to Yttrium-90, Lutetium-177 also emits γ radiation, which enables imaging with a simple gamma camera (54).
7. Outcomes and future perspectives
7.1 Theranostic couples As described previously, chelators such as DOTA
and DOTAGA can be used to label tracers with different isotopes, so that one single tracers can be used for im-aging and therapy, depending on the isotope that is used. However, using two different types of elements, such as is the case with the Gallium-68/Lutetium-177 couple described above (4,38,56), has some drawbacks.
Weineisen et. al. showed differences in affinity, in-ternalization rate and lipophilicity between identical PSMA tracers labeled with natural Gallium or Lutetium isotopes. These alterations may cause differences in clearance or uptake values in vivo. This is illustrated in a study in which [68Ga]Ga-PSMA I&T and [177Lu]Lu-PSMA I&T were compared (4). The study showed a significantly (P<0,05) higher uptake of [177Lu]Lu-PSMA I&T in the kidneys and tumour compared to the [68Ga]Ga-PSMA I&T . The difference observed is likely to be caused by the different charges of the isotopes. Therefore, the imaging tracer will not always give an adequate prediction of the behaviour of the tracer that is labeled with the therapeutic radio nuclide. This may cause errors in dose calculations or may cause damage to non-target tissues, while this was not expected based on the data obtained with the imaging tracer.
Theranostic couples such as Copper-64/Copper-67 might be an answer to this problem. Because the chem-ical properties of these two isotopes are the same, the characteristics of tracers with either Copper-64 or Cop-per-67 will have similar properties, which enables more reliable predictions with the imaging (Copper-64) trac-er.
7.2 Shortcomings in the current tracer devel-opment process
The publications discussed in this review, mainly discussed pre-clinical studies or clinical studies in which the in vivo behaviour of the tracer was described by imaging data. However, only a few of the publica-tions discussed in this review provided a detailed eval-

Kamp, J
SYSTEMATIC REVIEW
26 | P a g e
Fig. 8: [68
Ga]Ga-PSMA PET/CT images of two different mCRPC patients. Complete remission after 4 treatment
cycles of 7,4GBq [177
Lu]Lu-PSMA I&T in a 71 year old patient (A). Primary progressive disease after 1 treatment
cycle with 7,4 GBq [177
Lu]Lu-PSMA I&T in a 73 year old patient (B). Adopted from M. Heck et. al. (60).

Kamp, J
SYSTEMATIC REVIEW
27 | P a g e
uation of the in vivo metabolism. The formation of (ac-tive) radiometabolites can limit the diagnostic values of the scan. An example of the effects of the formation of such radiometabolites, was shown by H. Shetty et. al. (62). In this study, the metabolism of the dopamine transporter (DAT) targeting PET tracer [11C]PE2I was evaluated. The evaluation with radio-HPLC and LC/MS showed the presence of two radiometabolites from [11C]PE2I in rat brain. The first radiometabolite (1), was likely to be an active, hydroxylated metabolite from [11C]PE2I. The second, inactive, metabolite (2) was likely to be the carboxylic derivative of [11C]PE2I, which was formed from its precursor (1). The presence of such radiometabolites can become confounding fac- tors when quantifying the dopamine transporters in the brain. Similar mechanisms could also be expected for other types of PET tracers.
In most of the acquired publications, tracer stability was only tested in vitro in human serum, or tracer sta-bility was deviated from certain biodistribution pat-terns, which were obtained by PET scans. Examples of such patterns are a high uptake in the liver of Copper-64 tracers, or a high bone uptake for Fluorine-18 trac-ers. Metabolite analysis of patient blood samples was performed in only one study (47). However, only radio-HPLC was used in this study. Although this method can be a powerful tool to exclude many potential radio metabolites, it is not able to detect radio metabolites which have a similar retention time as the parent com-pound. Therefore, methods such as mass spectrometry could be used to obtain more detailed information about potential metabolites. In addition, to our knowledge, no studies discussing [68Ga]Ga-PSMA-11
metabolism and pharmacokinetics in patients have been published. Therefore, new studies concerning a detailed evaluation of the tracer metabolism and phar-macokinetics are warranted.
The lack of PK and metabolic studies may be partially explained by the method of how tracers are currently being developed. Although the field of PET tracers is constantly evolving, the current developing proces is still in need of improvements, as many new tracers are being developed, while hardly any of those make it to the clinic – even if the tracer shows promising results. As can be distilled from the the previous sections, the developing process can be roughly devided as shown in fig. 9. This figure shows a striking shortcoming in the current proces.
This shortcoming is that metabolic and pharmacokinetic studies do not seem to be regarded to be an intregral part of tracer development proces. This is striking, since PK and metabolic studies are an integral part of ‘normal’ drug development. The integration of PK and metabolic studies as part of the ‘standard’ developmental method, may enable a better selection of tracers that have the potential to make it to the clinic. If, for example, a newly developed tracer shows to be highly instable in microsomes, there will be no point in putting an effort in trying to get the tracer to the clinic. Instead, the tracer may first be modified to enhance the metabolic stability, after the metabolism of the modified tracer may again be evaluated.
Another important shortcoming of the current developing proces – which is not shown in the flow chart – is that in most cases, only one group is responsible for the whole developing proces. This trend
Fig. 9: Schematic overview of the main steps in the current process for tracer development.

Kamp, J
SYSTEMATIC REVIEW
28 | P a g e
was pointed out in recently published commentary from M.G. Campbell et. al. (63). The authors of this commentary have a point in stating that this all-in-one-team way of developing tracers, is in contrast to the way conventional drugs are being developed in pharmaceutical companies. In such companies, different teams, each with its own expertise, is responsible for only a part of the whole developing proces. Such a process is much more efficient than the current way of developing tracers. Furthermore, since most researchers in this field have a background in chemistry (radiochemists, organic chemists etc.), but often lack a background in pharmaceutical of medical sciences, studies such as metabolic studies might not be valuated in the right manner, because the focus of many chemists may mainly be on developing new chemical compounds.
7.3 Future perspectives The field of PCa PET tracers is changing continuous-
ly, and new developments occur at a very high pace. An example of this, is the use of α-emitting radionuclides such as Bismuth-213 and Actinium-225 , for PCa thera-py purposes (64,65). Alpha-emitting particles have favourable properties, such as a their short range (rela-tively to that of β- particles), the high radiation energy, and their excellent cytotoxicity (64). However, because of the high cytotoxicity, a high complex stability is war-ranted to prevent unbound Bismuth-213 or Actinium-225, which could cause severe toxicity. HEHA (1,4,7,10,13,16-hexaazacyclo-hexadecane-N,N’,N’’,N’’’,N’’’’,N’’’’’-hexaacetic acid) and PEPA (1,4,7,10,13-pentaazacyclopentadecane- N,N’,N’’,N’’’,N’’’’-pentaacetic acid) are both widely used chelators for Actinium-225. However, DOTA is shown to have more favourable in vivo properties (66). In addi-tion, DOTA can be used to complex Bismuth-213 . Fur-thermore, 3p-C-DEPA has shown to be an excellent 213Bi-chelator, because of its favourable labeling kinet-ics and because of an in vivo stability similar to that of DOTA (66). The NOTA derivative 3p-C-NETA has also shown promising results for the labeling of bismuth-
213, however it still unclear which of the two chelators - 3p-C-NETA or 3p-C-DEPA – is superior (66). Although our knowledge about the application of α-emitting par-ticles for PCa therapy is still limited, it gives us an indi-cation of what types of new RNTs can be expected in the future. However, due to the high expression of PSMA in the salivary glands and because of the high energy α particles, Bismuth-213 and Actinium-225 are likely to cause more damage to the salivary glands than is seen with Lutetium-117.
Another development that is to be expected, is the widespread application of [18F]F-PSMA and [64Cu]Cu-PSMA tracers. At the moment, [68Ga]Ga-PSMA-11 is considered to be the gold standard for PCa PET/CT imaging. Because of the potential benefits of Fluorine-18 and Copper-64 compared to Gallium-68, Fluorine-18 and Copper-64 both have the potential to replace Galli-um-68 in the future. Furthermore, Copper-64 could also have an additional value, by forming a theranostics couple with Gallium-68. However, it is important to mention that a substantial clinical experience has been gathered for [68Ga]Ga-PSMA-11. In contrast, relatively little clinical experience is obtained with [18F]F-PSMA and [64Cu]Cu-PSMA tracers, which currently limits a widespread clinical use.
8. Conclusions In this systematic review, the current knowledge
concerning the applications of Lutetium-117, Fluorine-18 and Copper-64 for PET imaging or RNT was dis-cussed. In addition, several methods that can be used for the radiolabeling of PSMA inhibitors were evaluat-ed. Furthermore, the advantages and disadvantages of several of these new tracers were compared with the current gold standard [68Ga]Ga-PSMA-11.
18F- and 64Cu-labeled PSMA conjugates showed promising results for PET imaging of PCa patients. Fur-thermore, 64Cu-labeled PSMA conjugates are potential candidates for future RNT, especially when used as a theranostic couple with Copper-67. NODAGA, CB-TE2A and CB-TE1K1P showed to form stable complexes with
Isotope Half-life Eβ+max (KeV) Isotope availability Tracers1
Gallium-68 68 minutes 1899,1 Limited, currently only produced by generators
[68Ga]Ga-PSMA-11
[68Ga]Ga-PSMA I&T
[68Ga]Ga-PSMA-617
Fluorine-18 110 minutes 633,5Cyclotron production already possible in large
quantities
[18F]DCFPyL
[18F]F-PSMA-1007
Copper-64 12,6 hours 656Cyclotron production possible, although currently
limited production facilities.
[64Cu]-PSMA-617
Lutetium-177 6,6 days - -[177Lu]-PSMA I&T
[177Lu]-PSMA-617
1 Only tracers, which are already in the clinical phase are shown.
Table 2: Overview of PSMA targeting tracers per isotope, as described in this review.

Kamp, J
SYSTEMATIC REVIEW
29 | P a g e
Copper-64. HBED-CC and L3 were shown to form rela-tively stable complexes with [Al18F]. For all evaluated complexes, in human stability testing was lacking.
[177Lu]Lu-PSMA conjugates showed promising re-sults for RNT in heavily pre-treated mCRPC patients. DOTA, DOTAGA, 3p-C-DE4TA, 3p-C-NE3TA and 3p-C-NETA showed to form highly stable complexes in vitro with Lutetium-177. However, no in human stability studies were reported.
For the future, radiolabeled PSMA inhibitors are likely to have a large impact on the treatment and diag-
nosis of prostate cancer, partly because this field of research is developing very rapidly. However, more extensive pharmacokinetic and metabolic studies are needed to better understand the behaviour of these tracers in the human body and to be able to optimize their use. In addition, the current structure of the de-velopment process should be overhauled, to become a more multi-disciplinary process. Furthermore, combi-nations of different targeting moieties, such as PSMA and GRPR, are likely to become increasingly important for the targeting of prostate cancer cells.
9. References 1. Jadvar H. Molecular Imaging of Prostate Cancer: PET Radiotracers. Natl
Inst Heal. 2012;199(2):278–91. 2. Wibner AG, Burger IA, Sala E, Hricak H, Weber WA, Vargas HA. Molecular
Imaging of Prostate Cancer. Radiographics. 2016;36(1):142–59. 3. Heidenreich A, Aus G, Bolla M, Joniau S, Matveev VB, Schmid HP, et al.
EAU Guidelines on Prostate Cancer. Eur Urol [Internet]. 2016 Jan;53(1):68–80. Available from: http://www.uroweb.org/fileadmin/tx_eauguidelines/2005/Pocket/Prostate_Cancer.pdf
4. Weineisen M, Schottelius M, Simecek J, Baum RP, Yildiz A, Beykan S, et al. 68Ga- and 177Lu-Labeled PSMA I&T: Optimization of a PSMA-Targeted Theranostic Concept and First Proof-of-Concept Human Studies. J Nucl Med [Internet]. 2015;56(8):1169–76. Available from: http://www.ncbi.nlm.nih.gov/pubmed/26089548
5. Evans JC, Malhotra M, Cryan JF, O’Driscoll CM. The therapeutic and diagnostic potential of the prostate specific membrane antigen/glutamate carboxypeptidase II (PSMA/GCPII) in cancer and neurological disease. Br J Pharmacol [Internet]. 2016 Nov;173(21):3041–79. Available from: http://doi.wiley.com/10.1111/bph.13576
6. Pfestroff A, Luster M, Jilg CA, Olbert PJ, Ohlmann CH, Lassmann M, et al. Current status and future perspectives of PSMA-targeted therapy in Europe: opportunity knocks. Eur J Nucl Med Mol Imaging. 2015;42(13):1971–5.
7. Liolios C, Schäfer M, Haberkorn U, Eder M, Kopka K. Novel Bispecific PSMA/GRPr Targeting Radioligands with Optimized Pharmacokinetics for Improved PET Imaging of Prostate Cancer. Bioconjug Chem. 2016;27(3):737–51.
8. Eder M, Schäfer M, Bauder-Wüst U, Haberkorn U, Eisenhut M, Kopka K. Preclinical evaluation of a bispecific low-molecular heterodimer targeting both PSMA and GRPR for improved PET imaging and therapy of prostate cancer. Prostate. 2014;74(6):659–68.
9. Eder M, Schäfer M, Bauder-Wüst U, Hull WE, Wängler C, Mier W, et al. 68Ga-complex lipophilicity and the targeting property of a urea-based PSMA inhibitor for PET imaging. Bioconjug Chem. 2012;23(4):688–97.
10. Grubmüller B, Baum RP, Capasso E, Singh A, Ahmadi Y, Knoll P, et al. 64 Cu-PSMA-617 PET/CT Imaging of Prostate Adenocarcinoma: First In-Human Studies. Cancer Biother Radiopharm [Internet]. 2016;31(8):cbr.2015.1964. Available from: http://online.liebertpub.com/doi/10.1089/cbr.2015.1964
11. Delker A, Fendler WP, Kratochwil C, Brunegraf A, Gosewisch A, Gildehaus FJ, et al. Dosimetry for (177)Lu-DKFZ-PSMA-617: a new radiopharmaceutical for the treatment of metastatic prostate cancer. Eur J Nucl Med Mol Imaging [Internet]. 2016 Jan 29;43(1):42–51. Available from: http://link.springer.com/10.1007/s00259-015-3174-7
12. Cardinale J, Schäfer M, Benešová M, Bauder-Wüst U, Leotta K, Eder M, et al. Preclinical Evaluation of [18F]PSMA-1007: A New PSMA-Ligand for Prostate Cancer Imaging. J Nucl Med [Internet]. 2016;181768(1):1–27. Available from: http://www.ncbi.nlm.nih.gov/pubmed/27789722
13. Giesel FL, Cardinale J, Schäfer M, Neels O, Benešová M, Mier W, et al. 18F-Labeled PSMA-1007 shows similarity in structure, biodistribution and tumour uptake to the theragnostic compound PSMA-617. Eur J Nucl Med Mol Imaging. 2016;43(10):1929–30.
14. Afshar-Oromieh A, Hetzheim H, Kratochwil C, Benesova M, Eder M, Neels OC, et al. The Theranostic PSMA Ligand PSMA-617 in the Diagnosis of Prostate Cancer by PET/CT: Biodistribution in Humans, Radiation Dosimetry, and First Evaluation of Tumor Lesions. J Nucl Med [Internet]. 2015 Nov 1;56(11):1697–705. Available from: http://jnm.snmjournals.org/content/early/2015/08/19/jnumed.115.161299?papetoc
15. Banerjee SR, Pullambhatla M, Foss CA, Nimmagadda S, Ferdani R,
Anderson CJ, et al. 64Cu-labeled inhibitors of prostate-specific membrane antigen for PET imaging of prostate cancer. J Med Chem [Internet]. 2014;57(6):2657–69. Available from: http://www.pubmedcentral.nih.gov/articlerender.fcgi?artid=3983358&tool=pmcentrez&rendertype=abstract
16. Boswell CA, Sun X, Niu W, Weisman GR, Wong EH, Rheingold AL, et al. Comparative in Vivo Stability of Copper-64-Labeled Cross-Bridged and Conventional Tetraazamacrocyclic Complexes. J Med Chem. 2004;47(6):1465–74.
17. Ghosh SC, Pinkston KL, Robinson H, Harvey BR, Wilganowski N, Gore K, et al. Comparison of DOTA and NODAGA as chelators for 64Cu-labeled immunoconjugates. Nucl Med Biol [Internet]. 2015;42(2):177–83. Available from: http://dx.doi.org/10.1016/j.nucmedbio.2014.09.009
18. Gasser G, Tjioe L, Graham B, Belousoff MJ, Juran S, Walther M, et al. Synthesis, copper(II) complexation, 64Cu-labeling, and bioconjugation of a new bis(2-pyridylmethyl) derivative of 1,4,7- triazacyclononane. Bioconjug Chem. 2008;19(3):719–30.
19. Kumar A, Hao G, Liu L, Ramezani S, Hsieh JT, Öz OK, et al. Click-chemistry strategy for labeling antibodies with copper-64 via a cross-bridged tetraazamacrocyclic chelator scaffold. Bioconjug Chem. 2015;26(4):782–9.
20. Bass LA, Wang M, Welch MJ, Anderson CJ. In Vivo Transchelation of Copper-64 from TETA-Octreotide to Superoxide Dismutase in Rat Liver. Bioconjug Chem [Internet]. 2000 Jul;11(4):527–32. Available from: http://pubs.acs.org/doi/abs/10.1021/bc990167l
21. Ferdani R, Stigers DJ, Fiamengo AL, Wei L, Li BTY, Golen J a, et al. Synthesis, Cu(II) complexation, 64Cu-labeling and biological evaluation of cross-bridged cyclam chelators with phosphonate pendant arms. Dalton Trans [Internet]. 2012;41(7):1938–50. Available from: http://www.pubmedcentral.nih.gov/articlerender.fcgi?artid=3462348&tool=pmcentrez&rendertype=abstract
22. Lewis MR, Wang M, Axworthy DB, Theodore LJ, Mallet RW, Fritzberg AR, et al. In vivo evaluation of pretargeted 64Cu for tumor imaging and therapy. J Nucl Med [Internet]. 2003 Aug;44(8):1284–92. Available from: http://jnm.snmjournals.org/content/44/8/1284.abstract
23. Kumar SR, Gallazzi FA, Ferdani R, Anderson CJ, Quinn TP, Deutscher SL. In Vitro and In Vivo Evaluation of 64 Cu-Radiolabeled KCCYSL Peptides for Targeting Epidermal Growth Factor Receptor-2 in Breast Carcinomas. Cancer Biother Radiopharm [Internet]. 2010;25(6):693–703. Available from: http://www.liebertonline.com/doi/abs/10.1089/cbr.2010.0820
24. Prasanphanich AF, Nanda PK, Rold TL, Ma L, Lewis MR, Garrison JC, et al. [64Cu-NOTA-8-Aoc-BBN(7-14)NH2] targeting vector for positron-emission tomography imaging of gastrin-releasing peptide receptor-expressing tissues. Proc Natl Acad Sci U S A [Internet]. 2007;104(30):12462–7. Available from: http://www.pubmedcentral.nih.gov/articlerender.fcgi?artid=1914305&tool=pmcentrez&rendertype=abstract
25. Dearling JLJ, Voss SD, Dunning P, Snay E, Fahey F, Smith S V., et al. Imaging cancer using PET - the effect of the bifunctional chelator on the biodistribution of a 64Cu-labeled antibody. Nucl Med Biol [Internet]. 2011;38(1):29–38. Available from: http://dx.doi.org/10.1016/j.nucmedbio.2010.07.003
26. Anderson CJ, Ferdani R. Copper-64 radiopharmaceuticals for PET imaging of cancer: advances in preclinical and clinical research. Cancer Biother Radiopharm [Internet]. 2009;24(4):379–93. Available from: http://www.pubmedcentral.nih.gov/articlerender.fcgi?artid=2794299&tool=pmcentrez&rendertype=abstract
27. Rogers BE, Anderson CJ, Connett JM, Guo LW, Edwards WB, Sherman ELC, et al. Comparison of four bifunctional chelates for radiolabeling monoclonal antibodies with copper radioisotopes: Biodistribution and metabolism. Bioconjug Chem. 1996;7(4):511–22.
28. Jones-Wilson TM, Deal KA, Anderson CJ, McCarthy DW, Kovacs Z, Motekaitis RJ, et al. The in vivo behavior of copper-64-labeled

azamacrocyclic complexes. Nucl Med Biol. 1998;25(6):523–30. 29. Dearling JLJ, Paterson BM, Akurathi V, Betanzos-Lara S, Treves ST, Voss
SD, et al. The ionic charge of copper-64 complexes conjugated to an engineered antibody affects biodistribution. Bioconjug Chem. 2015;26(4):707–17.
30. Cai Z, Ouyang Q, Zeng D, Nguyen KN, Modi J, Wang L, et al. 64Cu-labeled somatostatin analogues conjugated with cross-bridged phosphonate-based chelators via strain-promoted click chemistry for PET imaging: In silico through in vivo studies. J Med Chem. 2014;57(14):6019–29.
31. Cooper MS, Ma MT, Sunassee K, Shaw KP, Williams JD, Paul RL, et al. Comparison of 64cu-complexing bifunctional chelators for radioimmunoconjugation: Labeling efficiency, specific activity, and in vitro / in vivo stability. Bioconjug Chem. 2012;23(5):1029–39.
32. Johnbeck CB, Knigge U, Loft A, Berthelsen AK, Mortensen J, Oturai P, et al. Head-to-head comparison of 64Cu-DOTATATE and 68Ga-DOTATOC PET/CT: a prospective study of 59 patients with neuroendocrine tumors. J Nucl Med [Internet]. 2016;451–8. Available from: http://jnm.snmjournals.org/content/early/2016/09/21/jnumed.116.180430.abstract
33. Jin Z-H, Furukawa T, Degardin M, Sugyo A, Tsuji AB, Yamasaki T, et al. αVβ3 Integrin-Targeted Radionuclide Therapy with 64Cu-cyclam-RAFT-c(-RGDfK-)4. Mol Cancer Ther [Internet]. 2016 Sep 1;15(9):2076–85. Available from: http://mct.aacrjournals.org/cgi/doi/10.1158/1535-7163.MCT-16-0040
34. Giesel FL, Hadaschik B, Cardinale J, Radtke J, Vinsensia M, Lehnert W, et al. F-18 labeled PSMA-1007: biodistribution, radiation dosimetry and histopathological validation of tumor lesions in prostate cancer patients. Eur J Nucl Med Mol Imaging [Internet]. 2016; Available from: http://link.springer.com/10.1007/s00259-016-3573-4
35. Kelly J, Amor-Coarasa A, Nikolopoulou A, Kim D, Williams C, Ponnala S, et al. Synthesis and pre-clinical evaluation of a new class of high-affinity 18F-labeled PSMA ligands for detection of prostate cancer by PET imaging. Eur J Nucl Med Mol Imaging [Internet]. 2016; Available from: http://link.springer.com/10.1007/s00259-016-3556-5
36. Chen Y, Foss CA, Byun Y, Nimmagadda S, Pullambhatla M, Fox JJ, et al. Radiohalogenated Prostate-Specific Membrane Antigen (PSMA)-Based Ureas as Imaging Agents for Prostate Cancer. J Med Chem [Internet]. 2008 Dec 25;51(24):7933–43. Available from: http://pubs.acs.org/doi/abs/10.1021/jm801055h
37. Cleeren F, Lecina J, Billaud EMF, Ahamed M, Verbruggen A, Bormans GM. New Chelators for Low Temperature Al18F-Labeling of Biomolecules. Bioconjug Chem. 2016;27(3):790–8.
38. Benešová M, Schäfer M, Bauder-Wüst U, Afshar-Oromieh A, Kratochwil C, Mier W, et al. Preclinical Evaluation of a Tailor-Made DOTA-Conjugated PSMA Inhibitor with Optimized Linker Moiety for Imaging and Endoradiotherapy of Prostate Cancer. J Nucl Med. 2015;56(6):914–20.
39. Harada N, Kimura H, Onoe S, Watanabe H, Matsuoka D, Arimitsu K, et al. Synthesis and Biological Evaluation of Novel 18F-Labeled Probes Targeting Prostate-Specific Membrane Antigen for Positron Emission Tomography of Prostate Cancer. J Nucl Med [Internet]. 2016;57(12):1978–85. Available from: http://www.ncbi.nlm.nih.gov/pubmed/27417647
40. Malik N, Baur B, Winter G, Reske SN, Beer AJ, Solbach C. Radiofluorination of PSMA-HBED via Al18F2+ Chelation and Biological Evaluations In Vitro. Mol Imaging Biol. 2015;17(6):777–85.
41. Afshar-Oromieh A, Malcher A, Eder M, Eisenhut M, Linhart HG, Hadaschik BA, et al. PET imaging with a [68Ga]gallium-labeled PSMA ligand for the diagnosis of prostate cancer: biodistribution in humans and first evaluation of tumour lesions. Eur J Nucl Med Mol Imaging. 2013;40(4):486–95.
42. Eder M, Neels O, Müller M, Bauder-Wüst U, Remde Y, Schäfer M, et al. Novel preclinical and radiopharmaceutical aspects of [68Ga]Ga-PSMA-HBED-CC: A new PET tracer for imaging of prostate cancer. Pharmaceuticals. 2014;7(7):779–96.
43. Boschi S, Lee JT, Beykan S, Slavik R, Wei L, Spick C, et al. Synthesis and preclinical evaluation of an Al18F radiofluorinated GLU-UREA-LYS(AHX)-HBED-CC PSMA ligand. Eur J Nucl Med Mol Imaging [Internet]. 2016 Nov 22;43(12):2122–30. Available from: http://dx.doi.org/10.1007/s00259-016-3437-y
44. Chen Y, Pullambhatla M, Foss CA, Byun Y, Nimmagadda S, Senthamizhchelvan S, et al. 2-(3-{1-carboxy-5-[(6-[ 18F]fluoro-pyridine-3-carbonyl)-amino]- pentyl}-ureido)-pentanedioic acid, [ 18F]DCFPyL, a PSMA-based PET imaging agent for prostate cancer. Clin Cancer Res. 2011;17(24):7645–53.
45. Bouvet V, Wuest M, Jans H-S, Janzen N, Genady AR, Valliant JF, et al. Automated synthesis of [(18)F]DCFPyL via direct radiofluorination and validation in preclinical prostate cancer models. EJNMMI Res [Internet]. 2016;6(1):40. Available from: http://www.ncbi.nlm.nih.gov/pubmed/27142881%5Cnhttp://www.pubmedcentral.nih.gov/articlerender.fcgi?artid=PMC4854855
46. Kulshrestha RK, Vinjamuri S, England A, Nightingale J, Hogg P. The Role of 18F-Sodium Fluoride PET/CT Bone Scans in the Diagnosis of Metastatic Bone Disease from Breast and Prostate Cancer. J Nucl Med Technol [Internet]. 2016;44(4):217–22. Available from: http://www.ncbi.nlm.nih.gov/pubmed/27634981
47. Szabo Z, Mena E, Rowe SP, Plyku D, Nidal R, Eisenberger MA, et al. Initial Evaluation of [(18)F]DCFPyL for Prostate-Specific Membrane Antigen (PSMA)-Targeted PET Imaging of Prostate Cancer. Mol Imaging Biol [Internet]. 2015;17(4):565–74. Available from: http://www.pubmedcentral.nih.gov/articlerender.fcgi?artid=4531836&t
ool=pmcentrez&rendertype=abstract 48. Dietlein M, Kobe C, Kuhnert G, Stockter S, Fischer T, Schomäcker K, et al.
Comparison of [18F]DCFPyL and [68Ga]Ga-PSMA-HBED-CC for PSMA-PET Imaging in Patients with Relapsed Prostate Cancer. Mol Imaging Biol. 2015;17(4):575–84.
49. Conti M. New prospects for PET in prostate cancer imaging: a physicist’s viewpoint. EJNMMI Phys [Internet]. 2014;1(1):11. Available from: http://www.pubmedcentral.nih.gov/articlerender.fcgi?artid=4545809&tool=pmcentrez&rendertype=abstract
50. Sanchez-Crespo A. Comparison of Gallium-68 and Fluorine-18 imaging characteristics in positron emission tomography. Appl Radiat Isot [Internet]. 2013 Jun;76:55–62. Available from: http://dx.doi.org/10.1016/j.apradiso.2012.06.034
51. Qaim SM. Nuclear data for production and medical application of radionuclides: Present status and future needs. Nucl Med Biol [Internet]. 2016;44:31–49. Available from: http://linkinghub.elsevier.com/retrieve/pii/S0969805116302190
52. Pond GR, Sonpavde G, De Wit R, Eisenberger MA, Tannock IF, Armstrong AJ. The prognostic importance of metastatic site in men with metastatic castration-resistant prostate cancer. Eur Urol [Internet]. 2014;65(1):3–6. Available from: http://dx.doi.org/10.1016/j.eururo.2013.09.024
53. Baur B, Solbach C, Andreolli E, Winter G, Machulla HJ, Reske SN. Synthesis, radiolabeling and in vitro characterization of the gallium-68-, yttrium-90- and lutetium-177-labeled PSMA Ligand, CHX-A"-DTPA-DUPA-Pep. Pharmaceuticals. 2014;7(5):517–29.
54. Chong H-S, Sun X, Chen Y, Sin I, Kang CS, Lewis MR, et al. Synthesis and comparative biological evaluation of bifunctional ligands for radiotherapy applications of 90Y and 177Lu. Bioorg Med Chem [Internet]. 2015 Mar;23(5):1169–78. Available from: http://linkinghub.elsevier.com/retrieve/pii/S0968089614008839
55. Kang CS, Chen Y, Lee H, Liu D, Sun X, Kweon J, et al. Synthesis and evaluation of a new bifunctional NETA chelate for molecular targeted radiotherapy using90Y or177Lu. Nucl Med Biol [Internet]. 2015 Mar;42(3):242–9. Available from: http://linkinghub.elsevier.com/retrieve/pii/S0969805114005186
56. Weineisen M, Simecek J, Schottelius M, Schwaiger M, Wester H-J. Synthesis and preclinical evaluation of DOTAGA-conjugated PSMA ligands for functional imaging and endoradiotherapy of prostate cancer. EJNMMI Res [Internet]. 2014;4(1):1–15. Available from: http://www.ejnmmires.com/content/4/1/63
57. Rahbar K, Ahmadzadehfar H, Kratochwil C, Haberkorn U, Schafers M, Essler M, et al. German multicenter study investigating 177Lu-PSMA-617 radioligand therapy in advanced prostate cancer patients. J Nucl Med [Internet]. 2016; Available from: http://jnm.snmjournals.org/cgi/doi/10.2967/jnumed.116.183194
58. Fendler WP, Reinhardt S, Ilhan H, Delker A, Böning G, Gildehaus FJ, et al. Preliminary experience with dosimetry, response and patient reported outcome after 177Lu-PSMA-617 therapy for metastatic castration-resistant prostate cancer. Oncotarget [Internet]. 2016 Sep 24; Available from: http://www.oncotarget.com/abstract/12240
59. Breeman W a P, van der Wansem K, Bernard BF, van Gameren A, Erion JL, Visser TJ, et al. The addition of DTPA to [177Lu-DOTA0,Tyr3]octreotate prior to administration reduces rat skeleton uptake of radioactivity. Eur J Nucl Med Mol Imaging. 2003;30(2):312–5.
60. Heck MM, Retz M, D’Alessandria C, Rauscher I, Scheidhauer K, Maurer T, et al. Systemic Radioligand Therapy with 177Lu Labeled Prostate Specific Membrane Antigen Ligand for Imaging and Therapy in Patients with Metastatic Castration Resistant Prostate Cancer. J Urol. 2016;196(2):382–91.
61. Kratochwil C, Giesel FL, Eder M, Afshar-Oromieh A, Benešová M, Mier W, et al. [177Lu]Lutetium-labeled PSMA ligand-induced remission in a patient with metastatic prostate cancer. Eur J Nucl Med Mol Imaging. 2015;42(6):987–8.
62. Shetty HU, Zoghbi SS, Liow JS, Ichise M, Hong J, Musachio JL, et al. Identification and regional distribution in rat brain of radiometabolites of the dopamine transporter PET radioligand [11C]PE2I. Eur J Nucl Med Mol Imaging. 2007;34(5):667–78.
63. Campbell MG, Mercier J, Genicot C, Gouverneur V, Hooker JM, Ritter T. Bridging the gaps in 18F PET tracer development. Nat Chem [Internet]. 2016;9(1):1–3. Available from: http://www.nature.com/doifinder/10.1038/nchem.2693
64. Wild D, Frischknecht M, Zhang H, Morgenstern A, Bruchertseifer F, Boisclair J, et al. Alpha- versus beta-particle radiopeptide therapy in a human prostate cancer model (213Bi-DOTA-PESIN and 213Bi-AMBA versus 177Lu-DOTA-PESIN). Cancer Res. 2011;71(3):1009–18.
65. Bandekar a., Zhu C, Jindal R, Bruchertseifer F, Morgenstern A, Sofou S. Anti-Prostate-Specific Membrane Antigen Liposomes Loaded with Ac-225 for Potential Targeted Antivascular alpha-Particle Therapy of Cancer. J Nucl Med. 2014;55(1):107–14.
66. Price EW, Orvig C. Matching chelators to radiometals for radiopharmaceuticals. Chem Soc Rev [Internet]. 2014;43(1):260–90. Available from: http://pubs.rsc.org/en/content/articlehtml/2014/cs/c3cs60304k
67. Kratochwil C, Afshar-Oromieh A, Kopka K, Haberkorn U, Giesel FL. Current Status of Prostate-Specific Membrane Antigen Targeting in Nuclear Medicine: Clinical Translation of Chelator Containing Prostate-Specific Membrane Antigen Ligands Into Diagnostics and Therapy for Prostate Cancer. Semin Nucl Med [Internet]. 2016;46(5):405–18. Available from: http://dx.doi.org/10.1053/j.semnuclmed.2016.04.004

Chapter II
Bioanalysis of [68Ga]Ga-PSMA-11 in Human Liver and Kidney Microsomes and
in Human Plasma

Kamp, J
EXPERIMENTAL STUDIES
32 | P a g e
Abstract n this chapter, the main aim was to develop a bioanalytical method for the detection of [68Ga]Ga-PSMA-11 in biological samples. First, two methods for sample preparation were evaluated. Once a protocol for the sample preparation was developed, a radio-UPLC method was set up, and LOQ/LOD and recov-
ery values were determined. In addition, we aimed to set up an LC/MS-TOF method for the identification of potential metabolites. Finally, the sample preparation and radio-UPLC methods were used to evaluate the metabolic stability of the tracer in vitro in human plasma and human liver and kidney microsomes and in vivo in four mCRPC patients.
Solid phase extraction (SPE) showed to be a suitable method for sample preparation. Furthermore, ra-dio-UPLC analysis indicated a minimal tracer metabolism in human microsomes, human plasma and in patients.
The UV-UPLC method lacked the sensitivity needed for the quanification of [68Ga]Ga-PSMA-11 blood levels in patients. Moreover, radio-UPLC recovery values were found to be > 100%. No microsome studies with LC/MS-TOF analysis could be performed due to problems with the calibration of the system.
The exact cause of high recoveries remains to be elucidated for future studies. Furthermore, the influ-ence of Ga-PSMA-11 diastereomers on the metabolism should be evaluated. The LC/MS/MS method showed promising results, and this method should therefore be optimized for future pharmaco kinetic studies in patients. In addition, the LC/MS-TOF method remains to be developed for identification of po-tential metabolites.
Keywords: [68Ga]Ga-PSMA-11, Microsome studies, Metabolism, Positron Emission Tomography, Prostate Cancer
1. Introduction
he metabolic behaviour of a PET-tracer may have profound effects on the PET image. By taking possible interactions between the tracer and
certain drugs into account, or by correcting for back-ground signals caused by non-specific binding of radio-metabolites, a more realistic image intepretation and a more precize tracer quantification will be possible. Such improvements can be helpful when evaluating the effi-cacy of a certrain therapy or for the staging of the tumor by means of PET/CT. Therefore, a decent understanding of PET/CT tracer PK and metabolism is feasible. Moreo-ver, as discussed in chapter I, the integration of meta-bolic studies in the standard tracer developing process, may alter the efficiency of the way we are currently developing new radio tracers.
However, despite the importance of metabolism and PK studies, most studies concerning tracer development only briefly address metabolism. Examples of such stud-ies are the evaluation of the tracer stability in plasma, or the evaluation of the activity accumulation in specific parts of the body, which may indicate transchelation ̶ such as the accumulation of copper in the liver (1). However, only a few in vivo studies were found in which detailed metabolic experiments were performed as part of the tracer development (2,3). Furthermore, no re-ports describing microsome studies or in vivo metabo-lite identification with Mass Spectrometry were found for PSMA targeting tracers.
A similar trend is seen for the pharmacokinetics of PET/CT tracers. Chapter I showed that the pharmacoki-netics of new tracers are usually evaluated by using PET data. However, during the literature review study, we did not encounter any reports in which tracer blood concentrations were evaluated. Furthermore, no re-
ports were found wherein tracer plasma protein bind-ing was evaluated. Such data may also benefit image interpretation, since certain drug-tracer interactions or certain diseases can alter the unbound fraction of the tracer, which ̶ in turn ̶ influences tracer clearance and distribution to peripheral tissues.
Therefore, a research project was initiated by our department (Nuclear Medicine and Molecular Imaging, UMCG, Groningen, the Netherlands), in an attempt to enhance our knowledge about the metabolism and pharmacokinetics of the [68Ga]Ga-PSMA-11 tracer. Alt-hough this tracer was developed only a few years ago, it is already considered to be the gold standard for mCRPC PET/CT imaging. The research project that was setup by our departement, could be divided in three main topics: (1) the setup of a quantitative and qualitative (bio)analysis methods for Ga-PSMA-11, (2) in vitro and in vivo quantification and identification of tracer metab-olites and (3) the development of a population pharma-cokinetic model. Because of practical reasons, the aim was to develop analytical methods that did not depend on radio activity for the detection of [68Ga]Ga-PSMA-11 and its metabolites.
In this chapter, the main aim was to develop a bio-analytical method for the detection of [68Ga]Ga-PSMA-11 in biological samples. To develop such a method, we first evaluated two methods for sample preparation. Once a protocol for the sample preparation was devel-oped, a radio-UPLC method was set up, and LOQ/LOD and recovery values were determined. In addition, we aimed to set up a LC/MS method for the identification of potential metabolites. Finally, the sample preparation and radio-UPLC methods were used to evaluate the metabolic stability of the tracer in vitro in human plas-ma and human liver and kidney microsomes and in vivo in four mCRPC patients.
I
T

Kamp, J
EXPERIMENTAL STUDIES
33 | P a g e
2. Methods
2.1 Software Empower 3 Chromatography data software (Waters
Corporation, Milford, USA) was used to process the UPLC data and as the UPLC hardware driver. Microsoft Excel 2010 was used for raw data processing. Sigmaplot 13.0 (Systat Software Inc., Illinois, USA) was used for data visualization and to perform regression analyses, used for the calibration curves. ChemSketch (ACD/Labs, Toronto, Canada) was used to draw the chemical struc-tures of PSMA-11 and reference Ga-PSMA-11, after which the chemical structures were imported to Mass-Lynx to enable parent and fragment recognition. Mass-Lynx™ (Waters Corporation, Milford, USA) was used to drive the mass spectrometry systems.
2.2 [68Ga]Ga-PSMA-11 preparation For the experiments with [68Ga]Ga-PSMA-11,
[68Ga]Ga-PSMA-11 ̶ that was left over from the prepa-ration of patient doses or from the quality control (QC) ̶ was used. [68Ga]Ga-PSMA-11 was prepared by the GMP production facility in our department, accord-ing to the [68Ga]Ga-PSMA-11 production protocol (4). The Gallium-68 was continiously produced from Ger-manium-68 (half-life of 271 days) in a 68Ge/68Ga genera-tor (Eckert & Ziegler) and eluted with 0,1 M HCl. The Gallium-68 was trapped on a PS-H+ cartridge and the cartridge was rinsed with water. The Gallium-68 was eluted from the cartridge with 1,7 ml 5 M NaCl. 10µg PSMA-11 precursor (ABX Advanced Biochemical Com-pounds, Radeberg, Germany) was dissolved in 2 ml HEPES 1,5M buffer. Both solutions were allowed to react for 10 min at 100°C. After the labeling reaction, the mixture was cooled down and transferred to a C18 light cartridge. The C18 cartridge was rinsed with water and the [68Ga]Ga-PSMA-11 was eluted from the car-tridge with 2 ml of 50% ethanol in water and 10 ml PBS. The product was then passed through a 22 µm filter for sterilization to obtain the end product. PSMA-11 (pre-cursor for Ga-PSMA-11) and the Ga-PSMA-11 reference compound used in this thesis, were supplied by ABX Advanced Biochemical Compounds, Radeberg, Germa-ny.
2.3 Bioanalysis
Sample Preparation Venous blood samples were collected from the pa-
tients (n = 4) and centrifuged at 3000 rpm for 10 minutes (Hettich Zentrifugen; Rotana 46 RS). The plasma was separated from the blood cell fraction and 150 µl 1M HCl per 1 ml plasma was added. The mixture was transferred to a C18 OASIS 6cc SPE column and the column was rinsed with 2 ml UP water. The [68Ga]Ga-PSMA-11 was eluted from the column with 2 ml of a 200 µl 1M HCl in 2 ml 70% ethanol solution and the eluate was collected in four fractions of 0,5 ml per fraction. For each fraction, the activity (in counts per minute, Cpm) was measured in a wellcounter (Wallac 1282 Com-pugamma well counter (Software: CLcom, ‘kinderklar-ing C11’ protocol).
Blood samples from 4 patients ̶ who were planned for [68Ga]Ga-PSMA-11 PET/CT ̶ were used to evaluate the sample preparation methods. Blood sampling was initially performed 1 hour p.i. (one patient). However, because of the short half-life of Gallium-68 (68 minutes), we decided to sample at 30 minutes p.i. for the other three patients. The total activity recovery (%) in the elution fractions was used as a measure for the [68Ga]Ga-PSMA-11 recovery. All SPE fractions were collected and measured in the wellcounter and the re-maining activity on the SPE column itself was measured. Table 1 shows an overview of the samples used for the SPE evaluation.
The percentage activity in each fraction, relative to the total activity, was calculated with the formula:
𝑃𝑒𝑟𝑐𝑒𝑛𝑡𝑎𝑔𝑒 𝑎𝑐𝑡𝑖𝑣𝑖𝑡𝑦 𝑖𝑛 𝑓𝑟𝑎𝑐𝑡𝑖𝑜𝑛 𝑥 =
𝐶𝑝𝑚 𝑓𝑟𝑎𝑐𝑡𝑖𝑜𝑛 𝑥
𝑇𝑜𝑡𝑎𝑙 𝑐𝑝𝑚 𝑜𝑓 𝑎𝑙𝑙 𝑓𝑟𝑎𝑐𝑡𝑖𝑜𝑛𝑠 × 100%
The total recovery (%) in the elution fractions was
calculated as: 𝑅𝑒𝑐𝑜𝑣𝑒𝑟𝑦 (%)
= 𝐸𝑙𝑢𝑡𝑖𝑜𝑛 𝐼 (%) + 𝐸𝑙𝑢𝑡𝑖𝑜𝑛 𝐼𝐼 (%) + 𝐸𝑙𝑢𝑡𝑖𝑜𝑛 𝐼𝐼𝐼 (%) + 𝐸𝑙𝑢𝑡𝑖𝑜𝑛 𝐼𝑉 (%)
The second method for sample preparation was
based on the precipitation of plasma proteins with ace-tonitrile (ACN) (5). Because such a precipitation method is less labour intensive than the SPE method, this ACN method could simplify sample preparation. An existing
Sample Description
Waste Fraction after running plasma through the column
Wash Fraction after rinsing with 2ml UP water
Elution I Fraction after eluting with 2 ml acidic 70% V/V ethanol (500μl) (I)
Elution II Fraction after eluting with 2 ml acidic 70% V/V ethanol (500μl) (II)
Elution III Fraction after eluting with 2 ml acidic 70% V/V ethanol (500μl) (III)
Elution IV Fraction after eluting with 2 ml acidic 70% V/V ethanol (500μl) (IV)
SPE column Resting activity in the SPE column after elution.
Table 1: Overview of the different SPE fractions.

Kamp, J
EXPERIMENTAL STUDIES
34 | P a g e
method for the precipitation of proteins in microsome studies (appendix II), was initially used for the precipi-tation of plasma proteins and was modified to improve the recovery.
The mixtures were incubated 0h and 1h at 37°C. 1 ml human plasma was spiked with 40 μl [68Ga]Ga-PSMA-11 solution and 800 µl ACN with 0,1% formic acid (FA) was added to 400 μl of the spiked mixture to precipitate plasma proteins. The mixture was centri-fuged for 5 minutes at 3000 rpm and the supernatant was separated from the pellet. Relative amounts of ac-tivity present in the supernatant and pellet were meas-ured with a Wallac 1282 Compugamma wellcounter (software: CLcom, ‘kinderklaring C11’ protocol). In addition, a plasma sample (1h p.i.) from a patient who was planned for [68Ga]Ga-PSMA-11 PET/CT, was pre-pared with a slighlty modified protocol, in which 3 ml ACN, without FA, was added to 3 ml plasma. UPLC System setup
A Waters Acquity H-Class UPLC system (C18, 250 x 4, 6 mm, 5 µm reversed phase column) connected to a fraction sampler (Waters fraction collector III) was used for UPLC analysis and to collect fractions (sampling interval of 30 seconds). For later experiments, an online activity detector (Berthold FlowStar LB 513) was added to the system. A 0,1% trifluoric acid (TFA) in water solution was used as polar mobile phase (A) and a 0,1% TFA in ACN solution was used as nonpolar mobile phase (B). The mobile phase gradient was 5% to 15% B 0-5 min, 15% to 60%B 5-10 min and 60% to 15% B 10-11 min.
For the evaluation of the optimal UV wavelength, two standard PSMA-11 precursor solutions (5 µg/ml
and 20 µg/ml in UP water) were used. Both standards were analysed by UPLC with varying wavelengths (200 nm, 220 nm and 250 nm). The selected wavelengths were based on wavelengths reported in literature (5,8).
UPLC Calibration A UPLC calibration curve was warranted to enable
the quantification of the PSMA-11 precursor and Ga-PSMA-11. Two calibration curves were prepared by dissolving 10 µg GMP grade PSMA-11 in 500 µl UP wa-ter (calibration series I) or 50% ethanol (calibration series II). The series I and II (A) were diluted with UP water and 50% ethanol respectively to obtain the other calibration standard solutions (table 2 & 3). The cali-bration standards were injected onto the UPLC and measured with λ = 200 nm and λ = 220 nm (series I) and λ = 220 nm (series II). The area under the curve (AUC) of each PSMA-11 peak was determined and set out against the PSMA-11 concentration. Sigma plot was used for the regression analysis. The limit of detection (LOD) and limit of quantification (LOQ) were calculated in Excel, as shown in appendix I. Calibration series I was analyzed 5 days after preparation and stored at 4°C.
UPLC Characteristics of the HBED-CC chelator Several milligrams of HBED-CC-di(tBu)ester (ABX Advanced Biochemical Compounds, Radeberg, Germa-ny) were dissolved in 1 ml 50% ACN in UP water and the sample was injected onto the UPLC with injection volumes of 10 μl, 30 μl and 50 μl. The UPLC chromato-grams from the HBED-CC were compared to PSMA-11 UPLC chromatograms that were obtained in earlier experiments.
Calibration standard Concentration PSMA-11 (µg/ml) Calibration standard(µl) UP water (µl)
A 20 - -
B 15 75 (A) 25
C 10 50 (A) 50
D 5 25 (A) 75
E 1 10 (C) 90
F 0,5 10 (D) 90
G 0 - 100
Table 2: Preparation of PSMA-11 calibration curve I for UV-UPLC analysis.
Calibration standard Concentration PSMA-11 (µg/ml) Calibration standard(µl) 50% ethanol (µl)
A 20 - -
B 15 30 (A) 10
C 10 30 (A) 30
D 5 10 (A) 30
E 2,5 10 (C) 30
F 1 10 (C) 90
G 0,5 50 (F) 50
H 0 - -
Table 3: Preparation of PSMA-11 calibration curve II for UV-UPLC analysis.

Kamp, J
EXPERIMENTAL STUDIES
35 | P a g e
UPLC recovery The UPLC recovery was evaluated
to confirm that all tracer molecules are eluted from the column. In addi-tion, the influence of the UPLC injec-tion volume (10 µl, 20 µl and 50 µl) on the recovery was evaluated. A [68Ga]Ga-PSMA-11 QC sample was used for all evaluations. Between every UPLC run, a blanc sample (UP water) was injected to limit potential carry-over between runs. UPLC frac-tions were collected per 30 seconds and the activity of these fractions was measured in the Perkin Elmer gamma counter. Furthermore, 9 blanc sam-ples were included in the counting run and three QC reference samples, with the same volume as the corre-sponding injection volume, were included in the counting run. Recov-ery values were expected to be ap-proximately 100% or lower. An over-view of the sample sequence is in shown in appendix III.
To exclude potential contamina-tion of the UPLC column with long living radioactive isotopes, a blanc sample (UP water) was injected onto the UPLC. Fractions were collected per 30 seconds, and activity was measured for each fraction (Perkin Elmer Wizard 2 2480 Automatic gamma counter. Protocol 26, 68Ga, 15 seconds). Recovery percentages were calculat-ed as:
𝑅𝑒𝑐𝑜𝑣𝑒𝑟𝑦 (%) =𝑇𝑜𝑡𝑎𝑙 𝐶𝑝𝑚 𝑜𝑓 𝑎𝑙𝑙 𝑈𝑃𝐿𝐶 𝑓𝑟𝑎𝑐𝑡𝑖𝑜𝑛𝑠
(𝑀𝑒𝑎𝑛) 𝐶𝑝𝑚 𝑜𝑓 𝑟𝑒𝑓𝑒𝑟𝑒𝑛𝑐𝑒 𝑠𝑎𝑚𝑝𝑙𝑒(𝑠)× 100%
Mass Spectrometer tuning Before starting any LC/MS experiments, it was nec-
essary to be able to identify our parent compounds: the PSMA-11 precursor or Ga-PSMA-11 reference com-pound. A LC/MS system setup combining the Waters Acquity UPLC H-Class and a Waters Xevo G2 Q-TOF (Time of Flight) mass spectrometer was used for most studies in which a LC/MS was used, unless stated oth-erwise. In addition, the molecule formula obtained with ChemSketch was used to calculate the molecular weight of the neutral PSMA-11 and natGa-PSMA-11 molecules. The chemical structures are shown in fig. 1. The calcu-
lated m/z ratios for both the precursor and for the natGa-PSMA-11 reference are shown in table 4.
Precursor 10 µg GMP grade PSMA-11 precursor was dissolved
in 500 μl UP water. The exact PSMA-11 molecular weight was calculated with ChemSketch (Mw = 946,425Da). Initially, standard LC settings (10 μl injec-tion volume, A = 0,1% formic acid, B = ACN, flow rate = 0,6 ml/min. Gradient 2% to 100% B 0-5 min, 100% ; 5-5,5 min, 100% to 2% B 5,5-5,6 min) and MS settings were used (see appendix V), positive ionization mode [ESI+], fragment scans for m/z 947,425±0,1Da and 474,216±0,1Da).
To further limit peak tailing, the nonpolar mobile phase (B) was changed to a more acidic solution of 0,1% FA acid in ACN. After replacing the old solution B, for the 0,1% FA in ACN, the system was primed and the PSMA-11 sample was run for a second time.
A tandem LC/MS/MS quantification method was set up to verify the amount of PSMA-11 precursor in the GMP vial. This method used a tandem LC/MS/MS sys-tem (Waters ACQUITY UPLC I-Class & Waters, Xevo-TQ-
s), because of its more favourable quantification qualities compared to the time of flight (TOF) MS which was used for the other MS studies. For sys-tem tuning, 10 µg PSMA-11 precursor was dis-solved in 500 μl 50% ethanol. This stock solution was diluted 10x in 0,1% FA in water (2 µg/ml). Both positive (ESI+) and negative (ESI-) ionization modes were evaluated. A rounded molecular weight of 947Da (7) for the PSMA-11 precursor was used for LC/MS/MS tuning, because of the low resolution of the LC/MS/MS system.
A
B
Fig. 1: Chemical structures of PSMA-11 (A) and Ga-PSMA-11 (B).
Charge PSMA-11 m/z nat Ga-PSMA-11 m/z
Neutral 946,42 1012,33
1+ 947,42 1013,33
2+ 474,21 507,16
1- 945,42 1011,33
2- 472,21 504,66
Table 4: Calculated m/z ratios for PSMA-11 and natGa-PSMA-11.
Kamp, J
EXPERIMENTAL STUDIES
36 | P a g e
Initially, for the UPLC separation prior to MS/MS analysis, an XBridge C18, 2,1x100mm, 1,7 µm UPLC column was used (column temperature 50°C). A 0,1% FA in water solution was used as polar mobile phase (A) and a 0,1% FA in ACN solution was used as nonpo-lar mobile phase (B). Mobile phase flow rate was 0,4 ml/min. The mobile phase gradient was 0% to 100% B 0-6 min, 100% B 6-7 min and 0% B from 7,01 min.
Due to peak tailing, a further optimization of the sys-tem was needed. Therefore, several types of UPLC col-umns were tested (table 6). In addition, column tem-perature was lowered to 40°C to limit peak tailing. The flow rate remained unchanged. The mobile phase gradi-ent was slightly altered: 0% to 100% B 5 min, 100% B 5-6 min and 0% B after 6,01 min.
Ga-PSMA-11 reference 1 mg (± 5% weighing error, as supplied by ABX) of
natGa-PSMA-11 reference compound was dissolved in 1,0 ml UP water (1,0 mg/ml). Since PSMA-11 and Ga-PSMA-11 are very similar compounds, the same LC/MS-TOF setup was used for both compounds. Setup details are described above. The calculated molecular weight of the neutral Ga-PSMA-11 molecule was 1012,327Da. Therefore, the sample was set to scan in ESI+ for a m/z of 1013,3±0,1Da. The mass fragment function from MassLynx was used to identify the natGa-PSMA-11 frag-ments.
LC/MS-TOF Calibration For the LC/MS-TOF calibration, two calibration
curves were prepared. Standards for calibration curve I were prepared in duplo by dissolving 1,0 mg natGa-PSMA-11 in 1 ml UP water (1 mg/ml stock solution). The stocksolution was diluted 100x and 10.000x with UP water. Each standard was injected onto the LC/MS-TOF with injection volumes of 10 μl, 5 μl and 1 μl.
Standards for calibration curve II were prepared by diluting the stock solution 10x, 100x and 1000x with UP water. The standards were injected onto the LC/MS-TOF with a fixed injection volume of 10µl.
2.4 Metabolism and stability
Effect of Gallium on tracer stability To assess the effect of Gallium complexation on the
PSMA-11 molecule stability, a PSMA-11 solution and a natGa-PSMA-11 solution were analysed twice by UPLC, with a 3 day interval between each measurement. The PSMA-11 solution was prepared by dissolving 10 μg of PSMA-11 in 500 μl UP water. The natGa-PSMA-11 solu-tion was prepared by dissolving 1,0 mg (±5%, with a maximum deviation of 0,5 mg (6)) in 1,0 ml UP water. Between the UPLC analyses, the samples were stored at 4°C. UV AUCs of the two measurements of each sample were compared. A decrease in UV AUC was assumed to indicate a decrease in analyte concentration, and there-fore indicated the degradation of the analyte.
In vitro metabolism studies In vitro metabilic and stability studies were per-
formed in human liver microsomes (20 mg/ml proteins, Xenotech, H1000, Lot./No. 0710494), kidney micro-somes (10 mg/ml proteins Xenotech, H0005.R, Lot./No. 0510090) and human plasma. The microsome studies were used to evaluate the phase I metabolism (oxidation, reduction or hydrolysis reactions) of [68Ga]Ga-PSMA-11, whereas the studies in plasma per-formed to evaluate the tracer stability in physiological fluids. The setup of the microsome studies was based on the protocol for microsome studies from our depart-ment (appendix II).
For the microsome studies, a mixture of 320 µl PBS (340 µl for the control sample), 50 µl [68Ga]Ga-PSMA-11 solution and 10 µl liver or kidney microsomes was pre-pared. The mixtures were pre-incubated at 37°C for 5 minutes in a water bath. After 5 minutes, 20 µl of a 20 mM NADPH solution was added to each mixture, except for the control sample. The 20 mM NADPH solution was prepared by adding 250 µl of solution A to 10 µl solu-tion B (NADPH system solutions A and B, Gentest™, Discovery labware USA). Reaction mixtures were incu-bated for t = 0 min and t = 45 min at 37°C. To stop the reactions, 800 µl 0,1% FA in ACN was added to the reac-tion mixture at the designated time points and the sam-ple was centrifuged for 5 minutes at 3000 rpm (Hettich Zentrifugen, mikro 20). The supernatant, was injected (injection volume 50 μl) onto the UPLC. UPLC fractions were collected per 30 seconds and analysed in a well-counter (Wallac 1282 Compugamma well counter. CLcom, ‘kinderklaring C11’ protocol). The data was used to evaluate the presence of potential radio-metabolites by comparing the retention time of the activity peaks in the fractions with the known retention time of Ga-PSMA-11 for the UPLC method (Tret ≈ 7,9 minutes). A [68Ga]Ga-PSMA-11 QC sample was run onto the UPLC system prior to the microsome samples as a system check.
In a similar experiment, three mixtures of 350 µl human plasma and 50 µl [68Ga]Ga-PSMA-11 solution were prepared and incubated at 37°C for t = 0 min, t = 45 min and t = 60 min. After incubation, both samples were prepared and analysed as described above. The final samples were analysed in the same way as the microsome samples. For the latter sample, the pellet was reconstituted with 500 µl UP water. This sample was centrifuged 5 min. at 3000 rpm and injected onto the UPLC.
Metabolic stability in patients Four venous blood samples from different patients
were used to evaluate the metabolic stability of [68Ga]Ga-PSMA-11 in the human plasma. After the SPE sample preparation, the samples were injected onto the UPLC (injection volume 50μl). In addition, for patient sample I, the supernatant obtained by the ACN method was injection onto the UPLC, to be able to compare the

Kamp, J
EXPERIMENTAL STUDIES
37 | P a g e
SPE and the ACN method. The UPLC was connected to an online activity detector (Berthold FlowStar LB 513). UPLC fractions were collected per 30 seconds. After completing the UPLC run (12 minutes) the fractions were measured in a wellcounter (Wallac 1282 Com-pugamma CS; software: CLcom, ‘kinderklaring C11’ protocol or a Perkin Elmer Wizard 2 2480 Automatic gamma counter. Protocol 26, 68Ga, 15 seconds). The retention time of the activity peaks was compared with the retention time of Ga-PSMA-11 and with the reten-tion time of the activity peak of a QC [68Ga]Ga-PSMA-11 sample. The highest activity in the fractions was ex-pected to be around 8 minutes, based on the known retention time of PSMA (Tret ≈ 7,9 minutes).
3. Results
3.1 Bioanalysis
Sample Preparation SPE Recovery values are shown in table 5. The SPE
method showed relatively stable and high recovery percentages (range 91,2%-97,4%).
ACN method evaluation in spiked the plasma sam-ples (n = 2) showed total activities of 2341872 Cpm and 2180393 Cpm. The pellets from both samples contained 92,7% and 92,5% of the total activity. In contrast, the supernatant fractions from both samples only contained 7,3 % and 7,5 %. After modification of the ACN method, 42,8 % of the total activity was present in the pellet, whereas 57,2 % was present in the supernatant.
UPLC System setup The UV absorption curves are shown in fig. 2 and
fig. 3. Wavelengths of 200 nm and 250 nm did not show a clear UV peak around Tret = 7,9 minutes for the 5,0 µl/mg sample, whereas a clear peak was observed with λ = 220 nm. For the 20 µl/mg sample, no peak around Tret = 7,9 min was detected with λ = 250 nm. However, both λ = 200 nm and λ = 220 nm showed a clear peak at Tret = 7,913 min and Tret = 7,920 min respectively. Fur-
thermore, λ = 250 nm showed a clear peak at Tret = 9,9 min, which is not detected with the other wavelengths.
UPLC Calibration Series I showed r2 values of 0,984 and 0,997 for λ =
200 nm and λ = 220 nm respectively. As shown in fig. 4, none of the calibration curves passed the origin of the graph. No peaks were detected with the 0,5 μg/ml and 1,0 μg/ml calibration standards and these data points could therefore not be included in the calibration curve. Curve I showed LOD concentrations of 6,71 µg/ml and 3,68 µg/ml and LOQ concentrations of 20,3 µg/ml and 11,2 µg/ml for λ = 200 nm and λ = 220 nm respectively.
Series II showed an r2 value of 0,988. Moreover, in contrast to curve I, it showed to almost pass the graph origin. Curve II showed LOD and LOQ concentrations of 5,1 µg/ml and 15,4 µg/ml respectively. A complete overview of the UPLC chromatograms curve is shown in appendix I.s
UPLC Characteristics of the HBED-CC chelator The UPLC chromatograms of the HBED-CC sample
showed a clear peak around Tret = 11 min. No absorp-tion peak was measured around the retention time of PSMA-11 (Tret ≈ 8 min). This peak was neither detected in the blanc sample (UP water), nor in previous PSMA-11 samples. Decreasing the injection volumes, showed a clear decrease in the peak size (fig. 5).
UPLC Recovery The blanc (UP water) UPLC run showed a mean activity of 39,9 Cpm in the collected UPLC fractions. Recoveries of >100% (111,8% and 112,6%) were calculated for the 10 μl and 20 μl UPLC injection volumes respectively. Because an insufficient volume of QC [68Ga]Ga-PSMA-11 was supplied, no reference samples for the 50 μl injec-tion volume could be prepared. Therefore, no recovery was calculated for an injection volume of 50 μl.
Description Sample I 1 Sample II 1 Sample III 1 Sample IV 1
Waste 1,3 2,6 3,8 1,3
Wash 0,1 0,3 0,8 0,1
Elution (I) 22,7 16,6 0,2 27,8
Elution (II) 69,6 73,6 48,4 60,6
Elution (III) 4,3 4,6 30,5 5,8
Elution (IV) 0,9 0,7 12,1 1,8
SPE column 1,2 1,4 4,2 2,5
Recovery (%) 2 97,4 95,5 91,2 96,11 Results are shown as the activity in each fraction (%), relative to the total Cpm in each
sample. 2
Recovery is shown as the sum of the percentages in the elution fractions.
Table 5: Percentage activity recovery values, per SPE fraction.

Kamp, J
EXPERIMENTAL STUDIES
38 | P a g e
Mass Spectrometer tuning
Precursor Results from the LC/MS-TOF tuning with PSMA-11
are shown in fig. 6 and fig. 7. Scanning in ESI+ mode for
0,6
34
0,9
68
1,0
01
1,3
90
1,4
83
1,5
62
10,1
47
11,2
68
11,5
59
AU
-0,10
0,00
0,10
0,20
0,30
0,40
Minutes
0,00 1,00 2,00 3,00 4,00 5,00 6,00 7,00 8,00 9,00 10,00 11,00 12,00
A
1,0
33
1,5
09
1,9
33
2,4
68
2,9
68
3,3
68
4,1
68
4,2
88
4,7
68
4,9
68
5,2
68
5,5
68
5,6
18
5,9
68
6,3
34
7,9
25
11,5
03
AU
-0,02
0,00
0,02
0,04
0,06
0,08
0,10
Minutes
0,00 1,00 2,00 3,00 4,00 5,00 6,00 7,00 8,00 9,00 10,00 11,00 12,00
B
ACQUITY TUV ChA 250nm
AU
0,000
0,002
0,004
0,006
Minutes
0,00 1,00 2,00 3,00 4,00 5,00 6,00 7,00 8,00 9,00 10,00 11,00 12,00
C
Fig. 2: UV chromatograms of the 5 μg/ml PSMA-11 sample at λ = 200 nm (A), λ = 220 nm (B) and λ = 250 nm (C).

Kamp, J
EXPERIMENTAL STUDIES
39 | P a g e
0,9
01
1,0
18
1,3
89
1,4
83
1,5
63
7,9
13
9,9
82 11,5
57
AU
-0,10
0,00
0,10
0,20
0,30
0,40
Minutes
0,00 1,00 2,00 3,00 4,00 5,00 6,00 7,00 8,00 9,00 10,00 11,00 12,00
A
0,3
06
0,8
39
6,1
65
7,9
20 11,5
10
AU
-0,02
0,00
0,02
0,04
0,06
0,08
0,10
Minutes
0,00 1,00 2,00 3,00 4,00 5,00 6,00 7,00 8,00 9,00 10,00 11,00 12,00
B
ACQUITY TUV ChA 250nm
AU
0,000
0,005
0,010
0,015
0,020
Minutes
0,00 1,00 2,00 3,00 4,00 5,00 6,00 7,00 8,00 9,00 10,00 11,00 12,00
C
Fig. 3: UV chromatograms of the 20 μg/ml PSMA-11 sample at λ = 200 nm (A), λ = 220 nm (B) and λ = 250 nm (C).

Kamp, J
EXPERIMENTAL STUDIES
40 | P a g e
m/z 947,425±0,1Da (1+ charged) and m/z 474,216±0,1Da (2+ charged) showed clear peaks at the first attempt. No peaks were detected for m/z 316,48±0,1Da (3+ charged) and m/z 237,612±0,1Da (4+ charged). In addition, the UV detector (λ = 220 nm) did not show any peaks.
The MS chromatograms obtained after changing solution B, showed slightly less peak tailing. Further-more, in contrast to the previous measurement, UV detection showed a small peak at the same retention
time as the LC/MS chromatogram (Tret ≈ 1,7 min). Moreover, by using the new solution B, the mobile phase gradient was visualised and several additional peaks were detected, compared to the non-acidic phase B.
For the tuning of the LC/MS/MS system, a Mw of 947,0Da was used for the neutral molecule (7). The initial settings are shown in appendix VI. A 2 µg/ml PSMA-11 solution was directly infused in the
Concentration PSMA -11 ( g/ml)
0 5 10 15 20 25
Peak a
rea
0,0
5,0e+4
1,0e+5
1,5e+5
2,0e+5
2,5e+5
3,0e+5
3,5e+5
988,3250443,13971 xy
Concentration PSMA -11 ( g/ml)
0 5 10 15 20 25
Peak a
rea
0,0
1,0e+4
2,0e+4
3,0e+4
4,0e+4
5,0e+4
6,0e+4
7,0e+4
8,0e+4
55,8103115,3802 xy
Concentration PSMA-11 ( g/ml)
0 5 10 15 20 25
Peak a
rea
0
2e+4
4e+4
6e+4
8e+4
1e+5
346,835784,4071 xy
Fig. 4: PSMA-11 UPLC calibration curves. Old calibration curves measured at λ = 200 nm (A), λ = 220 nm (B) and the new calibration curve measured at λ = 220 nm (C).
A B
C
AU
0,00
0,20
0,40
0,60
0,80
1,00
1,20
1,40
1,60
1,80
Minutes
0,00 0,50 1,00 1,50 2,00 2,50 3,00 3,50 4,00 4,50 5,00 5,50 6,00 6,50 7,00 7,50 8,00 8,50 9,00 9,50 10,00 10,50 11,00 11,50 12,00 12,50 13,00
Fig. 5: Overlay of HBED-CC-di(tBu)ester in 50% ACN UPLC chromatograms. UV absorption curves obtained with injection volu-mes of 50 μl (upper curve), 30 μl (middle curve) and 10 μl (lower curve).

Kamp, J
EXPERIMENTAL STUDIES
41 | P a g e
Fig
. 6:
LC
/MS-
TO
F c
hro
mat
ogr
ams
fro
m t
he
init
ial s
etti
ngs
(m
ob
ile
ph
ase
B =
AC
N).

Kamp, J
EXPERIMENTAL STUDIES
42 | P a g e
Fig
. 7:
LC
/MS-
TO
F c
hro
mat
ogr
ams
afte
r ch
angi
ng
the
mo
bil
e p
has
e (
mo
bil
e p
has
e B
= 0
,1%
fo
rmic
aci
d in
AC
N).

Kamp, J
EXPERIMENTAL STUDIES
43 | P a g e
LC/MS/MS system. Both ESI+ and ESI- ionization were evaluated. No clear peaks were seen for the 1+ charged molecule (m/z ± 948). However, scanning for the 2+ charged molecule did show a clear peak at a m/z of 474,5, with an acceptable background signal. Transi-tions were identified at m/z values of 356,3; 385,3; 387,8; 414,4; 622,4 and 800,4 (appendix VII).
Mass spectra obtained with in ESI- mode showed to have more difficulties with visualizing the parent peak. A clear parent peak (1- charged) was only visualized after a 5 to 10 fold increase in the infusion flow rate (100 µl/min), compared with that of the infusion rate which was used in ESI+ mode (fig. 8). In addition, the ESI- scan for the 2- charged parent ion showed two peaks around the m/z value of the 2- charged ion. The
size of the peak on the right, remained constant after increasing the infusion rate, although the size of the left peak increased. Representative results from the mass chromatogram after UPLC separation are shown in
fig. 9. Results showed clear PSMA-11 peaks at Tret = 2,1 min. However, clear peak tailing was observed for all concentrations. Chromatograms of columns that did show a PSMA-11 peak are shown in fig. 10. A complete overview of the columns tested is shown in table 6.
Ga-PSMA-11 reference For the identification of the Ga-PSMA-11 reference,
the same LC/MS-TOF method was used as for the PSMA-11. However, because of the natGallium in the reference compound, the Mw of the molecule was in-creased (1012,327Da for the neutral molecule, 1013,327Da for the 1+ charged ion). Scanning for an m/z of 1013,327±0,1Da (1+ charged ion), showed two clear peaks in the chromatogram (fig. 11). Further-more, the ‘mass fragment’ option in the MassLynx soft-ware, confirmed the presence of Ga-PSMA-11 fragments (fig. 11).
Fig. 8: MS/MS mass spectra obtained after the direct infusion of 2 µg/ml PSMA-11 solution. ESI+ scans for the 1+ charged parent ion (A) and for the 2+ charged parent ion (C). ESI- scans for the 1- charged parent ion (B) and the 2- charged parent ion (D).
No. Column Column size (mm) Particle size (µm) Peak visualisation Tailing
1 Xbridge C18 2,1x100 1,7 Yes ++
2 Peptide CSH 2,1x150 1,7 No n/a
3 Phenomenex XB-C18 2,1x50 2,6 No n/a
4 Waters Cortecs 2,1x50 1,6 Yes +++
5 Ascentis Express C18 2,1x50 2,6 Yes +++
6 Waters UPLC BEH 2,1x50 1,7 Yes +
Table 6: Overview of columns tested for the LC/MS/MS system.

Kamp, J
EXPERIMENTAL STUDIES
44 | P a g e
A
Fig
. 9:
Th
ree
rep
rese
nta
tiv
e L
C/M
S/M
S ch
rom
ato
gram
s o
f P
SMA
-11
wit
h c
on
cen
trat
ion
s o
f 2
µg/
ml (
A),
0,2
µg/
ml (
B)
and
0,0
2 µ
g/m
l (C
). O
nly
th
e 4
74
,5 >
80
0,4
tra
nsi
-ti
on
s ar
e sh
ow
n. A
n o
ver
vie
w o
f th
e ch
rom
ato
gram
s o
f al
l tra
nsi
tio
ns
is s
ho
wn
in
ap
pen
dix
VII
I.
B C

Kamp, J
EXPERIMENTAL STUDIES
45 | P a g e
2µ
g/m
L -
PSM
A
Tim
e0.6
00.8
01.0
01.2
01.4
01.6
01.8
02.0
02.2
02.4
02.6
02.8
03.0
03.2
03.4
03.6
03.8
04.0
04.2
04.4
04.6
04.8
0
%
0
100
0.6
00.8
01.0
01.2
01.4
01.6
01.8
02.0
02.2
02.4
02.6
02.8
03.0
03.2
03.4
03.6
03.8
04.0
04.2
04.4
04.6
04.8
0
%
0
100
0.6
00.8
01.0
01.2
01.4
01.6
01.8
02.0
02.2
02.4
02.6
02.8
03.0
03.2
03.4
03.6
03.8
04.0
04.2
04.4
04.6
04.8
0
%
0
100
170412_010
MR
M o
f 5 C
hannels
ES
+
TIC
(H
BE
D-C
C-P
SM
A)
1.9
0e8
2.2
6
170412_035
MR
M o
f 5 C
hannels
ES
+
TIC
(H
BE
D-C
C-P
SM
A)
1.1
0e7
1.8
4
170412_030
MR
M o
f 5 C
hannels
ES
+
TIC
(H
BE
D-C
C-P
SM
A)
6.8
2e7
1.8
4
Wat
ers
UP
LC B
EH C
18
, 2.1
x50
, 1.7
µm
Asc
enti
s Ex
pre
ss C
18, 2
.1x5
0m
m, 2
.6µ
m
Co
rtec
s C
18 -
2.1
x50
, 1.6
µm
Fig
. 10
: T
ota
l Io
n C
urr
ent
(TIC
) ch
rom
ato
gram
s o
f th
e th
ree
test
ed c
olu
mn
s sh
ow
ing
PSM
A-1
1 p
eak
s. T
he
Wat
ers
UP
LC
BE
H C
18
co
lum
n (
A),
Asc
enti
s E
xpre
ss C
18
co
lum
n
(B)
and
th
e W
ater
s C
ort
ecs
C1
8 c
olu
mn
(C
).
C
B
A

Kamp, J
EXPERIMENTAL STUDIES
46 | P a g e
Fig. 11: LC/MS-TOF tuning results for natGa-PSMA-11. Fragment recognition with MassLynx (upper) and MS chromatograms when scanning for m/z 1013,32 (lower).

Kamp, J
EXPERIMENTAL STUDIES
47 | P a g e
LC/MS Calibration Nine calibration standards were measured on the
LC/MS-TOF for calibration curve I. However, only the measurement of the 10 μl 1,0 mg/ml Ga-PSMA-11 standard showed two clear peaks. The 5 μl 1,0 mg/ml standard only showed some increase in the baseline signal. No peaks were shown by the other 7 MS-TOF chromatograms.
The 1,0 mg/ml standard from calibration series II showed two clear peaks. The 0,1 mg/ml standard showed a smallpeak, although this peak was not clear and showed a substantial peak tailing. In addition, the UV chromatograms from the LC/MS-TOF system only showed peaks for the 1,0 mg/ml standard. No UV ab-sorption were observed for the lower calibration stand-ards. Raw data is shown in appendix XII.
3.2 Metabolism and Stability
Effect of Gallium on tracer stability The UV AUC of the PSMA-11 solution in water de-
creased by 39,5% (descrease in peak area from 337003,25 to 203993,07) over 3 days. We performed the same test for Ga-PSMA-11 and surprisingly, no de-crease in UV AUC over 3 days was observed (mean peak areas of 1290520,26 and 1301590,05 at day 1 and 3 respectively). Furthermore, only natGa-PSMA-11 showed two overlapping UV absorption peaks, as was also shown in fig. 12. A complete overview of the UPLC chromatograms is found in appendix IX.
In vitro metabolism studies A activity in the UPLC fractions from the microsome
experiments are in shown in fig. 13. The results from the fraction activities showed the highest activity be-
AU
-0,16
-0,14
-0,12
-0,10
-0,08
-0,06
-0,04
-0,02
0,00
0,02
0,04
0,06
Minutes
0,00 0,50 1,00 1,50 2,00 2,50 3,00 3,50 4,00 4,50 5,00 5,50 6,00 6,50 7,00 7,50 8,00 8,50 9,00 9,50 10,00
AU
-0,05
0,00
0,05
0,10
0,15
0,20
0,25
0,30
0,35
0,40
0,45
0,50
0,55
Minutes
0,00 0,50 1,00 1,50 2,00 2,50 3,00 3,50 4,00 4,50 5,00 5,50 6,00 6,50 7,00 7,50 8,00 8,50 9,00 9,50 10,00 10,50 11,00 11,50 12,00
A
B
Fig. 12: UPLC control runs with the 1,0–0,1–0,01 and 0,001 mg/ml natGa-PSMA-11 calibration standards. Results are shown as the overlay of the chromatograms of the four natGa-PSMA-11 standards. The highest peaks correspond with the 1,0 mg/ml standard, the second highest peaks correspond to 0,1 mg/ml etc.. (A) UPLC runs with an injection volume of 10 μl and (B) UPLC runs with an injection volume of 50 μl. The light blue curve in (A) corresponds to the 0,001 mg/ml stan-dard.

Kamp, J
EXPERIMENTAL STUDIES
48 | P a g e
tween 7,0-8,0 minutes. Similar graphs are shown for the fraction activities after incubation with human liver microsomes. The QC sample showed the highest peak in the 7,5-8,0 min fraction which is also seen in the kidney t = 0 min and liver t = 0 min and t = 45 min samples. The kidney t = 45 min sample showed a slightly higher peak in the 7,0-7,5 min fraction. The kidney samples did not show clear activity in any fractions other than the fractions around those collected around 8 min. Howev-er, after incubation with the liver microsomes, a sub-stantial amount of activity was found in several other fractions. For the liver t = 0 min sample, the fractions 0,5-1,0; 1,5-2,0 and 5,0-5,5 showed activities of 848; 727,5 and 451 Cpm respectively. The liver t = 45 min showed an activity of 669,5 Cpm in the 1,5-2,0 fraction. None of the samples showed UV absorption, as was expected due to the low PSMA-11 peptide concentra-tions. In addition, the high metabolic stability of [68Ga]Ga-PSMA-11 was supported by the findings from the in vitro plasma studies. The plasma samples showed the highest activities in the fractions corresponding to a Tret of ± 8 min (fig. 14) , as was expected based on the known [68Ga]Ga-PSMA-11 retention time and no clear
peaks were observed at retention values other than around 8 min. Raw data is shown in appendix X.
Metabolic stability in patients The activity per fraction after UPLC separation of the
patient samples is shown in fig. 15. As expected, clear activity peaks are shown around Tret = 7,9 minutes, in the fractions of sample I (ACN method) and in the frac-tions of samples III and IV (sample preparation with SPE). The samples of patient III and IV showed substan-tial activities in fractions other than those of the [68Ga]Ga- PSMA-11 peak. Especially in the sample from patient IV radiation was found in in virtually all frac-tions. Due to technical problems, no UPLC separation and analysis could be performed for the SPE sample of patient II.
4. Discussion In this chapter, the main aim was to elucidate the
metabolism of the [68Ga]Ga-PSMA-11 radiotracer in human. Because the knowledge about the metabolic stability of this tracers in vivo is very limited, a new research project was initiated by our department. This long term project would include the development of new bioanalytical methods, the evaluation of the in vitro
Sampling interval (min)
0,0
-0,5
0,5
-1,0
1,0
-1,5
1,5
-2,0
2,0
-2,5
2,5
-3,0
3,0
-3,5
3,5
-4,0
4,0
-4,5
4,5
-5,0
5,0
-5,5
5,5
-6,0
6,0
-6,5
6,5
-7,0
7,0
-7,5
7,5
-8,0
8,0
-8,5
8,5
-9,0
9,0
-9,5
9,5
-10,0
10,0
-10,5
10,5
-11,0
11,0
-11,5
11,5
-12,0
Cpm
0
5000
10000
15000
20000
25000
30000
35000
Sampling interval (min)
0,0
-0,5
0,5
-1,0
1,0
-1,5
1,5
-2,0
2,0
-2,5
2,5
-3,0
3,0
-3,5
3,5
-4,0
4,0
-4,5
4,5
-5,0
5,0
-5,5
5,5
-6,0
6,0
-6,5
6,5
-7,0
7,0
-7,5
7,5
-8,0
8,0
-8,5
8,5
-9,0
9,0
-9,5
9,5
-10,0
10,0
-10,5
10,5
-11,0
11,0
-11,5
11,5
-12,0
Cpm
0
2000
4000
6000
8000
10000
Sampling interval (min)
0,0
-0,5
0,5
-1,0
1,0
-1,5
1,5
-2,0
2,0
-2,5
2,5
-3,0
3,0
-3,5
3,5
-4,0
4,0
-4,5
4,5
-5,0
5,0
-5,5
5,5
-6,0
6,0
-6,5
6,5
-7,0
7,0
-7,5
7,5
-8,0
8,0
-8,5
8,5
-9,0
9,0
-9,5
9,5
-10,0
10,0
-10,5
10,5
-11,0
11,0
-11,5
11,5
-12,0
Cpm
0
2000
4000
6000
8000
10000
12000
Sampling intveral (min)
0,0
-0,5
0,5
-1,0
1,0
-1,5
1,5
-2,0
2,0
-2,5
2,5
-3,0
3,0
-3,5
3,5
-4,0
4,0
-4,5
4,5
-5,0
5,0
-5,5
5,5
-6,0
6,0
-6,5
6,5
-7,0
7,0
-7,5
7,5
-8,0
8,0
-8,5
8,5
-9,0
9,0
-9,5
9,5
-10,0
10,0
-10,5
10,5
-11,0
11,0
-11,5
11,5
-12,0
Cpm
0
5000
10000
15000
20000
Fig. 13: Evaluation of radio-metabolite formation in human microsomes. Activity per fraction in kidney microsomes at t = 0 min (A), t = 45 min (B) and in liver microsomes at t = 0 min (C) and t = 45 min (D).
A B
C D

Kamp, J
EXPERIMENTAL STUDIES
49 | P a g e
Sampling interval (min)
0,0
-0,5
0,5
-1,0
1,0
-1,5
1,5
-2,0
2,0
-2,5
2,5
-3,0
3,0
-3,5
3,5
-4,0
4,0
-4,5
4,5
-5,0
5,0
-5,5
5,5
-6,0
6,0
-6,5
6,5
-7,2
7,2
-7,6
7,6
-8,0
8,0
-8,5
8,5
-9,0
9,0
-9,5
9,5
-10,0
10,0
-10,6
10,6
-11,0
11,0
-11,5
11,5
-12,0
Cpm
0
20
40
60
80
100
120
140
160
180
Sampling interval (min)
0,0
-0,5
0,5
-1,0
1,0
-1,5
1,5
-2,0
2,0
-2,5
2,5
-3,0
3,0
-3,5
3,5
-4,0
4,0
-4,5
4,5
-5,0
5,0
-5,5
5,5
-6,0
6,0
-6,5
6,5
-7,0
7,0
-7,5
7,5
-8,0
8,0
-8,7
8,7
-9,2
9,2
-9,6
9,6
-10,0
10,0
-10,5
10,5
-11,0
11,0
-11,5
Cpm
0
10
20
30
40
Sampling interval (min)
0,0
-0,5
0,5
-1,0
1,0
-1,5
1,5
-2,0
2,0
-2,5
2,5
-3,0
3,0
-3,5
3,5
-4,0
4,0
-4,5
4,5
-5,0
5,0
-5,5
5,5
-6,0
6,0
-6,5
6,5
-7,0
7,0
-7,6
7,6
-8,0
8,0
-8,6
8,6
-9,1
9,1
-9,5
9,5
-10,0
10,0
-10,5
10,5
-11,0
11,0
-11,5
11,5
-12,0
Cpm
0
1000
2000
3000
4000
5000
6000
7000
Sampling interval (min)
0,0
-0,5
0,5
-1,0
1,0
-1,5
1,5
-2,0
2,0
-2,5
2,5
-3,0
3,0
-3,5
3,5
-4,0
4,0
-4,5
4,5
-5,0
5,0
-5,5
5,5
-6,0
6,0
-6,5
6,5
-7,0
7,0
-7,5
7,5
-8,0
8,0
-8,5
8,5
-9,0
9,0
-9,6
9,6
-10,0
10,0
-10,6
10,6
-11,1
11,1
-11,5
11,5
-12,0
Cpm
0
2000
4000
6000
8000
10000
Fig. 15: Evaluation of radio metabolite formation in patient blood samples, after administration of [68Ga]Ga-PSMA-11. Blood sample 1 hour p.i. from patient I, prepared with the ACN method (A) and with the SPE method (B). Blood sample 30 minutes p.i., prepared with the SPE method from patient III (C) and patient IV (D).
A
C
B
D
Sampling interval (min)
0,0
-0,5
0,5
-1,0
1,0
-1,5
1,5
-2,0
2,0
-2,5
2,5
-3,0
3,0
-3,5
3,5
-4,0
4,0
-4,5
4,5
-5,0
5,0
-5,5
5,5
-6,0
6,0
-6,5
6,5
-7,0
7,0
-7,5
7,5
-8,0
8,0
-8,5
8,5
-9,0
9,0
-9,5
9,5
-10,0
10,0
-10,5
10,5
-11,0
11,0
-11,5
11,5
-12,0
Cpm
0
100
200
300
400
500
Sampling interval (min)
0,0
-0,5
0,5
-1,0
1,0
-1,5
1,5
-2,0
2,0
-2,5
2,5
-3,0
3,0
-3,5
3,5
-4,0
4,0
-5,0
5,0
-6,0
6,0
-6,5
6,5
-7,0
7,0
-7,5
7,5
-8,0
8,0
-8,4
8,4
-9,0
9,0
-9,6
9,6
-10,0
10,0
-10,6
10,6
-11,0
11,0
-11,6
11,6
-12,0
Cpm
0
200
400
600
800
1000
1200
1400
Sampling interval (min)
0,0
-0,5
0,5
-1,0
1,0
-1,5
1,5
-2,0
2,0
-2,5
2,5
-3,0
3,0
-3,5
3,5
-4,0
4,0
-5,0
5,0
-6,0
6,0
-6,5
6,5
-7,0
7,0
-7,7
7,7
-8,1
8,1
-8,6
8,6
-9,0
9,0
-9,5
9,5
-10,0
10,0
-10,6
10,6
-11,0
11,0
-11,6
11,6
-12,0
Cpm
0
200
400
600
800
1000
1200
1400
Sampling interval (min)
0,0
-0,5
0,5
-1,0
1,0
-1,5
1,5
-2,0
2,0
-2,5
2,5
-3,0
3,0
-3,5
3,5
-4,0
4,0
-5,0
5,0
-6,0
6,0
-6,5
6,5
-7,0
7,0
-7,5
7,5
-8,0
8,0
-8,6
8,6
-9,1
9,1
-9,6
9,6
-10,1
10,1
-10,5
10,5
-11,0
11,0
-11,5
11,5
-12,0
Cpm
0
50
100
150
200
250
300
350
Fig. 14: Evaluation of radio-metabolite formation in human plasma at t = 0 min (A), t = 45 min (C), t = 60 min (D) and after restitution of the pellet t = 0 min (B).
B A
C D

Kamp, J
EXPERIMENTAL STUDIES
50 | P a g e
metabolism in human liver and kidney microsomes, the metabolism in the human body and eventually the development of a model that will describe the pharma-cokinetics in human.
4.1 Bioanalysis
Sample Preparation The SPE method showed to be superior compared to
the ACN sample preparation method. Protein precipita-tion with 800 µl 0,1% FA in ACN in the spiked plasma samples showed supernatant activities that were sub-stantially lower than was expected. This suggested that the recovery of the ACN method was not optimal and that the major part of the activity accumulated in the pellet.
Therefore, we decided to separately measure the ac-tivities in the pellet and supernatant. The fact that low amounts of supernatant activity were found in after 0h and 1h incubation makes it unlikely that the observa-tions were related to a metabolic process, since metabo-lism is a gradual proces.
In addition, to evaluate if the activity in the pellet was intact [68Ga]Ga-PSMA-11, 500 µl UP water was added to the pellet to reconstitute the mass. After thor-ough mixing, the sample was centrifuged for 5 minutes at 3000 rpm and injected onto the UPLC. UPLC fractions were collected and analysed as described earlier. As shown in fig. 14 B, the activity in the pellet was intact [68Ga]Ga-PSMA-11.
Although the recovery with the ACN method in-creased after the protocol was modified, the recovery was still limited to 57,2%, whereas the SPE recovery percentages ranged from 91,2% to 97,4%. Apparently, the ratio between plasma volume and the volume of ACN plays a role in the amount of activity, and thus tracer, that is precipitated in the pellet. This observation might by explained by the peptidic structure of the binding motif of the tracer, which may be affected by larger quantities of ACN.
UPLC System setup Based on the two aromatic groups in the PSMA-11
molecule, clear UV absorptions were expected. Howev-er, UV absorption was found to be low for all three wavelengts. The λ = 250 nm did not show PSMA-11 peaks for either concentrations, although it did show a peak at Tret = 9,8 min, which was not seen with the other two wavelengths. It is likely that this peak is caused by impurities in the sample or in the mobile phase, which were not detected with the other two wavelengths (Fig. 3C). Furthermore, the signal of the λ = 250 nm peak is substantially lower than that of the peaks found with the other two wavelengths. The λ = 200 nm, 5,0 µg/ml graph (fig. 2B) did not show a clear peak around Tret = 7,9 min. However, the automatic scaling performed by the software might give a confounded view of the true peak size, because it used a different y-axis scaling for the λ = 200 nm and λ = 220 nm graphs (fig. 2A & 2B).
All UV chromatograms (fig. 2 & fig. 3) showed low UV absorption values. This is a striking observation, since the PSMA-11 molecules included two aromatic groups, which should show UV absorption. Several factors could contribute to this observation. First, there were suspi-cions that the 10µg PSMA-11 GMP vials did not truly contain 10µg of PSMA-11. These suspicions originated from the GMP production in our department, because problems were occuring with the labeling of PSMA-11 for the patient production. If this hypothesis is true, PSMA-11 concentrations in the two standards were lower than was assumed, which would in turn cause low UV absorption values. In addition, due to the low visibility of the PSMA-11 (± 10µg) in the vial, it was not possible to be sure that all PSMA-11 was dissolved. This could also lead to lower true PSMA-11 concentrations, and thus lower UV absorptions. Finally, because we were not able to measure a full UV absorption spectrum, we cannot be sure that λ = 220 nm is the true UVmax
wavelengths. However, since the wavelengths used in this study were similar to those reported in literature (5,8) the latter argument is likely to be less relevant.
UPLC Calibration Both calibration curves showed that the UPLC meth-
od lacks the sensitivity needed to be able to quantify [68Ga]Ga-PSMA-11 concentrations in patient blood samples. As LOQ concentrations ranged between 11,2 µg/ml and 20,3 µg/ml, these concentrations will not be near the [68Ga]Ga-PSMA-11 concentrations that are expected to be present in the patient blood.
10 µg PSMA-11 precursor is used for labelling with Gallium-68 and, less than 10 µg of net peptide (precur-sor) will be administered to the patient. Therefore, when taking a blood volume of 6 litres into account, and when assuming that a part of the tracer will be distrib-uted to other compartments than the peripheral com-partment, the final blood concentration of the tracer is likely to be in the range of a few nano grams per ml or less.
We decided to measure calibration series I with both λ = 200 nm and λ = 220 nm and to use the calculated LOD and LOQ values to conclude which was the optimal wavelength for UV detection. Although measuring at λ = 200 nm resulted in larger peak areas than those found with λ = 220 nm (fig. 2 & 4), the LOQ concentration was shown to be substantially higher than was found for λ = 220 nm. This difference may be explained by the in-creased background signal observed with λ = 200 nm, which makes it harder to clearly distinguish the PSMA-11 peak from the background signal.
The calibration curves from series I showed y-intercept values of -32504,0 and -8103,55 for λ = 200 nm and λ = 220 nm respectively, while in an ideal sce-nario, the calibration curve would pass through the intercept of the x- and y-axis. This observation may be explained by the instability of the PSMA-11 in solution. Suspicions concerning the high instability of PSMA-11 in solution were based on information of the producer
Kamp, J
EXPERIMENTAL STUDIES
51 | P a g e
(ABX Advanced Biochemical Compounds) and on our departements own experiences with working with PSMA-11. This topic will be discussed in more detail later in this chapter.
Because series I was prepared several days before analysis, a part of the PSMA-11 in the calibration solu-tions was likely to be degraded. Therefore, true concen-trations in the calibration standards would be lower than the assumed concentrations of 20 µg/ml, 15 µg/ml etc.. This may cause smaller peak areas than would correspond to the true concentrations. As a conse-quence, the curve may shift downwards. This hypothe-sis is supported by the fact that the calibration curve of series II shows a substantial lower y-intercept of -835,3, which can be explained by the smaller differences be-tween the true and the calculated concentrations.
Characteristics of the HBED-CC Chelator The peak around Tret = 11 min, as shown by the UPLC
chromatograms, is likely to be the HBED-CC peak, and it is thus possible to distinguish HBED-CC from PSMA-11. In case the free HBED-CC chelator would have a similar column affinity as Ga-PSMA-11, it would not be possible to distinguish between intact Ga-PSMA-11 and possible radio-metabolites formed by cleavage of the chelator from the spacer molecule. In such a case, false assump-tions could be made concerning the metabolic stability of the tracer.
The peak observed at Tret = 11 min was neither ob-served in the blanc sample, nor in previously analysed PSMA-11 or natGa-PSMA-11samples. Moreover, a de-crease of the injection volume led to a decrease of the peak size. The high lipophilicity of the HBED-CC chela-tor (5) is likely to cause a high affinity for the ̶ lipo-philic ̶ UPLC colum and can therefore explain the long retention time of the peak.
UPLC Recovery UPLC recovery percentages of >100% were found
for [68Ga]Ga-PSMA-11. Because maximum recovery values of 100% were expected, it was important to elucidate what caused these high recovery values.
To eliminate a possible contamination of the UPLC column with long lived isotopes/activity, a blanc (UP water) sample was injected onto the UPLC and the ac-tivity in the fractions was measured. For the blanc sam-ple ̶ as expected ̶ only background activity was ob-served (mean 40 Cpm, range 12,8-60,3 Cpm). Therefore, potential contamination with long living isotopes of the UPLC column could be excluded.
Evaluation of the influence of the UPLC injection volume on the recovery, showed values that were sub-stantially lower than the recoveries found in previous experiments with patient samples, in which we found recoveries of 345% and 885%. It was first assumed that the high recovery values were caused by spill-over of activity due to inadequate shielding of the β+ radiation in the wellcounter. Since this type of radiation is best shielded with Perspex, the lead shielding in the Perkin Elmer counter might not be able to adequately shield
large quantities of β+ radiation in the sample. This hy-pothesis is supported by the fact that elevated back-ground activities were measured in the empty wells next to the control samples (appendix IV).
Detector dead-time might be another potential ex-planation. Certain types of activity detectors need time to recover after after a signal has been generated by the detection of a radio-active particle. During this time frame, the detector is unable to generate a new signal. When the detector is confronted with a highly radio-active source, it might not be able to process all signals, and thus give an underestimation of the true activity. Because the activity in the sample is distributed over the UPLC fractions, the detector might give a more acu-rate and a higher total activity than when measuring the total activity directly in a control sample.
However, when carefully considering the results, no direct relation could be found between the amount of activity in a sample and the recovery. The sample that showed a 345% recovery, contained around 8.500 Cpm, while the sample that showed a 112% recovery con-tained a total activity of approximately 4.800.000 Cpm. Furthermore, for some samples, the activity in the 7,5-8,0 min fraction was already higher than the activity in the control samples. Therefore, neither detector dead time nor inadequate shielding can explain the high re-coveries. Carry-over of activity from the UPLC column might also be considered to cause the high recoveries. Prior to UPLC separation of the 345%, a [68Ga]Ga-PSMA-11 QC sample was injected onto the system. When some of this QC sample is left on the UPLC column, some of the activ-ity can be carried over to the new run. This can have a large inpact on the recovery value, especially since the QC has, per definition, a substantially higher activity than the patient blood sample. This hypothesis is sup-ported by the lower recovery values seen for the 10 µl and 20 µl of QC [68Ga]Ga-PSMA-11 samples, for which blanc samples were separating the two runs. However, no UPLC runs were performed before the QC sample that showed a 885% recovery. Therefore, neither inad-equate shielding nor carry-over is likely to be the lead-ing cause. Although the high recovery values may be caused by a combination of factors, such as spill-over or carry-over via the UPLC column, we were not able to elucidate the exact cause of this phenomenon and therefore, we were not able to solve this problem.
Mass Spectrometer tuning The LC/MS-TOF method was able to identify
[natGa]Ga-PSMA-11 and its precursor PSMA-11. Furhtermore, it was found that the molecule was more easily ionised when scanning in positive ionisation mode. The LC/MS/MS system was able to detect PSMA-11 quantities as low as 0,02 µg/ml, which might enable analysis of [68Ga]Ga-PSMA-11 blood levels for future pharmaco kinetic studies. Although the tandem MS method was originally setup to determine the true

Kamp, J
EXPERIMENTAL STUDIES
52 | P a g e
amount of PSMA-11 in the GMP vials, we were not able to test this within the timespan of this research project. Clear PSMA-11 peaks were observed when scanning on the LC/MS-TOF system for m/z 947,425±0,1Da and for m/z 474,216±0,1Da. Since no peaks were detected for the m/z ratios for the 3+ or 4+ charged ions, it is assumed thatthe molecule is mainly ionized to a 1+ or 2+ charged ion.
Because some peak tailing was observed, the nonpo-lar mobile phase was slightly altered. During the UPLC gradient, the acidity of the mobile phase decreased with the time, because the percentage of the acidic polar phase (A) was declining from 98% to 0% in 5 minutes. A constant mobile phase acidity, might ease the ioniza-tion of the parent molecule for MS detection. In addi-tion, an acidic non-polar mobile phase may cause the PSMA-11 to elute from the non-polar C18 UPLC column more easily, because the protonation of the PSMA-11 may render the molecule somewhat less lipophilic. Fur-thermore, the UPLC method already showed an ac-ceptable sample elution with an acidic non-polar phase.
The results with the acidic solution B, showed, as expected, less peak tailing. In addition, the signal inten-sity from the 1+ charged ion (m/z 947,425Da) was in-creased with a factor 10 compared to the signal that was detected with the non-acidic non-polar phase, from 2,32e3 to 1,6e4. These findings also confirm that the product is ionized more easily when in an acidic envi-ronment.
The LC/MS/MS method was originally set up to de-termine the quantity of PSMA-11 peptide in GMP vials. Due to problems in the GMP production of [68Ga]Ga-PSMA-11, there were suspicions that some GMP vials did not contain 10 μg of PSMA-11, as was stated by the producer. However, once the PSMA-11 could be quanti-fied on the LC/MS/MS system, only minimal system adjustments should be needed for the quantification of [68Ga]Ga-PSMA-11, since the chemical properties are likely to be very similar to those of the PSMA-11 pre-cursor. Therefore, developing a PSMA-11 LC/MS/MS quantification method is also a first step for future pharmaco kinetic studies in patient blood samples.
As described in the ‘Results’ section, first the MS/MS system was tuned, before the optimal conditions were evaluated for the UPLC separation, prior to MS/MS de-tection. Positive scanning did not show a clear peak for the 1+ charged parent molecule (m/z around 947,99Da). However, a clear peak was found at an m/z value of 474,5, which indicated that the parent molecule had a preferred ionic charge of 2+. Scanning in negative mode only showed a peak at an m/z of 945,99 after the infusion rate was a 10 fold increased, compared to the infusion rate used in the positive mode. Fig. 8 in the ‘Results’ section showed two large peaks around m/z 472,5 (calculated m/z of the 2- charged ion). However, when the infusion rate was increased, only the peak intensity of the 472,3 peak increased. Since the MS/MS system used a continuous flow of methanol and because the peak intensity of the 473,4 peak was not altered
after increasing the flow rate , the peak at m/z 473,4 was likely to be a contamination in this continuous phase. Because the negative mode clearly visualized this contamination, we decided to use the positive ioniza-tion mode for the further tuning of the system.
The choice of UPLC columns that were to be evaluat-ed, was based on the earlier experiences with the UPLC method that was developed earlier in our department and on literature reports (5,8,10). Based on these expe-riences and reports, a type of Reversed Phase (RP) C18 column was likely to show the best results. As show in the ‘results’ section, the Waters UPLC BEH column showed the lowest peak tailing, compared to the other columns. Therefore, this column was considered to be the most suitable column.
LC/MS-TOF Calibration Although it was possible to detect large quantities of
natGa-PSMA-11 with the LC/MS-TOF system, no calibra-tion curve could be obtained. The LC/MS-TOF analysis of calibration curve I was only able to clearly visualise the highest natGa-PSMA-11 calibration standard of 1 mg/ml, with an injection volume of 10 μl. Unfortunately, we were not able to identify exactly what caused the problems with the LC/MS-TOF quantification of natGa-PSMA-11.
Based on the results from the PSMA-11 analysis with the UPLC and the tuning experiments with the LC/MS/MS system, it was expected that it would be possible to detect concentrations lower than 1,0 mg/ml with the LC/MS-TOF. However, since this was not the case, we decided to perform and additional analysis of calibration curve II on the UPLC method that we devel-oped earlier as a control.
The UV chromatogram from the LC/MS-TOF system showed natGa-PSMA-11 peaks for the 1,0 mg/ml stand-ard. However, the UPLC method was able to clearly visualise both the 1,0 mg/ml and 0,1 mg/ml standards. Furthermore, although not clearly shown in fig. 12A due to the graph scaling, two small peaks could be dis-tinguished for the 0,001 mg/ml standard with the UPLC method.
Since the UV chromatogram from the LC/MS-TOF system could only detect the 1,0 mg/ml 10 µl sample, and thus showed similar results to those shown by the mass detector of the system, the results may be ex-plained by problems in the steps prior to the UV detec-tion in the LC/MS-TOF system, e.g. adsorption of the analyte to the injection needle or obstructions in the system. Moreover, since the UPLC method was able to detect the lower concentrations, it is unlikely that the cause is situated in the sample itself.
Another complicating factor in solving this puzzle, is the fact that the UPLC settings of the LC/MS-TOF and the LC/MS/MS system were very similar. Although it was not possible to fully compare the two systems ̶ no calibration curve was measured on the LC/MS/MS sys-tem and only tuning PSMA-11 solutions were analysed on the LC/MS/MS ̶ it was striking that the LC/MS/MS
Kamp, J
EXPERIMENTAL STUDIES
53 | P a g e
system did not seem to have problems in detecting the PSMA-11. For both systems, the same mobile phase and column type was used. The mobile phase gradient was slightly faster for the LC/MS-TOF system compared to that of the LC/MS/MS. Furthermore, the LC/MS-TOF used a flow rate of 0,6 ml/min, which was slightly high-er than the 0,4 ml/min that was used for the LC/MS/MS system.
With the LC/MS/MS system, we were able to detect PSMA-11 concentrations as low as 0,02 µg/ml (for LC/MS/MS tuning, several dilutions were prepared). Although the LC/MS/MS systems are, thanks to their higher sensitivity, known to be better suited for com-pound quantification compared to LC/MS-TOF systems, the large difference in sensitivity between these two systems is very unlikely to be caused by the differences between the two systems ̶ especially because the UPLC method showed to be more sensitive for PSMA-11 than the UV detector in the LC/MS-TOF system.
Although we were not able to exactly explain the LC/MS-TOF problems, the problem seems to originate from one of the first steps of the LC/MS-TOF system. If this method were to be optimised, options such as sam-ple needle type, needle rinsing solution or a possible clogging in the UPLC system, should be kept open for examination. In addition, injection volumes of the sam-pler might be calibrated to be sure that the volume that is injected in the system is truly the volume that is se-lected.
4.2 Metabolism In this section, we will discuss the results from the
stability and metabolism studies. None of the metabo-lism experiments showed a clear formation of metabo-lites. The stability studies were performed in plasma and in human liver and kidney microsomes. Further-more, blood samples from 4 patients were analysed for the presence of radio-metabolites.
Metabolism is generally divided in two types of me-tabolism (11): Phase I and Phase II reactions. In Phase I metabolic reactions, the substrate is modified by reduc-tion, hydrolysis or by oxidation. Often, these modifica-tions to the substrate form acceptor groups that are in turn used for Phase II reactions, in which functional groups are added to the substrate. An important func-tion of these two reactions is to improve the water sol-ubility of the substrate, so that the substrate can more easily be excreted via the kidneys. In addition to im-proving the water solubility, these chemical modifica-tions can also alter the activity of the substrate and cause metabolites to show increased or decreased activ-ities, compared to the parent compound.
Because tracers such as [68Ga]Ga-PSMA-11 are spe-cifically designed to target PSMA and selected for their favourable pharmacokinetics, small chemical modifica-tions ̶ such as modifications caused by Phase I and Phase II reactions ̶ can have profound effects on the in vivo behaviour of the tracers. For example, an activation of the tracer may lead to an increased affinity for non-
target tissues. Furthermore, certain CYP450 inhibiting drugs may alter tracer clearance, and so influence image contrast. Finally, alterations in lipophilicity can alter tracer-plasma protein binding, which affects the mount of unbound tracer: the fraction that is available for dis-tribution and clearance. Therefore, a thorough under-standing of tracer metabolism is warranted.
Effect of Gallium on tracer stability The PSMA-11 showed decreasing peak areas over
time, which indicated a high instability of PSMA-11. In contrast, the natGa-PSMA-11 did not show any degrada-tion after 3 days. This observation suggests that the 68Ga3+ has a large impact on the stability of the tracer molecule. Moreover, natGa-PSMA-11 showed two adja-cent UV absorption peaks.
A potential explanation of this observation may be the fact that the configuration of the chelator is altered by the bonding of 68Ga3+. As shown in the ‘General intro-duction’ of this thesis, the chelator consists out of an aliphatic chain. However, when complexating with 68Ga3+, the chelator is folding around the 68Ga3+. Such a change in spatial configuration may cause the shielding of certain reactive groups, which improves the stability of the tracer.
A second explanation for this observation may be that the HBED-CC chelator of the PSMA-11 is interacting with metal ions in the glass of the sample vial. Glass is known to contain several types of metals such as alumi-num, magnesium or boron and interactions between glass containers and the product are a well-known proble (17,18). This may cause the PSMA-11 to stick to the vial, and thus to lower the amounts of PSMA-11 dissolved in the test solution. Once the PSMA-11 is la-beled with 68Ga3+, the molecule will not be able to form complexes with metals in the glass, and will thus show stable tracer concentrations in the test compound.
In addition to the differences in stability between the labeled and un-labeled tracer, the natGa-PSMA-11 also showed a different UV absorption profile than the PSMA-11. As shown in fig. 12, natGa-PSMA-11 showed two overlapping peaks. These absorption peaks are caused by the different diastereomers formed after the labeling with Gallium and both diastereomers were shown to have similar binding affinities (8). Further-more, the same study reports that the labeling tempera-ture effects the proportional distribution of the types of diastereomers that are formed. However, the influence of the diastereomers on the metabolism was not dis-cussed in this report, so this question still remains to be answered.
In vitro metabolism studies The in vitro studies in human liver and kidney mi-
crosomes did not show clear activity peaks in fractions other than the fractions around the expected retention time of [68Ga]Ga-PSMA-11 and thus suggested a mini-mal tracer metabolism. Since reactions such as Phase I and Phase II reactions are aimed at increasing the polar-ity of the substrate ̶ in this case [68Ga]Ga-PSMA-11 ̶

Kamp, J
EXPERIMENTAL STUDIES
54 | P a g e
the radio metabolites were expected to be eluted from the lipophilic UPLC column more easily than the intact, more lipophilic tracer.
As discussed earlier, the protocol used for the mi-crosome studies included experiments for Phase I me-tabolism and Phase II metabolism. For this thesis, we were only able to perform the studies for the Phase I metabolism during this project. However, because of the short half-life of Ga-68, potential Phase II reactions are likely to be less revelant than Phase I reactions in this context.
Both kidney microsomes samples (t = 0 min and t = 45 min) showed almost identical activity patterns (fig. 13A & B). In addition, both liver microsome samples showed very similar activity patters in the fractions, which indicate a high metabolic stability. However, both samples showed a slightly increased activity in the 1,5-2,0 min fraction. This increase in activity is unlikely, however, to be caused by metabolism.
First of all, this increase was already observed in the t = 0 min sample, so that there was no time for metabol-ic reactions to occur. Furthermore, if this observed in-crease was to be caused by a metabolic process, it was to be expected that the size of the 1,5-2,0 min peak would increase compared with the parent peak, due to the formation of new metabolites at the cost of the sub-strate. However, as shown in the graph, this was not observed.
Similar results were found for the stability in human plasma. Endogenous proteins, such as transferrin, are known to be able to bind Gallium-68 (12). However, literature reports showed a high stability of [68Ga]Ga-PSMA-11 in human plasma (5,8). None of the plasma samples (t = 0 min, t = 45 min or t = 60 min) showed the presence of radio-metabolites. Only the plasma t = 0 min sample showed slight increased activities in the 0,0-0,5 min and 1,5-2,0 min UPLC fractions. However, because this sample was analysed without incubation, and because these peaks are not shown and/or in-creased in the t = 45 min and t = 60 min samples, it is unlikely that this increase in activity is to be attributed to a metabolic process.
The graphs from the plasma samples all showed low maximum Cpm values. This can be explained by the method of sample preparation that was used. For all 4 samples, plasma proteins were precipitated by the addi-tion of ACN. As discussed above, this method caused the largest part of the tracer molecules ̶ and thus the activ-ity ̶ to be concentrating in the pellet. Probably by pre-cipitation of the peptidic tracer, by the high ACN concen-trations. Therefore, only a small amount of activity was left to be counted in the wellcounter.
Metabolic stability in patients As mentioned above, the microsome studies only
evaluated the Phase I metabolism. Basing our conclu-sions about the tracer metabolic stability solely on these studies, would give an over-simplified view of the true tracer metabolism and it would neglect the complex
interplay of metabolic reactions, as is found in the hu-man body. Therefore, we aimed to evaluate the meta-bolic stability in patients. This evaluation in patients suggested a high in vivo metabolic stability.
The evaluation of radio-metabolite formation in pa-tients supported the findings from the in vitro plasma and microsome studies. Data in patient material (fig. 15) clearly showed high [68Ga]Ga-PSMA-11 peaks. Only fig. 15B did not show a clear peak around Tret = 7,9 min. However, this was due to the lack of activity left in the sample during measurement. Therefore, the peak could not be distinguished from the background activity. The same blood sample ̶ prepared with the ACN method ̶ showed a clear [68Ga]Ga-PSMA-11 peak and only little background activity. This indicates a high metabolic. In addition, fig. 15C showed a clear [68Ga]Ga-PSMA-11 peak. However, some fractions showed activities that were higher than the expected background radiation of approximately 40 Cpm. This might indicate the pres-ence of potential radio-metabolites. However, it is might also be explained by the carry-over of activity from the previous [68Ga]Ga-PSMA-11 QC sample (see also ‘UPLC recovery’ sections). Furthermore, increased background radiation was also detected in the QC samples of the [68Ga]Ga-PSMA-11, administered to the corresponding patients (patient III and IV). Therefore, the high back-ground radiation shown in in fig. 15C and fig. 15D is more likely to be explained by limitations of the UPLC/wellcounter method, or by the presence of free activity (free Gallium-68) in the QC sample after the labeling procedure.
Before we can conclude that [68Ga]Ga-PSMA-11 is metabolically stable up to 1 hour in the human body, it is important to briefly address a possible confounding factor. As discussed in the ‘Bioanalysis’ section of this chapter, the patient blood samples were first prepared by solid phase extraction, before injecting the sample on the UPLC. As with UPLC separation, the SPE separation is mainly based on the column affinity of the product. Therefore, metabolites with an increased water solubili-ty may already be eluted from the SPE column during the rinsing of the column. This can potentially confound the results, since only the elution fractions ̶ with the [68Ga]Ga-PSMA-11, but without water soluble metabo-lites ̶ were used for radio-UPLC analyses. However, this hypothesis can be countered by the fact that hardly any activity was observed in the SPE fractions that were acquired during the rinsing step. Therefore, the loss of water soluble radio-metabolites during the rinsing of the SPE column can be excluded. However, for future studies with other types of radiotracers, it important to be careful when using solid phase extraction.
4.3 Study limitations and Future studies The studies described in this chapter of this thesis,
are only the beginning of a larger research project that is aiming to unravel the metabolism and pharmacoki-netics of the [68Ga]Ga-PSMA-11 tracer. This section will aim to provide some suggestions that may be used for

Kamp, J
EXPERIMENTAL STUDIES
55 | P a g e
the further planning of this research project. Further-more, several of the most important limitations of this study will be addressed.
Study limitations The first limitation of the stability and metabolism
studies is the fact that only radio-UPLC in combination with SPE was used to detect possible radio-metabolites. Although this method can supply valuable information about tracer metabolic stability (2,3), it is not able to fully exclude the formation of metabolites. In theory, it would be possible that a metabolite might have a simi-lar affinity for the UPLC column as Ga-PSMA-11. There-fore, it would not be possible to identify the metabolite with the UPLC method as was described in this chapter. As mentioned in Chapter I, mass spectrometry would be able to supply additional information. However, during the timeframe of this research project, we were not able to perform such LC/MS studies, due to technical prob-lems and due to problems with the LC/MS calibration for Ga-PSMA-11.
The second factor that should be taken into account, is the fact that the microsome studies were only per-formed once, with one batch of liver/kidney micro-somes ̶ a batch that was frozen and defrosted several times for other studies. Therefore, it cannot be ensured that the microsomes were still fully viable. The micro-some studies are best to be repeated with another batch, to support the findings from this, single, study.
Another limitation of this study is the fact that blood samples were drawn from the same i.v. line as from which the [68Ga]Ga-PSMA-11 was administered. Alt-hough the line was flushed several times with 0,9% NaCl, there is no guarantee that all activity was rinsed from the line before blood sampling. Radioactive con-tamination of the blood samples can therefore not be totally excluded. To solve this problem for future stud-ies, the blood sample could be drawn from the other arm.
Furthermore, the metabolic stability was only as-sessed in a limited number of patients, with only one blood sample per patient. In addition, the blood sample of one of the four patients could not be analysed due to technical problems. Therefore, the data obtained by this study, gives a relatively limited view of the tracer me-tabolism. To solve this problem, more patients and more sampling points per patient should be included. This way, it will become possible to (1) follow the met-abolic stability over time and (2) to obtain more conclu-sive evidence for the metabolic stability, suggested by the current results. However, such studies can pose a challenge, due to the short half-life of Gallium-68.
Finally, due to the high costs of of PSMA-11 and natGa-PSMA-11, the availability of these compounds was very limited. With prices around €1000,- per 1 mg natGa-PSMA-11 (for ‘cold’ experiments) and PSMA-11, or €250,- for a 10 µg GMP-grade PSMA, tuning of the LC/MS system or repeating of microsome studies, be-comes extremely valuable. Furthermore, since only
minute amount of compound can be used due to the high price, it is extremely difficult, if not impossible, to precisely weigh the correct amounts of compound for the preparation of a calibration curve.
The amount of natGa-PSMA-11 needed for the LC/MS microsome studies ̶ when using the microsome proto-col from our department ̶ poses another challenge, caused by the high costs of the test compounds. Around 40 mg of natGa-PSMA-11 is needed to prepare a 4 mM test solution, when working according to the protocol. However, because this will cause severe budgetary problems, the protocol should be revised in the future, so that it could also be used for compounds that have a limited availability.
When revising the protocol, it is important to take the organic solvent concentration in the microsome reaction into account. The current protocol uses DMSO to dissolve the test compound, after which the test solu-tion is diluted in water. Since solvents such are DMSO are known to influence certain CYP450 enzymes at con-centrations as low as 0,2% (14), it is important to limit the amounts of organic solvents in the test solution.
Future perspectives Initially, the UPLC-UV method ̶ as described in this
chapter ̶ was developed to be used for measuring trac-er blood concentrations for pharmacokinetic modelling. However, this method was not sensitive enough to be able to measure tracer concentrations in patients. To be able to perform future pharmacokinetic studies, the LC/MS/MS (tandem MS) method described in this chap-ter may be a solution to this problem. Since PSMA-11 concentrations around 0,02 μg/ml could be detected with this method, it might be possible to quantitate [68Ga]Ga-PSMA-11 levels in blood samples. In addition, the [68Ga]Ga-PSMA-11 concentrations in the SPE elution fractions could be increased by evaporating the ethanol in the elution fractions, after which the [68Ga]Ga-PSMA-11 could be dissolved in a smaller volume of an organic solvent. Such a ‘cold’ bioanalytical method would relieve the time pressure associated with methods that use activity for determining tracer blood concentrations.
The easiest way to perform the future pharmacoki-netic studies is likely to be the direct measurement of radioactivity in the blood samples, per volume unit of blood. After correction for radioactive decay, the activi-ties found at the designated time points could be used to develop a pharmacokinetic model. However, for this method it is important to be sure that all activity that is measured, is from intact [68Ga]Ga-PSMA-11 and not from its radio-metabolites.
Software applications such as Mw/Pharm could then be used for the pharmacokinetic modelling. For the development of a robust population pharmacokinetic (PPK) model, multiple sampling time-points are war-ranted. Approximately 5 to 6 sampling points are need-ed to develop such a robust model (15). Although [68Ga]Ga-PSMA-11 scans are generally performed 60 min p.i., a recent publication showed that scanning a

Kamp, J
EXPERIMENTAL STUDIES
56 | P a g e
later time-points (3h p.i.) show improved imaging re-sults in some cases (16). Therefore, it would be interest-ing to include later time-points (up to 3h p.i.) in the model.
Finally, the data from [68Ga]Ga-PSMA-11 metabolism and PK, can be used to investigate which types of drugs might alter [68Ga]Ga-PSMA-11 PK or metabolism. Alter-ation in the PK or metabolism, could confound the PET images, due to, for example, decreased background clearance (lower tumour/background contrast) or due to non-specific binding of the radio-metabolites.
5. Conclusions In this chapter, the first data from a long-term study
was presented. This study was aiming to set up bioana-lytical methods for the analysis of the [68Ga]Ga-PSMA-11 in biological samples, which could be used for the future evaluation of [68Ga]Ga-PSMA-11 pharmacokinet-
ics and metabolism. Our data suggested a high in vitro and in vivo stability of [68Ga]Ga-PSMA-11.
Solid phase extraction (SPE) showed to be a suitable method for sample preparation. Furthermore, radio-UPLC analysis indicated a minimal tracer metabolism in human microsomes, human plasma and in patients.
The UV-UPLC method lacked the sensitivity needed for the quanification of [68Ga]Ga-PSMA-11 blood levels in patients. Moreover, radio-UPLC recovery values were found to be > 100%. No microsome studies with LC/MS-TOF analysis could be performed due to problems with the calibration of the system.
The study described in this chapter, is only a first step in elucidating the tracer pharmacokinetics and metabolism. Future studies will be needed to further elucidate these characteristics.
6. References 1. Sun X, Wuest M, Weisman GR, Wong EH, Reed DP, Boswell CA, et al.
Radiolabeling and In Vivo Behavior of Copper-64-Labeled Cross-Bridged Cyclam Ligands. J Med Chem [Internet]. 2002 Jan;45(2):469–77. Available from: http://pubs.acs.org/doi/abs/10.1021/jm0103817
2. Bouvet V, Wuest M, Jans H-S, Janzen N, Genady AR, Valliant JF, et al. Automated synthesis of [(18)F]DCFPyL via direct radiofluorination and validation in preclinical prostate cancer models. EJNMMI Res [Internet]. 2016;6(1):40. Available from: http://www.ncbi.nlm.nih.gov/pubmed/27142881%5Cnhttp://www.pubmedcentral.nih.gov/articlerender.fcgi?artid=PMC4854855
3. Szabo Z, Mena E, Rowe SP, Plyku D, Nidal R, Eisenberger MA, et al. Initial Evaluation of [(18)F]DCFPyL for Prostate-Specific Membrane Antigen (PSMA)-Targeted PET Imaging of Prostate Cancer. Mol Imaging Biol [Internet]. 2015;17(4):565–74. Available from: http://www.pubmedcentral.nih.gov/articlerender.fcgi?artid=4531836&tool=pmcentrez&rendertype=abstract
4. Geneeskunde N. Productionprotocol [ 68 Ga ] -PSMA-11 ( GMP ). 11. 5. Eder M, Schäfer M, Bauder-Wüst U, Hull WE, Wängler C, Mier W, et al.
68Ga-complex lipophilicity and the targeting property of a urea-based PSMA inhibitor for PET imaging. Bioconjug Chem. 2012;23(4):688–97.
6. ABX. GaPSMA-11 Product Sheet. 2016. 7. ABX Avanced Biochemical Compounds [Internet]. 2017. Available from:
http://www.abx.de/chemicals/9920.html 8. Eder M, Neels O, Müller M, Bauder-Wüst U, Remde Y, Schäfer M, et al.
Novel preclinical and radiopharmaceutical aspects of [68Ga]Ga-PSMA-HBED-CC: A new PET tracer for imaging of prostate cancer. Pharmaceuticals. 2014;7(7):779–96.
9. ABX. HBED-CC-di(tBu)ester Product Sheet. Radeberg; 2015. 10. Satpati D, Shinto A, Kamaleshwaran KK, Sane S, Banerjee S. Convenient
Preparation of [68Ga]DKFZ-PSMA-11 Using a Robust Single-Vial Kit and Demonstration of Its Clinical Efficacy. Mol Imaging Biol [Internet]. 2016;18(3):420–7. Available from: http://dx.doi.org/10.1007/s11307-
016-0943-z 11. Mulder GJ, Dencker L. Drug metabolism: inactivation and bioactivation
of xenobiotics. In: Pharmaceutical Toxicology. 2006. p. 41–66. 12. Blower PJ. Conference presentation. In: Molecular imaging agents in
medicine. 2017. 13. Schäfer M, Bauder-Wüst U, Leotta K, Zoller F, Mier W, Haberkorn U, et
al. A dimerized urea-based inhibitor of the prostate-specific membrane antigen for 68Ga-PET imaging of prostate cancer. EJNMMI Res. 2012;2(1):23.
14. Chauret N, Gauthier a, Nicoll-Griffith D a. Effect of common organic solvents on in vitro cytochrome P450-mediated metabolic activities in human liver microsomes. Drug Metab Dispos. 1998;26(1):1–4.
15. Alffenaar J-WC, Kosterink JGW, van Altena R, van der Werf TS, Uges DR a, Proost JH. Limited sampling strategies for therapeutic drug monitoring of linezolid in patients with multidrug-resistant tuberculosis. Ther Drug Monit [Internet]. 2010 Feb;32(1):97–101. Available from: http://www.ncbi.nlm.nih.gov/pubmed/20042919
16. Afshar-Oromieh A, Sattler LP, Mier W, Hadaschik B, Debus J, Holland-Letz T, et al. The clinical impact of additional late PET/CT imaging with 68Ga-PSMA-11 (HBED-CC) in the diagnosis of prostate cancer. J Nucl Med [Internet]. 2017;11:jnumed.116.183483. Available from: http://www.ncbi.nlm.nih.gov/pubmed/28062595
17. Pillai SA, Chobisa D, Urimi D, Ravindra N. Pharmaceutical glass interactions: A review of possibilities. J Pharm Sci Res. 2016;8(2):103–11.
18. Sacha GA, Saffell-Clemmer W, Abram K, Akers MJ. Practical fundamentals of glass, rubber, and plastic sterile packaging systems. Pharm Dev Technol [Internet]. 2010;15(1):6–34. Available from: http://www.tandfonline.com/doi/full/10.3109/10837450903511178

I
Appendices

II
Appendix I: PSMA-11 calibration chromatograms and calculations
0,0
38
0,7
02
0,8
61
11,5
79
AU
-0,60
-0,50
-0,40
-0,30
-0,20
-0,10
0,00
Minutes
0,00 1,00 2,00 3,00 4,00 5,00 6,00 7,00 8,00 9,00 10,00 11,00 12,00
Figure 1: Blanc, λ = 200nm.
0,2
17
0,7
33
10,3
39
11,1
72
11,5
55
AU
-0,10
0,00
0,10
0,20
0,30
0,40
Minutes
0,00 1,00 2,00 3,00 4,00 5,00 6,00 7,00 8,00 9,00 10,00 11,00 12,00
Figure 2: PSMA-11 0,5μg/ml, λ = 200nm.
0,7
68
1,0
07
1,3
90
1,4
82
1,5
66
10,1
30 11,5
53
AU
-0,10
0,00
0,10
0,20
0,30
0,40
Minutes
0,00 1,00 2,00 3,00 4,00 5,00 6,00 7,00 8,00 9,00 10,00 11,00 12,00
Figure 3: PSMA-11 1,0μg/ml, λ = 200nm.

III
0,6
34
0,9
68
1,0
01
1,3
90
1,4
83
1,5
62
10,1
47
11,2
68
11,5
59
AU
-0,10
0,00
0,10
0,20
0,30
0,40
Minutes
0,00 1,00 2,00 3,00 4,00 5,00 6,00 7,00 8,00 9,00 10,00 11,00 12,00
Figure 4: PSMA-11 5,0μg/ml, λ = 200nm.
0,3
61
7,9
25
10,4
56
11,0
92
11,5
61
AU
-0,10
0,00
0,10
0,20
0,30
0,40
Minutes
0,00 1,00 2,00 3,00 4,00 5,00 6,00 7,00 8,00 9,00 10,00 11,00 12,00
Figure 5: PSMA-11 10,0μg/ml, λ = 200nm.
0,2
74
7,9
22
10,4
56
11,1
45
11,5
62
AU
-0,10
0,00
0,10
0,20
0,30
0,40
Minutes
0,00 1,00 2,00 3,00 4,00 5,00 6,00 7,00 8,00 9,00 10,00 11,00 12,00
Figure 6: PSMA-11 15,0μg/ml, λ = 200nm.

IV
0,9
01
1,0
18
1,3
89
1,4
83
1,5
63
7,9
13
9,9
82 11,5
57
AU
-0,10
0,00
0,10
0,20
0,30
0,40
Minutes
0,00 1,00 2,00 3,00 4,00 5,00 6,00 7,00 8,00 9,00 10,00 11,00 12,00
Figure 7: PSMA-11 20,0μg/ml, λ = 200nm.
0,463
0,654
0,809
1,476
1,932
2,448
2,776
3,224
3,486
3,962
4,194
4,449
4,741
5,007
5,237
5,414
5,769
5,958
6,343
11,50
5
AU
-0,08
-0,06
-0,04
-0,02
0,00
0,02
0,04
0,06
0,08
0,10
0,12
0,14
0,16
0,18
0,20
Minutes
0,00 1,00 2,00 3,00 4,00 5,00 6,00 7,00 8,00 9,00 10,00 11,00 12,00
Figure 8: Blanc, λ = 220nm.
0,2
58
0,4
26
0,8
29
11,5
04
AU
-0,02
0,00
0,02
0,04
0,06
0,08
Minutes
0,00 1,00 2,00 3,00 4,00 5,00 6,00 7,00 8,00 9,00 10,00 11,00 12,00
Figure 9: PSMA-11 0,5μg/ml, λ = 220nm.

V
0,6
68
1,0
27
1,5
08
1,9
20
2,8
34
3,0
34
3,5
01
3,8
68
4,1
01
4,3
68
4,5
58
4,7
34
4,9
68
5,4
34
5,6
68
5,7
08
6,5
01
11,5
03
AU
-0,02
0,00
0,02
0,04
0,06
0,08
0,10
Minutes
0,00 1,00 2,00 3,00 4,00 5,00 6,00 7,00 8,00 9,00 10,00 11,00 12,00
Figure 10: PSMA-11 1,0μg/ml, λ = 220nm.
1,0
33
1,5
09
1,9
33
2,4
68
2,9
68
3,3
68
4,1
68
4,2
88
4,7
68
4,9
68
5,2
68
5,5
68
5,6
18
5,9
68
6,3
34
7,9
25
11,5
03
AU
-0,02
0,00
0,02
0,04
0,06
0,08
0,10
Minutes
0,00 1,00 2,00 3,00 4,00 5,00 6,00 7,00 8,00 9,00 10,00 11,00 12,00
Figure 11: PSMA-11 5,0μg/ml, λ = 220nm.
1,0
38
1,4
10
1,5
11
1,9
22
3,0
01
3,6
68
3,9
68
4,1
26
4,7
01
4,8
65
5,0
96
5,2
64
5,7
34
5,7
47
6,1
34
6,2
36
7,9
21
11,5
08
AU
-0,02
0,00
0,02
0,04
0,06
0,08
0,10
Minutes
0,00 1,00 2,00 3,00 4,00 5,00 6,00 7,00 8,00 9,00 10,00 11,00 12,00
Figure 12: PSMA-11 10,0μg/ml, λ = 220nm.

VI
0,6
68
1,0
41
1,4
08
1,5
11
1,9
18
2,9
68
3,1
34
3,5
01
3,9
34
4,1
68
4,3
68
4,6
34
4,8
34
5,3
01
5,4
88
5,9
68
6,2
01
6,2
70
7,9
19 1
1,5
06
AU
-0,02
0,00
0,02
0,04
0,06
0,08
0,10
Minutes
0,00 1,00 2,00 3,00 4,00 5,00 6,00 7,00 8,00 9,00 10,00 11,00 12,00
Figure 13: PSMA-11 15,0μg/ml, λ = 220nm.
0,3
06
0,8
39
6,1
65
7,9
20 11,5
10
AU
-0,02
0,00
0,02
0,04
0,06
0,08
0,10
Minutes
0,00 1,00 2,00 3,00 4,00 5,00 6,00 7,00 8,00 9,00 10,00 11,00 12,00
Figure 14: PSMA-11 20,0μg/ml, λ = 220nm.
1,4
48
1,9
46
2,5
68
3,3
34
4,2
68
5,4
01
11,4
91
AU
-0,110
-0,100
-0,090
-0,080
-0,070
-0,060
-0,050
-0,040
-0,030
-0,020
-0,010
0,000
0,010
0,020
Minutes
0,00 0,50 1,00 1,50 2,00 2,50 3,00 3,50 4,00 4,50 5,00 5,50 6,00 6,50 7,00 7,50 8,00 8,50 9,00 9,50 10,00 10,50 11,00 11,50 12,00
Figure 15: Blanc, λ = 220nm (new calibration curve).

VII
0,9
98
1,4
82
1,9
15
3,1
96
5,2
95
6,1
57
11,4
98
AU
-0,010
0,000
0,010
0,020
0,030
0,040
0,050
0,060
0,070
Minutes
0,00 0,50 1,00 1,50 2,00 2,50 3,00 3,50 4,00 4,50 5,00 5,50 6,00 6,50 7,00 7,50 8,00 8,50 9,00 9,50 10,00 10,50 11,00 11,50 12,00
Figure 16: PSMA-11 0,5 μg/ml, λ = 220nm (new calibration curve).
0,3
92
0,6
92
4,5
54
5,4
04
5,5
03
6,3
26 6,9
61
11,5
00
AU
-0,010
0,000
0,010
0,020
0,030
0,040
0,050
0,060
0,070
Minutes
0,00 0,50 1,00 1,50 2,00 2,50 3,00 3,50 4,00 4,50 5,00 5,50 6,00 6,50 7,00 7,50 8,00 8,50 9,00 9,50 10,00 10,50 11,00 11,50 12,00
Figure 17: PSMA-11 1μg/ml λ = 220nm (new calibration curve).
1,4
94
4,3
06
5,2
51
5,5
30
5,8
10
11,5
00
AU
-0,010
0,000
0,010
0,020
0,030
0,040
0,050
0,060
0,070
Minutes
0,00 0,50 1,00 1,50 2,00 2,50 3,00 3,50 4,00 4,50 5,00 5,50 6,00 6,50 7,00 7,50 8,00 8,50 9,00 9,50 10,00 10,50 11,00 11,50 12,00
Figure 18: PSMA-11 2,5 μg/ml, λ = 220nm (new calibration curve).

VIII
0,5
27
0,6
71
0,8
32
0,9
51
1,4
49
1,9
06
3,7
52
4,9
68
5,1
94
5,3
68
6,7
58
7,4
69
7,9
06
11,4
95
AU
-0,08
-0,06
-0,04
-0,02
0,00
0,02
0,04
0,06
0,08
Minutes
0,00 0,50 1,00 1,50 2,00 2,50 3,00 3,50 4,00 4,50 5,00 5,50 6,00 6,50 7,00 7,50 8,00 8,50 9,00 9,50 10,00 10,50 11,00 11,50 12,00
Figure 19: PSMA-11 5,0 μg/ml, λ = 220nm (new calibration curve).
0,4
87
1,0
13
1,4
84
1,9
43
4,0
86
5,4
08
7,9
33
11,4
98
AU
-0,010
0,000
0,010
0,020
0,030
0,040
0,050
0,060
0,070
Minutes
0,00 0,50 1,00 1,50 2,00 2,50 3,00 3,50 4,00 4,50 5,00 5,50 6,00 6,50 7,00 7,50 8,00 8,50 9,00 9,50 10,00 10,50 11,00 11,50 12,00
Figure 20: PSMA-11 10,0μg/ml, λ = 220nm (new calibration curve).
1,0
18
1,4
84
1,9
22
2,1
58
5,2
50
5,5
09
6,1
48
7,9
29
11,4
98
AU
-0,010
0,000
0,010
0,020
0,030
0,040
0,050
0,060
0,070
Minutes
0,00 0,50 1,00 1,50 2,00 2,50 3,00 3,50 4,00 4,50 5,00 5,50 6,00 6,50 7,00 7,50 8,00 8,50 9,00 9,50 10,00 10,50 11,00 11,50 12,00
Figure 21: PSMA-11 15,0μg/ml, λ = 220nm (new calibration curve).

IX
Old calibration curve, λ = 200nm.
PSMA-11 concentration (μg/ml) Peak area
5 45753,82
10 98369,06
15 169541,96
20 254886,69
Description Value Calculation
Slope 13971
√N 2 Square Root 4
SE Intercept 14198 Regression analysis (Sigma plot)
SD Intercept 2,84E+04 SE*√N
LOD 6,71E+00 3,3*(SD intercept/ slope)
LOQ 2,03E+01 10*(SD intercept/ slope)
Old calibration curve, λ = 220nm.
PSMA-11 concentration (μg/ml) Peak area
5 11748,11
10 29575,29
15 47089,52
20 69278,62
Description Value Calculation
Slope 3802,1
√N 2 Square Root 4
SE Intercept 2121,4 Regression analysis (Sigma plot)
SD Intercept 4,24E+03 SE*√N
LOD 3,68E+00 3,3*(SD intercept/ slope)
LOQ 1,12E+01 10*(SD intercept/ slope)
1,0
14
1,4
88
1,7
00 1
,868
6,9
69
7,9
27
11,4
96
AU
-0,020
-0,010
0,000
0,010
0,020
0,030
0,040
0,050
Minutes
0,00 0,50 1,00 1,50 2,00 2,50 3,00 3,50 4,00 4,50 5,00 5,50 6,00 6,50 7,00 7,50 8,00 8,50 9,00 9,50 10,00 10,50 11,00 11,50 12,00
Figure 22: PSMA-11 20μg/ml, λ = 220nm (new calibration curve).

X
New calibration curve, λ = 220nm.
PSMA-11 concentration (μg/ml) Peak intensity
1 4611,746892
2,5 10241,985
5 20419,16852
10 36735,20098
15 55480,5161
20 85339,76696
Description Value Calculation
Slope 4071,8
√N 2,44949 Square Root 6
SE Intercept 2567,3 Regression analysis (Sigma plot)
SD Intercept 6,29E+03 SE*√N
LOD 5,10E+00 3,3*(SD intercept/ slope)
LOQ 1,54E+01 10*(SD intercept/ slope)

XI
Appendix II: SOP microsome studies

XII

XIII

XIV

XV

XVI

XVII

XVIII

XIX
Appendix III: Overview sample sequence for recovery studies
Tray Well Sample Tray Well Sample
1 1 Blanc water 4 19 Fraction UPLC
1 2 Blanc water 4 20 Fraction UPLC
1 3 Blanc water 5 21 Fraction UPLC
1 4 Fraction UPLC 5 22 Fraction UPLC
1 5 Fraction UPLC 5 23 Fraction UPLC
2 6 Fraction UPLC 5 24 Fraction UPLC
2 7 Fraction UPLC 5 25 Fraction UPLC
2 8 Fraction UPLC 6 26 Fraction UPLC
2 9 Fraction UPLC 6 27 Fraction UPLC
2 10 Fraction UPLC 6 28 Blanc water
3 11 Fraction UPLC 6 29 Blanc water
3 12 Fraction UPLC 6 30 Blanc water
3 13 Fraction UPLC 7 31 Control X μl
3 14 Fraction UPLC 7 32 Control X μl
3 15 Fraction UPLC 7 33 Control X μl
4 16 Fraction UPLC 7 34 Blanc water
4 17 Fraction UPLC 7 35 Blanc water
4 18 Fraction UPLC 8 36 Blanc water
Appendix: Overview of sample layout of used for the recovery studies.

XX
Appendix IV: Raw data recovery studies 10 μl injection volume
Rack Ga-68 CPM Ga-68 Error % Sample name
1 199,97 7,08 Blanc water
1 174,51 7,60 Blanc water
1 153,45 8,12 Blanc water
1 146,09 8,35 Fraction UPLC
1 110,14 9,64 Fraction UPLC
2 133,52 8,80 Fraction UPLC
2 308,24 5,81 Fraction UPLC
2 1295,24 2,84 Fraction UPLC
2 2059,18 2,26 Fraction UPLC
2 2263,04 2,16 Fraction UPLC
3 2332,27 2,14 Fraction UPLC
3 2438,38 2,09 Fraction UPLC
3 2846,14 1,94 Fraction UPLC
3 2286,13 2,17 Fraction UPLC
3 2595,50 2,05 Fraction UPLC
4 3307,64 1,82 Fraction UPLC
4 6543,61 1,30 Fraction UPLC
4 16572,20 0,82 Fraction UPLC
4 1339037,71 0,09 Fraction UPLC
4 2134877,02 0,07 Fraction UPLC
5 93631,69 0,35 Fraction UPLC
5 10340,59 1,05 Fraction UPLC
5 4391,69 1,61 Fraction UPLC
5 2761,39 2,04 Fraction UPLC
5 1815,34 2,52 Fraction UPLC
6 1374,95 2,91 Fraction UPLC
6 974,80 3,47 Fraction UPLC
6 84,42 11,80 Blanc water
6 80,13 12,15 Blanc water
6 123,17 9,82 Blanc water
7 3098167,55 0,06 Control 10 ul
7 3664663,90 0,06 Control 10 ul
7 2987021,64 0,06 Control 10 ul
7 286,53 6,52 Blanc water
7 92,74 11,48 Blanc water
8 142,70 9,30 Blanc water
8 118,69 10,22 Empty
8 39,76 17,70 Empty
8 49,94 15,84 Empty
8 50,19 15,83 Empty
Mean controls 3249951,03
Total UPLC fractions 3634442,50
Recovery (%) 111,830685
20 μl injection volume
Rack Ga-68 CPM Ga-68 Error % Sample name

XXI
1 183,97 7,38 Blanc water
1 112,54 9,46 Blanc water
1 113,09 9,46 Blanc water
1 3087,31 1,82 Fraction UPLC
1 187,63 7,38 Fraction UPLC
2 160,51 8,02 Fraction UPLC
2 527,08 4,44 Fraction UPLC
2 2782,36 1,94 Fraction UPLC
2 3629,67 1,70 Fraction UPLC
2 3915,26 1,64 Fraction UPLC
3 4168,72 1,60 Fraction UPLC
3 5122,81 1,44 Fraction UPLC
3 4089,63 1,62 Fraction UPLC
3 3752,73 1,70 Fraction UPLC
3 4457,88 1,56 Fraction UPLC
4 6023,28 1,35 Fraction UPLC
4 20988,73 0,72 Fraction UPLC
4 24736,57 0,67 Fraction UPLC
4 1988464,73 0,07 Fraction UPLC
4 3210032,08 0,06 Fraction UPLC
5 123043,82 0,30 Fraction UPLC
5 15295,21 0,86 Fraction UPLC
5 6454,13 1,33 Fraction UPLC
5 3891,43 1,72 Fraction UPLC
5 2665,53 2,08 Fraction UPLC
6 2221,81 2,29 Fraction UPLC
6 1722,42 2,60 Fraction UPLC
6 121,57 9,82 Blanc water
6 94,07 11,19 Blanc water
6 108,59 10,44 Blanc water
7 4772136,34 0,05 Control 10 ul
7 4868872,36 0,05 Control 10 ul
7 4855823,80 0,05 Control 10 ul
7 504,92 4,90 Blanc water
7 199,23 7,82 Blanc water
8 235,61 7,22 Blanc water
8 216,83 7,55 Empty
8 153,50 8,99 Empty
8 266,12 6,85 Empty
8 242,42 7,19 Empty
Mean controls 4832277,50 Total UPLC fractions 5441421,33 Recovery (%) 112,6057295

XXII
50 μl injection volume
Rack Ga-68 CPM Ga-68 Error % Sample name
1 43,99 15,10 Blanc water
1 88,40 10,68 Blanc water
1 64,62 12,52 Blanc water
1 1022,99 3,15 Fraction UPLC
1 106,05 9,82 Fraction UPLC
2 57,63 13,38 Fraction UPLC
2 1125,38 3,04 Fraction UPLC
2 5373,37 1,39 Fraction UPLC
2 6288,45 1,29 Fraction UPLC
2 6500,69 1,27 Fraction UPLC
3 7032,54 1,23 Fraction UPLC
3 9144,15 1,08 Fraction UPLC
3 6949,41 1,24 Fraction UPLC
3 7109,76 1,23 Fraction UPLC
3 8088,87 1,16 Fraction UPLC
4 11748,31 0,97 Fraction UPLC
4 40419,52 0,52 Fraction UPLC
4 46286,48 0,49 Fraction UPLC
4 4731561,14 0,05 Fraction UPLC
4 4552975,17 0,05 Fraction UPLC
5 169821,14 0,26 Fraction UPLC
5 23954,40 0,69 Fraction UPLC
5 9743,65 1,08 Fraction UPLC
5 6843,97 1,30 Fraction UPLC
5 4880,36 1,54 Fraction UPLC
6 3318,82 1,88 Fraction UPLC
6 2361,00 2,23 Fraction UPLC
6 37,65 17,70 Blanc water
6 70,96 12,93 Blanc water
6 38,04 17,70 Blanc water
7 38,48 17,71 Empty
7 87,01 11,80 Empty
7 29,18 20,43 Empty
7 53,76 15,09 Empty
7 44,16 16,69 Empty
8
8
8
8
8
Mean controls - Total UPLC fractions 9662713,25 Recovery (%) -

XXIII
Appendix V: LC/MS-TOF settings

XXIV
Appendix VI: LC/MS/MS settings
Figure 1: Initial MS/MS settings (upper), settings for parent scans of the 1+ charged molecule (middle) and 2+ charged molecule (lower).

XXV
Appendix VII: LC/MS/MS transitions

XXVI

XXVII

XXVIII
Appendix VIII: LC/MS/MS mass chromatograms: XBridge column
pla
at -
HB
ED-C
C-P
SMA
- 2
µg/
mL
Tim
e0.2
00.4
00.6
00.8
01.0
01.2
01.4
01.6
01.8
02.0
02.2
02.4
02.6
02.8
03.0
03.2
03.4
03.6
03.8
04.0
04.2
04.4
04.6
04.8
05.0
05.2
05.4
05.6
05.8
06.0
06.2
06.4
06.6
06.8
07.0
07.2
07.4
07.6
07.8
0
%
0
100
0.2
00.4
00.6
00.8
01.0
01.2
01.4
01.6
01.8
02.0
02.2
02.4
02.6
02.8
03.0
03.2
03.4
03.6
03.8
04.0
04.2
04.4
04.6
04.8
05.0
05.2
05.4
05.6
05.8
06.0
06.2
06.4
06.6
06.8
07.0
07.2
07.4
07.6
07.8
0
%
0
100
0.2
00.4
00.6
00.8
01.0
01.2
01.4
01.6
01.8
02.0
02.2
02.4
02.6
02.8
03.0
03.2
03.4
03.6
03.8
04.0
04.2
04.4
04.6
04.8
05.0
05.2
05.4
05.6
05.8
06.0
06.2
06.4
06.6
06.8
07.0
07.2
07.4
07.6
07.8
0
%
0
100
0.2
00.4
00.6
00.8
01.0
01.2
01.4
01.6
01.8
02.0
02.2
02.4
02.6
02.8
03.0
03.2
03.4
03.6
03.8
04.0
04.2
04.4
04.6
04.8
05.0
05.2
05.4
05.6
05.8
06.0
06.2
06.4
06.6
06.8
07.0
07.2
07.4
07.6
07.8
0
%
0
100
0.2
00.4
00.6
00.8
01.0
01.2
01.4
01.6
01.8
02.0
02.2
02.4
02.6
02.8
03.0
03.2
03.4
03.6
03.8
04.0
04.2
04.4
04.6
04.8
05.0
05.2
05.4
05.6
05.8
06.0
06.2
06.4
06.6
06.8
07.0
07.2
07.4
07.6
07.8
0
%
0
100
170404_024
MR
M o
f 7 C
hannels
ES
+
474.4
> 8
00.4
(H
BE
D-C
C-P
SM
A)
1.2
4e6
2.1
0
170404_024
MR
M o
f 7 C
hannels
ES
+
474.4
> 6
22.3
5 (
HB
ED
-CC
-PS
MA
)1.9
3e6
2.1
0
170404_024
MR
M o
f 7 C
hannels
ES
+
474.4
> 3
87.8
(H
BE
D-C
C-P
SM
A)
3.9
2e6
2.1
1
170404_024
MR
M o
f 7 C
hannels
ES
+
474.4
> 3
85.3
(H
BE
D-C
C-P
SM
A)
2.9
6e6
2.1
1
170404_024
MR
M o
f 7 C
hannels
ES
+
474.4
> 3
56.3
(H
BE
D-C
C-P
SM
A)
2.6
6e6
2.1
1

XXIX
pla
at -
HB
ED-C
C-P
SMA
- 0
.2µ
g/m
L
Tim
e0.2
00.4
00.6
00.8
01.0
01.2
01.4
01.6
01.8
02.0
02.2
02.4
02.6
02.8
03.0
03.2
03.4
03.6
03.8
04.0
04.2
04.4
04.6
04.8
05.0
05.2
05.4
05.6
05.8
06.0
06.2
06.4
06.6
06.8
07.0
07.2
07.4
07.6
07.8
0
%
0
100
0.2
00.4
00.6
00.8
01.0
01.2
01.4
01.6
01.8
02.0
02.2
02.4
02.6
02.8
03.0
03.2
03.4
03.6
03.8
04.0
04.2
04.4
04.6
04.8
05.0
05.2
05.4
05.6
05.8
06.0
06.2
06.4
06.6
06.8
07.0
07.2
07.4
07.6
07.8
0
%
0
100
0.2
00.4
00.6
00.8
01.0
01.2
01.4
01.6
01.8
02.0
02.2
02.4
02.6
02.8
03.0
03.2
03.4
03.6
03.8
04.0
04.2
04.4
04.6
04.8
05.0
05.2
05.4
05.6
05.8
06.0
06.2
06.4
06.6
06.8
07.0
07.2
07.4
07.6
07.8
0
%
0
100
0.2
00.4
00.6
00.8
01.0
01.2
01.4
01.6
01.8
02.0
02.2
02.4
02.6
02.8
03.0
03.2
03.4
03.6
03.8
04.0
04.2
04.4
04.6
04.8
05.0
05.2
05.4
05.6
05.8
06.0
06.2
06.4
06.6
06.8
07.0
07.2
07.4
07.6
07.8
0
%
0
100
0.2
00.4
00.6
00.8
01.0
01.2
01.4
01.6
01.8
02.0
02.2
02.4
02.6
02.8
03.0
03.2
03.4
03.6
03.8
04.0
04.2
04.4
04.6
04.8
05.0
05.2
05.4
05.6
05.8
06.0
06.2
06.4
06.6
06.8
07.0
07.2
07.4
07.6
07.8
0
%
0
100
170404_025
MR
M o
f 7 C
hannels
ES
+
474.4
> 8
00.4
(H
BE
D-C
C-P
SM
A)
3.6
5e4
2.1
2
2.0
8
1.8
5
2.1
6
2.2
0
2.2
12.3
5
2.5
22.9
02.8
12.7
72.9
33.1
43.5
43.2
03.3
3
170404_025
MR
M o
f 7 C
hannels
ES
+
474.4
> 6
22.3
5 (
HB
ED
-CC
-PS
MA
)5.1
8e4
2.1
1
1.4
81.9
2
2.1
3
2.1
6
2.1
9
2.2
22.2
92.7
52.5
52.5
93.0
22.8
83.0
43.1
43.3
43.3
8
170404_025
MR
M o
f 7 C
hannels
ES
+
474.4
> 3
87.8
(H
BE
D-C
C-P
SM
A)
1.1
8e5
2.1
2
1.9
0
2.1
5
2.1
9 2.2
22.3
22.6
42.5
62.8
43.0
13.1
24.2
63.2
04.7
9
170404_025
MR
M o
f 7 C
hannels
ES
+
474.4
> 3
85.3
(H
BE
D-C
C-P
SM
A)
9.4
7e4
2.1
1
1.9
91.4
81.9
7
2.1
2
2.1
4
2.1
5
2.1
8 2.2
22.5
32.4
52.6
72.7
72.7
93.0
2
170404_025
MR
M o
f 7 C
hannels
ES
+
474.4
> 3
56.3
(H
BE
D-C
C-P
SM
A)
1.0
3e5
2.1
1
2.0
51.8
61.5
20.3
40.1
9
2.1
2
2.1
4
2.1
8
2.2
52.4
2
2.6
72.7
53.1
13.0
82.9
43.2
63.3
33.6
4
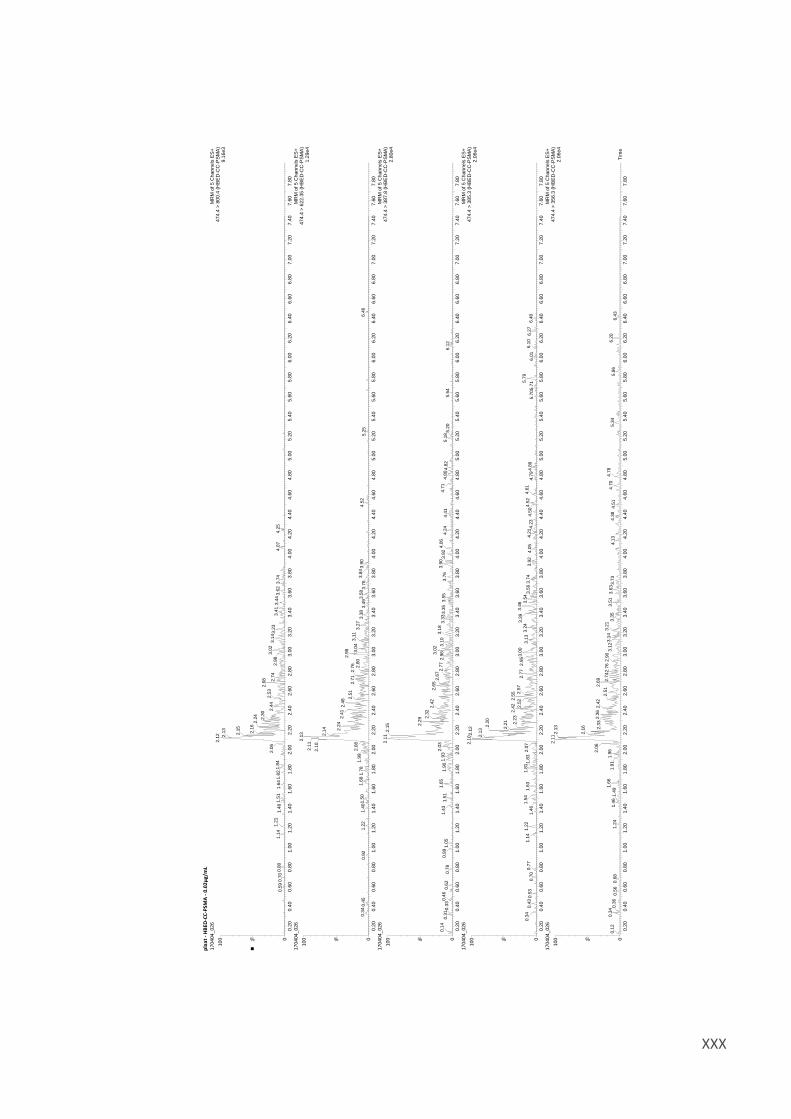
XXX
pla
at -
HB
ED-C
C-P
SMA
- 0
.02
µg/
mL
Tim
e0.2
00.4
00.6
00.8
01.0
01.2
01.4
01.6
01.8
02.0
02.2
02.4
02.6
02.8
03.0
03.2
03.4
03.6
03.8
04.0
04.2
04.4
04.6
04.8
05.0
05.2
05.4
05.6
05.8
06.0
06.2
06.4
06.6
06.8
07.0
07.2
07.4
07.6
07.8
0
%
0
100
0.2
00.4
00.6
00.8
01.0
01.2
01.4
01.6
01.8
02.0
02.2
02.4
02.6
02.8
03.0
03.2
03.4
03.6
03.8
04.0
04.2
04.4
04.6
04.8
05.0
05.2
05.4
05.6
05.8
06.0
06.2
06.4
06.6
06.8
07.0
07.2
07.4
07.6
07.8
0
%
0
100
0.2
00.4
00.6
00.8
01.0
01.2
01.4
01.6
01.8
02.0
02.2
02.4
02.6
02.8
03.0
03.2
03.4
03.6
03.8
04.0
04.2
04.4
04.6
04.8
05.0
05.2
05.4
05.6
05.8
06.0
06.2
06.4
06.6
06.8
07.0
07.2
07.4
07.6
07.8
0
%
0
100
0.2
00.4
00.6
00.8
01.0
01.2
01.4
01.6
01.8
02.0
02.2
02.4
02.6
02.8
03.0
03.2
03.4
03.6
03.8
04.0
04.2
04.4
04.6
04.8
05.0
05.2
05.4
05.6
05.8
06.0
06.2
06.4
06.6
06.8
07.0
07.2
07.4
07.6
07.8
0
%
0
100
0.2
00.4
00.6
00.8
01.0
01.2
01.4
01.6
01.8
02.0
02.2
02.4
02.6
02.8
03.0
03.2
03.4
03.6
03.8
04.0
04.2
04.4
04.6
04.8
05.0
05.2
05.4
05.6
05.8
06.0
06.2
06.4
06.6
06.8
07.0
07.2
07.4
07.6
07.8
0
%
0
100
170404_026
MR
M o
f 5 C
hannels
ES
+
474.4
> 8
00.4
(H
BE
D-C
C-P
SM
A)
9.1
6e3
2.1
2
2.0
6
1.8
41.8
21.5
11.1
40.8
00.7
00.5
91.2
11.4
81.6
4
2.1
3
2.1
5
2.1
62.2
4
2.6
82.3
0
2.4
42.5
33.0
22.7
42.9
83.1
43.2
33.4
13.4
43.6
24.0
73.7
44.2
5
170404_026
MR
M o
f 5 C
hannels
ES
+
474.4
> 6
22.3
5 (
HB
ED
-CC
-PS
MA
)1.2
9e4
2.1
3
2.1
1
2.1
0
2.0
81.9
91.6
81.5
00.3
41.4
01.2
20.4
50.9
21.7
8
2.1
4 2.2
42.4
82.4
12.9
8
2.7
12.5
12.7
6 2.8
03.0
43.1
13.2
73.5
83.3
83.4
93.9
03.8
43.7
64.5
26.4
65.2
5
170404_026
MR
M o
f 5 C
hannels
ES
+
474.4
> 3
87.8
(H
BE
D-C
C-P
SM
A)
2.8
0e4
2.1
1
2.0
31.6
51.5
10.1
40.3
11.0
50.6
20.3
30.4
60.9
90.7
81.4
31.9
31.9
0
2.1
5 2.2
9 2.3
2
2.6
52.4
23.0
22.6
72.7
72.9
63.9
03.1
03.1
83.3
33.3
53.5
53.7
63.9
24.0
64.2
44.8
04.4
14.7
15.1
84.8
25.6
45.2
06.1
2
170404_026
MR
M o
f 5 C
hannels
ES
+
474.4
> 3
85.3
(H
BE
D-C
C-P
SM
A)
2.0
6e4
2.1
0
1.8
11.2
20.4
30.3
40.5
31.1
40.7
00.7
71.6
31.5
4
1.4
61.8
32.0
7
2.1
2
2.1
3
2.2
0
2.2
1
2.4
22.2
32.5
5
2.5
23.4
63.0
02.7
72.5
72.9
53.3
93.2
43.1
35.7
93.5
44.5
23.5
63.7
44.2
13.9
24.0
54.5
04.2
34.6
14.8
94.7
95.7
15.7
06.2
76.0
16.1
06.4
0
170404_026
MR
M o
f 5 C
hannels
ES
+
474.4
> 3
56.3
(H
BE
D-C
C-P
SM
A)
2.0
6e4
2.1
1
2.0
6
1.6
60.3
40.1
21.4
60.3
61.2
40.6
80.5
61.4
91.9
61.9
1
2.1
3
2.1
6
2.3
62.3
32.6
92.4
2
2.5
12.7
42.7
63.1
43.1
22.9
03.2
13.5
13.3
54.7
03.6
33.7
34.3
84.1
34.5
16.2
04.7
85.3
45.8
66.4
3

XXXI
Appendix IX: UPLC chromatograms PSMA-11 and natGa-PSMA-11
fig. 1: PSMA-11 20 μl/ml 07-04-2017 / 13:54. Peak area = 337003,250587
fig. 2: PSMA-11 20 μl/ml 10-04-2017 / 08:44. Peak area = 203993,067535
fig. 3: Ga-PSMA-11 ref 1,0 mg/ml 12-05-2017 / 10:00. Peak area = 1309358,365541
fig. 4: Ga-PSMA-11 ref 1 mg/ml 12-05-2017 / 10:13. Peak area = 1271682,146422
fig. 5: Ga-PSMA-11 ref 1 mg/ml 15-05-2017 / 10:13. Peak area = 1332230,077241
fig. 6: Ga-PSMA-11 ref 1 mg/ml 15-05-2017 / 10:13. Peak area = 1270950,022568

XXXII
Appendix X: Raw data in vitro metabolic stability studies
Figure 2: Activity per fraction after UPLC separation. QC [68Ga]Ga-PSMA-11 sample (upper) and control sample for the liver microsomes, without NADPH (graph).
Quality Control (QC)
Sampling interval (min) Cpm I Cpm II Cpm mean
0,0-0,5 4 12 8
Sampling interval (min)
0,0
-0,5
0,5
-1,0
1,0
-1,5
1,5
-2,0
2,0
-2,5
2,5
-3,0
3,0
-3,5
3,5
-4,0
4,0
-4,5
4,5
-5,0
5,0
-5,5
5,5
-6,0
6,0
-6,5
6,5
-7,0
7,0
-7,5
7,5
-8,0
8,0
-8,5
8,5
-9,0
9,0
-9,5
9,5
-10,0
10,0
-10,5
10,5
-11,0
11,0
-11,5
11,5
-12,0
Cpm
0,0
2,0e+5
4,0e+5
6,0e+5
8,0e+5
1,0e+6
1,2e+6
1,4e+6
1,6e+6
Sampling interval (min)
0,0
-0,5
0,5
-1,0
1,0
-1,5
1,5
-2,0
2,0
-2,5
2,5
-3,0
3,0
-3,5
3,5
-4,0
4,0
-4,5
4,5
-5,0
5,0
-5,5
5,5
-6,0
6,0
-6,5
6,5
-7,0
7,0
-7,5
7,5
-8,0
8,0
-8,5
8,5
-9,0
9,0
-9,5
9,5
-10,0
10,0
-10,5
10,5
-11,0
11,0
-11,5
11,5
-12,0
Cpm
0
2000
4000
6000
8000
10000

XXXIII
0,5-1,0 8 13 10,5
1,0-1,5 13 34 23,5
1,5-2,0 43 117 80
2,0-2,5 219 627 423
2,5-3,0 200 832 516
3,0-3,5 240 1031 635,5
3,5-4,0 410 1472 941
4,0-4,5 303 1296 799,5
4,5-5,0 230 831 530,5
5,0-5,5 239 941 590
5,5-6,0 332 1278 805
6,0-6,5 800 2738 1769
6,5-7,0 849 3297 2073
7,0-7,5 131847 476862 304354,5
7,5-8,0 612655 2085091 1348873
8,0-8,5 44433 172187 108310
8,5-9,0 4483 16975 10729
9,0-9,5 1098 4774 2936
9,5-10,0 762 3149 1955,5
10,0-10,5 392 1834 1113
10,5-11,0 386 1552 969
11,0-11,5 220 963 591,5
11,5-12,0 193 845 519
1,2
23
1,4
49
1,5
36
1,7
34
1,8
68
2,0
68
6,7
83
7,0
68
8,0
69
8,7
03
8,9
69
11,5
19
AU
-0,15
-0,10
-0,05
0,00
0,05
Minutes
0,00 1,00 2,00 3,00 4,00 5,00 6,00 7,00 8,00 9,00 10,00 11,00 12,00
Figure 3: UPLC chromatogram – QC sample.
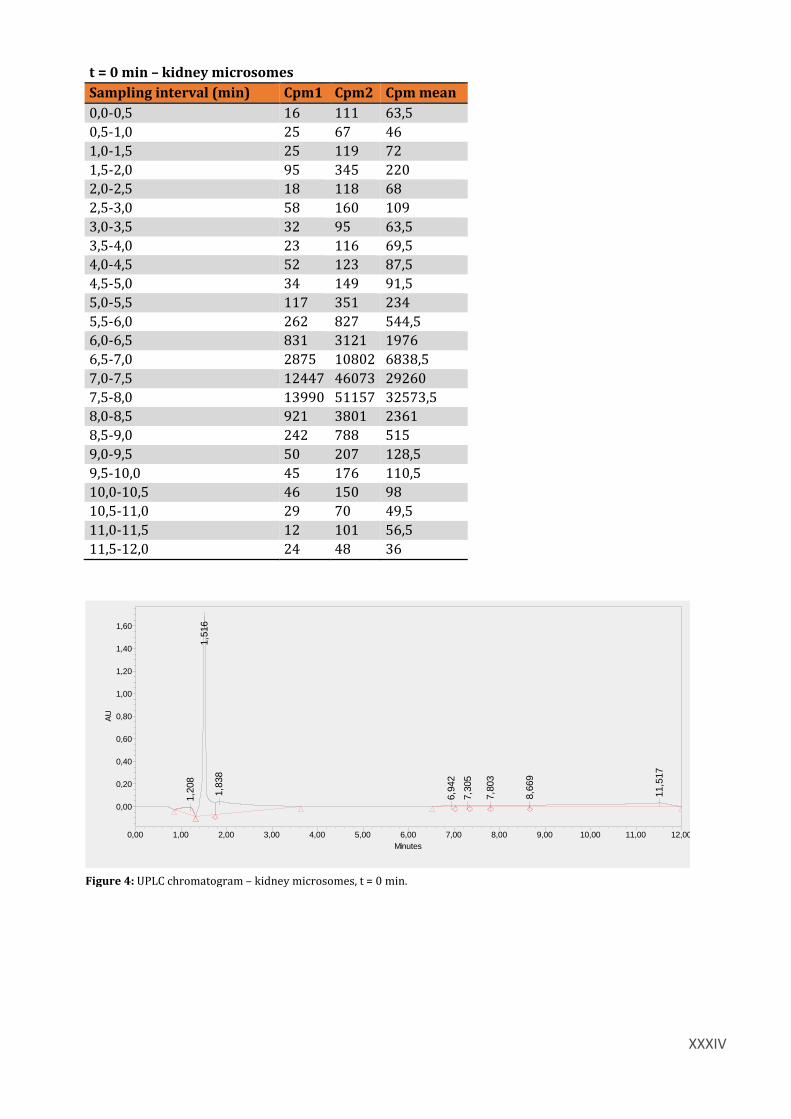
XXXIV
t = 0 min – kidney microsomes
Sampling interval (min) Cpm1 Cpm2 Cpm mean
0,0-0,5 16 111 63,5
0,5-1,0 25 67 46
1,0-1,5 25 119 72
1,5-2,0 95 345 220
2,0-2,5 18 118 68
2,5-3,0 58 160 109
3,0-3,5 32 95 63,5
3,5-4,0 23 116 69,5
4,0-4,5 52 123 87,5
4,5-5,0 34 149 91,5
5,0-5,5 117 351 234
5,5-6,0 262 827 544,5
6,0-6,5 831 3121 1976
6,5-7,0 2875 10802 6838,5
7,0-7,5 12447 46073 29260
7,5-8,0 13990 51157 32573,5
8,0-8,5 921 3801 2361
8,5-9,0 242 788 515
9,0-9,5 50 207 128,5
9,5-10,0 45 176 110,5
10,0-10,5 46 150 98
10,5-11,0 29 70 49,5
11,0-11,5 12 101 56,5
11,5-12,0 24 48 36
1,2
08
1,5
16
1,8
38
6,9
42
7,3
05
7,8
03
8,6
69
11,5
17
AU
0,00
0,20
0,40
0,60
0,80
1,00
1,20
1,40
1,60
Minutes
0,00 1,00 2,00 3,00 4,00 5,00 6,00 7,00 8,00 9,00 10,00 11,00 12,00
Figure 4: UPLC chromatogram – kidney microsomes, t = 0 min.

XXXV
t = 45 min – kidney microsomes
Sampling interval (min) Cpm1 Cpm2 Cpm mean
0,0-0,5 8 45 26,5
0,5-1,0 8 25 16,5
1,0-1,5 4 17 10,5
1,5-2,0 26 134 80
2,0-2,5 22 44 33
2,5-3,0 13 40 26,5
3,0-3,5 9 68 38,5
3,5-4,0 9 37 23
4,0-4,5 28 95 61,5
4,5-5,0 29 82 55,5
5,0-5,5 34 161 97,5
5,5-6,0 109 371 240
6,0-6,5 297 1096 696,5
6,5-7,0 905 3430 2167,5
7,0-7,5 3866 14461 9163,5
7,5-8,0 3629 14367 8998
8,0-8,5 273 1064 668,5
8,5-9,0 77 319 198
9,0-9,5 11 61 36
9,5-10,0 17 68 42,5
10,0-10,5 29 63 46
10,5-11,0 6 41 23,5
11,0-11,5 12 48 30
11,5-12,0 0 48 24
1,1
99
1,4
80
1,8
68
6,9
03
7,2
69
8,7
69
9,1
36
9,5
69
11,5
22
AU
0,00
0,20
0,40
0,60
0,80
1,00
1,20
Minutes
0,00 1,00 2,00 3,00 4,00 5,00 6,00 7,00 8,00 9,00 10,00 11,00 12,00
Figure 5: UPLC chromatogram – kidney microsomes, t = 45 min.

XXXVI
t = 0 min – liver microsomes
Sampling interval (min) Cpm1 Cpm2 Cpm mean
0,0-0,5 95 363 229
0,5-1,0 356 1340 848
1,0-1,5 8 42 25
1,5-2,0 289 1166 727,5
2,0-2,5 57 202 129,5
2,5-3,0 18 98 58
3,0-3,5 45 117 81
3,5-4,0 51 172 111,5
4,0-4,5 66 217 141,5
4,5-5,0 96 365 230,5
5,0-5,5 166 736 451
5,5-6,0 45 114 79,5
6,0-6,5 952 3691 2321,5
6,5-7,0 1891 7065 4478
7,0-7,5 5676 21911 13793,5
7,5-8,0 7902 29431 18666,5
8,0-8,5 631 2777 1704
8,5-9,0 138 573 355,5
9,0-9,5 45 134 89,5
9,5-10,0 11 79 45
10,0-10,5 17 86 51,5
10,5-11,0 12 18 15
11,0-11,5 24 84 54
11,5-12,0 18 49 33,5
1,1
99
1,4
80
1,8
68
6,9
03
7,2
69
8,7
69
9,1
36
9,5
69
11,5
22
AU
0,00
0,20
0,40
0,60
0,80
1,00
1,20
Minutes
0,00 1,00 2,00 3,00 4,00 5,00 6,00 7,00 8,00 9,00 10,00 11,00 12,00
Figure 6: UPLC chromatogram - liver microsomes, t = 0 min.
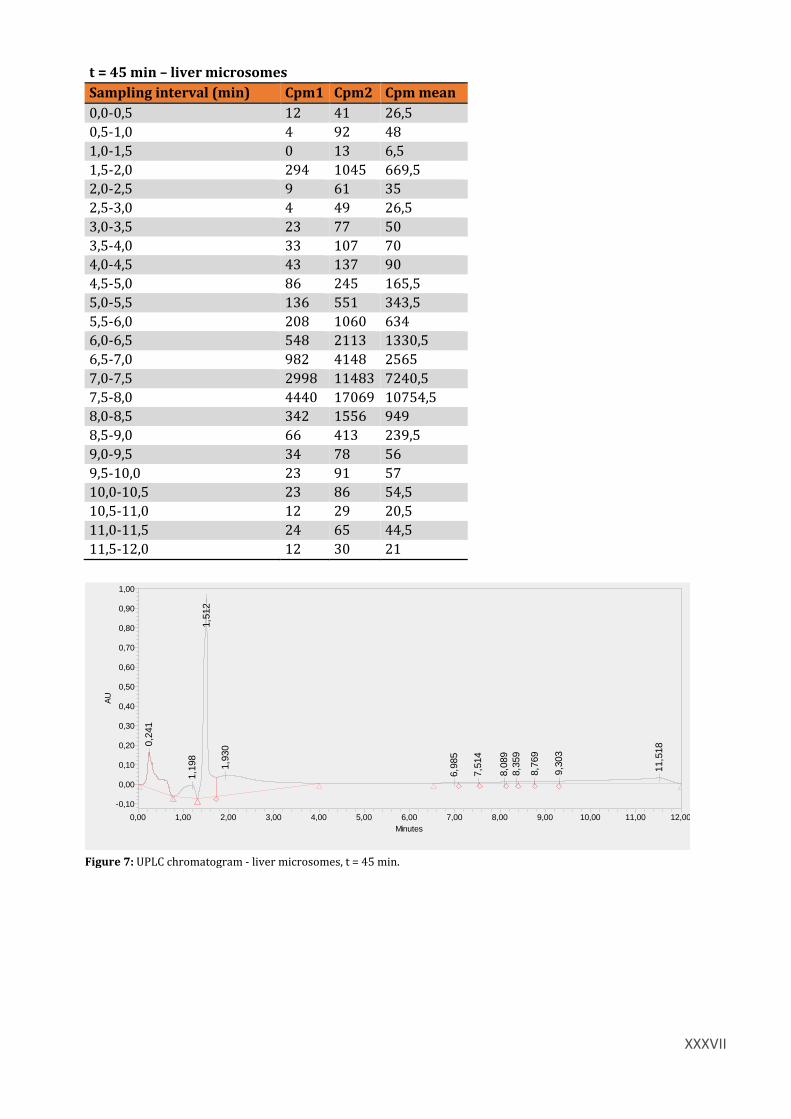
XXXVII
t = 45 min – liver microsomes
Sampling interval (min) Cpm1 Cpm2 Cpm mean
0,0-0,5 12 41 26,5
0,5-1,0 4 92 48
1,0-1,5 0 13 6,5
1,5-2,0 294 1045 669,5
2,0-2,5 9 61 35
2,5-3,0 4 49 26,5
3,0-3,5 23 77 50
3,5-4,0 33 107 70
4,0-4,5 43 137 90
4,5-5,0 86 245 165,5
5,0-5,5 136 551 343,5
5,5-6,0 208 1060 634
6,0-6,5 548 2113 1330,5
6,5-7,0 982 4148 2565
7,0-7,5 2998 11483 7240,5
7,5-8,0 4440 17069 10754,5
8,0-8,5 342 1556 949
8,5-9,0 66 413 239,5
9,0-9,5 34 78 56
9,5-10,0 23 91 57
10,0-10,5 23 86 54,5
10,5-11,0 12 29 20,5
11,0-11,5 24 65 44,5
11,5-12,0 12 30 21
0,2
41
1,1
98
1,5
12
1,9
30
6,9
85
7,5
14
8,0
89
8,3
59
8,7
69
9,3
03
11,5
18
AU
-0,10
0,00
0,10
0,20
0,30
0,40
0,50
0,60
0,70
0,80
0,90
1,00
Minutes
0,00 1,00 2,00 3,00 4,00 5,00 6,00 7,00 8,00 9,00 10,00 11,00 12,00
Figure 7: UPLC chromatogram - liver microsomes, t = 45 min.

XXXVIII
Control sample – liver microsomes, without NADPH
Sampling interval (min) Cpm1 Cpm2 Cpm mean
0,0-0,5 8 12 10
0,5-1,0 21 42 31,5
1,0-1,5 13 25 19
1,5-2,0 43 99 71
2,0-2,5 4 4 4
2,5-3,0 4 27 15,5
3,0-3,5 18 54 36
3,5-4,0 28 79 53,5
4,0-4,5 19 43 31
4,5-5,0 29 67 48
5,0-5,5 24 78 51
5,5-6,0 54 218 136
6,0-6,5 186 674 430
6,5-7,0 322 1302 812
7,0-7,5 2097 7937 5017
7,5-8,0 3141 12183 7662
8,0-8,5 214 770 492
8,5-9,0 66 220 143
9,0-9,5 6 56 31
9,5-10,0 11 45 28
10,0-10,5 12 35 23,5
10,5-11,0 35 47 41
11,0-11,5 12 71 41,5
11,5-12,0 18 66 42
1,2
06
1,4
73
1,6
32
6,9
03
7,7
69
8,1
69
8,4
69
11,5
19
AU
-0,10
-0,05
0,00
0,05
0,10
0,15
0,20
Minutes
0,00 1,00 2,00 3,00 4,00 5,00 6,00 7,00 8,00 9,00 10,00 11,00 12,00
Figure 8: UPLC chromatogram – liver microsomes, control sample.

XXXIX
Plasma sample – spiked with 50µl [68Ga]Ga-PSMA-11
Sampling interval (min) Cpm1 Cpm2 Cpm mean
0,0-0,5 4 16 10
0,5-1,0 0 12 6
1,0-1,5 17 46 31,5
1,5-2,0 0 4 2
2,0-2,5 9 30 19,5
2,5-3,0 4 26 15
3,0-3,5 13 40 26,5
3,5-4,0 5 18 11,5
4,0-4,5 14 33 23,5
4,5-5,0 5 19 12
5,0-5,5 14 34 24
5,5-6,0 5 24 14,5
6,0-6,5 20 69 44,5
6,5-7,0 35 70 52,5
7,0-7,5 97 296 196,5
7,5-8,0 145 669 407
8,0-8,5 21 126 73,5
8,5-9,0 21 128 74,5
9,0-9,5 22 138 80
9,5-10,0 17 50 33,5
10,0-10,5 11 40 25,5
10,5-11,0 0 35 17,5
11,0-11,5 0 29 14,5
11,5-12,0 18 42 30
1,1
92
1,5
12
1,5
68
1,8
34
2,9
34
5,8
03
6,0
84
6,8
80
7,6
30
8,5
83
11,5
22
AU
-0,10
0,00
0,10
0,20
0,30
0,40
0,50
0,60
0,70
0,80
Minutes
0,00 1,00 2,00 3,00 4,00 5,00 6,00 7,00 8,00 9,00 10,00 11,00 12,00
Figure 9: UPLC chromatogram - plasma sample.

XL
Appendix XI: Raw data patient studies
Sampling interval (min)
0,0
-0,5
0,5
-1,0
1,0
-1,5
1,5
-2,0
2,0
-2,5
2,5
-3,0
3,0
-3,5
3,5
-4,0
4,0
-4,5
4,5
-5,0
5,0
-5,5
5,5
-6,0
6,0
-6,5
6,5
-7,0
7,0
-7,5
7,5
-8,0
8,0
-8,5
8,5
-9,0
9,0
-9,5
9,5
-10,0
10,0
-10,5
10,5
-11,0
11,0
-11,5
11,5
-12,0
Cpm
0
1e+6
2e+6
3e+6
4e+6
5e+6
Sampling interval (min)
0,0
-0,5
0,5
-1,0
1,0
-1,5
1,5
-2,0
2,0
-2,5
2,5
-3,0
3,0
-3,5
3,5
-4,0
4,0
-4,5
4,5
-5,0
5,0
-5,5
5,5
-6,0
6,0
-6,5
6,5
-7,0
7,0
-7,6
7,6
-8,0
8,0
-8,6
8,6
-9,1
9,1
-9,6
9,6
-10,1
10,1
-10,6
10,6
-11,0
11,0
-11,6
11,6
-12,0
Cpm
0
1e+6
2e+6
3e+6
4e+6
5e+6
Figure 1: Activity per fraction after UPLC separation. QC samples of the [68Ga]Ga-PSMA-11 patient dose for patients 3 and 4 (fig 15C and D). QC samples were injected onto the UPLC prior to the patient sample.

XLI
QC sample validation III
QC sample validation IV
Sampling interval (min) Cpm
Sampling interval (min) Cpm
0,0-0,5 119,97
0,0-0,5 285,62
0,5-1,0 148,07
0,5-1,0 277,28
1,0-1,5 141,37
1,0-1,5 283,03
1,5-2,0 33768,09
1,5-2,0 3189,79
2,0-2,5 43301,36
2,0-2,5 5883,07
2,5-3,0 19632,91
2,5-3,0 9078,10
3,0-3,5 12218,26
3,0-3,5 9358,61
3,5-4,0 18952,56
3,5-4,0 9612,22
4,0-4,5 36449,74
4,0-4,5 18001,55
4,5-5,0 11852,54
4,5-5,0 11530,65
5,0-5,5 13274,79
5,0-5,5 10190,38
5,5-6,0 22219,48
5,5-6,0 11433,17
6,0-6,5 53572,93
6,0-6,5 16668,34
6,5-7,0 397687,38
6,5-7,0 133176,99
7,0-7,5 109202,61
7,0-7,6 132629,53
7,5-8,0 3726273,69
7,6-8,0 2787675,17
8,0-8,5 4598969,70
8,0-8,6 4374473,67
8,5-9,0 177201,56
8,6-9,1 359493,06
9,0-9,5 46264,38
9,1-9,6 131986,58
9,5-10,0 19651,95
9,6-10,1 77051,91
10,0-10,5 12583,81
10,1-10,6 54745,81
10,5-11,0 7705,52
10,6-11,0 33355,89
11,0-11,5 6543,05
11,0-11,6 39121,57
11,5-12,0 4247,33
11,6-12,0 25434,73
Additional samples QC IV
Sample Cpm
Empty 550,57
Blanc 886,12
QC 50ul 952385,63
QC 50ul 950505,59
QC 50ul 894302,67
Empty (stop tray) 803,61
Empty (stop tray) 57,87
Empty (stop tray) 67,85
Empty (stop tray) 73,06
Empty (stop tray) 63,64

XLII
AU
0,00
1,00
2,00
3,00
Minutes
0,00 0,50 1,00 1,50 2,00 2,50 3,00 3,50 4,00 4,50 5,00 5,50 6,00 6,50 7,00 7,50 8,00 8,50 9,00 9,50 10,00 10,50 11,00 11,50 12,00
mV
0,00
50,00
100,00
150,00
Minutes
0,00 0,50 1,00 1,50 2,00 2,50 3,00 3,50 4,00 4,50 5,00 5,50 6,00 6,50 7,00 7,50 8,00 8,50 9,00 9,50 10,00 10,50 11,00 11,50
Figure 2: UPLC chromatograms of the [68Ga]Ga-PSMA-11 QC for patient 3. UV chromatogram (upper figure) and online activity chromatogram (lower figure).
AU
0,00
0,50
1,00
1,50
2,00
Minutes
0,00 0,50 1,00 1,50 2,00 2,50 3,00 3,50 4,00 4,50 5,00 5,50 6,00 6,50 7,00 7,50 8,00 8,50 9,00 9,50 10,00 10,50 11,00 11,50 12,00
mV
50,00
100,00
150,00
200,00
Minutes
0,00 0,50 1,00 1,50 2,00 2,50 3,00 3,50 4,00 4,50 5,00 5,50 6,00 6,50 7,00 7,50 8,00 8,50 9,00 9,50 10,00 10,50 11,00 11,50
Figure 3: UPLC chromatograms of the [68Ga]Ga-PSMA-11 QC for patient 4. UV chromatogram (upper figure) and online activity chromatogram (lower figure).
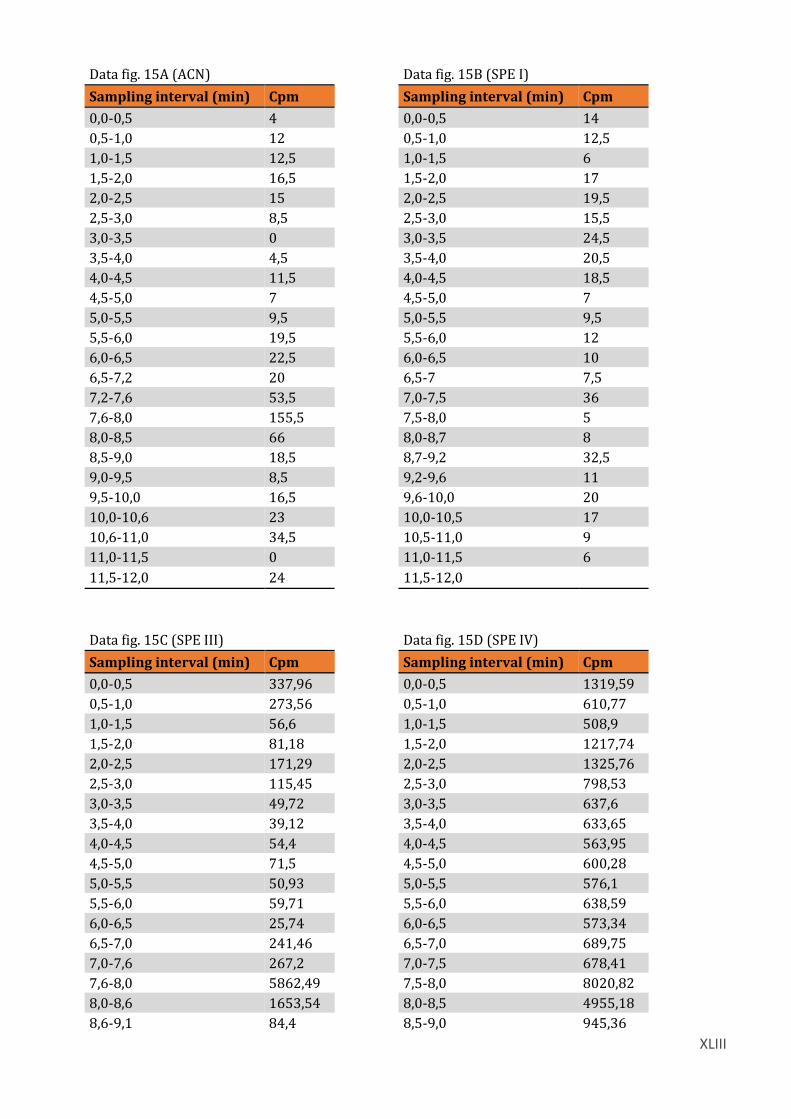
XLIII
Data fig. 15A (ACN) Data fig. 15B (SPE I)
Sampling interval (min) Cpm
Sampling interval (min) Cpm
0,0-0,5 4
0,0-0,5 14
0,5-1,0 12
0,5-1,0 12,5
1,0-1,5 12,5
1,0-1,5 6
1,5-2,0 16,5
1,5-2,0 17
2,0-2,5 15
2,0-2,5 19,5
2,5-3,0 8,5
2,5-3,0 15,5
3,0-3,5 0
3,0-3,5 24,5
3,5-4,0 4,5
3,5-4,0 20,5
4,0-4,5 11,5
4,0-4,5 18,5
4,5-5,0 7
4,5-5,0 7
5,0-5,5 9,5
5,0-5,5 9,5
5,5-6,0 19,5
5,5-6,0 12
6,0-6,5 22,5
6,0-6,5 10
6,5-7,2 20
6,5-7 7,5
7,2-7,6 53,5
7,0-7,5 36
7,6-8,0 155,5
7,5-8,0 5
8,0-8,5 66
8,0-8,7 8
8,5-9,0 18,5
8,7-9,2 32,5
9,0-9,5 8,5
9,2-9,6 11
9,5-10,0 16,5
9,6-10,0 20
10,0-10,6 23
10,0-10,5 17
10,6-11,0 34,5
10,5-11,0 9
11,0-11,5 0
11,0-11,5 6
11,5-12,0 24
11,5-12,0
Data fig. 15C (SPE III) Data fig. 15D (SPE IV)
Sampling interval (min) Cpm
Sampling interval (min) Cpm
0,0-0,5 337,96
0,0-0,5 1319,59
0,5-1,0 273,56
0,5-1,0 610,77
1,0-1,5 56,6
1,0-1,5 508,9
1,5-2,0 81,18
1,5-2,0 1217,74
2,0-2,5 171,29
2,0-2,5 1325,76
2,5-3,0 115,45
2,5-3,0 798,53
3,0-3,5 49,72
3,0-3,5 637,6
3,5-4,0 39,12
3,5-4,0 633,65
4,0-4,5 54,4
4,0-4,5 563,95
4,5-5,0 71,5
4,5-5,0 600,28
5,0-5,5 50,93
5,0-5,5 576,1
5,5-6,0 59,71
5,5-6,0 638,59
6,0-6,5 25,74
6,0-6,5 573,34
6,5-7,0 241,46
6,5-7,0 689,75
7,0-7,6 267,2
7,0-7,5 678,41
7,6-8,0 5862,49
7,5-8,0 8020,82
8,0-8,6 1653,54
8,0-8,5 4955,18
8,6-9,1 84,4
8,5-9,0 945,36

XLIV
9,1-9,5 99,98
9,0-9,6 879,06
9,5-10 76,72
9,6-10,0 730,15
10,0-10,5 81,65
10,0-10,6 809,85
10,5-11,0 59,31
10,6-11,1 574,24
11,0-11,5 73,28
11,1-11,5 681,61
11,5-12,0 78,27
11,5-12,0 543,41

XLV
Appendix XII: LC/MS-TOF calibration data with natGa-PSMA-11
Fig. 1: LC/MS chromatograms from the Ga-PSMA-11 calibration standards (duplo I, 1,0 mg/ml, 10,0 μg/ml and 0,1 μg/ml standards ). The chromatograms are shown in decreasing amounts of natGa-PSMA-11 injected, seen from the upper chromatogram.
Fig. 2: LC/MS chromatograms from the Ga-PSMA-11 calibration standards (duplo II, 1,0 mg/ml, 10,0 μg/ml and 0,1 μg/ml standards ). The chromatograms are shown in decreasing amounts of natGa-PSMA-11 injected, seen from the upper chroma-togram.

XLVI
Fig. 3: LC/MS chromatograms (1+ ion scan, m/z 1013,327) from the 1,0 mg/ml, 0,1 mg/ml, 0,01 mg/ml and 0,001 mg/ml natGa-PSMA-11 calibration standards.
Fig. 4: LC/MS chromatograms (2+ ion scan, m/z 507,1625) from the 1,0 mg/ml, 0,1 mg/ml, 0,01 mg/ml and 0,001 mg/ml Ga-PSMA-11 calibration standards.

XLVII
Fig. 5: LC/MS UV-chromatograms from the 1,0 mg/ml, 0,1 mg/ml, 0,01 mg/ml and 0,001 mg/ml Ga-PSMA-11 cali-bration standards.