new bedford, extent of contamination report: conrail railyard · sdms docid 000226964 extent of...
TRANSCRIPT

SDMS DocID 000226964
Extent of Contamination ReportCONRAIL RAILYARD
New Bedford, Massachusetts
Prepared byGeorge R. PrinceRoyal J. Nadeau
Environmental Response BranchHazardous Response Support DivisionU.S. Environmental Protection Agency

I. INTRODUCTION
The Environmental Response Team was requested by Region 1 Enforcementpersonnel to perform an on-s1te investigation of the Conrail Railyard,New Bedford, Massachusetts to determine migration patterns of polychlorinatedbiphenyls (PCBs) spilled during off loading and transfer operations.The Investigation Involved sampling surface and subsurface soils, groundwater and sediments from storm water catch basins and adjacent tidalditches.
II. SITE DESCRIPTION
The Conrail railyard is located 1n the City of New Bedford on thewest bank of the Acushnet River estuary. The site lies between Route 18and Herman Melville Boulevard and 1s bordered on the north by activecommercial businesses. Former employees Indicate that spillage of PCB'sfrequently occurred in the northern portion of the site during the transferof transformer oils from tank cars to drums or tank trucks. This areabetween the rail spurs is paved with cobblestones and is used for customerand employee parking by local businesses. Since public access to thiscontaminated area is unrestricted, it is often used by the local populaceas a "short-cut" and pets also frequent this area.
The site is flat with an underlying soil of high permeability gravelsand sands. There are several shallow depressions on-site in which rainwaterponds briefly prior to percolation into the groundwater. Ground water isshallow with a depth of three to four feet in the area of major spillage.,A man-made culvert or swale forms the northern site boundary and dischargesinto a tidal ditch which empties into the Acushnet River. This culvertprimarily diverts runoff from off-site areas directly to the river.There is no visible evidence indicating that surface water runoff fromthe site enters this culvert. Two other surface water diversion pipespass beneath the site and discharge into their respective tidal ditchesoff-site.
III. SAMPLING LOCATIONS
Figure 1 is a map depicting the type and location of samples collectedby the Environmental Response Team. The multi-media study conducted inJanuary 1986 included samples of surface water, groundwater, soils andsediments. Specific ERT sampling locations were selected to determinethe possible pathways that PCB's could have migrated from the site.
Data from two previous studies authorized by EPA Region I removaland remedial groups were reviewed to minimize any duplication of samplingefforts. ERT site reconnaissance located drainage ditches, storm watercatch basins and outfalls which became the focal points of ERT's samplingeffort.

Surface soil sampling locations were chosen to further define thelateral migration of PCB's from the spill areas. The surface samplingeffort was expanded to determine 1f other PCB spills or broader migrationof PCB's had occurred 1n other areas of the railyard.
Soil samples were collected up to four feet deep in known contaminatedareas to evaluate the potential for vertical migration of PCB's throughthe soil strata. Shallow groundwater samples were also collected 1npotentially contaminated areas to evaluate the partitioning of PCB'sbetween groundwater and soil.
A background surface sample was collected up-gradient and north ofthe site in a visibly non-contaminated area.
IV. COLLECTION METHODOLOGY
Surface water samples were collected by Immersing two 1 liter laboratorycleaned sample bottles just below the surface, filling completely withoutany air space, capping with a Teflon lined cap and labeled. Separate watersamples for salinity determination were collected in the tidal ditches.
Groundwater samples were collected by immersing laboratory cleanedsample bottles in hand dug pits or auger holes. One-liter sample bottleswere then filled, labeled, and capped with Teflon lined caps.
All soil and sediment samples were placed in laboratory cleaned 12 ozjars using a clean stainless steel scoop. The jars were capped withTefon lined caps and labeled. Hand augers were used to collect subsurfacesoil samples. The entire auger system was thoroughly scrubbed and washedwith a methanol-water solution between sampling locations.
Field data sheets and chain of custody were maintained for all thesamples. All samples were labeled with numbers from ERT field data sheets,and transported in coolers with ice packs to maintain temperature at4°c.
Water samples for oil and grease analysis were fixed with sulfuricacid to a pH of 2.
V. ANALYTICAL METHODOLOGY
Oil and Grease
Each water sample was poured into a graduated cylinder and the volunewas recorded. The sample was then poured into a separatory funnel andextracted with Freon according to Method 502A of Standards Methods for theExamination of Water and Wastewater, 14th Edition (1975). The Freonextracts were analyzed using a Perkin-Elmer Model 283 Infrared Spectrometerwith an detection limit of 10 ug/ml.

A stock solution containing 37.5% iso-octane, 37.5% hexadecane and25% benzene was prepared and used as calibration standard. The sampleswere quantified by comparing the standard response (absorbance) of the 50.5ppm standard to the sample response (absorbance) and adjusting for sanplevolume and dilution factors.
Soil samples were stirred thoroughly to attain homogeneity. Approximately 50 grams of each soil sample was air dried 1n a hood overnight.A ten gram portion was weighed Into a 100 ml crimp top bottle and 100 mlof Freon added. The bottles were shaken for 20 minutes at 350 rpm,filtered and analyzed on the Perkin-Elmer Model 283 Infrared Spectrometer.The method detection limit was approximately 100 ug/g.
The concentration of oil and grease was calculated by comparing thesample response to a 50.5 ppm standard response.
Oil Fingerprinting
Oil fingerprinting was performed to determine if the oil and greasein the ground water was from the PCB laden oil percolating through thesoil into the water below. Two groundwater samples and one oil/PCBcontaminated soil were extracted for oil and grease then fingerprintedon the Gas Chromatograph.
Two of the tidal ditch surface water samples were extracted andfingerprinted along with a No. 2 fuel oil.
The extracts from the above samples were condensed and analyzed byflame-ionization detector-gas chromatography.
Polychlorinated biphenyls
Water samples were extracted in accordance with the methodologyoutlined in "Rapid Quantification of PCB's in Water by Gas ChromatographicAnalysis" which involves spinning 500 ml of each sample with 20 ml ofhexane for 30 minutes, then concentrating the extract to .5 ml usingnitrogen while heating in a water bath at 50 degrees centigrade. Soiland sediment samples were extracted by shaking approximately 10 g ofdried sample with 20 ml hexane for 30 minutes. A 400 ul portion of theextract was cleaned by injection onto a silica Sep-Pak and eluted with4.6 ml hexane.
Sample extracts were analyzed using two Shimadzu GC-9A gas chronographsutilizing the Ni63 ECD detector each equipped with a 6 meter Shimadzucolumn with 1.5% SP-2250/1.95% SP-2401 on 100/120 Supelcoport packing.Samples showing masking interferences were analyzed using a Supelco SiPB-5fused quartz capillary column, 30 meters X 0.25 mm ID on 0.25 urn film.The method detection limit is approximately .025 ug PCB per liter for waterand .05 ug/g for soils and sediments.
A five point calibration range from 25 to 500 ppb was prepared usingSupelco Aroclor 1254 standard.
V. RESULTS
A summary of ERT's analytical results for all environmental mediasampled 1s presented 1n Table 1. Complete analytical results, Includingresults for specific PCB arochlors, are displayed 1n Table 2.
Results from previous studies conducted by Region I are Included inreports attached 1n Appendix I. The results of these studies were incorporated Into the contour maps which depict the extent of PCB contamination1n the transfer area.
VI. DISCUSSION
Figure 2 shows the concentration of PCB's found by ERT to be presentin surface soils and sediments throughout the railyard and in adjacentoff-site areas. PCB concentrations dropped rapidly as the survey movedaway from the highly contaminated area described above. A general background concentration of one to two parts per million was present in themajority of the railyard.
Residual levels of PCB's at the above levels are not uncommon inrailyards. The relatively uniform concentrations of low-level PCB'sfound are indicative of contamination by windblown soil.
Slightly higher (2 - 2.8 ppm) concentrations of PCB's were found insediments from the tidal ditches. The occurence of sediments with elevatedconcentrations of PCBs in the Acushnet River Estuary is well documented.Deposition of sediments, by tidal action, from highly contaminated areasupriver are the most likely source of PCB's present in the tidal ditches.
Highly Contaminated Areas
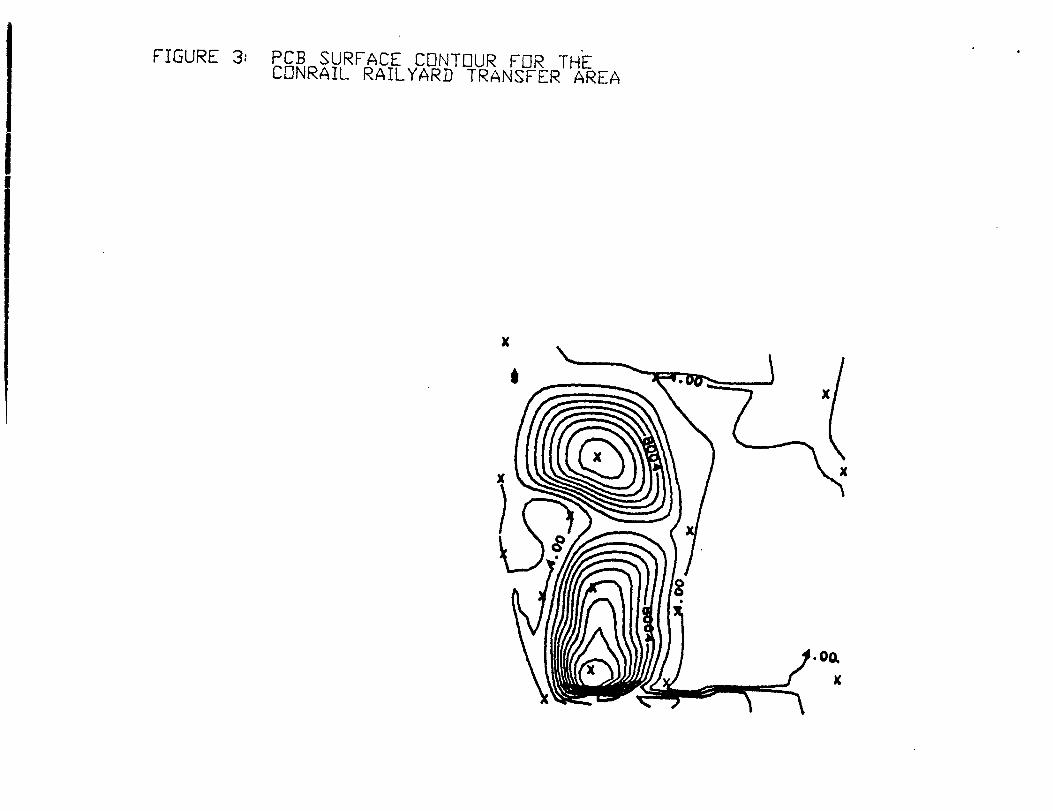
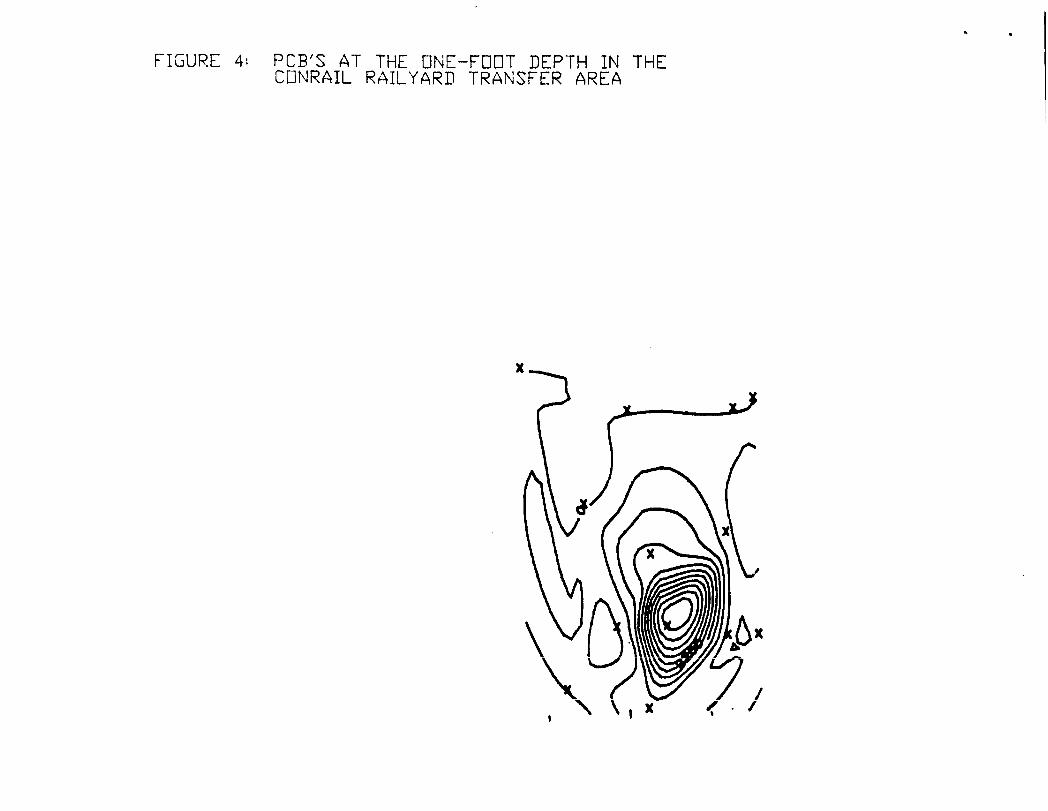
The northern part (location of reported spills) is contaminated moreextensively than originally indicated by the NUS-FIT report. Combiningresults from the NUS-FIT report, Region 1 ESD report and ERT samplingeffort, we generated an extent of surface soil contamination map using acomputer model (CONTURr) that performs smoothed contouring of data(Figure 3). The map produced indicates distinct hot spots in the areawhere PCBs were unloaded. Using results from a sampling effort conductedby Region 1 ESD in August 1985 and this study, we generated an extent ofsoil contamination map at the one foot depth level (Figure 4).
Although the one foot level depth hot spot is not directly associatedwith the surface contamination, it is proximal enough to be associatedwith the spill area. The composite depictions of data from all threestudies conducted at conrail, indicate that spills occured over a broader
area than originally suspected. The major spillage was still confinedto the northern portion of the site. Obviously some transfer areas hadmore spills than others.
Vertical Migration of PCB's
The level terrain of the Conrall site and the high permeability ofsite-soils led ERT's Investigative team to believe that vertical transportof PCBs through the soils could be occurlng. This would be particularlytrue 1n the spill areas, where the oil may have enhanced PCB transportthrough cosolubUHy. To Investigate this possibility, ERT augeredthree holes through soils 1n the area of suspected contamination (Figure 1).Discrete soil samples were collected at the surface, at one, three, andfour foot depths. Saturated soils were encountered between 3.5 - 4.0feet below the grounds surface 1n this area.
None of the core stations showed any significant downward migrationof PCB's, despite surface soil concentrations of 18.4, 41.9, and 7.5ppm. However, as discussed below, close examination of groundwater andfilterable suspended solids did reveal the presence of low level PCBcontamination.
Groundwater
Soil auger holes were used to collect groundwater samples from threeto four feet below the grounds surface. Groundwater samples collectedfrom the unscreened auger holes contained significant amounts of suspendedsoil fines. In the laboratory, groundwater was filtered through a 20 to25 micron retentive filter which removed the soil fines. Groundwaterand soil fines were then extracted and analyzed for PCB.
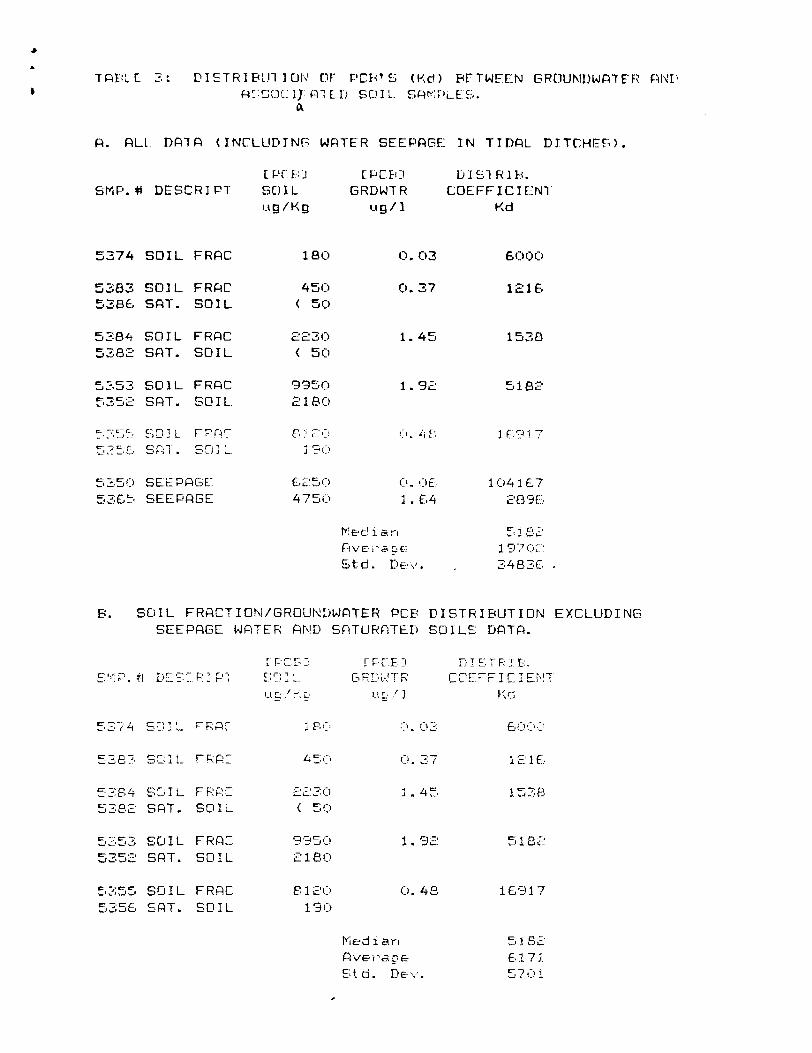
Table 3A shows the concentrations of PCB's found in groundwater samplesand associated filtered or unfiltered soil samples. While the bulk soilsamples collected from auger buckets taken just below the water tabledid not show 50 ppb of PCB, the filtered soil fines and groundwater didhave detectable PCB concentrations.
In this gravelly sand, the majority of the soil mass is in the largersoil grain sizes. Our results indicate that a much smaller fraction ofthe total weight of PCB's is in larger grass soil fraction. This tendencyfor PCB's to accumulate in fine suspended particulates was also noted inERT's Acushnet River Tidal Study conducted at the Coggeshall Bridge InJanuary 1983.
This phenomena is important when considering the transport of PCB'sin the environment. Smaller particulates, which contain higher concentrationsof PCB's, are more susceptible to movement by wind or surface water. Ina gravelly sand such as the one present at Conrail, some movement of finescan also be expected vertically through the soil matrix with the percolationof rainwater.

PCBs dissolved in oils, or 1n lower concentrations 1n percolatingwater, may have moved through the overburden to groundwater table. Theo1ls/PCBs affinity for soil fines resulted 1n elevated concentrations ofPCB's 1n this soil fraction within the saturated zone. Non-detectablelevels above this depth were more likely due to the particle size ofsamples analyzed than to actual differences 1n PCB concentration betweenlayers.
Table 3A and 3B also show the distribution of PCB's between the groundwater and filtered soil fines. The median soll/groundwater distributioncoefficient (Kd) for both data sets is 5182. On this basis, concentrationsof PCB's 1n soil fines can be expected to be approximately 5000 times thePCB concentration found in the groundwater.
Due to the low solubility of PCB 1n water, only a very small concentrations (.03 - 1.64 ppb) of PCB have been detected in groundwater atthe site. The rate of groundwater discharge to the Acushnet River hasnot been determined, hence total PCB loading from this source has notbeen calculated. However, given the existing levels of PCB present inthe Acushnet River Estuary, any groundwater discharges to the River fromthis source would be expected to have minimal additional adverse impacton the aquatic ecosystem.
VII. RECOMMENDATIONS
The entire railyard is in a state of disrepair and abandonment. Theperimeter is not secure. Trepassing is a common occurrence. While wewere on-site, motor bikers were riding throughout the site. The northernarea is freguented by workers and shoppers who park their cars on-sitewithin 25 feet of the one of the more grossly contaminated spill areas.
Our experience with sites like Conrail, having high levels of PCBs,is that direct contact is the most likely route for humans to be exposedto the contaminated soils and vapors. Exposure is particularly crucialduring the summer months when rising temperatures and dry conditionsrespectively enhance vaporization and air-borne particulate transport.If a removal is deemed appropriate, it should focus on the northern areawhere the highest levels of PCB's are found.
The data also indicate a strong association between the presence ofPCBs and oil and grease. A regression analysis of the PCB versus the oiland grease levels in the spill area indicate a good positive correlationbetween these two parameters (r = .89, slope = 18.39, y intercept = -52.46),For future removal operations, oil and grease analyses may serve as asurrogate for PCB analyses in the northern area or other specific locationswhere oil and grease/PCB ratios can be derived. Oil and grease analysesare considerably more economical and can be performed quicker thanPCBs.
REFERENCES
1. NUS FIT Team Draft Report 1985, Conrail Railyard Draft Site InvestigationReport.
2. Tordoff, David W., 1985, Memorandum to file Conrail Railyard Report,U.S. EPA, Region I, Emergency Services Division.
3. Enviresponse Inc., 1986, Conrail Railyard Site Report, January 29,1986.
4. In-situ, Inc., 1984, Contur* In-s1tu Inc., Laramie, WY, 82070.

11 1 II I I 1 1 U44
HI ! 14444444 I I I 111 I U
444

AC
US
HN
ET
RIV
ER
en
c
70
m
GJ
01)
an
-riC
j -3 PI
Ld
Ldu
LL.|
n<r
CJO
0.0
u
Qi
U
LD
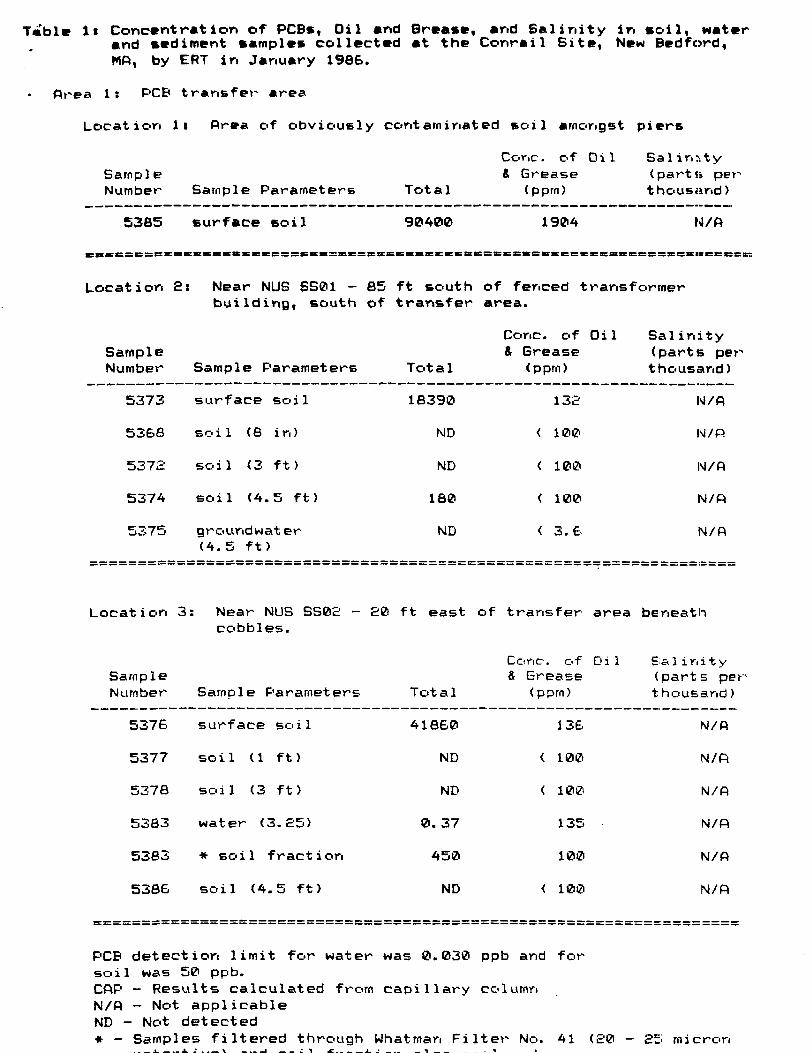
T*'ble It Concentration of PCB«, Oil and Grease, and Salinity in coil, waterand sediment cample* collected at the Conrail Site, New Bedford,MA, by ERT in January 1986.
Area 1: PCB transfer area
Location 1: Area of obviously contaminated soil amongst piers
Cone, of Oil SalinitySarnple & Grease (parts perNumber Sample Parameters Total (pprn) thousand)
53B5 surface eoil 90400 1904 N/A
Locat ion £: Near NUS SS01 -85 ft south of fenced transformerbuilding, south of transfer area.
Cone, of Oil SalinitySample & Grease (partis perNumber Sample Parameters Total (pprn) thousand)
5373 surface soil 18390 135 N/A
5368 soil (8 in) ND < 100 N/O
537£' soil (3 ft) ND ( 100 N/A
5374 soil (4.5 ft) 180 ( 100 N/ft
5375 groundwat er ND < 3.6 IM/A(4.5 ft)
Locat ion 3: Near NUS SS0£ - £0 ft east of transfer area beneathcobbles.
Cone, of Oil £a]initvSample & Grease (parts penNumber Sample Parameters Total (p prn ) thousand)
5376 surface soil 41860 136 N/A
5377 soil (1 ft) ND < 100 N/ft
5378 soil (3 ft) ND < 100 N/A
5383 water (3. £5) 0. 37 135 N/R
5383 * soil fraction 450 100 N/A
5386 soil (4.5 ft) ND ( 100 IM/fi
PCB detection limit for water was 0.030 ppb and forsoil was 50 ppb.CAP - Results calculated ft^c-m capillary columnN/A - Not applicableND - Not detected* - Samples filtered through Whatman Filter No. 41 (£0 - £5 micron
Twble li Continued*
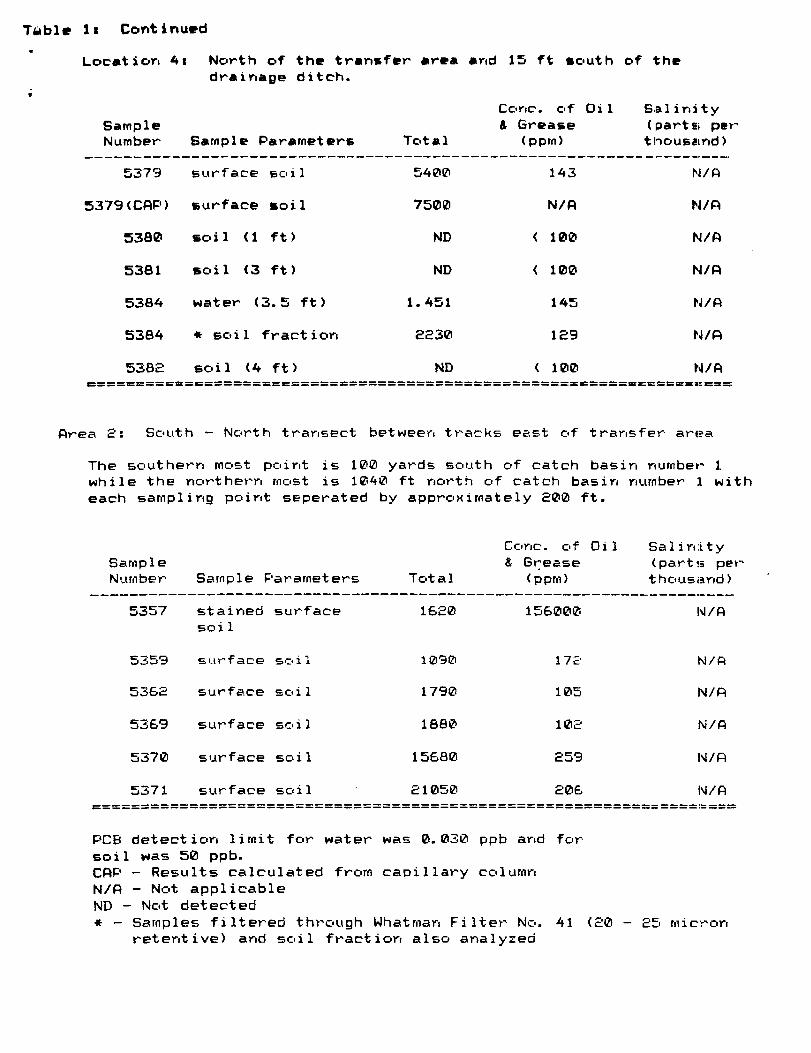
Location 4i North of the transfer area and 15 ft south of 'thedrainage ditch.
Cone, of Oil Sal ini tySample & Grease (parts pet-Number Sample Parameters Total (pprn) thousaind)
5379 surface soi1 5400 143 N/ft
5379 (CftP) surface soil 7500 N/ft N/ft
5380 soil (1 ft) ND < 100 N/ft
5381 soil (3 ft) ND < 100 N/ft
5384 water (3.5 ft) 1.451 145 N/ft
5384 * soil fraction ££30 1£9 N/ft
53B£ soil (4 ft) ND < 100 N/fte====================================== ===================:==== ==:====;
ftrea £: South — North transect between tracks east of transfer area
The southern most point is 100 yards south of catch basin number 1while the northern most is 1040 ft north of catch basin number 'I witheach sampling point seperated by approximately £00 ft.
Cone, of Oil SalinitySample & Grease (parts perNumber Sample Parameters Total (pprn) thousand)
5357 stai ned surface 16£0 156000 N/ftSOI1
5359 surface SOI 1 1090 17c N/ft
536£ surface SOI1 1790 105 N/R
5369 surface SOI1 1880 10£ N/ft
5370 surface SOI1 15680 £59 !M/ft
5371 surface SOI1 £1050 £06 N/ft
PCB detection limit for water was 0.030 ppb and forsoil was 50 ppb.CftP - Results calculated from capillary columnN/fl - Not applicableND - Not detected* - Samples filtered through Whatman Filter No. 41 (£0 - £5 micron
retentive) and soil fraction also analyzed

T*ble li Continued r
Area 3: Catch basins and manholes.
Location 1: Catch basin number 1
Cone, of Oil Sal ini tySample & Grease (parts perNumber Sample Parameters Total (pprn) thousand)
5351 soi1 (0.5 ft) 2170 14400.00 N/ft
5352 soi1 (1 ft) 21B0 12600.005352( C«P> 2100
5353 orourid water 1.92 6. 85 N/ft(3. 1 ft)
5353 * soil fraction 9950 20100 M/ft
==:= s=s===s ==sss===ss=:=sr=rsE:=s===
Location 2: Catch basin 2
Cone, of Oil S<^ 11n11 ySample 8 Grease (parts per-Number Sample Parameters Total (pprn) thousand)
groundwater 0. 484 4. 65 M/ft(3.0 ft)
5355 * soil fraction 8120 N/ft N/fl
5356 soil 190 378.00 M/fi110 N/A N/fi
Location 3: Rail car turn—around
Cone, of Oil SalinitySample & Grease (parts, perNumber Sample Pararnet ers Total (pPTl) t tousand)
5366 around water e. 117 < 1 . 00 N/fts.e ft)
5367 ground water ND ( 1. 00 N/ft(6.2 ft)
PCB detection limit for water was 0.030 ppb and forsoil was 50 ppb.COP - Results calculated from capillary columnN/ft - Not applicableND - Not detected* - Samples filtered through Whatman Filter No. 41 (20 - 25 micron
retentive) and soil fraction also analyzed

i
Tfrble 1* Continued
Area A: Tidal ditch*&
Location i r Southern most drainage culvert (# 1)
Sample Number Sample Parameters Total
5346 culvert discharge ND water
5347 surface soil £050
5348 surface soil £200
5349 surface water < 0.030
5350 seepage water 0.059
535® (CAP) * soil fraction 6250
535B seepage water N/ft
5360 culvert discharge N/ft water
53£1 seepage water N/fl
Location 2:
SampleNumber
5363
5364
5365
5365 (CftP)
Central Tidal Ditch (# 2)
Sample Parameters
culvert dischargewatersoil (0.5 ft)
seepage water
* soil fraction
Total
ND
2560
1.64
4750
Cone, of Oil& Grease
(pprn)
34.2
£34
604
1.71
< 1.05
N/ft
N/ft
N/ft
N/ft
Cone, of Oil& Grease
(pprn)
27.80
£390
3. £0
N/ft
ftrea 5: Background Sample upgradient and north of siteCone, of Oil
Sample 8 GreaseNumber Sample Parameters Total (pprn)
5387 surface soil 380 201
PCB detection limit for water was 0.030 ppb and forsoil was 50 ppb.CftP - Results calculated from caoillary columnN/ft - Not applicableND - Not detected
Sal ini ty(partt pert housetnd)
4.00
N/ft
£0.45
N/ft
N/O
N/ft
16. 6®
4.00
£3.49
Salinity(parts perthousand)
N/ft
N/ft
N/fi
N/ft
Salinity (parts, per* thousand)
N/ft
# - Samples filtered through Whatman Filter No. 41 (20 - £5 micronretentive) and soil fraction also anA 1 v?ori
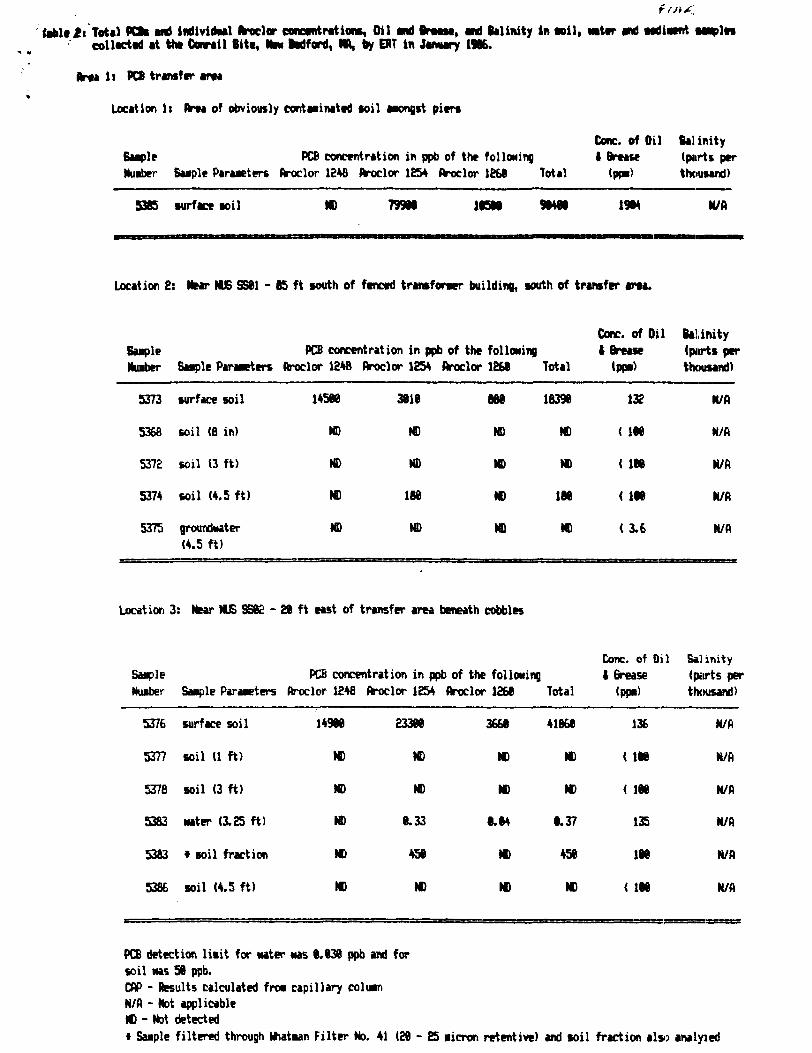
fatlt ft Total PCts Mi individual Aroclor concentration*, Oil and BTMM, and Salinity in nil, water and midiment Maples collactid at the Conrail Bitt, MM Mford, HA, by EFT in January 1966.
Area li PCS transfer art*
Location li Ana of obviously contaminated toil amongst piers
Cone, of Oil Salinity Sample PCB concentration in ppb of the folloMing I Breate (piirtc per Nuiber Sample Parameters Aroclor 1246 Aroclor 1254 Aroclor 1266 Total (ppm) thousand)
5385 surface toil ND 799N inn 1384 N/A
Location 2: Near NUS SS81 - 85 ft south of fenced transforwr building, wuth of transfer area.
Cone, of Oil BaUnity Gaiple PCB concentration in ppb of the following I Breaie (parts per Huiber Sample Parawters Aroclor 1246 Aroclor 1254 Aroclor 1268 Total (ppi) thousand)
5373 surface soil 14500 3818 668 18398 132 N/A
5366 soil (8 in) 1C ND ND ND < 188 N/A
5372 soil (3 ft) ND ND ND ND ( 188 N/A
5374 soil (4.5 ft) ND 188 ND 188 < 188 N/A
5375 groundwter ND ND ND ND < 3.6 N/A (4.5 ft)
Location 3: tear NUS S582 - 28 ft east of transfer area beneath cobbles
Cone, of Oil Bal initySaiple PCB concentration in ppb of the following 1 Grease (pitrts perNumber Saaple ParaKters Aroclor 1248 Aroclor 1254 Aroclor 1268 Total (pp.) thousand)
5376 surface soil 14980 23380 3668 41868 136 N/A
5377 soil (1 ft) ND ND ND ND < 188 N/A
5378 soil (3 ft) ND ND ND ND ( 188 N/A
5383 Mater (3.25 ft) ND 8.33 8.84 8.37 135 N/A
53B3 * soil fraction ND 458 ND 458 188 N/A
5386 soil (4.5 ft) ND ND ND ND < 188 N/A
PCB detection liait for water was 6.838 ppb and forsoil Has 58 ppb.CAP - Results calculated froa capillary eoluvnN/A - Not applicableNO - Hot detected* Saiple filtered through Whatman Filter No. 41 (28-25 micron retentive) and soil fraction also analysed

Gontinuri
Location 4i North of the irmfrr «TM ml IS ft mouth of tht mVtinmge ditch
Cone, of Oil Salinity Sample KB concentration in ppb of the folloMing I Breast (pcrti per Number Sample Parameter* Aroclor 1248 Aroclor 1254 Aroclor IBM Total (pom) thousand)
5379 surface soil 2450 2390 560 5400 143 N/A
5379 (CAP) •urface soil 3840 2690 970 7580 N/A N/A
5380 •oil (1 ft) ND ND ND ND < IN N/A
5381 •oil (3 ft) ND ND ND ND ( IN N/A
5384 water (3.5 ft) 1,92 1.44 •.891 1.451 145 N/A
5384 t soil fraction 1390 710 130 2230 129 N/A
5382 •oil (4 ft) ND ND ND ND ( IN N/A
Area 2: South - North transect between tracks east of transfer area
The southern most point is IN yards south of catch basin number 1 while the northern most is 1040 ft northof catch basin number 1 Nith each sampling point seperated by approximately 200 ft.
Cone, of Oil SalinitySample PCB concentration in ppb of the following t Brease (parts perNumber Sample Parameters Aroclor 124B 'Aroclor 1254 Aroclor 1260 Total (ppm) thousand)
5357 stained surface ND 1380 240 1620 1560N N/Asoil
5359 surface soil ND 850 240 1090 172 M/ft
5362 surface soil 890 658 250 1790 185 N/ft
5369 surface soil 1360 380 140 1880 102 N/A
5370 surface soil 11300 3260 1128 15680 259 N/ft
5371 surface soil 10708 7890 2460 21050 206 N/A
PC£ detection limit for Mater was 0.038 ppb and forsoil MBS 50 ppb.CAP - Results calculated from capillary column N/ft - Not applicable ND - Not detectedt Sample filtered through Uhatman Filter ND. 41 (20-25 micron retentive) and soil fraction also analyzed

Table 2» Continue
Arta 3: Catch basins and Manholes
Location it Catch bMin number 1
Cone, of Oil Salinity Suple PCB concentration in ppb of the foliating I Brtaie (parts per Number Sample Parameters Aroclor 1246 Aroclor 1854 Aroclor 1K8 Total (ppm) thousand)
5351 toil CI.5 ft) ID 1671 9M £171 14488.88 N/A
5352 toil tl ft) ND 1988 888 2188 12688.88 N/A 5352(CAP) ND 1768 340 KM
5353 nrourdnater N> 1.45 1.47 1.92 £.85 N/A (3.1 ft)
5353 t Mil fraction » 7938 2820 9958 28188 N/A
Location 2: Catch basin 2
Cone, of Oil SalinitySuple PCB concentration in ppb of the following 1 Grease (parts perNuiber S-ple Parameters Aroclor 124B Aroclor 1254 Aroclor 1268 Total <PP»> thousand)
5355 groundNater ND 8.36 8.184 8.484 4.65 N/A(3.8 ft)
5355 t soil fraction M> 6188 2828 8128 N/A N/A
5356 soil » 198 ND 198 376.88 N/A5356 (CflP) ND 118 ND 118 N/A N/A
Location 3: Rail car turn-around
Cone, of Oil SalinitySaiple PCB concentration in ppb of the fol lotting t Brease (parts perIkober Suple Parameters Aroclor 1246 Aroclor 1254 Aroclor 1268 Total (pp.) thousand)
5366 ground Mater ND 8.865 8.832 8.117 ( 1.88 N/A(5.2 ft)
5367 ground water ND ND ND ( 8.838 ( 1.88 N/A(6.2ft)
PCB detection liiit for Mater Mas 1.838 ppb and for soil was 58 ppb. CAP - Results calculated fra capillary column N/A - Not applicable KD - Not detected i Suple filtered through Whatman Filter No. 41 (28-25 micron retentive) and soil fraction also analyzixi

•T*lttt Continued
Pro 4t Tidal ditches
Location It Southern «ost drainage culvert (t 1)
Cone, of (hi Salinity Satple PCB concentration in ppb of the folloMing 1 Brease (parts per Nutter Bwple Parameters flroclor 1846 Aroclor 1254 flroclor 1266 Total (pp.) thousand)
5346 culvert discharge ND ND ND ND 34.2 4.10 water
5347 turf ace Mil E34f 511 ND 2851 £34 N/A
534ft surface toil IBM 320 ND £200 604 iEt.45
5349 surface Mater N> < 1.138 ND <B.B30 1.71 N/A
5350 seepage ND 1.159 ND 0,059 < 1.15 N/A
535NCAP} * soil fraction 32M 2390 670 6250 N/A N/A
5356 seepage N/ft N/ft N/A N/fl N/A 116.60
53M culvert discharge N/fl N/R N/A N/A N/A 4.00Mater
5361 seepage N/fi N/ft N/A N/A N/A 23.49
Location 2: Central Tidal Ditch (12)
Cone, of Oil SalinitySacple PCB concentration in ppb of the fol lotting 1 Brease (parts perNuifaer Saaple Paravters Aroclor 1248 Aroclor 1254 flroclor 1260 Total (pp.) thousand)
5363 culvert discharge ND ND ND ND 27.80 N/AMater
5364 soil <«.5 ft) 2039 430 1W 2568 2390 N/fl
5385 seepage ND 1.35 0.23 1.64 3.20 N/A
5365 (CflP) * soil fraction 3460 1020 270 4750 N/A N/A
5: Background Saaple upgradient and north of siteCone, of Oil Salinity
Sample PCB concentration in ppfa of the following t Brease (parts perNmber Sample Parameters flroclor 124B flroclor 1254 flroclor 1268 Total (pg.) thousand)
UM5367 surface soil ND 330 M MM) 201 N/A
PCB detection liiit for Mater Mas 0.039 ppb and for soil Mas 59 ppb. CAP - Results calculated froi capillary coluwi h/fl - Not applicable ND - Not detected « Saiple filtered through Uhatian Filter No. 41 (29-25 licron retentive) and soil fraction also analyzed
TAPLC 3: DIETRIB'Jl I OK1 OF PCM'B <Kd) PF1WFF.N GROUNDWATFR RI\T'ft: COL 1) A1LU SOIL S«KPi_EL..
tX
A. PLl DATA (INCLUDING WATER SEEPAGE IN TIDAL DITCHEM.
LPf E J CPCEO DIET R1H.SMP.fl DESCRIPT SOIL GRDWTR COEFFICIENT
ug/Kg ug/1 Kd
5374 SOIL FRAC 18O O. O3 6 GOO
5383 BOIL FRAC 45O 0.37 1£165386 SAT. BOIL < 5O
5384 BOIL FRAC ££3O 1. 45 1538538£ BAT. SOIL < 50
5353 SOIL FRAC 995O 1. 9£ 518£535£ SAT. SOIL £180
t:LI'1' E-D3L TPf4 3f 957-"C Sf-,1 . SGI
525» SEEPAGE" £.£50 O '!>£ 1O41C753&5 SEEPAGE 4750 1 64
Mec'isnft vei - a p e- 1970,Std. Dt' 34836
B. SOIL FRACTION/GROUKDWATER PCB DISTRIBUTION EXCLUDINGSEEPAGE WATER AND SATURATED SOILS DATA.
t r- rr-,1 CFLE: D I E T R J E . c;rj T C'FI.,.'-rR rCT—ICIEr 1 UL, "-'E UL '] Kr;
53T4 SOIL 180 "'. O3 6f"1ll' I'
536" SC..1L 45,-, 0. 27 lc If
££30 1.45 1538 53S£ SAT. SOI^ < 50
5L53 SOIL FRAC 9550 1.9£ 518£ 535£ EAT. SOIL £18O
5355 SOIL FRQC 8 1 £O O. 48 16917 5356 SAT. SOIL 190
51 8£ 617J
t d . D e v . 5701