neutrons from piezonuclear reactions - fondation louis de...
TRANSCRIPT

Annales de la Fondation Louis de Broglie, Volume 34 no 2, 2009 183
Neutrons from Piezonuclear Reactions
Fabio Cardone 1, Giovanni Cherubini 2,3, Roberto Mignani 4,5,Walter Perconti 1, Andrea Petrucci 1, Francesca Rosetto 6
and Guido Spera 7
1Istituto per lo Studio dei Materiali Nanostrutturati (ISMN — CNR)Via dei Taurini - 00185 Roma, Italy
2ARPA Radiation Laboratories Via Montezebio - 01100 Viterbo, Italy3 Facolta di Medicina, Universita degli Studi “La Sapienza”
P.le A. Moro, 2 - 00185 Roma, Italy4GNFM, Istituto Nazionale di Alta Matematica “F.Severi”
Citta Universitaria, P.le A.Moro 2 - 00185 Roma, Italy5Dipartimento di Fisica “E.Amaldi” , Universita degli Studi “Roma Tre”
Via della Vasca Navale, 84 - 00146 Roma, Italy6ARPA Chemical Laboratories Via Montezebio - 01100 Viterbo, Italy
7CRA - IS.Pa.Ve., Chemical SectionVia C.G. Bertero, 22 - 00156 - Roma, Italy
ABSTRACT. We report the results obtained by cavitating water so-lutions of iron salts (Fe(Cl)3 and Fe(NO3)3) with different concen-trations at different ultrasound powers. In all cases we detected aneutron radiation well higher than the background level. The neutronproduction is perfectly reproducible and can at some extent be con-trolled. These evidences for neutron emission generated by cavitationsupport some preliminary clues for the possibility of piezonuclear reac-tions (namely nuclear reactions induced by pressure and shock waves)obtained in the last ten years. We have been able for the first time tostate some basic features of such a neutron emission induced by cavi-tation, namely: 1) a marked threshold behavior in power, energy andtime; 2) its apparent occurring without a concomitant production of γradiation.
1 Introduction
Acoustic cavitation of liquids with gas dispersed consists in subjectingthem to elastic waves of suitable power and frequency (in particular toultrasounds) [1, 2]. The main physical phenomena occurring in a cavi-tated liquid (e.g. sonoluminescence [3]) can be accounted for in terms ofa hydrodynamic model based on the formation and the collapse of gas

184 F. Cardone et al.
bubbles in the liquid [1, 2]. Three different experiments on cavitationcarried out in the last years [4, 5, 6] provided evidence for an anomalousproduction of intermediate and high mass number (both stable, unstableand artificial) nuclides within samples of water subjected to cavitation,induced by ultrasounds with 20 KHz frequency. Those results togetherseem to show that ultrasounds and cavitation are able to generate nu-clear phenomena bringing to modifications of the nuclei involved in theprocess. A model able to account for such nuclear reactions induced byhigh pressures (called in this paper piezonuclear reactions), based onthe implosive collapse of the bubbles inside the liquid during cavitation,has been proposed by two of the present authors (F.C. and R.M.) [7].Notice that, in the first experiments that we carried out, proton num-ber was practically conserved, whereas neutron number was apparentlynot [4, 5]. This constitutes an indirect hint of some sort of neutron pro-duction in such cavitation processes. Since, as is well known, nuclearreactions in most cases involve neutron emission, it is a fundamental is-sue to check whether neutrons are produced indeed in processes possiblyinvolving piezonuclear reactions. We point out that some experimentscarried out [8]-[16] in the last years have shown that cavitation of deuter-ated acetone can produce neutrons. In order to shed some light on thisissue of neutron emission during cavitation, in 2004-2006 we carried outsome experiments in which we cavitated controlled solutions of salts inwater at CNR National Laboratories (Rome 1 Area) and Italian ArmedForces technical facilities. We focused our attention on ionising radiationand neutron emission. The details of these experiments are reported inthe following.
2 Experimental Equipment
The employed ultrasonic equipment was the robust ultrasound welderDN20/2000MD by Sonotronic [17]. We slightly modified the piezoelec-tric and the sonotrode configuration in order to provide the equipmentwith a compressed air cooling system which allowed it to work for 90minutes without stopping, at a frequency of 20 KHz. As cavitationchamber, we used a Schott Duran® vessel made of borosilicate glass of250 ml and 500 ml [18]. The truncated conical sonotrode that conveyedultrasounds was made of AISI grade 304 steel. His dimensions (length,long diameter, short diameter) and the dimensions of the threaded stubby which it was screwed on the booster-piezoelectric unit were and haveto be designed in order to match the frequency of the mechanical oscil-

Neutrons from Piezonuclear Reactions 185
lations and reduce as much as possible any reflected power, i.e. in orderto have the maximum ultrasonic power transfer. This adaptive designof the sonotrode is not unique but it is something which has to be donecase by case and strongly depends on the material that the sonotrode ismade of. Of course, once the long and short diameters of the truncatedcone are fixed the length of sonotrode cannot just be determined bymatching the resonance condition, but there is a further constraint to betaken into account. This constraint is the immersion of the sonotrode inthe solution where ultrasounds have to conveyed which has also to allowfor the diameter of the circular aperture of the vessel. We designed itslength in order to have a maximum immersion depth of about 4 cm anda corresponding distance between the sonotrode tip and the bottom ofthe vessel of about 5 cm.
All these geometrical dimensions are crucial to the positive outcomesof the experiments as it will be clear further on. In all the experiments,the cavitated solutions were made of deionized and bidistilled water (18.2MΩ). Measurements of ionizing (α, β and γ) radiation background werecarried out, along with measurements of neutron radiation background.We used three types of detectors of ionizing radiation: geiger counterGamma Scout [19] with a mica window transparent to α, β and γ radi-ation, and provided with two aluminium filters 1 mm and 3 mm thick,to screen α radiation and α and β, respectively; polycarbonate plate de-tectors PDAC CR39 sensitive to ionizing radiation in the energy range40 keV -4 MeV and Tallium (Tl) activated, Sodium Iodine (NaI), γ-rayspectrometer GAMMA 8000 [20].
The radiations α, β and γ, measured in all the cavitation runs, turnedout to be compatible with the background radiation1.A magnetometer was used in order to take under control the local mag-netic field (always found compatible with the local magnetic field ofEarth, measured in absence of cavitation) and along with it possiblecurrents generated by the converting piezoelectric units that might haveaffected the electronics of the geiger counters and of the gamma spec-trometer. Besides, in order to avoid any possible interference through thepower supplying wires and any possible spurious communication amongthe electronic detectors through the ground wire, the only electronicequipment to be connected to the power network was the 20 KHz oscil-lation generator while all the detectors were battery supplied.
1This agrees with the results on the absence of radiation emission in the firstcavitation experiments [4, 5].
186 F. Cardone et al.
Let’s now focus our attention on the technique used to reveal the pos-sible neutron emission that we may expect during cavitation accordingto the results of our previous experiments [4, 5, 6]. The only hint thatwe got from these experiments is the non conservation of the number ofneutrons according to the mass spectrometer analyses. In other words,the only thing that we could expect was a possible neutron emission butabsolutely nothing could be said about its spectrum, its isotropy andhomogeneity in space and its constancy in time which could be the mostvariable in terms of energy space and time. This wide range of possibil-ities convinced us that the first step to be moved in order to ascertainthis hint was just to reveal the presence of neutrons in a sort of a ’yesor no’ detecting procedure and leave a complete and more exhaustingproper measurement to a second higher and more accurate level of in-vestigation grounded on the possible positive answer from this first levelof inquiry. Thus, we made our choice and decided to use neutron pas-sive detectors which are capable of integrating neutron radiation withintheir energy range regardless of the time feature of their emission. Thepassive detectors that we used are called Defenders and are produced byBTI (Bubble Technology Industries)2.
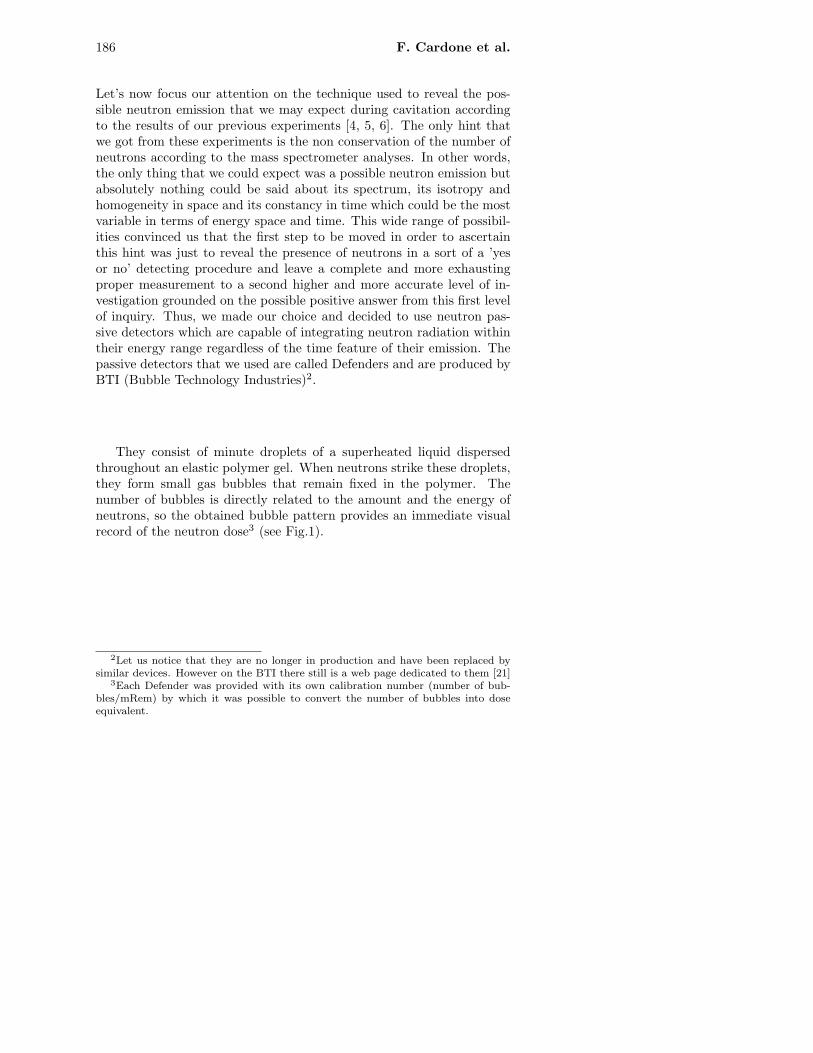
They consist of minute droplets of a superheated liquid dispersedthroughout an elastic polymer gel. When neutrons strike these droplets,they form small gas bubbles that remain fixed in the polymer. Thenumber of bubbles is directly related to the amount and the energy ofneutrons, so the obtained bubble pattern provides an immediate visualrecord of the neutron dose3 (see Fig.1).
2Let us notice that they are no longer in production and have been replaced bysimilar devices. However on the BTI there still is a web page dedicated to them [21]
3Each Defender was provided with its own calibration number (number of bub-bles/mRem) by which it was possible to convert the number of bubbles into doseequivalent.
Neutrons from Piezonuclear Reactions 187
Figure 1: Morphology and distribution of bubbles produced in a Defender by the passage ofneutrons (left); heavy ions (right). In the second picture, the ion beam goes from bottom totop.
passive detectors which are capable of integrating neutron radiation within their energyrange regardless of the time feature of their emission. The passive detectors that we usedare called Defenders and are produced by BTI (Bubble Technology Industries)2.
They consist of minute droplets of a superheated liquid dispersed throughout an elasticpolymer gel. When neutrons strike these droplets, they form small gas bubbles thatremain fixed in the polymer. The number of bubbles is directly related to the amountand the energy of neutrons, so the obtained bubble pattern provides an immediate visualrecord of the neutron dose3, see Fig.1. We will be presenting two sets of experimentsduring which two di!erent kind of bubble detectors were used: Defender and DefenderXL. Their specifications are slightly di!erent and will be reported later on within eachsection describing a specific set of experiments. Before moving on to the presentation ofthe experiments and their results, it is important to stress at this stage some featuresof these passive detectors and state what was done in order to keep them under control.By doing this, we will also show that the whole of neutron measurements of the firstand second investigation can be read as a sequence of control experiments which allowedus to crosscheck by each of them the accuracy of the previous one. The appearance of
2Let us notice that they are no longer in production and have been replaced by similar devices. However onthe BTI there still is a web page dedicated to them [21]
3 Each Defender was provided with its own calibration number (number of bubbles/mRem) by which it waspossible to convert the number of bubbles into dose equivalent.
4
Fig. 1: Morphology and distribution of bubbles produced in a
Defender by the passage of neutrons (left); heavy ions (right). In
the second picture, the ion beam goes from bottom to top.
We will be presenting two sets of experiments during which two dif-ferent kind of bubble detectors were used: Defender and Defender XL.Their specifications are slightly different and will be reported later onwithin each section describing a specific set of experiments. Before mov-ing on to the presentation of the experiments and their results, it isimportant to stress at this stage some features of these passive detectorsand state what was done in order to keep them under control. By do-ing this, we will also show that the whole of neutron measurements ofthe first and second investigation can be read as a sequence of controlexperiments which allowed us to crosscheck by each of them the accu-racy of the previous one. The appearance of bubbles in these detectorscan be brought about by different sources. Since the droplets are in ametastable state they can be affected by heat and mechanical compres-sions, just like ultrasounds. As to the heat, the first thing that has to bestressed is that these detectors are temperature compensated and theircorrect operation is guaranteed in the range from 15°C to 35°C. Besides,the laboratory (a small room) temperature was kept constant at about20°C ± 1°C by a heat pump that could work in reverse mode as well.Of course we monitored by an infrared thermometer the temperature ofthe Defenders all over their body and with particular care on the areanearer to the vessel that became warm during cavitation. The temper-ature of this specific part never exceeded 26°C which is well within the

188 F. Cardone et al.
working temperature guaranteed by the manufacturer. By comparingthe number of bubbles that popped up during each of the experimentsof the first and second investigation, one can unmistakably state thatthey cannot be brought about by heat since all of the temperature in-creases of the solutions treated by ultrasounds in all of the experimentswere always compatible with each other within ±5°C, while the numberof bubbles ranged from less than ten up to 70 depending on the appliedultrasonic power and the concentration of the solutions. Let’s now saysomething about the second possible source of bubbles, i.e. ultrasounds.The minute droplets contained inside the polymer gel are turned intobubbles as they receive the correct amount of energy. Of course thisamount can be conveyed to them by mechanical compressions just likeultrasounds. Despite that, as it will be clearly shown by the outcomespresented in the description of the experiments, ultrasounds cannot beconsidered the cause of the bubbles since the number of bubbles rangedfrom zero up to 70 while the power of ultrasounds, the distance betweenthe vessel and the detector were always the same and being mechanicalvibrations the cause of the bubbles, their number should have alwaysbeen nearly constant.
3 Experimental Results
3.1 First Investigation
Two separate investigations have been carried out. In the first one, wesubjected to cavitation five solutions of pure water and four differentsalts in H2O:
• 250 ml of bidistilled deionised water;
• 250 ml with a concentration of 1 ppm of Iron Chloride FeCl3;
• 250 ml with a concentration of 1 ppm of Aluminium ChlorideAlCl3;
• 250 ml with a concentration of 1 ppm of Lithium Chloride LiCl;
• 500 ml with a concentration of 1 ppm of Iron Nitrate Fe(NO3)3.
Each of the first four cavitations lasted 90 min, while the Iron Nitratesolution was cavitated both for 120 minutes. The schematic layout ofthe experimental equipment is shown in Fig. 2.

Neutrons from Piezonuclear Reactions 189
Figure 2: Layout and lateral section of the experimental setup. d=7 cm, g=10 cm, s=4 cm,b=5 cm. This setup indicates that between the cavitation area and the neutron detectors andthe Geiger counter there were 3.5 cm of water, the thickness of the Borosilicate (about 2 mm)and few centimetres of air.
The cavitation chamber (vessel) was in the centre and the sonotrode has to be imaginedperpendicular to the plane of the figure, just over the bottle and lined up with it. Theimmersion of the sonotrode and the distance of its tip from the bottom of the vesselwere about 4 cm and 5 cm respectively. For each cavitation experiment, we used threeneutron detectors Defender. They are cylinders 194 mm long (their active part is 100 mmlong) and with a diameter of 21 mm. They are sensitive to neutrons in the energy rangebetween 10 KeV and 15 MeV. Their response is dose rate independent and their minimumdetection level is a tenth of an ounce of Plutonium in seconds at 1 meter. Their responsewas determined to be about 100 counts/µSv to 252Cf at 20 C. Their angular response isisotropic and they are completely una!ected by gamma radiation as it is stated by themanufacturer and it was experimentally ascertained by irradiating them with a knownsource of 60Co for several minutes without producing the tiniest bubble. They were placedvertically and parallel to the vessel or the sonotrode axis, arranged as shown in Fig.2. Oneof the Defenders was screened by immersing it in a cylinder of carbon (moderator) 3 cmthick. The Geiger counter was pointed towards the area inside the bottle where cavitationtook place. A second equal arrangement of three Defenders and the vessel containingthe same uncavitated solution (blank), was placed in a di!erent room and was used tomeasure the neutron radiation background at the same time when cavitation was takingplace. The measurements of fast neutron radiation carried out in the experiments withH2O, Aluminium Chloride and Lithium Chloride were compatible with the backgroundlevel (20 nSv). On the contrary, in the second and the fifth experiment, with Iron Chlorideand Iron Nitrate respectively, the measured neutron radiation was incompatible with the
6
Fig. 2: Layout and lateral section of the experimental setup.
d=7 cm, g=10 cm, s=4 cm, b=5 cm. This setup indicates that
between the cavitation area and the neutron detectors and the
Geiger counter there were 3.5 cm of water, the thickness of the
Borosilicate (about 2 mm) and few centimetres of air.
The cavitation chamber (vessel) was in the centre and the sonotrodehas to be imagined perpendicular to the plane of the figure, just overthe bottle and lined up with it. The immersion of the sonotrode and thedistance of its tip from the bottom of the vessel were about 4 cm and 5cm respectively. For each cavitation experiment, we used three neutrondetectors Defender. They are cylinders 194 mm long (their active partis 100 mm long) and with a diameter of 21 mm. They are sensitive toneutrons in the energy range between 10 KeV and 15 MeV. Their re-sponse is dose rate independent and their minimum detection level is atenth of an ounce of Plutonium in seconds at 1 meter. Their responsewas determined to be about 100 counts/µSv to 252Cf at 20°C. Their an-gular response is isotropic and they are completely unaffected by gammaradiation as it is stated by the manufacturer and it was experimentallyascertained by irradiating them with a known source of 60Co for sev-eral minutes without producing the tiniest bubble. They were placedvertically and parallel to the vessel or the sonotrode axis, arranged asshown in Fig. 2. One of the Defenders was screened by immersing it ina cylinder of carbon (moderator) 3 cm thick. The Geiger counter waspointed towards the area inside the bottle where cavitation took place.A second equal arrangement of three Defenders and the vessel containingthe same uncavitated solution (blank), was placed in a different roomand was used to measure the neutron radiation background at the same
190 F. Cardone et al.
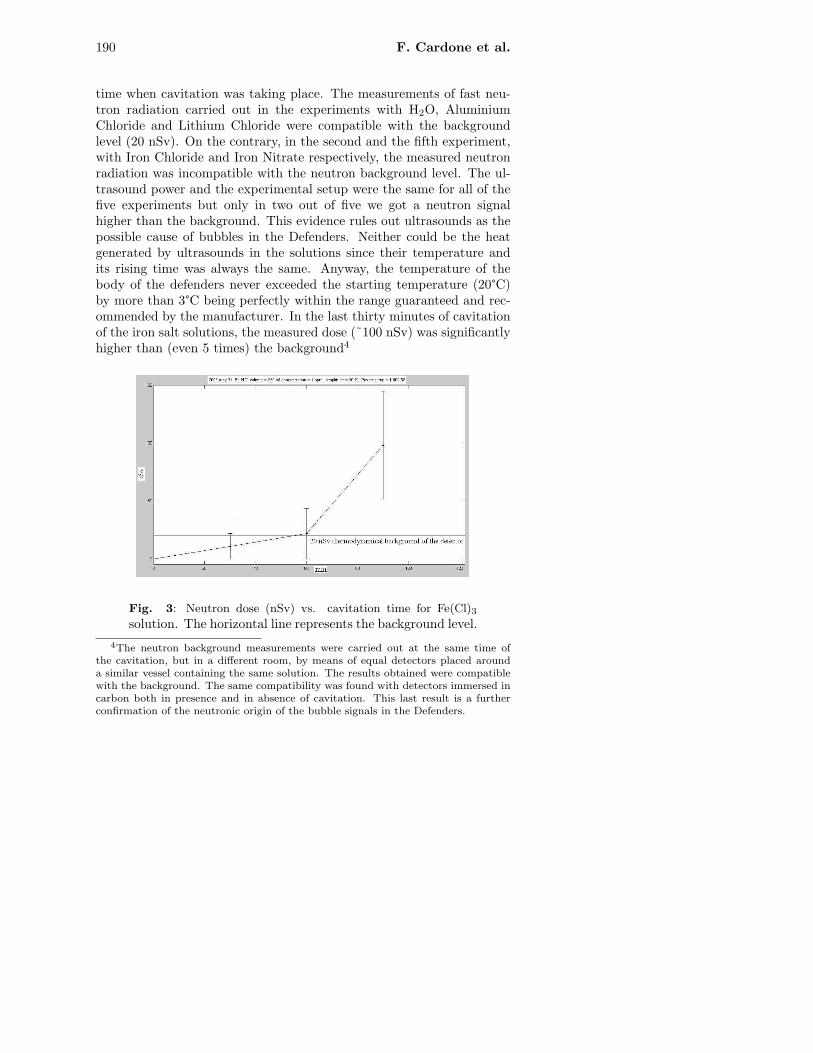
time when cavitation was taking place. The measurements of fast neu-tron radiation carried out in the experiments with H2O, AluminiumChloride and Lithium Chloride were compatible with the backgroundlevel (20 nSv). On the contrary, in the second and the fifth experiment,with Iron Chloride and Iron Nitrate respectively, the measured neutronradiation was incompatible with the neutron background level. The ul-trasound power and the experimental setup were the same for all of thefive experiments but only in two out of five we got a neutron signalhigher than the background. This evidence rules out ultrasounds as thepossible cause of bubbles in the Defenders. Neither could be the heatgenerated by ultrasounds in the solutions since their temperature andits rising time was always the same. Anyway, the temperature of thebody of the defenders never exceeded the starting temperature (20°C)by more than 3°C being perfectly within the range guaranteed and rec-ommended by the manufacturer. In the last thirty minutes of cavitationof the iron salt solutions, the measured dose (˜100 nSv) was significantlyhigher than (even 5 times) the background4
Figure 3: Neutron dose (nSv) vs. cavitation time for Fe(Cl)3 solution. The horizontal linerepresents the background level.
neutron background level. The ultrasound power and the experimental setup were thesame for all of the five experiments but only in two out of five we got a neutron signalhigher than the background. This evidence rules out ultrasounds as the possible causeof bubbles in the Defenders. Neither could be the heat generated by ultrasounds in thesolutions since their temperature and its rising time was always the same. Anyway, thetemperature of the body of the defenders never exceeded the starting temperature (20 C)by more than 3 C being perfectly within the range guaranteed and recommended bythe manufacturer. In the last thirty minutes of cavitation of the iron salt solutions, themeasured dose (˜100 nSv) was significantly higher than (even 5 times) the background4
Precisely, the final measured dose was (98.50 ± 4.5) nSv for FeCl3 (Fig.3)and (76.00± 4.5) nSv for Fe(NO3)3 (Fig.4).
4The neutron background measurements were carried out at the same time of the cavitation, but in a di!erentroom, by means of equal detectors placed around a similar vessel containing the same solution. The resultsobtained were compatible with the background. The same compatibility was found with detectors immersed incarbon both in presence and in absence of cavitation. This last result is a further confirmation of the neutronicorigin of the bubble signals in the Defenders.
7
Fig. 3: Neutron dose (nSv) vs. cavitation time for Fe(Cl)3solution. The horizontal line represents the background level.
4The neutron background measurements were carried out at the same time ofthe cavitation, but in a different room, by means of equal detectors placed arounda similar vessel containing the same solution. The results obtained were compatiblewith the background. The same compatibility was found with detectors immersed incarbon both in presence and in absence of cavitation. This last result is a furtherconfirmation of the neutronic origin of the bubble signals in the Defenders.
Neutrons from Piezonuclear Reactions 191
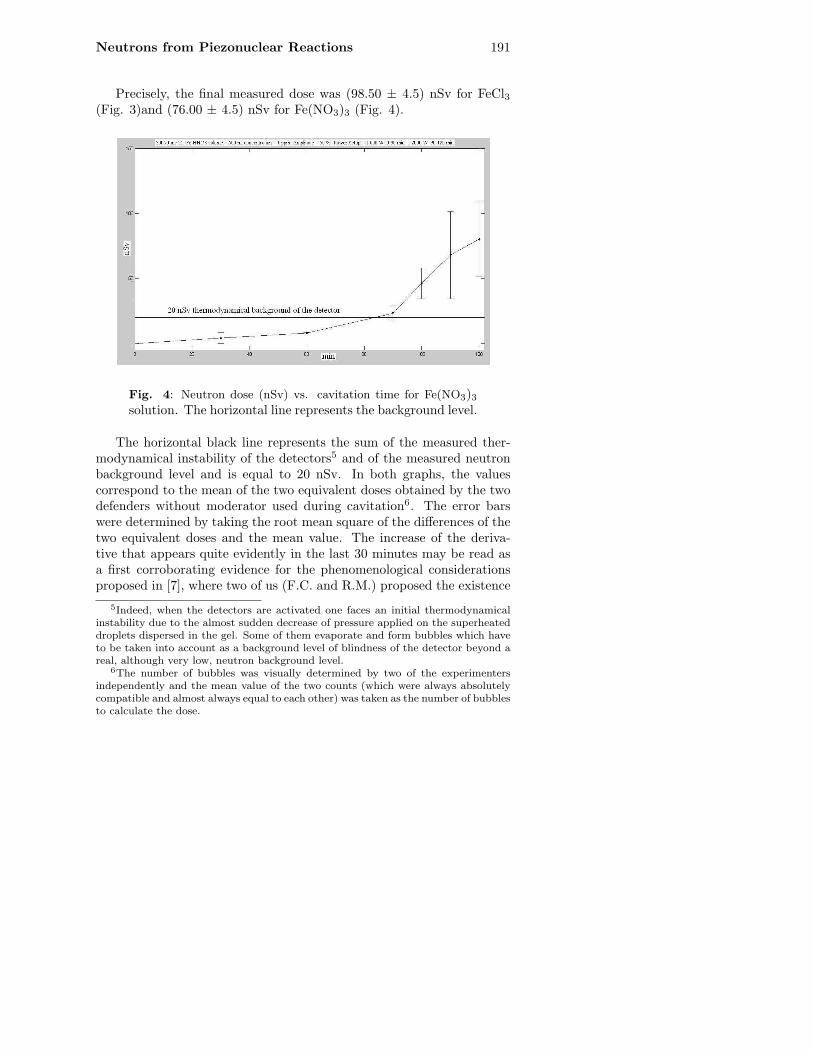
Precisely, the final measured dose was (98.50 ± 4.5) nSv for FeCl3(Fig. 3)and (76.00 ± 4.5) nSv for Fe(NO3)3 (Fig. 4).
Figure 4: Neutron dose (nSv) vs. cavitation time for Fe(NO3)3 solution. The horizontal linerepresents the background level.
8
Fig. 4: Neutron dose (nSv) vs. cavitation time for Fe(NO3)3solution. The horizontal line represents the background level.
The horizontal black line represents the sum of the measured ther-modynamical instability of the detectors5 and of the measured neutronbackground level and is equal to 20 nSv. In both graphs, the valuescorrespond to the mean of the two equivalent doses obtained by the twodefenders without moderator used during cavitation6. The error barswere determined by taking the root mean square of the differences of thetwo equivalent doses and the mean value. The increase of the deriva-tive that appears quite evidently in the last 30 minutes may be read asa first corroborating evidence for the phenomenological considerationsproposed in [7], where two of us (F.C. and R.M.) proposed the existence
5Indeed, when the detectors are activated one faces an initial thermodynamicalinstability due to the almost sudden decrease of pressure applied on the superheateddroplets dispersed in the gel. Some of them evaporate and form bubbles which haveto be taken into account as a background level of blindness of the detector beyond areal, although very low, neutron background level.
6The number of bubbles was visually determined by two of the experimentersindependently and the mean value of the two counts (which were always absolutelycompatible and almost always equal to each other) was taken as the number of bubblesto calculate the dose.
192 F. Cardone et al.
of a threshold in power and energy (and hence time) for piezonuclearreactions to happen. In this sense, provided the ultrasonic power trans-mitted into the solution is higher than the required threshold [7], theemission of neutrons produced by these reactions begins only after thata certain amount of energy was conveyed into the solution or, which isequivalently, after a certain time interval. Let’s now add a considera-tion which can be drawn from reference [7] where the bubble collapse isindicated as the main microscopical mechanism to induce piezonuclearreactions and hence neutron radiation. The emission of neutrons doesnot take place as from a stable source but, conversely, it happens inbursts. This consideration can be considered at this stage as a heuristichypothesis which will be helpful in interpreting the results of the sec-ond investigation, nevertheless some experimental evidences presentedfurther on will turn it into a sound empirical hypothesis. The last factof this first investigation was the absence of ionizing radiation abovethe background level in all of the experiments - even in those two inwhich we got the evidence of neutron emission. Of course, this couldmean either that gamma radiation was not emitted at all as it usually iswhen neutrons are emitted, or that the sensitivity of our detectors wasnot sufficient to reveal their slight presence. Besides, we have to pointout that even if neutron emission took place without any consequentgamma radiation7 from nuclei de-excitation, one would expect gammarays to be emitted from hydrogen capture anyway. This first investiga-tion permitted therefore to state that only the presence of Iron in thecavitated solution gives rise to fast neutron emission and therefore tonuclear processes induced by cavitation.
3.2 Second Investigation
Since the first investigation highlighted the basic role of Iron in producingpiezonuclear reactions, the second one was devoted to a systematic studyof such an evidence, by using solutions with only Iron Nitrate, since itgave rise, in the previous investigation, to the maximum flux of emittedneutrons. Then, six cavitation runs (each lasting 90 min) were carriedout on the same quantity (250 ml) of pure water and of a solution ofFe(NO3)3 with different concentration, subjected to ultrasounds of dif-ferent power. Namely, the cavitated solutions could have three possibleconcentrations, 0 ppm (H2O), 1 ppm and 10 ppm. Moreover, the oscil-
7A possible explanation of this fact, based on a space-time deformation of theinteraction region between two nuclei, can be found in ref. [7].

Neutrons from Piezonuclear Reactions 193
lation amplitude and hence the transmitted ultrasonic power took twodifferent values, 50% and 70%, corresponding to about 100 W and 130W, respectively. The energy delivered to the solution within the wholecavitation time was 0.54 MJ and 0.70 MJ in the two cases. In orderto measure neutron radiation we employed five neutron detectors of theDefender XL type, with higher sensitivity (by one order of magnitude)with respect to those used in the first investigation. These detectors arecylinders 47 cm long (their active part is 30cm long) with a diameterof 5.7 cm. Their energy range lies between 10 KeV and 15 MeV. Theirresponse is dose rate independent and their minimum detection level isa hundredth of an ounce of Plutonium in seconds at 1 meter. Theirresponse was determined to be about 1000 counts/µSv to 252Cf at 20°C.Their angular response is isotropic and they are completely unaffectedby gamma radiation as it is stated by the manufacturer and it was exper-imentally ascertained by irradiating them with a known source of 60Cofor several minutes without producing the tiniest bubble. Backgroundneutron measurements were accomplished at the beginning of the wholeset of cavitations. During each cavitation we carried out ionizing radia-tion measurements by two Geiger counters Gamma Scout [19] , one withno aluminum filter and the other with a 3 mm filter, used simultaneously.One picture and a layout of the experimental apparatus used in the sixcavitation runs are shown in Fig. 5.

194 F. Cardone et al.
Figure 5: Experimental apparatus used in the second investigation. The cavitation Chamber(F) is visible in the middle of both pictures and the sonotrode, the vertical tapered metal stick(G), is aligned with and inserted in it. The green pipe surrounding the sonotrode conveyedthe cooling air onto the sonotrode surface. The three horizontal greyish cylinders (C,D,E) witha black cylindrical endcap are the neutron detectors. The two orange (right) (B) and creamy(left) (A) vertical cylinders contained the two screened Defenders, one by boron (orange) andthe other by carbon (creamy).
11
Fig. 5: Experimental apparatus used in the second investiga-
tion. The cavitation Chamber (F) is visible in the middle of both
pictures and the sonotrode, the vertical tapered metal stick (G),
is aligned with and inserted in it. The green pipe surrounding
the sonotrode conveyed the cooling air onto the sonotrode sur-
face. The three horizontal greyish cylinders (C,D,E) with a black
cylindrical endcap are the neutron detectors. The two orange
(right) (B) and creamy (left) (A) vertical cylinders contained the
two screened Defenders, one by boron (orange) and the other by
carbon (creamy).
The vessel in which cavitation took place (F) (cavitation chamber,the same as the first investigation) is visible in the middle of both pic-tures and the sonotrode, the vertical tapered metal stick, is aligned withand inserted in it. The three horizontal greyish cylinders with a blackcylindrical endcap are the neutron detectors. Two of them (C) and (E)were positioned next to the chamber at a height with respect to the tipof the sonotrode, in order to be struck by horizontally emitted neutrons.Their distance (K) from the centre of the vessel is half the diameter of

Neutrons from Piezonuclear Reactions 195
the bottle (3.5 cm of water) plus the thickness of the borosilicate glass2 mm and 5 mm of air. The third detector (D) was placed underneaththe chamber in order to collect the vertically emitted neutrons. Sincein this second investigation we reduced the immersion of the sonotrode(G) to 1 cm, the distance (L) of the Detector (D) from the sonotrodetip is in this case the sum of 9 cm of water, 2mm of borosilicate glass,4 mm of Plexiglas and 3 cm of air. The two vertical cylinders (A andB) contained one neutron detector each, of the same type of the threehorizontal ones. The detectors were surrounded, and hence screened,by 3 cm of Boron powder (B) (thermal neutron absorber) and by 3 cmof Carbon powder (A) (neutron moderator), respectively. The distance(J) of these two screened Defenders XL from the axis of the vessel wasthe sum of the diameter of the bottle (water) plus the thickness of theborosilicate glass (2 mm), 10 cm of air, 1 mm of PVC and 3 cm of eitherBoron or Carbon. Two geiger counters (H and I) were pointed towardsthe bottom of the cavitation chamber, one with unscreened mica win-dow, the other with a shield of 3mm of Aluminium. The distance of themica window from the sonotrode tip was again (L) as specified above. Inall of the six experiments of this second investigation, the three horizon-tal, unscreened Defender XL’s measured a neutron emission significantlyhigher than the background level. The two vertical, screened DefenderXL’s (both by boron and carbon) always detected a reduced neutrondose, comparable with the background one (thus again providing fur-ther evidence of the neutron origin of the bubble signals). For all of thesix experiments, we plotted the measured doses of neutrons (in nano-Sievert) as function of the cavitation time. The number of bubbles wascounted every 10 min. Each curve corresponds to one concentration ofthe Fe(NO3)3 solution, from 0 ppm to 10 ppm, and one oscillation am-plitude (and therefore ultrasonic power), 50% (100 W) or 70% (130 W).The six graphs are reported in Fig. 6.

196 F. Cardone et al.
Figure 6: The six graphs (one for each cavitation of the second series) showing the neutron dose(in nSv) as a function of time in minutes (time interval 10 min). Each curve corresponds to onevalue of concentration and one of the amplitude. The horizontal line in all graphs correspondsto the thermodynamical noise of 3.5 nSv. The graphs are displaced in a Cartesian plane, withconcentration (in ppm) on the y-axis and amplitude (power) on the x-axis.
13
Fig. 6: The six graphs (one for each cavitation of the second
series) showing the neutron dose (in nSv) as a function of time in
minutes (time interval 10 min). Each curve corresponds to one
value of concentration and one of the amplitude. The horizontal
line in all graphs corresponds to the thermodynamical noise of
3.5 nSv. The graphs are displaced in a Cartesian plane, with
concentration (in ppm) on the y-axis and amplitude (power) on
the x-axis.
They are displaced in a Cartesian coordinate system with concentra-tion on the y-axis and amplitude (power) on the x-axis. As in the firstinvestigation, the horizontal black line represents the sum of the mea-sured thermodynamical instability of the detectors and of the measuredneutron background level. The examination of the six graphs of Fig. 6does not report the threshold behaviour in energy that we found in thefirst investigation, namely the sharp and sudden increase of the curve

Neutrons from Piezonuclear Reactions 197
derivative in the last 30 minutes of cavitation. Despite that, accordingto our heuristic hypothesis (which will be experimentally supported inthe following) about the neutron emission taking place in bursts, it willbe wrong to interpret these curves as a sign of a stable neutron emission.Conversely, still considering valid this hypothesis, one can ascribe thisdifferent behaviour between the first and the second investigations to thedifferent immersions of the sonotrode in the solution, which was about4 cm (about 5 cm from the bottom of the vessel) in the former and only1 cm (about 10 cm from the bottom of the vessel) in the latter. Thismeans that both the height of the neutron peaks (bursts) and, hence, theemitted dose can be controlled somehow by this geometrical parameter.This consideration allows one to ascribe this apparent lack of thresholdbehaviour to the reduced height of the neutron peaks emitted during thecavitations performed in the second investigation with respect to thoseemitted in the first one. This reduced height spread the neutron doseover a longer period of time preventing the threshold behaviour fromshowing up. It will be the purpose of our future investigations to estab-lish the time of appearance of the first neutron burst and verify whetherit takes place beyond the energy (or time) threshold. Moreover, Fig. 6further disproves the possible criticism about a possible generation ofthe bubbles by ultrasounds rather than by neutrons. Indeed, by lookingat the compound graph and reading it along its columns, i.e. keeping theamplitude (power) fixed, it is seen that the curves are different, while theultrasonic power is always the same. Conversely, had ultrasounds beenthe real cause of the bubbles, one should have had equal effects. Besides,we add that the temperature of the laboratory was stabilized to 20°C bya heat pump, which could work in reverse mode as well. Moreover, wechecked every ten minutes the temperature of the body of the two de-fenders XL next to the cavitation chamber and in particular of that partclose to the warm vessel. The temperature of this part increased grad-ually from 20°C but never exceeded 25°C which is perfectly within theworking range (15°- 35°C ) guaranteed by the manufacturer who ther-mally stabilized their operation. As a further proof against any possibleinfluence of temperature or IR irradiation on the number of bubbles inthe defenders, we checked that at equal temperature of the solution inthe vessel, and equal ultrasonic power, the bubble distribution in the de-fender XL did not show any systematic concentrations (qualitatively andquantitatively in term of number of bubbles) near the warmest part of thevessel and in the surroundings where possible thermal gradients might

198 F. Cardone et al.
have had some effect on the stability of the defenders. Let us also remarkthat in the second investigation one got evidence for neutron emissionalso in cavitating pure water, unlike the case of the first one. This isobviously due to the higher sensitivity of the detectors employed in thesecond investigation. Such a result agrees with the indirect evidence forneutron emission obtained in the first experiment of water cavitation, inwhich the changes in concentration of the stable elements occurred witha variation in neutron number [4, 5]. At the light of the above results,we can say that the cavitating device behaves as an ultrasonic nuclearreactor. As we have already said, we performed measurements of the ion-izing radiation by means of the above mentioned (filtered and unfiltered)Geiger counters. The measured radiation was always compatible withthe background level. As a further check of the absence of γ radiation,we carried out, in absence of cavitation and during cavitation of IronNitrate (70% amplitude, concentration >10 ppm, duration 90 mins), si-multaneous measurements by means of the two Geigers and through atallium (Tl) activated, Sodium Iodine (NaI), γ-ray spectrometer. Wefound again a perfect compatibility between the background spectrumand that during cavitation both for the two Geigers and for the NaI (Tl),γ-ray spectrometer (in spite of the neutron signal with maximum of (9.1± 0.5) nSv measured by the Defender XL’s). Thus, the results of thesecond investigation too provided evidence for the emission of anoma-lous nuclear radiation, since neutrons were not accompanied by gammarays. These outcomes about the apparent absence of gamma rays haveto be commented by what we have already said above for the first in-vestigation. The NaI(Tl) spectrometer allowed us to increase by severalorders of magnitude the accuracy and sensitivity of gamma ray detec-tion. Despite that, we need again to raise the question about the lack ofgamma rays from Hydrogen capture which will have to be addressed tothe future experiments.
The systematic analysis carried out by cavitating water solutions ofIron Nitrate, for all of which evidence of neutron radiation was gotten,shows that the phenomenon is perfectly reproducible. Moreover, wehave been able, by changing the immersion depth of the sonotrode tip,to reduce the emitted neutron dose by one order of magnitude. In fact,in the last cavitation run we got a maximum of (28.0 ± 7) nSv. Thisimplies that the phenomenon can be somehow controlled.

Neutrons from Piezonuclear Reactions 199
3.3 Further check and features of neutron emission
In the previous two investigations, the evidence for neutron emission washighlighted by means of the detectors Defender through the analysis ofthe bubble signals. As a further check, we carried out a further experi-ment utilizing not only the Defender XL’s but also boron-screened CR39detectors according to a well known technique [22, 23, 24]. By the sameexperimental apparatus used in the second investigation (see Fig.??),we subjected to cavitation 250 ml of a water solution of Iron Chloride(FeCl3) with concentration 10 ppm. The cavitation lasted 90 min at theultrasound frequency of 20 KHz, with oscillation amplitude of 70% ofthe maximum amplitude, corresponding to a power of 130 W (namely toa total energy of 0.70 MJ). The choice to use again a solution of FeCl3was due to the fact that, all the other conditions being equal, we notedthat with Iron Chloride there is a higher release of macroscopic energythan with Iron Nitrate (the liquid evaporation is from 2 to 5 times thatobserved with the latter solution). Due to the equality of thermodynam-ical conditions, this cannot be explained in terms of ultrasounds only.The two unscreened lateral Defender XL’s (C and E) measured a max-imum dose of neutrons of 14.5 nSv, 4 times higher than the detectorthermodynamic noise of 3.5 nSv. Moreover, we placed, externally to thecavitation chamber, two pairs of 1 cm by 1 cm plate CR39 detectors(R,S and T,U) as shown in Fig. 7.

200 F. Cardone et al.
Figure 7: Layout of the experimental set-up of the second investigation showing the positionof the Boron screened CR39 plates with respect of the rest of the equipment.
16
Fig. 7: Layout of the experimental setup of the second investiga-
tion showing the position of the boron screened CR39 plates with
respect to the rest of the equipment.
Each plate was at a distance of about 4 cm from the vertical axisof the cavitation chamber, at the same level of the sonotrode tip. Inbetween the CR39 plates and the axis of the vessel there were 3.5 cmof the solution, 2 mm of the borosilicate glass and about either 3 mmof air or 3 mm of Boron. The two couples were diametrically oppositeto each other. In each pair, a CR39 was in air (S and T), whereas theother detector was immersed in boron (R and U) (whose interaction withneutrons gives rise to alpha radiation to which CR39 are sensitive). Theresults obtained are displayed in the second and third row of Fig. 8. Bythe boron CR39 we were able to detect neutrons with energies below 10KeV too and, above all, thermal neutrons.

Neutrons from Piezonuclear Reactions 201
Figure 8: Showing the traces left by neutrons on the CR39 detecting plates for the two cases ofthe nuclear reactor TAPIRO and the ultrasonic reactor. The magnification is 10X. The threecolumns from left to right refer, respectively, to the background, the CR39 in air and the CR39immersed in boron. In the third column, the rectangles enclose the traces of the maximumneutron intensity (corresponding to the beam axis in the case of the nuclear reactor).
17
Fig. 8: Showing the traces left by neutrons on the CR39 detecting
plates for the two cases of the nuclear reactor TAPIRO and the
ultrasonic reactor. The magnification is 10X. The three columns
from left to right refer, respectively, to the background, the CR39
in air and the CR39 immersed in boron. In the third column, the
rectangles enclose the traces of the maximum neutron intensity
(corresponding to the beam axis in the case of the nuclear reactor.
In order to have an idea of what the traces should look like on thesedetectors after etching, four more detectors were irradiated by neutronsusing as source, the fast neutron nuclear reactor TAPIRO at CasacciaENEA Rome, the neutron equivalent dose conveyed onto the detectorswas 2.1 µSv through a diagnostic neutron channel8. The output channel
8Not knowing what kind of neutron spectrum to expect from the cavitated solu-tion, as already stated, we decided to produce our comparison model of traces by a

202 F. Cardone et al.
of TAPIRO was calibrated to get a neutron equivalent dose rate of 21µSv/h. A boron CR39 was used to measure the background level aroundthe reactor, other two, one in air and the other immersed in boron, wereplaced at about 3 m from the reactor core and radiated for 5 min. Theresults are shown in the first row of Fig. 8. The comparison betweenthe traces produced by neutrons in the CR39 immersed in boron (thirdcolumn) in the nuclear reactor case (first row) and in the ultrasoundone (second and third row) shows that their pattern (although not theirextension) is perfectly similar. It is also possible to notice that the area ofthe thick trace produced by the reactor neutrons is about half of the areasof the thick traces produced by the neutrons generated by ultrasoundsduring cavitation. The Boron CR39 detectors can reveal neutrons of anyenergy. While fast neutrons are not affected by Boron and leave their owntraces on the polycarbonate surface, slow neutrons and thermal neutrons,above all, convert into alpha particles by interacting with Boron-10 (10B)(according to 10B(n,α)7Li) and through this mechanism produce a muchwider and deeper trace on the polycarbonate surface than fast neutrons.If we use this fact and we compare the CR39 traces obtained in thisexperiment (compatible with equivalent doses of 4-5 µSv in 90 minutes),with the bubble signals collected by the Defender XL’s in this sameexperiment (14.5 nSv in 90 minutes), and with those by the Defendersof the first Investigation (between 80 and 100 nSv in 90 minutes), we areallowed to conclude that the bulk of the neutron emission correspondsto neutrons having energy in the low epithermal range and even lower.We believe that the outcomes shown by these photos represent a fairlysound proof to corroborate our heuristic hypothesis about the emissionof neutrons in bursts. The trace pattern together with the thick trace onthe CR39 plate (like the third from left in Fig. 8), that was in front of thenuclear reactor, suggests that the emission of neutrons from the reactorcore is constant and isotropic. Of course, the reactor channel acted asa filter which selected those neutrons whose velocity was almost parallelto the channel axis. These neutrons produced the thick track right on
source whose spectrum were the widest possible, i.e. a nuclear reactor. Accordingto [22] these kind of detectors can detect fast, epithermal and thermal neutrons withdifferent sensitivities of course. Hence the integral effect on the detectors, due to al-most the whole neutron spectrum, would be traces whose quantity and shape wouldbe compared to those obtained from the piezonuclear reactor. As already stated,the main target of these investigations is to reveal the presence of neutrons in a sortof a ’yes or no’ detecting procedure. In future investigations we will perform morequantitatively accurate measurements by calibrating the CR39 detectors by knownneutron energy sources.
Neutrons from Piezonuclear Reactions 203
the channel axis and that almost circular distribution highlighted on thethird plate, but somehow visible on the second one too. These effectswere collected within 5 minutes. On the contrary, despite the cylindricalsymmetry of our experimental equipment (the vessel and the sonotrode),it is fairly clear that the neutron emission during cavitation was neitherconstant nor isotropic. Were it isotropic, one would have got a moreuniform distribution of traces and more thick traces on the CR39 platesand a more uniform distribution of bubbles in the defenders. As to theconstancy of emission, one would face the fact that the microscopicalmechanism that brings about neutron emission is bubble collapse, whichis governed by quite a few variables, like bubble dimension, quantityand type of atoms on the bubble surface. All these variables, completelyuncontrolled yet, make neutron emission more likely an impulsed processrather than constant. In this sense, neutron emission takes place inbursts at different instants of time, along diverse space directions andwith different height and energy spectrum.
4 Coherence with the findings of other experiments
Our cavitation experiments performed in the last decade evidenced twokinds of phenomena: production of nuclides (experiments [4, 5, 6]) andneutron emission (present experiments). Let us discuss such findings inconnection with the results of other experiments. As to nuclide produc-tion, the findings of the previous experiments (in particular of the firstone [4, 5]) are similar under many respects to those obtained by Russianteams at Kurchatov Institute and at Dubna JINR [25, 26, 27, 28, 29] inthe experimental study of electric explosion of titanium foils in liquids.In a first experiment carried out in water, the Kurchatov group [25, 26]observed change in concentrations of chemical elements and the absenceof significant radioactivity. These results have been subsequently con-firmed at Dubna [27]. Subsequently, the experiments have been carriedout in a solution of uranyl sulfate in distilled water, unambiguously show-ing [28] a distortion of the initial isotopic relationship of uranium and aviolation of the secular equilibrium of 234Th. Further experiments arepresently being carried out at the Nantes GeM laboratory, and theirpreliminary results are in agreement with those obtained by Urutskoevet al.[30]. Due to the similarity of such results with ours, in our opin-ion the two observed phenomena have a common origin. Namely, onemight argue that the shock waves caused by the foil explosion in liq-uids act on the matter in a way similar to ultrasounds in cavitation.

204 F. Cardone et al.
In other words, the results of the Russian teams support the evidencefor piezonuclear reactions9. However, let us notice that this is by nomeans a completely new result. Indeed, we recall that in the past someinvestigations [32, 33, 34, 35] have highlighted the ability of pressureand shock waves to generate autocatalytic fission-fusion reactions incompounds containing also uranium, tritium and deuterium. In suchexperiments, neutron fluxes have been observed in the range 107 -1013
neutrons/cm2s. As to neutron emission, we already quoted the OakRidge experiment [8, 9, 10, 16] on possible nuclear fusion in deuteratedacetone subjected to cavitation. The measured neutron flux was said tobe compatible with d-d fusion during bubble collapse. Some authors dis-claimed the results [11], others conversely confirmed them [12, 15]. As towhat the results of our investigations are, one would not be surprised ofthe controversial results and hence opinions on the outcomes of the OakRidge experiments [8, 9, 10, 16]. Our outcomes show that neutron emis-sion is obtained by cavitating solutions containing Iron and, even if ina very small quantity, by cavitating pure water. Hence the effects, thatwe measured, must be brought about by almost thoroughly unknownmechanisms which are triggered by pressure. With this in mind, we be-lieve that whoever tried to reproduce the Oak Ridge experiments musthave faced unusual behaviours and results since along with the very wellknown and expected neutrons from D-D fusion, other unknown effects(like the existance of a time (energy) threshold for neutron emission)would be superimposed, and would generate confused results which donot precisely confirm the common phenomenological predictions aboutfusion.The experiments [8, 9, 10, 16] belong to the research stream known assonofusion (or acoustic inertial confinement fusion), pioneered by Flynnin 1982 [2]. It amounts to the attempt to produce known nuclear re-actions by means of ultrasounds and cavitation. Conversely our case iscompletely different. We produced new nuclear reactions (piezonuclearreactions) that involve heavy nuclei but do not, apparently, affect Hydro-gen or light ones (at least within 90 minutes) under unusual conditionslike the existence of an energy threshold for these reactions to happenand like the apparent lack of gamma emission concomitant to neutronemission (although this needs to be confirmed).
9Another possible interpretation proposed for such phenomena (at least for thetitanium foil explosion) is in terms of the light magnetic monopoles introduced byLochak[31].

Neutrons from Piezonuclear Reactions 205
5 Conclusion
The experiments we carried out permit therefore to conclude that thecavitation process is able to induce in Iron salt solutions emission of ei-ther fast and epithermal neutrons. This constitutes a further evidencefor piezonuclear reactions. Moreover, we have been able to state somefundamental features of such a neutron emission, namely: 1) it exhibitsthreshold behavior in power, energy and time; 2) it occurs in anomalousconditions, namely without concomitant sensible production of γ-rays.If independently confirmed, our results would probably constitute a sig-nature of new physics.Let us conclude by putting forward a conjecture about these piezonuclearreactions and foretell that they can be brought about by properly com-pressing solid materials that contain iron (e.g. granite), for instance inone of those toughness experiments that are very common in Mechanicaland Civil Engineerings. More precisely, it will be possible to measureneutron emission at the instant of fracture of the specimens of thesematerials as their compression increases and reaches the breaking load.According to what is being done for liquids, it will be necessary to studyneutron emissions as function of the compression speed of the specimens.
Acknowledgments. We are greatly indebted to all people whosupported us in many ways in carrying out the experiments: the mil-itary technicians of the Italian Armed Forces A. Aracu, A. Bellitto,F. Contalbo, P. Muraglia; M. T. Topi, Director of ARPA Laborato-ries of Viterbo; the following personnel of Casaccia ENEA Laborato-ries: P. Giampietro, Director, G. Rosi, responsible of the nuclear reactor”TAPIRO”, and A. Santagata; G. Ingo and C. Ricucci, of the MicroscopyLaboratory ISMN-CNR and L. Petrilli, of CNR-Rome 1 Area, Mon-telibretti, for performing the mass spectrometry of the cavitated samples;R. Capotosto, Department of Physics ”E. Amaldi” of University ”RomaTre”, for technical support on the sonotrode tip. On the theoretical side,invaluable comments by E. Pessa are gratefully acknowledged. Thanksare also due to F. Mazzuca, President of Ansaldo Nucleare, for deep in-terest and warm encouragement. Last but not least, it is both a duty anda pleasure to thank in a special way Fabio Pistella, former President ofCNR (Italian National Research Council) for his caring assistance, con-tinuous interest, convinced participation to all stages of the experiments,and eventually for his experience of nuclear physicist he kindly providedto us during the discussions concerning the experimental results.

206 F. Cardone et al.
References
[1] Crum, L., & Gaitan, D.F., Frontiers of Nonlinear Acoustics, 12th Int.Symp. on Nonlinear Acoustics (Elsevier Applied Science, New York,1990).
[2] Brennen, C.E., Cavitation and bubble dynamics (Oxford Univ. Press.,1995).
[3] Metcalf, H., Science 279, 1322 (1998).
[4] Cardone, F. & Mignani, R.: in Proc. Int. Conf. On Cosmoparticle Physics”Cosmion 2001’ (Moscow, Russia, May 2001), Grav. and Cosmol. Suppl.8, 216 (2002).
[5] Cardone, F. & Mignani, R.: Int. J. Mod. Phys. B 17, 307 (2003).
[6] Cardone, F., Mignani, R., Perconti, W., Pessa, E. & Spera, G.: Jour.Radioanalytical Nucl. Chem. 265, 151 (2005).
[7] Cardone, F. & Mignani, R.: Int. Jour. Modern Phys. E 15, 911 (2006).
[8] Taleyarkhan, R.P., et al., Science 295, 1868 (2002).
[9] Taleyarkhan, R.P., et al., Phys. Rev. E 69, 036109 (2004).
[10] Taleyarkhan, R.P., et al., Phys. Rev. Lett. 96, 034301 (2006).
[11] Shapira, D., & Saltmarsh, M.: Phys. Rev. Lett. 89,104302 (2002).
[12] Xua, Y. & Butt A.: Nuclear Engineering and Design 235, 1317 (2005).
[13] Nigmatulin et al., J. Power and Energy, Vol. 218 Part A, 2004.
[14] Nigmatulin et al., Physics of Fluids, 17, 107106, 2005.
[15] E. Forringer et l., Archives of American Nuclear Society, Albuquerque,NM, pg.736-737, Nov.2006; also, Proc. Of Int. Conf. Nuclear Fusion En-ergy, Albuquerque, NM, Nov. 2006.
[16] R. P. Taleyarkhan et al., Nuclear Engineering and Design, 238 (10),p.2779-2791, Oct 2008
[17] http://www.sonotronic.de/products/standard-machines/ultrasonic-generators-type-dn-35-m-md-and-dn-20-m-md
[18] http://www.duran-group.com/english/products/duran/detail/laborflaschen.htmlhttp://www.duran-group.com/english/download/laborglas katalog 2005 2 p029.pdf
[19] http://www.gammascout.com/
[20] http://www.amptek.com/gamma8k.html
[21] http://www.bubbletech.ca/pdfs/BTI BUBBLE DEFENDER October2006.pdf
[22] R. V. Griffith, D. E. Hankins, L. Tommasino, and M. A. M. Gomaa,United States Patent 4,381,454 April 26, (1983).
[23] E. U. Khan, et al., Radiation Measurements 4, 2-6, 583-586, (2005).
[24] M. Izerrouken, J. Skvarc, and R. Ilic, Radiation Measurements 37, 21-24(2003).
[25] Urutskoev L.L., Liksonov V.I. & Tsinoev V.G. , Applied Physics (Russia),4, 83 (2000).

Neutrons from Piezonuclear Reactions 207
[26] Urutskoev L.L., Liksonov V.I. & Tsinoev V.G. ,Ann. Fond. L.de Broglie.27, 701 (2002).
[27] Kuznetsov, V.D., Myshinskii, G.V., Zhemennik, V.I. & Arbuzov, V.I. :”Test Experiments on Observation of Cold Transmutation of Elements”,Proc. 8-th Russ. Conf. on the Cold Transmutation of Nuclei of ChemicalElements (Moscow, 2001), p.308.
[28] Volkovich, A.G., Govorun, A.P., Gulyaev, A.A., Zhukov, S.V.,Kuznetsov, V.L., Rukhadze, A.A., Steblevskii, A.V. & Urutskoev, L.I.:Bull. Lebedev Physics Inst., 2002 (8).
[29] For a review, see Urutskoev, L.I.: Ann. Fond. L.de Broglie 29, 1149(2004).
[30] Priem, D., G. Racineux, G., Lochak, G., Daviau, C., Fargue, D., M.Karatchentcheff, M. & H. Lehn, H.: Ann. Fond. L.de Broglie 33, 129(2008).
[31] See e.g. Lochak, G.: Ann. Fond. L.de Broglie 33, 1 (2008), and refs.therein.
[32] Diebner, K.: Kerntechnik n.3, 89 (1962).
[33] Kaliski, S.: Nature 269, 370 (1977).
[34] Kozirev, A.S., Aleksandrov, V.A., Popov, N.A.: Nature 275, 476 (1978).
[35] Winterberg, F.: Atomenergie-Kerntechnik 44, 146 (1984).
(Manuscrit recu le 28 avril 2009)