neurotoxicology and teratology - vliz · neurotoxicology and teratology 32 (2010) 460–471 ⁎...
TRANSCRIPT
Neurotoxicology and Teratology 32 (2010) 460–471
Contents lists available at ScienceDirect
Neurotoxicology and Teratology
j ourna l homepage: www.e lsev ie r.com/ locate /neutera
Locomotor activity in zebrafish embryos: A new method to assessdevelopmental neurotoxicity
Ingrid W.T. Selderslaghs a,b,⁎, Jef Hooyberghs a,c, Wim De Coen b, Hilda E. Witters a
a VITO, Flemish Institute for Technological Research, Unit of Environmental Risk and Health, Division of Toxicology, Boeretang 200, 2400 Mol, Belgiumb University of Antwerp, Department of Biology, Laboratory for Ecophysiology, Biochemistry and Toxicology, Groenenborgerlaan 171, 2020 Antwerp, Belgiumc Hasselt University, Department WNI, Agoralaan-Building D, 3590 Diepenbeek, Belgium
⁎ Corresponding author. VITO, Flemish Institute forEnvironmental Risk and Health, Division of ToxicologBelgium. Tel.: +32 14 335261; fax: +32 14 582657.
E-mail address: [email protected] (H.E. Witters).
0892-0362/$ – see front matter © 2010 Elsevier Inc. Aldoi:10.1016/j.ntt.2010.03.002
a b s t r a c t
a r t i c l e i n f oArticle history:Received 14 October 2009Received in revised form 4 January 2010Accepted 1 March 2010Available online 6 March 2010
Keywords:ZebrafishDevelopmental neurotoxicityLocomotor activity
Currently, neurotoxicity testing defined by OECD and FDA is based solely on in vivo experiments, using largenumbers of animals, being expensive, time-consuming and unsuitable for screening numerous chemicals.The great demand for thousands of chemicals yet to be evaluated, urges the development of alternative testmethods which are cheaper, faster and highly predictive for developmental neurotoxicity. In this study, wedeveloped a new method to assess locomotor activity in early life stage of zebrafish at 24 h post fertilization(hpf), in comparison to locomotor activity of zebrafish larvae at 96 to 192 hpf. We hypothesized that thisendpoint at early life stages could be used to predict the developmental neurotoxic potential of chemicalsand performed exposure studies with chlorpyrifos to demonstrate this. Furthermore, the case study withchlorpyrifos was used to critically evaluate behavioral data analysis and improve method sensitivity. Theapproach for data analysis using distribution plots for parameters on locomotor activity, next to mean valuesallowed to obtain more accurate information from the same set of behavioral data, both for embryos andlarvae. Embryos exposed to chlorpyrifos, within the range 0.039 to 10 mg/l, exhibited a significantconcentration-dependent increase in the frequency and total duration of their spontaneous tail coilings at24–26 hpf. Larvae exhibited altered swimming activity, as evidenced by a significant decrease in the totalduration of movement and an increase in mean turn angle in the range 0.18 to 0.75 mg/l chlorpyrifos.Methodological evaluation showed that locomotor effects in larvae were most pronounced and reproducibleat 96 hpf, compared to older individuals (120, 144, 168 and 192 hpf). These new methods based onlocomotor activity at early life stages of zebrafish allowed to classify chlorpyrifos as a developmentalneurotoxicant. Further research to judge the validity of these alternative methods is currently performedwith an extended set of expected positive or negative chemicals for developmental neurotoxicity.
Technological Research, Unity, Boeretang 200, 2400 Mol,
l rights reserved.
© 2010 Elsevier Inc. All rights reserved.
1. Introduction
The developing human brain is inherently more susceptible to injurycaused by toxic agents than is the brain of an adult [21]. Many agents cancause developmental neurotoxicity as a result of interferences with thedevelopmental processes of the nervous system, such as proliferation,migration, differentiation, synaptogenesis, gliogenesis, myelination andapoptosis [20]. Neurotoxicity detection induced by chemicals representsamajor challengedue to thephysiological andmorphological complexityof the central and peripheral nervous system [1]. Currently, regulatoryauthorities such as the Organisation for Economic Cooperation andDevelopment (OECD) [17] and theU.S. Environmental ProtectionAgency(U.S. EPA) [26] usemammalian in vivomethods solely for both adult anddevelopmental neurotoxicity testing (DNT). These methods, OECD TG
426 [16] and OPPTS 870.6300 [28] for the evaluation of developmentalneurotoxicity andTG424 [15] andOPPTS870.6200 [27] for neurotoxicityassessment in adults in which the rat is the preferred species, aremainlybased on a neurobehavioral evaluation of cognitive, sensory and motorfunctions accompanied by neuropathological studies. Although thecurrentDNTguidelines generateuseful data for risk assessmentpurposes[13], many of the recommended tests are complex and expensive interms of scientific resources, time and animal use [11].
Of the thousands of chemicals on the market, fewer than half havebeen subjected to even basic laboratory testing for toxicity assess-ment. Nearly 3000 of these substances are produced in quantities ofalmost 500 ton every year, but for nearly half of these high-volumechemicals no basic toxicity data are publicly available. Moreover, for80% of these chemicals, information is lacking with regard todevelopmental or pediatric toxicity [7]. Due to the actual need totest large sets of compounds for specific regulatory requirements inEurope and the U.S. (e.g. the Registration, Evaluation, Authorizationand Restriction of Chemicals (REACH) policy and the High ProductionVolume Programme (HPVP)), there is high pressure to develop
461I.W.T. Selderslaghs et al. / Neurotoxicology and Teratology 32 (2010) 460–471
alternative test strategies which are more rapid, economically feasibleand have an acceptable predictive capacity [2].
Cell culture techniques have been developed to address keybiochemical and functional features of developmental neural biology,such as cell migration, formation of neuronal networks, synaptogenesisand neuron–glia interaction [4]. However, due to the complexity of thenervous system, none of the existing in vitromodels entirely reflects thein vivo situation as, once isolated, most of the neuronal culture systemsrepresent cells that are no longer part of any integrated neural network[1]. Moreover, in vitro models cannot recapitulate more complexendpoints such as behavior, which is the ultimate result of neuronaldevelopment and signaling [4]. Simplewhole organism systems such asthe nematode, fruit fly or zebrafish, which enable assessment ofintegrative effects together with knowledge of the organism's completegenome, may offer a more immediately viable and ultimately morepowerful approach to DNT alternatives [11].
In the search for alternative models for DNT, the zebrafish offersmany advantages: low cost, high throughput, an almost limitless rangeof morphological and functional assays, and an apparently high degreeof similaritywithmammalian systems [18]. Moreover, the fundamentalprocesses of neurodevelopment in zebrafish are homologous to thosethat occur in humans [25].
In this studywe explored the possibility to assess the developmentalneurotoxic potential of a compound in zebrafish embryos and larvaeafter exposure to a known developmental neurotoxicant. We thereforedeveloped and optimized two new methods based on the locomotoractivity in zebrafish, namely spontaneous tail coilings in embryos andswimming activity in larvae. Chlorpyrifos (CPF), a widely employedorganophosphate pesticide, was selected as the model compound forthe development and standardization of screening procedures sinceevidence of the developmental neurotoxic potential of this compound isextensive [5].
2. Materials and methods
2.1. Test animals and collection of eggs
Adult, wild type, zebrafish were obtained from a commercial sup-plier (Aquaria Antwerp, Aartselaar, Belgium) and were kept at the VITOlaboratory facility at least three weeks prior to the first intendedspawning. The adult fish were maintained in large 60–70 l aquaria withamaximumdensity of 1 gfish/lwater at 25±2 °Cwith a constant light–dark (14–10 h) cycle. The water was continuously aerated and renewalof the water occurred in a semi-static manner. Fish were regularlyprovided with a varied diet, consisting of commercial dry flake food,young water flea and live brine shrimp. The health condition of the fishwas checked daily, except weekends.
Prior to spawning, males and females were housed separately for aminimum of five days. The day before eggs were required, males andfemales were placed in breeding tanks with a 6:4male:female ratio. Thebreeding tanks were equippedwith a spawning tray, which consisted ofa fine net with an appropriate mesh size for eggs to fall through, close tothebottomof the tank. Thefishwere left undisturbedovernightandeggscould be collected 1 hour after the lightwas turned on thenextmorning.Eggs were rinsed in 0.0002% methylene blue (CAS # 7220-79-3, Sigma-Aldrich), diluted in medium (see below) and placed into large petridishes. At the start of exposure to test conditions, embryos were trans-ferred to microtiter plates which were placed in the incubator wherethey were maintained on a 14:10 light:dark cycle at 28.5±0.5 °C. Ifrelevant for theexperiments, exposurewas continued in the incubator instatic conditions without external feeding until free swimming larvalstages at the age of 192 hpf.
At the end of experiments, embryos and larvae were placed in a0.05% solution of 2-phenoxy-ethanol for the purpose of euthanasia.The procedures described in this study were approved by the localethical committee.
2.2. Medium and test substance
Fishwater, reconstituted asdescribed in the test guidelineOECD203,annex 2was used as the dilutionmedium for all the experiments.Waterquality parameters were regularly checked and measurements were inthe following ranges: pH 7.5–8.0, conductivity 632–676 μS/cm²,hardness 217–235 mg/l CaCO3, oxygen 92–98%.
Chlorpyrifos (CAS# 2921-88-2) was obtained from Sigma-Aldrich.Stock solutions with concentrations of 25, 10 and 0.75 mg/ml wereprepared in 100% dimethylsulfoxide (DMSO) and kept refrigerated.Test solutions were freshly prepared in fish water with a final DMSOconcentration of 0.1% (v/v). For all test solutions, pH was checked(range 6.8–8) and oxygen levels of the solutions were always higherthan 80%.
2.3. Determination of the highest non-teratogenic concentration (HNTC)
To determine an appropriate concentration regimen for further eval-uation of locomotor activity, teratogenic endpoints induced by CPFwereevaluated as described in our former work [24]. Briefly, embryos wereexposed within 2 h post fertilization (hpf) to a dilution series of CPF inthe range of 0.05 to 25 mg/l, as derived from preliminary experiments.For each concentration tested as well as negative and vehicle controls, aminimum of 15 embryos were placed in a solution in a 6-well plate.Starting at 6 hpf, fertilization success was assessed and twelve fertilizedeggswere transferred to a 24-well plate, oneembryoperwell containingcorresponding test solutions of CPF or control solutions. Exposure wasstatic and continuous without feeding. Morphological characteristics ofeach individual were evaluated at 24, 48, 72 and 144 hpf by means of alight microscope. The characteristics evaluated were selected withrespect to normal developmental processes and included the presenceand morphological development (as appropriate) of otoliths, eyes,somites, tail detachment, heart beat, circulation, pigmentation, hatching,kinks in the tail, sidewise position and active swimming behavior oflarvae. Mortality and the presence of malformations were assessed foreach concentration and time point of development. Final experimentswere conducted three times (n=3) and based on these data,concentration–response curves were created for each age for which anevaluation was performed for both embryotoxicity and teratogenicity.The highest non-teratogenic concentration (HNTC) was defined as thehighest concentration at which no malformations or lethality wereobserved in at least 90% of the individuals in three consecutive exper-iments. The HNTC was determined for 24 and 144 hpf, and these werethe highest test concentrations used for experiments on locomotorbehavior for embryos and larvae respectively.
2.4. Evaluation of spontaneous tail coilings in zebrafish embryos
Within 2 hpf, a minimum of 60 zebrafish embryos were placed in awell of a 6-well plate containing either a 0.1% DMSO solution (vehiclecontrol) or a CPF solution. Five concentrations of CPF, starting at theHNTC at 24 hpf (see Results, Section 3.1) and further diluted by afactor of 4, were tested in separate experiments, each time withcorresponding controls. During exposure, embryos were placed at28.5±0.5 °C in a temperature and light controlled incubator with aconstant light–dark (14–10 h) cycle. Starting at 6 hpf, fertilizationsuccess was assessed (range 80–100%) and aminimum of 48 fertilizedembryos were transferred to fresh solutions.
Spontaneous tail coilings were evaluated in embryos aged 24 to26 hpf. Embryos, which did not show any malformations, weretransferred to a 96-well plate with round bottom (Iwaki brand, AsahiGlass Co., LTD, Japan) a few minutes before the evaluation, fourembryos per well in 200 μl of solution. Vehicle controls and CPFexposed embryos were placed in an alternating manner on the plate.Tail coilings were detected with a high resolution movie file (mpeg2)with a duration of 5min (at a maximum of 25 frames per second),
462 I.W.T. Selderslaghs et al. / Neurotoxicology and Teratology 32 (2010) 460–471
obtained with a camera mounted on an inversed light microscope(Olympus IX81, magnification 2.5×). Subsequently, mobility of eachembryo was evaluated by means of the EthoVision software (Noldus,Wageningen, The Netherlands). Movie files were evaluated at asample rate of five frames per second and detection occurred based ongray values of the embryo. For each embryo, a separate arena wasdefined around the embryo and optimal detection variables (low andhigh limit for gray values) were set as to guarantee optimal detection.EthoVision detected the changing status of individual pixels occurringbetween two subsequent samples. The thresholds for the detection oftail coilings, defined as strong mobility, and total immobility were setby verifying concordance between EthoVision output and visualassessment of the number of spontaneous tail coilings. Intermediatechanges of pixels, which did not correspond to strong mobility, nortotal immobility, were defined as ‘mobility’.
After evaluation of movie files for mobility of each embryo, rawdata and values for frequency and total duration of the different statesof mobility (immobile, mobile, strong mobile) for each individualwere exported from EthoVision. Based on raw data, a quality controlcheck was performed before analysis. The raw data included the totalsurface area (the number of pixels which had a gray value within thedefined range) and the changed surface area (number of pixels withchanged status) for each sample. The ratio changed surface area / totalsurface area was plotted against time for the total duration of the trialand for each embryo. Quality of the data for each embryowas assessedvisually based on those plots which had to comply with criteriadefined in advance. Tracks from embryos which did not met thosecriteria were discarded from the final dataset. Furthermore, due to theoccasional presence of missing samples, the exact total duration of thetracks was calculated as the sum of the total duration of immobility,mobility and strong mobility. Values for frequency and total durationof the tail coilings (=strong mobility only) were normalized to theexact duration of the tracks instead of the theoretical 300 s. Furtheranalysis was performed on the normalized data.
2.5. Zebrafish larval locomotor activity assay
Within 2 hpf, zebrafish embryos were placed in 6-well platescontaining either a 0.1% DMSO solution (vehicle control) or a CPFsolution. A series offive concentrations of CPFwas tested, starting at theHNTCat 144 hpf (see Results, Section 3.1) and further diluted by a factorof 2. Each treatment group, consisting of minimum 60 embryos, had acorresponding vehicle control group. After exposure, embryos wereplaced at 28.5±0.5 °C in a temperature and light controlled incubatorwitha constant light–dark (14–10 h)cycle. Startingat6 hpf, fertilizationsuccess was assessed and fertilized embryos were placed in a 48-wellplate with flat bottom (Iwaki brand, Asahi Glass Co., LTD, Japan), oneembryo per well in 1 ml of solution, corresponding to the treatmentgroup in the 6-well plates. Two 48-well plates were used for eachconcentration tested, and they each contained 24 control as well as 24exposed embryos. Exposure was continuous, the plates were coveredwith sealing tape to minimize volatilization and solutions were notrenewed. Embryos were allowed to hatch within the plates and larvaewere allowed to use up the remainder of their yolk and were leftundisturbed without external feeding in the incubator until theirswimming activity was assessed.
Prior to the assessment of the swimming activity of the larvae, theywere screened for teratogenic effects, as described above. Larvaewhich displayed malformations, although in low numbers as thehighest test concentration was the HNTC at 144 hpf, were excludedfor locomotor analysis.
In order to select an optimal observation condition, the swimmingactivity of larvae was evaluated at consecutive ages of 96, 120, 144,168 and 192 hpf for the same individuals. This was achieved usingmovie files (mpeg 2) with a duration of 5 min obtained with theTracksys Tower Filming System (www.tracksys.co.uk). This equip-
ment was composed of an infra-red light source, a high resolutiondigital infrared video camera (at a maximum of 25 frames per second)and a hood to exclude external light. Well plates were placed underthe hood and recording was started immediately. Subsequently,measurement of the swimming activity was performed with theEthoVision locomotion tracking software at 25 frames per second.Swimming movements were captured within predefined arenas (onearena corresponded to one well, with an internal diameter approx-imating 10 mm), by means of subtraction (i.e. differences in contrastbetween samples of the movie and a single reference image from thatmovie). For each movie file, the detection variables were set as toguarantee optimal detection of all larvae. After tracking, a qualitycontrol measure was applied as wells showing incorrect tracking (e.g.detection of the edge of the well instead of the larva) were discardedfrom the final dataset. Thereafter, the EthoVision software analyzedthe data and provided values for activity parameters, characterizingthe swimming activity of each individual.
2.6. Data analysis
2.6.1. Data handlingFor each concentration tested in the embryo assays, three indepen-
dent experiments were performed with corresponding control condi-tions. The data obtained for the mobility status of embryos from allseparate experiments were normalized and then combined as toconstitute a complete concentration series. In this way, three data setsi.e. concentration series were created to be handled as three exper-imental runs. As the output from the larval swimming assays containedconcentration series in each experiment, this remained unchanged.
Outliers were removed from each of the datasets, where outlierswere defined as measured values that were not within the rangemean ±2⁎standard deviation of the mean (range 0–8.3% outlierspresent/dataset).
2.6.2. Quantification of effectThe quantification of exposure effect on an activity parameter x, was
established as follows. Consider the distributions of a large sample ofcontrol individuals (C) and exposed individuals (E), as shown for ahypothetical example in Fig. 1A. In this study, we used the overlap area(OA) of the two distributions as a measure for the exposure effect(Fig. 1D). In this sectionwe will show that the OA is a meaningful effectmeasure since it is directly related to theminimal classification error of aBayesian classification model with a flat prior distribution.
In this approach we recognize that the separation of the twodistributions in Fig. 1A, is related to the ability to make a classificationmodel from this data. Suppose one is presented a sample of newindividuals togetherwith their activity parameters x, butwith unknownE or C. How can one build a classificationmodel with aminimal averageerror in allocating these animals to E or C based on x?
First, for notational simplicity assume that a classifier can beidentified with the choice of one threshold value xT (see Fig. 1B), then
the probability of misclassification is written as Perror=∫−∞
xτ
P(x,C)dx+
∫xτ
+∞P(x,E)dxwhich is the sum of the probability to allocate an individual
to Ewhile it is C and vice versa. Here P(x,E),P(x,C) is the joint probabilitythat an individual has activity parameter x and is E or C respectively.Next denote the class-conditional probabilities as P(x|E), P(x|C) whichcorrespond to the two probability distributions from Fig. 1A and canbe estimated from experiments with known E and C samples. Nextwe assume tohavenoprior knowledge on an individual that needs to beclassified, hence the a priori probability is equal: P(E)=P(C)=1/2, i.e. aflat prior distribution. Since P(x, E)=P(x|E)·P(E), P(x, C)=P(x|C)·P(C)
one gets Perror =12½ ∫
xτ
−∞PðxjCÞdx + ∫
+ ∞
xτPðxjEÞdx�which is one half of
the shaded area shown in Fig. 1C. Next Perror can be minimized using
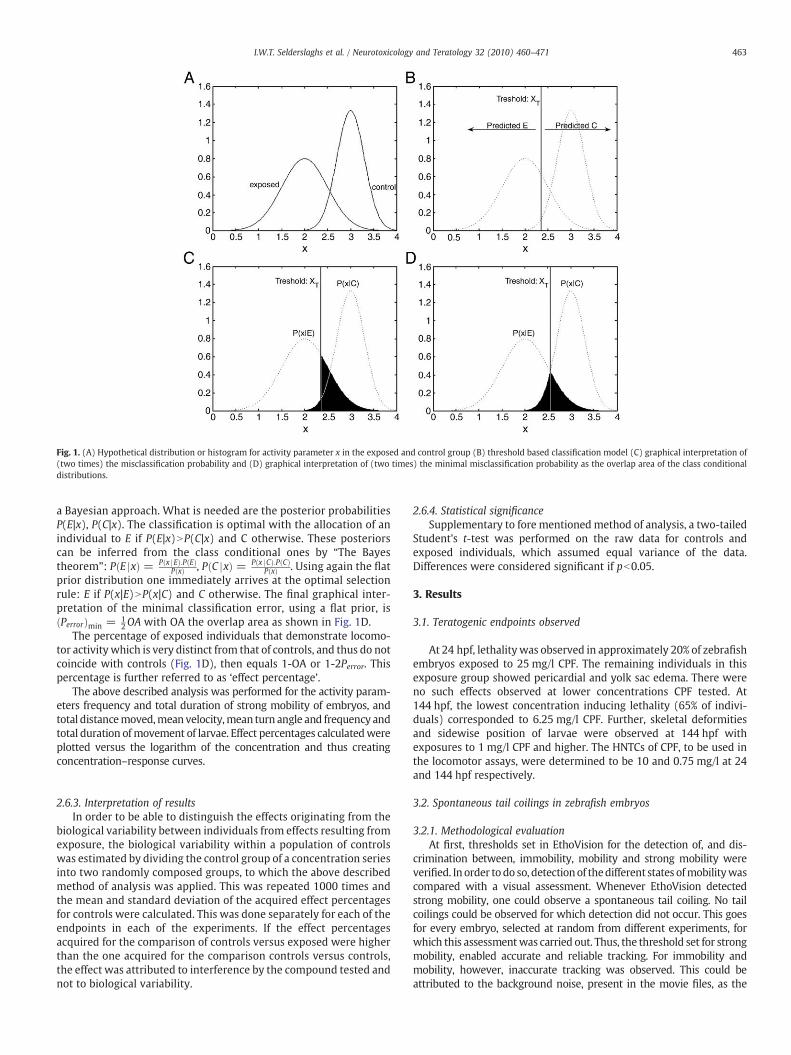
Fig. 1. (A) Hypothetical distribution or histogram for activity parameter x in the exposed and control group (B) threshold based classification model (C) graphical interpretation of(two times) the misclassification probability and (D) graphical interpretation of (two times) the minimal misclassification probability as the overlap area of the class conditionaldistributions.
463I.W.T. Selderslaghs et al. / Neurotoxicology and Teratology 32 (2010) 460–471
a Bayesian approach. What is needed are the posterior probabilitiesP(E|x), P(C|x). The classification is optimal with the allocation of anindividual to E if P(E|x)NP(C|x) and C otherwise. These posteriorscan be inferred from the class conditional ones by “The Bayestheorem”: P E jxð Þ = P x jEð Þ:P Eð Þ
P xð Þ , P C jxð Þ = P x jCð Þ:P Cð ÞP xð Þ . Using again the flat
prior distribution one immediately arrives at the optimal selectionrule: E if P(x|E)NP(x|C) and C otherwise. The final graphical inter-pretation of the minimal classification error, using a flat prior, isPerrorð Þmin = 1
2OA with OA the overlap area as shown in Fig. 1D.The percentage of exposed individuals that demonstrate locomo-
tor activity which is very distinct from that of controls, and thus do notcoincide with controls (Fig. 1D), then equals 1-OA or 1-2Perror. Thispercentage is further referred to as ‘effect percentage’.
The above described analysis was performed for the activity param-eters frequency and total duration of strong mobility of embryos, andtotal distancemoved,mean velocity,mean turn angle and frequency andtotal duration ofmovement of larvae. Effect percentages calculatedwereplotted versus the logarithm of the concentration and thus creatingconcentration–response curves.
2.6.3. Interpretation of resultsIn order to be able to distinguish the effects originating from the
biological variability between individuals from effects resulting fromexposure, the biological variability within a population of controlswas estimated by dividing the control group of a concentration seriesinto two randomly composed groups, to which the above describedmethod of analysis was applied. This was repeated 1000 times andthe mean and standard deviation of the acquired effect percentagesfor controls were calculated. This was done separately for each of theendpoints in each of the experiments. If the effect percentagesacquired for the comparison of controls versus exposed were higherthan the one acquired for the comparison controls versus controls,the effect was attributed to interference by the compound tested andnot to biological variability.
2.6.4. Statistical significanceSupplementary to fore mentionedmethod of analysis, a two-tailed
Student's t-test was performed on the raw data for controls andexposed individuals, which assumed equal variance of the data.Differences were considered significant if pb0.05.
3. Results
3.1. Teratogenic endpoints observed
At 24 hpf, lethalitywas observed in approximately 20% of zebrafishembryos exposed to 25 mg/l CPF. The remaining individuals in thisexposure group showed pericardial and yolk sac edema. There wereno such effects observed at lower concentrations CPF tested. At144 hpf, the lowest concentration inducing lethality (65% of indivi-duals) corresponded to 6.25 mg/l CPF. Further, skeletal deformitiesand sidewise position of larvae were observed at 144 hpf withexposures to 1 mg/l CPF and higher. The HNTCs of CPF, to be used inthe locomotor assays, were determined to be 10 and 0.75 mg/l at 24and 144 hpf respectively.
3.2. Spontaneous tail coilings in zebrafish embryos
3.2.1. Methodological evaluationAt first, thresholds set in EthoVision for the detection of, and dis-
crimination between, immobility, mobility and strong mobility wereverified. In order to do so, detectionof thedifferent states ofmobilitywascompared with a visual assessment. Whenever EthoVision detectedstrong mobility, one could observe a spontaneous tail coiling. No tailcoilings could be observed for which detection did not occur. This goesfor every embryo, selected at random from different experiments, forwhich this assessmentwas carried out. Thus, the threshold set for strongmobility, enabled accurate and reliable tracking. For immobility andmobility, however, inaccurate tracking was observed. This could beattributed to the background noise, present in the movie files, as the
464 I.W.T. Selderslaghs et al. / Neurotoxicology and Teratology 32 (2010) 460–471
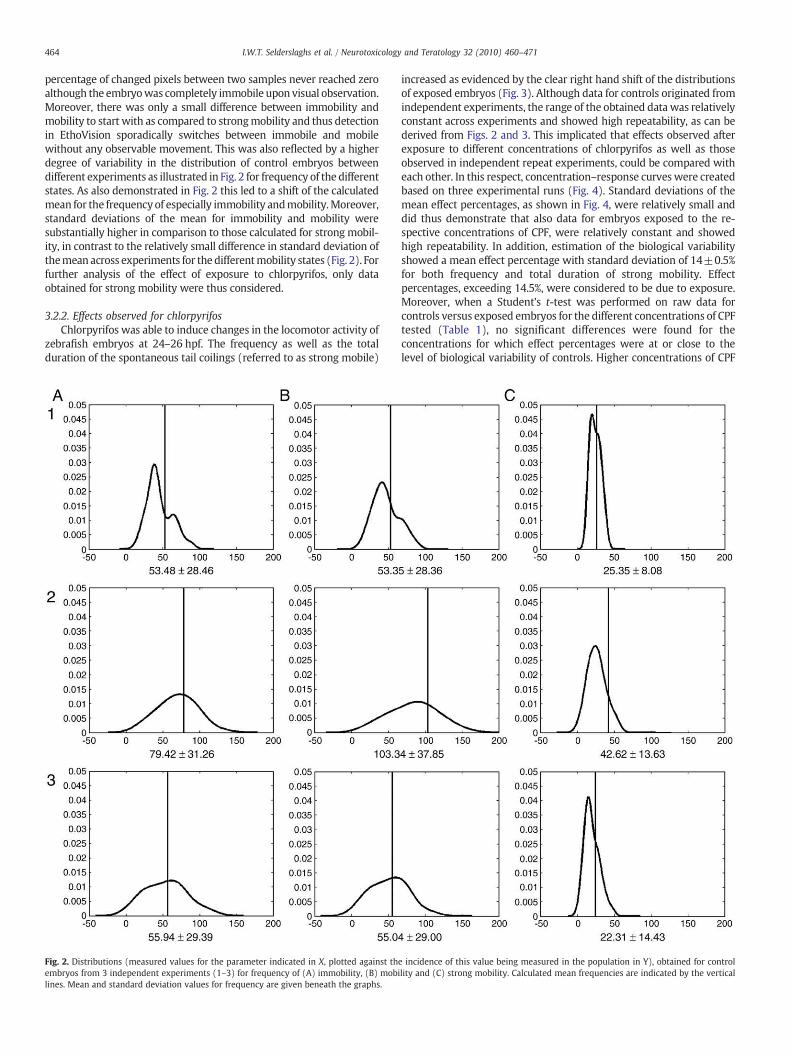
percentage of changed pixels between two samples never reached zeroalthough the embryowas completely immobile upon visual observation.Moreover, there was only a small difference between immobility andmobility to start with as compared to strongmobility and thus detectionin EthoVision sporadically switches between immobile and mobilewithout any observable movement. This was also reflected by a higherdegree of variability in the distribution of control embryos betweendifferent experiments as illustrated in Fig. 2 for frequency of the differentstates. As also demonstrated in Fig. 2 this led to a shift of the calculatedmean for the frequency of especially immobility andmobility.Moreover,standard deviations of the mean for immobility and mobility weresubstantially higher in comparison to those calculated for strong mobil-ity, in contrast to the relatively small difference in standard deviation ofthemeanacross experiments for the differentmobility states (Fig. 2). Forfurther analysis of the effect of exposure to chlorpyrifos, only dataobtained for strong mobility were thus considered.
3.2.2. Effects observed for chlorpyrifosChlorpyrifos was able to induce changes in the locomotor activity of
zebrafish embryos at 24–26 hpf. The frequency as well as the totalduration of the spontaneous tail coilings (referred to as strong mobile)
Fig. 2. Distributions (measured values for the parameter indicated in X, plotted against thembryos from 3 independent experiments (1–3) for frequency of (A) immobility, (B) mobilines. Mean and standard deviation values for frequency are given beneath the graphs.
increased as evidenced by the clear right hand shift of the distributionsof exposed embryos (Fig. 3). Although data for controls originated fromindependent experiments, the range of the obtained data was relativelyconstant across experiments and showed high repeatability, as can bederived from Figs. 2 and 3. This implicated that effects observed afterexposure to different concentrations of chlorpyrifos as well as thoseobserved in independent repeat experiments, could be compared witheach other. In this respect, concentration–response curves were createdbased on three experimental runs (Fig. 4). Standard deviations of themean effect percentages, as shown in Fig. 4, were relatively small anddid thus demonstrate that also data for embryos exposed to the re-spective concentrations of CPF, were relatively constant and showedhigh repeatability. In addition, estimation of the biological variabilityshowed a mean effect percentage with standard deviation of 14±0.5%for both frequency and total duration of strong mobility. Effectpercentages, exceeding 14.5%, were considered to be due to exposure.Moreover, when a Student's t-test was performed on raw data forcontrols versus exposed embryos for the different concentrations of CPFtested (Table 1), no significant differences were found for theconcentrations for which effect percentages were at or close to thelevel of biological variability of controls. Higher concentrations of CPF
e incidence of this value being measured in the population in Y), obtained for controllity and (C) strong mobility. Calculated mean frequencies are indicated by the vertical
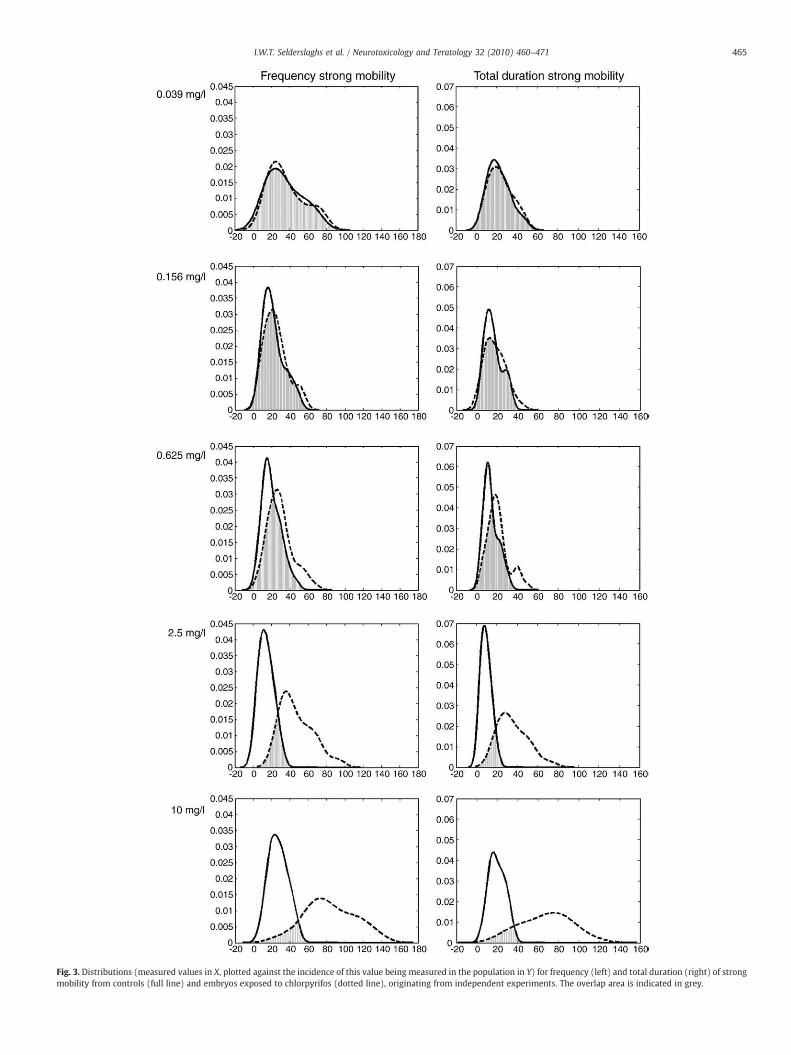
Fig. 3. Distributions (measured values in X, plotted against the incidence of this value being measured in the population in Y) for frequency (left) and total duration (right) of strongmobility from controls (full line) and embryos exposed to chlorpyrifos (dotted line), originating from independent experiments. The overlap area is indicated in grey.
465I.W.T. Selderslaghs et al. / Neurotoxicology and Teratology 32 (2010) 460–471
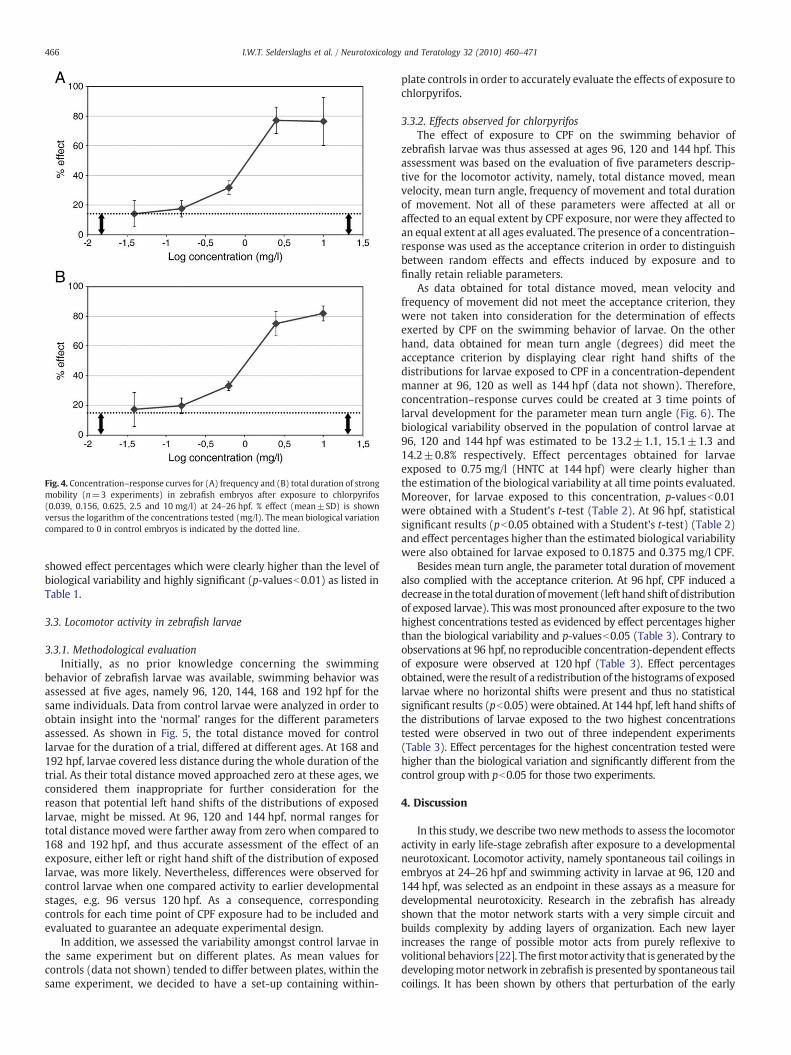
Fig. 4. Concentration–response curves for (A) frequency and (B) total duration of strongmobility (n=3 experiments) in zebrafish embryos after exposure to chlorpyrifos(0.039, 0.156, 0.625, 2.5 and 10 mg/l) at 24–26 hpf. % effect (mean±SD) is shownversus the logarithm of the concentrations tested (mg/l). The mean biological variationcompared to 0 in control embryos is indicated by the dotted line.
466 I.W.T. Selderslaghs et al. / Neurotoxicology and Teratology 32 (2010) 460–471
showed effect percentages which were clearly higher than the level ofbiological variability and highly significant (p-valuesb0.01) as listed inTable 1.
3.3. Locomotor activity in zebrafish larvae
3.3.1. Methodological evaluationInitially, as no prior knowledge concerning the swimming
behavior of zebrafish larvae was available, swimming behavior wasassessed at five ages, namely 96, 120, 144, 168 and 192 hpf for thesame individuals. Data from control larvae were analyzed in order toobtain insight into the ‘normal’ ranges for the different parametersassessed. As shown in Fig. 5, the total distance moved for controllarvae for the duration of a trial, differed at different ages. At 168 and192 hpf, larvae covered less distance during the whole duration of thetrial. As their total distance moved approached zero at these ages, weconsidered them inappropriate for further consideration for thereason that potential left hand shifts of the distributions of exposedlarvae, might be missed. At 96, 120 and 144 hpf, normal ranges fortotal distance moved were farther away from zero when compared to168 and 192 hpf, and thus accurate assessment of the effect of anexposure, either left or right hand shift of the distribution of exposedlarvae, was more likely. Nevertheless, differences were observed forcontrol larvae when one compared activity to earlier developmentalstages, e.g. 96 versus 120 hpf. As a consequence, correspondingcontrols for each time point of CPF exposure had to be included andevaluated to guarantee an adequate experimental design.
In addition, we assessed the variability amongst control larvae inthe same experiment but on different plates. As mean values forcontrols (data not shown) tended to differ between plates, within thesame experiment, we decided to have a set-up containing within-
plate controls in order to accurately evaluate the effects of exposure tochlorpyrifos.
3.3.2. Effects observed for chlorpyrifosThe effect of exposure to CPF on the swimming behavior of
zebrafish larvae was thus assessed at ages 96, 120 and 144 hpf. Thisassessment was based on the evaluation of five parameters descrip-tive for the locomotor activity, namely, total distance moved, meanvelocity, mean turn angle, frequency of movement and total durationof movement. Not all of these parameters were affected at all oraffected to an equal extent by CPF exposure, nor were they affected toan equal extent at all ages evaluated. The presence of a concentration–response was used as the acceptance criterion in order to distinguishbetween random effects and effects induced by exposure and tofinally retain reliable parameters.
As data obtained for total distance moved, mean velocity andfrequency of movement did not meet the acceptance criterion, theywere not taken into consideration for the determination of effectsexerted by CPF on the swimming behavior of larvae. On the otherhand, data obtained for mean turn angle (degrees) did meet theacceptance criterion by displaying clear right hand shifts of thedistributions for larvae exposed to CPF in a concentration-dependentmanner at 96, 120 as well as 144 hpf (data not shown). Therefore,concentration–response curves could be created at 3 time points oflarval development for the parameter mean turn angle (Fig. 6). Thebiological variability observed in the population of control larvae at96, 120 and 144 hpf was estimated to be 13.2±1.1, 15.1±1.3 and14.2±0.8% respectively. Effect percentages obtained for larvaeexposed to 0.75 mg/l (HNTC at 144 hpf) were clearly higher thanthe estimation of the biological variability at all time points evaluated.Moreover, for larvae exposed to this concentration, p-valuesb0.01were obtained with a Student's t-test (Table 2). At 96 hpf, statisticalsignificant results (pb0.05 obtained with a Student's t-test) (Table 2)and effect percentages higher than the estimated biological variabilitywere also obtained for larvae exposed to 0.1875 and 0.375 mg/l CPF.
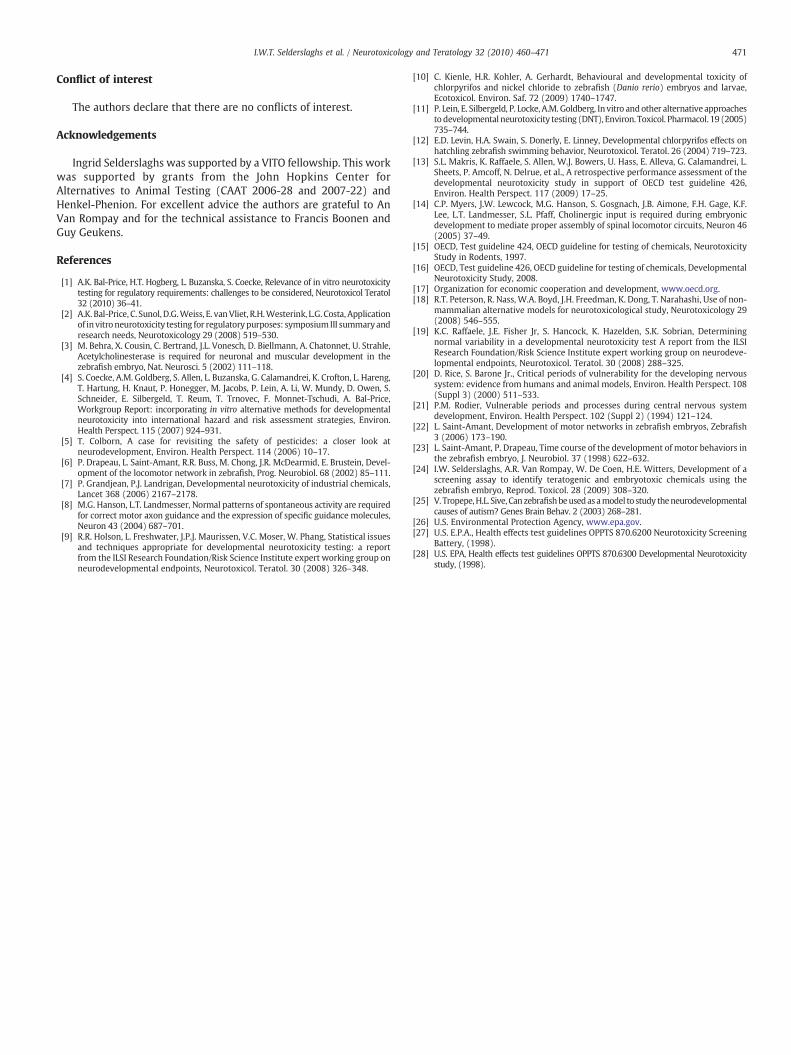
Besides mean turn angle, the parameter total duration of movementalso complied with the acceptance criterion. At 96 hpf, CPF induced adecrease in the total durationofmovement (left hand shift of distributionof exposed larvae). This wasmost pronounced after exposure to the twohighest concentrations tested as evidenced by effect percentages higherthan the biological variability and p-valuesb0.05 (Table 3). Contrary toobservations at 96 hpf, no reproducible concentration-dependent effectsof exposure were observed at 120 hpf (Table 3). Effect percentagesobtained,were the result of a redistribution of the histograms of exposedlarvae where no horizontal shifts were present and thus no statisticalsignificant results (pb0.05) were obtained. At 144 hpf, left hand shifts ofthe distributions of larvae exposed to the two highest concentrationstested were observed in two out of three independent experiments(Table 3). Effect percentages for the highest concentration tested werehigher than the biological variation and significantly different from thecontrol group with pb0.05 for those two experiments.
4. Discussion
In this study, we describe two newmethods to assess the locomotoractivity in early life-stage zebrafish after exposure to a developmentalneurotoxicant. Locomotor activity, namely spontaneous tail coilings inembryos at 24–26 hpf and swimming activity in larvae at 96, 120 and144 hpf, was selected as an endpoint in these assays as a measure fordevelopmental neurotoxicity. Research in the zebrafish has alreadyshown that the motor network starts with a very simple circuit andbuilds complexity by adding layers of organization. Each new layerincreases the range of possible motor acts from purely reflexive tovolitional behaviors [22]. Thefirstmotor activity that is generated by thedevelopingmotor network in zebrafish is presented by spontaneous tailcoilings. It has been shown by others that perturbation of the early
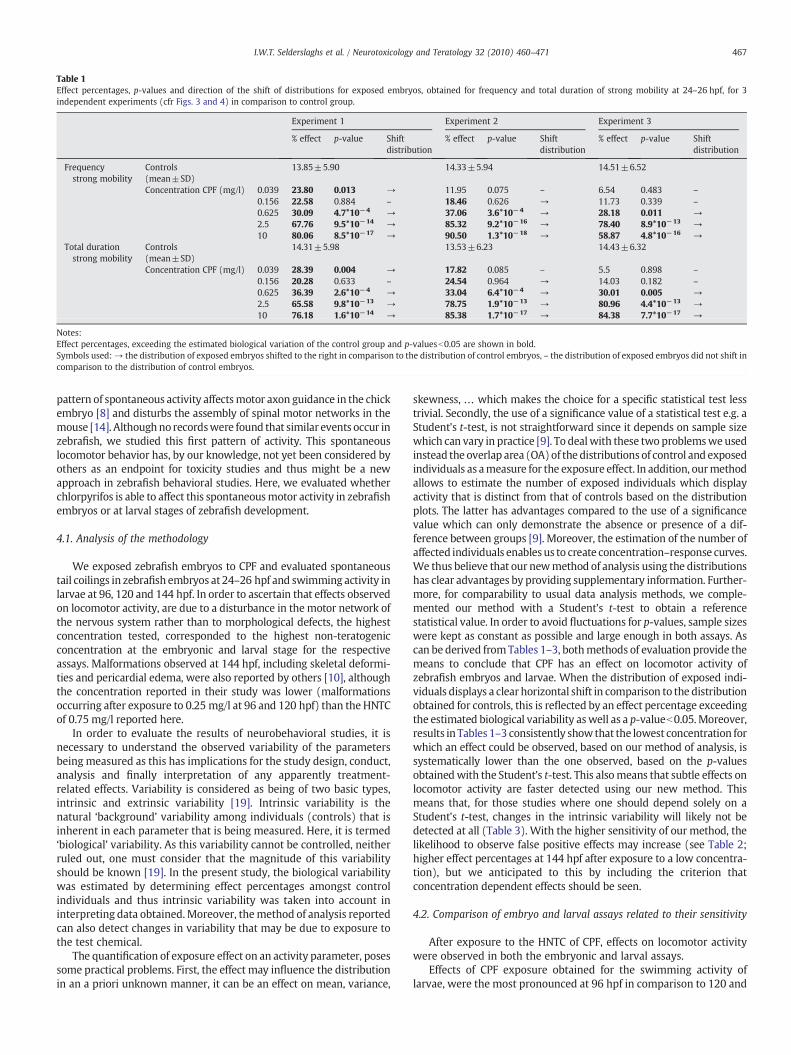
Table 1Effect percentages, p-values and direction of the shift of distributions for exposed embryos, obtained for frequency and total duration of strong mobility at 24–26 hpf, for 3independent experiments (cfr Figs. 3 and 4) in comparison to control group.
Experiment 1 Experiment 2 Experiment 3
% effect p-value Shiftdistribution
% effect p-value Shiftdistribution
% effect p-value Shiftdistribution
Frequencystrong mobility
Controls(mean±SD)
13.85±5.90 14.33±5.94 14.51±6.52
Concentration CPF (mg/l) 0.039 23.80 0.013 → 11.95 0.075 – 6.54 0.483 –
0.156 22.58 0.884 – 18.46 0.626 → 11.73 0.339 –
0.625 30.09 4.7*10−4 → 37.06 3.6*10−4 → 28.18 0.011 →2.5 67.76 9.5*10−14 → 85.32 9.2*10−16 → 78.40 8.9*10−13 →10 80.06 8.5*10−17 → 90.50 1.3*10−18 → 58.87 4.8*10−16 →
Total durationstrong mobility
Controls(mean±SD)
14.31±5.98 13.53±6.23 14.43±6.32
Concentration CPF (mg/l) 0.039 28.39 0.004 → 17.82 0.085 – 5.5 0.898 –
0.156 20.28 0.633 – 24.54 0.964 → 14.03 0.182 –
0.625 36.39 2.6*10−4 → 33.04 6.4*10−4 → 30.01 0.005 →2.5 65.58 9.8*10−13 → 78.75 1.9*10−13 → 80.96 4.4*10−13 →10 76.18 1.6*10−14 → 85.38 1.7*10−17 → 84.38 7.7*10−17 →
Notes:Effect percentages, exceeding the estimated biological variation of the control group and p-valuesb0.05 are shown in bold.Symbols used:→ the distribution of exposed embryos shifted to the right in comparison to the distribution of control embryos, – the distribution of exposed embryos did not shift incomparison to the distribution of control embryos.
467I.W.T. Selderslaghs et al. / Neurotoxicology and Teratology 32 (2010) 460–471
pattern of spontaneous activity affectsmotor axon guidance in the chickembryo [8] and disturbs the assembly of spinal motor networks in themouse [14]. Althoughno recordswere found that similar events occur inzebrafish, we studied this first pattern of activity. This spontaneouslocomotor behavior has, by our knowledge, not yet been considered byothers as an endpoint for toxicity studies and thus might be a newapproach in zebrafish behavioral studies. Here, we evaluated whetherchlorpyrifos is able to affect this spontaneousmotor activity in zebrafishembryos or at larval stages of zebrafish development.
4.1. Analysis of the methodology
We exposed zebrafish embryos to CPF and evaluated spontaneoustail coilings in zebrafish embryos at 24–26 hpf and swimming activity inlarvae at 96, 120 and 144 hpf. In order to ascertain that effects observedon locomotor activity, are due to a disturbance in themotor network ofthe nervous system rather than to morphological defects, the highestconcentration tested, corresponded to the highest non-teratogenicconcentration at the embryonic and larval stage for the respectiveassays. Malformations observed at 144 hpf, including skeletal deformi-ties and pericardial edema, were also reported by others [10], althoughthe concentration reported in their study was lower (malformationsoccurring after exposure to 0.25 mg/l at 96 and 120 hpf) than the HNTCof 0.75 mg/l reported here.
In order to evaluate the results of neurobehavioral studies, it isnecessary to understand the observed variability of the parametersbeing measured as this has implications for the study design, conduct,analysis and finally interpretation of any apparently treatment-related effects. Variability is considered as being of two basic types,intrinsic and extrinsic variability [19]. Intrinsic variability is thenatural ‘background’ variability among individuals (controls) that isinherent in each parameter that is being measured. Here, it is termed‘biological’ variability. As this variability cannot be controlled, neitherruled out, one must consider that the magnitude of this variabilityshould be known [19]. In the present study, the biological variabilitywas estimated by determining effect percentages amongst controlindividuals and thus intrinsic variability was taken into account ininterpreting data obtained. Moreover, themethod of analysis reportedcan also detect changes in variability that may be due to exposure tothe test chemical.
The quantification of exposure effect on an activity parameter, posessome practical problems. First, the effect may influence the distributionin an a priori unknown manner, it can be an effect on mean, variance,
skewness, … which makes the choice for a specific statistical test lesstrivial. Secondly, the use of a significance value of a statistical test e.g. aStudent's t-test, is not straightforward since it depends on sample sizewhich can vary in practice [9]. To dealwith these two problemsweusedinstead the overlap area (OA)of the distributions of control and exposedindividuals as ameasure for the exposure effect. In addition, ourmethodallows to estimate the number of exposed individuals which displayactivity that is distinct from that of controls based on the distributionplots. The latter has advantages compared to the use of a significancevalue which can only demonstrate the absence or presence of a dif-ference between groups [9]. Moreover, the estimation of the number ofaffected individuals enablesus to create concentration–response curves.We thus believe that our newmethod of analysis using the distributionshas clear advantages by providing supplementary information. Further-more, for comparability to usual data analysis methods, we comple-mented our method with a Student's t-test to obtain a referencestatistical value. In order to avoid fluctuations for p-values, sample sizeswere kept as constant as possible and large enough in both assays. Ascan be derived fromTables 1–3, bothmethods of evaluation provide themeans to conclude that CPF has an effect on locomotor activity ofzebrafish embryos and larvae. When the distribution of exposed indi-viduals displays a clear horizontal shift in comparison to the distributionobtained for controls, this is reflected by an effect percentage exceedingthe estimated biological variability aswell as a p-valueb0.05.Moreover,results in Tables 1–3 consistently show that the lowest concentration forwhich an effect could be observed, based on our method of analysis, issystematically lower than the one observed, based on the p-valuesobtainedwith the Student's t-test. This alsomeans that subtle effects onlocomotor activity are faster detected using our new method. Thismeans that, for those studies where one should depend solely on aStudent's t-test, changes in the intrinsic variability will likely not bedetected at all (Table 3). With the higher sensitivity of our method, thelikelihood to observe false positive effects may increase (see Table 2;higher effect percentages at 144 hpf after exposure to a low concentra-tion), but we anticipated to this by including the criterion thatconcentration dependent effects should be seen.
4.2. Comparison of embryo and larval assays related to their sensitivity
After exposure to the HNTC of CPF, effects on locomotor activitywere observed in both the embryonic and larval assays.
Effects of CPF exposure obtained for the swimming activity oflarvae, were the most pronounced at 96 hpf in comparison to 120 and
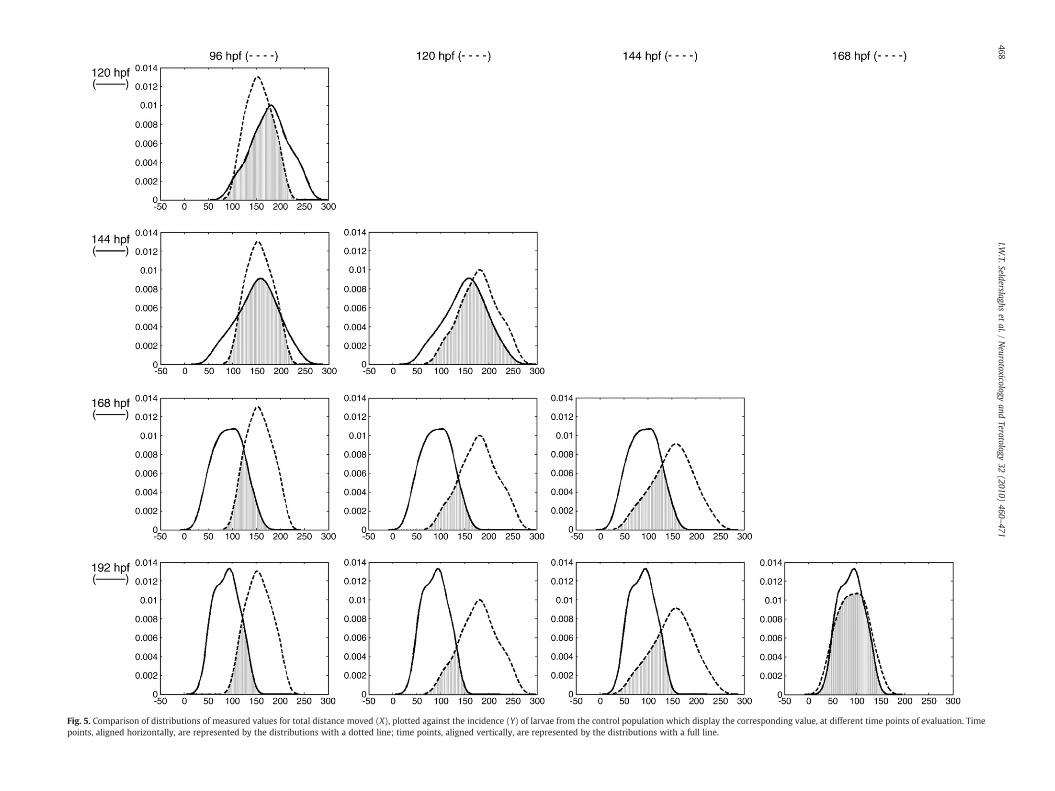
Fig. 5. Comparison of distributions of measured values for total distance moved (X), plotted against the incidence (Y) of larvae from the control population which display the corresponding value, at different time points of evaluation. Timepoints, aligned horizontally, are represented by the distributions with a dotted line; time points, aligned vertically, are represented by the distributions with a full line.
468I.W
.T.Selderslaghset
al./Neurotoxicology
andTeratology
32(2010)
460–471
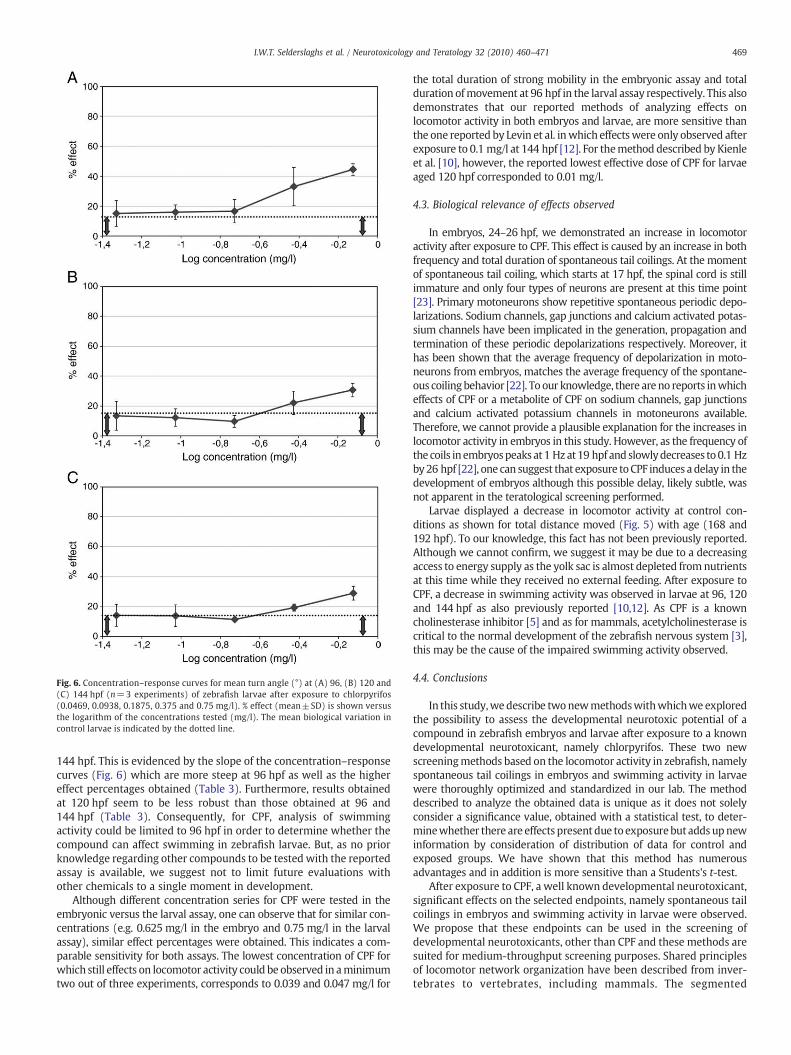
Fig. 6. Concentration–response curves for mean turn angle (°) at (A) 96, (B) 120 and(C) 144 hpf (n=3 experiments) of zebrafish larvae after exposure to chlorpyrifos(0.0469, 0.0938, 0.1875, 0.375 and 0.75 mg/l). % effect (mean±SD) is shown versusthe logarithm of the concentrations tested (mg/l). The mean biological variation incontrol larvae is indicated by the dotted line.
469I.W.T. Selderslaghs et al. / Neurotoxicology and Teratology 32 (2010) 460–471
144 hpf. This is evidenced by the slope of the concentration–responsecurves (Fig. 6) which are more steep at 96 hpf as well as the highereffect percentages obtained (Table 3). Furthermore, results obtainedat 120 hpf seem to be less robust than those obtained at 96 and144 hpf (Table 3). Consequently, for CPF, analysis of swimmingactivity could be limited to 96 hpf in order to determine whether thecompound can affect swimming in zebrafish larvae. But, as no priorknowledge regarding other compounds to be tested with the reportedassay is available, we suggest not to limit future evaluations withother chemicals to a single moment in development.
Although different concentration series for CPF were tested in theembryonic versus the larval assay, one can observe that for similar con-centrations (e.g. 0.625 mg/l in the embryo and 0.75 mg/l in the larvalassay), similar effect percentages were obtained. This indicates a com-parable sensitivity for both assays. The lowest concentration of CPF forwhich still effects on locomotor activity could be observed in aminimumtwo out of three experiments, corresponds to 0.039 and 0.047 mg/l for
the total duration of strong mobility in the embryonic assay and totalduration ofmovement at 96 hpf in the larval assay respectively. This alsodemonstrates that our reported methods of analyzing effects onlocomotor activity in both embryos and larvae, are more sensitive thanthe one reported by Levin et al. inwhich effectswere only observed afterexposure to 0.1 mg/l at 144 hpf [12]. For themethod described by Kienleet al. [10], however, the reported lowest effective dose of CPF for larvaeaged 120 hpf corresponded to 0.01 mg/l.
4.3. Biological relevance of effects observed
In embryos, 24–26 hpf, we demonstrated an increase in locomotoractivity after exposure to CPF. This effect is caused by an increase in bothfrequency and total duration of spontaneous tail coilings. At the momentof spontaneous tail coiling, which starts at 17 hpf, the spinal cord is stillimmature and only four types of neurons are present at this time point[23]. Primary motoneurons show repetitive spontaneous periodic depo-larizations. Sodium channels, gap junctions and calcium activated potas-sium channels have been implicated in the generation, propagation andtermination of these periodic depolarizations respectively. Moreover, ithas been shown that the average frequency of depolarization in moto-neurons from embryos, matches the average frequency of the spontane-ous coiling behavior [22]. To our knowledge, there areno reports inwhicheffects of CPF or a metabolite of CPF on sodium channels, gap junctionsand calcium activated potassium channels in motoneurons available.Therefore, we cannot provide a plausible explanation for the increases inlocomotor activity in embryos in this study. However, as the frequency ofthe coils in embryospeaks at 1 Hzat19 hpf and slowlydecreases to0.1 Hzby26 hpf [22], one can suggest that exposure toCPF induces a delay in thedevelopment of embryos although this possible delay, likely subtle, wasnot apparent in the teratological screening performed.
Larvae displayed a decrease in locomotor activity at control con-ditions as shown for total distance moved (Fig. 5) with age (168 and192 hpf). To our knowledge, this fact has not been previously reported.Although we cannot confirm, we suggest it may be due to a decreasingaccess to energy supply as the yolk sac is almost depleted fromnutrientsat this time while they received no external feeding. After exposure toCPF, a decrease in swimming activity was observed in larvae at 96, 120and 144 hpf as also previously reported [10,12]. As CPF is a knowncholinesterase inhibitor [5] and as for mammals, acetylcholinesterase iscritical to the normal development of the zebrafish nervous system [3],this may be the cause of the impaired swimming activity observed.
4.4. Conclusions
In this study,wedescribe twonewmethodswithwhichwe exploredthe possibility to assess the developmental neurotoxic potential of acompound in zebrafish embryos and larvae after exposure to a knowndevelopmental neurotoxicant, namely chlorpyrifos. These two newscreeningmethods based on the locomotor activity in zebrafish, namelyspontaneous tail coilings in embryos and swimming activity in larvaewere thoroughly optimized and standardized in our lab. The methoddescribed to analyze the obtained data is unique as it does not solelyconsider a significance value, obtained with a statistical test, to deter-minewhether there are effects present due to exposurebut adds upnewinformation by consideration of distribution of data for control andexposed groups. We have shown that this method has numerousadvantages and in addition is more sensitive than a Students's t-test.
After exposure to CPF, a well known developmental neurotoxicant,significant effects on the selected endpoints, namely spontaneous tailcoilings in embryos and swimming activity in larvae were observed.We propose that these endpoints can be used in the screening ofdevelopmental neurotoxicants, other than CPF and these methods aresuited for medium-throughput screening purposes. Shared principlesof locomotor network organization have been described from inver-tebrates to vertebrates, including mammals. The segmented
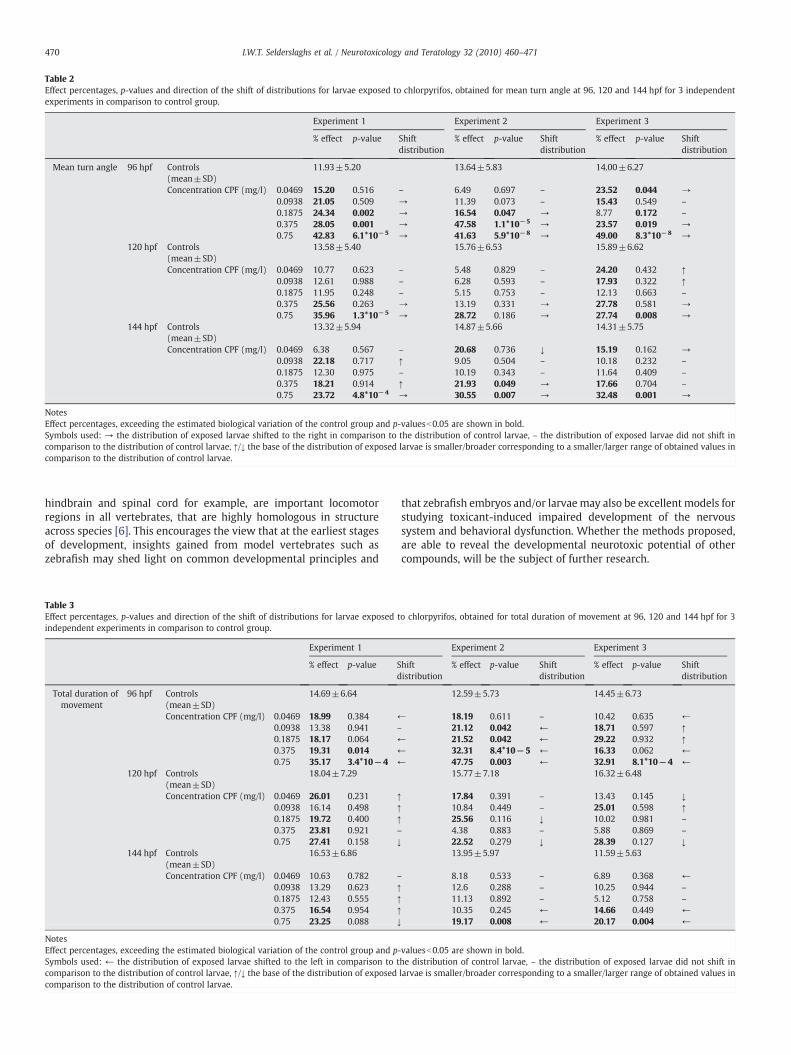
Table 2Effect percentages, p-values and direction of the shift of distributions for larvae exposed to chlorpyrifos, obtained for mean turn angle at 96, 120 and 144 hpf for 3 independentexperiments in comparison to control group.
Experiment 1 Experiment 2 Experiment 3
% effect p-value Shiftdistribution
% effect p-value Shiftdistribution
% effect p-value Shiftdistribution
Mean turn angle 96 hpf Controls(mean±SD)
11.93±5.20 13.64±5.83 14.00±6.27
Concentration CPF (mg/l) 0.0469 15.20 0.516 – 6.49 0.697 – 23.52 0.044 →0.0938 21.05 0.509 → 11.39 0.073 – 15.43 0.549 –
0.1875 24.34 0.002 → 16.54 0.047 → 8.77 0.172 –
0.375 28.05 0.001 → 47.58 1.1*10−5 → 23.57 0.019 →0.75 42.83 6.1*10−5 → 41.63 5.9*10−8 → 49.00 8.3*10−8 →
120 hpf Controls(mean±SD)
13.58±5.40 15.76±6.53 15.89±6.62
Concentration CPF (mg/l) 0.0469 10.77 0.623 – 5.48 0.829 – 24.20 0.432 ↑0.0938 12.61 0.988 – 6.28 0.593 – 17.93 0.322 ↑0.1875 11.95 0.248 – 5.15 0.753 – 12.13 0.663 –
0.375 25.56 0.263 → 13.19 0.331 → 27.78 0.581 →0.75 35.96 1.3*10−5 → 28.72 0.186 → 27.74 0.008 →
144 hpf Controls(mean±SD)
13.32±5.94 14.87±5.66 14.31±5.75
Concentration CPF (mg/l) 0.0469 6.38 0.567 – 20.68 0.736 ↓ 15.19 0.162 →0.0938 22.18 0.717 ↑ 9.05 0.504 – 10.18 0.232 –
0.1875 12.30 0.975 – 10.19 0.343 – 11.64 0.409 –
0.375 18.21 0.914 ↑ 21.93 0.049 → 17.66 0.704 –
0.75 23.72 4.8*10−4 → 30.55 0.007 → 32.48 0.001 →
NotesEffect percentages, exceeding the estimated biological variation of the control group and p-valuesb0.05 are shown in bold.Symbols used: → the distribution of exposed larvae shifted to the right in comparison to the distribution of control larvae, – the distribution of exposed larvae did not shift incomparison to the distribution of control larvae, ↑/↓ the base of the distribution of exposed larvae is smaller/broader corresponding to a smaller/larger range of obtained values incomparison to the distribution of control larvae.
470 I.W.T. Selderslaghs et al. / Neurotoxicology and Teratology 32 (2010) 460–471
hindbrain and spinal cord for example, are important locomotorregions in all vertebrates, that are highly homologous in structureacross species [6]. This encourages the view that at the earliest stagesof development, insights gained from model vertebrates such aszebrafish may shed light on common developmental principles and
Table 3Effect percentages, p-values and direction of the shift of distributions for larvae exposed tindependent experiments in comparison to control group.
Experiment 1
% effect p-value Sd
Total duration ofmovement
96 hpf Controls(mean±SD)
14.69±6.64
Concentration CPF (mg/l) 0.0469 18.99 0.384 ←0.0938 13.38 0.941 –
0.1875 18.17 0.064 ←0.375 19.31 0.014 ←0.75 35.17 3.4*10−4 ←
120 hpf Controls(mean±SD)
18.04±7.29
Concentration CPF (mg/l) 0.0469 26.01 0.231 ↑0.0938 16.14 0.498 ↑0.1875 19.72 0.400 ↑0.375 23.81 0.921 –
0.75 27.41 0.158 ↓144 hpf Controls
(mean±SD)16.53±6.86
Concentration CPF (mg/l) 0.0469 10.63 0.782 –
0.0938 13.29 0.623 ↑0.1875 12.43 0.555 ↑0.375 16.54 0.954 ↑0.75 23.25 0.088 ↓
NotesEffect percentages, exceeding the estimated biological variation of the control group and p-Symbols used: ← the distribution of exposed larvae shifted to the left in comparison to tcomparison to the distribution of control larvae, ↑/↓ the base of the distribution of exposedcomparison to the distribution of control larvae.
that zebrafish embryos and/or larvae may also be excellent models forstudying toxicant-induced impaired development of the nervoussystem and behavioral dysfunction. Whether the methods proposed,are able to reveal the developmental neurotoxic potential of othercompounds, will be the subject of further research.
o chlorpyrifos, obtained for total duration of movement at 96, 120 and 144 hpf for 3
Experiment 2 Experiment 3
hiftistribution
% effect p-value Shiftdistribution
% effect p-value Shiftdistribution
12.59±5.73 14.45±6.73
18.19 0.611 – 10.42 0.635 ←21.12 0.042 ← 18.71 0.597 ↑21.52 0.042 ← 29.22 0.932 ↑32.31 8.4*10−5 ← 16.33 0.062 ←47.75 0.003 ← 32.91 8.1*10−4 ←15.77±7.18 16.32±6.48
17.84 0.391 – 13.43 0.145 ↓10.84 0.449 – 25.01 0.598 ↑25.56 0.116 ↓ 10.02 0.981 –
4.38 0.883 – 5.88 0.869 –
22.52 0.279 ↓ 28.39 0.127 ↓13.95±5.97 11.59±5.63
8.18 0.533 – 6.89 0.368 ←12.6 0.288 – 10.25 0.944 –
11.13 0.892 – 5.12 0.758 –
10.35 0.245 ← 14.66 0.449 ←19.17 0.008 ← 20.17 0.004 ←
valuesb0.05 are shown in bold.he distribution of control larvae, – the distribution of exposed larvae did not shift inlarvae is smaller/broader corresponding to a smaller/larger range of obtained values in
471I.W.T. Selderslaghs et al. / Neurotoxicology and Teratology 32 (2010) 460–471
Conflict of interest
The authors declare that there are no conflicts of interest.
Acknowledgements
Ingrid Selderslaghs was supported by a VITO fellowship. This workwas supported by grants from the John Hopkins Center forAlternatives to Animal Testing (CAAT 2006-28 and 2007-22) andHenkel-Phenion. For excellent advice the authors are grateful to AnVan Rompay and for the technical assistance to Francis Boonen andGuy Geukens.
References
[1] A.K. Bal-Price, H.T. Hogberg, L. Buzanska, S. Coecke, Relevance of in vitro neurotoxicitytesting for regulatory requirements: challenges to be considered, Neurotoxicol Teratol32 (2010) 36–41.
[2] A.K. Bal-Price, C. Sunol,D.G.Weiss, E. vanVliet, R.H.Westerink, L.G. Costa, Applicationof in vitroneurotoxicity testing for regulatorypurposes: symposium III summaryandresearch needs, Neurotoxicology 29 (2008) 519–530.
[3] M. Behra, X. Cousin, C. Bertrand, J.L. Vonesch, D. Biellmann, A. Chatonnet, U. Strahle,Acetylcholinesterase is required for neuronal and muscular development in thezebrafish embryo, Nat. Neurosci. 5 (2002) 111–118.
[4] S. Coecke, A.M. Goldberg, S. Allen, L. Buzanska, G. Calamandrei, K. Crofton, L. Hareng,T. Hartung, H. Knaut, P. Honegger, M. Jacobs, P. Lein, A. Li, W. Mundy, D. Owen, S.Schneider, E. Silbergeld, T. Reum, T. Trnovec, F. Monnet-Tschudi, A. Bal-Price,Workgroup Report: incorporating in vitro alternative methods for developmentalneurotoxicity into international hazard and risk assessment strategies, Environ.Health Perspect. 115 (2007) 924–931.
[5] T. Colborn, A case for revisiting the safety of pesticides: a closer look atneurodevelopment, Environ. Health Perspect. 114 (2006) 10–17.
[6] P. Drapeau, L. Saint-Amant, R.R. Buss, M. Chong, J.R. McDearmid, E. Brustein, Devel-opment of the locomotor network in zebrafish, Prog. Neurobiol. 68 (2002) 85–111.
[7] P. Grandjean, P.J. Landrigan, Developmental neurotoxicity of industrial chemicals,Lancet 368 (2006) 2167–2178.
[8] M.G. Hanson, L.T. Landmesser, Normal patterns of spontaneous activity are requiredfor correct motor axon guidance and the expression of specific guidance molecules,Neuron 43 (2004) 687–701.
[9] R.R. Holson, L. Freshwater, J.P.J. Maurissen, V.C. Moser, W. Phang, Statistical issuesand techniques appropriate for developmental neurotoxicity testing: a reportfrom the ILSI Research Foundation/Risk Science Institute expert working group onneurodevelopmental endpoints, Neurotoxicol. Teratol. 30 (2008) 326–348.
[10] C. Kienle, H.R. Kohler, A. Gerhardt, Behavioural and developmental toxicity ofchlorpyrifos and nickel chloride to zebrafish (Danio rerio) embryos and larvae,Ecotoxicol. Environ. Saf. 72 (2009) 1740–1747.
[11] P. Lein, E. Silbergeld, P. Locke, A.M. Goldberg, In vitro andother alternative approachesto developmental neurotoxicity testing (DNT), Environ. Toxicol. Pharmacol. 19 (2005)735–744.
[12] E.D. Levin, H.A. Swain, S. Donerly, E. Linney, Developmental chlorpyrifos effects onhatchling zebrafish swimming behavior, Neurotoxicol. Teratol. 26 (2004) 719–723.
[13] S.L. Makris, K. Raffaele, S. Allen, W.J. Bowers, U. Hass, E. Alleva, G. Calamandrei, L.Sheets, P. Amcoff, N. Delrue, et al., A retrospective performance assessment of thedevelopmental neurotoxicity study in support of OECD test guideline 426,Environ. Health Perspect. 117 (2009) 17–25.
[14] C.P. Myers, J.W. Lewcock, M.G. Hanson, S. Gosgnach, J.B. Aimone, F.H. Gage, K.F.Lee, L.T. Landmesser, S.L. Pfaff, Cholinergic input is required during embryonicdevelopment to mediate proper assembly of spinal locomotor circuits, Neuron 46(2005) 37–49.
[15] OECD, Test guideline 424, OECD guideline for testing of chemicals, NeurotoxicityStudy in Rodents, 1997.
[16] OECD, Test guideline 426, OECD guideline for testing of chemicals, DevelopmentalNeurotoxicity Study, 2008.
[17] Organization for economic cooperation and development, www.oecd.org.[18] R.T. Peterson, R. Nass, W.A. Boyd, J.H. Freedman, K. Dong, T. Narahashi, Use of non-
mammalian alternative models for neurotoxicological study, Neurotoxicology 29(2008) 546–555.
[19] K.C. Raffaele, J.E. Fisher Jr, S. Hancock, K. Hazelden, S.K. Sobrian, Determiningnormal variability in a developmental neurotoxicity test A report from the ILSIResearch Foundation/Risk Science Institute expert working group on neurodeve-lopmental endpoints, Neurotoxicol. Teratol. 30 (2008) 288–325.
[20] D. Rice, S. Barone Jr., Critical periods of vulnerability for the developing nervoussystem: evidence from humans and animal models, Environ. Health Perspect. 108(Suppl 3) (2000) 511–533.
[21] P.M. Rodier, Vulnerable periods and processes during central nervous systemdevelopment, Environ. Health Perspect. 102 (Suppl 2) (1994) 121–124.
[22] L. Saint-Amant, Development of motor networks in zebrafish embryos, Zebrafish3 (2006) 173–190.
[23] L. Saint-Amant, P. Drapeau, Time course of the development of motor behaviors inthe zebrafish embryo, J. Neurobiol. 37 (1998) 622–632.
[24] I.W. Selderslaghs, A.R. Van Rompay, W. De Coen, H.E. Witters, Development of ascreening assay to identify teratogenic and embryotoxic chemicals using thezebrafish embryo, Reprod. Toxicol. 28 (2009) 308–320.
[25] V. Tropepe,H.L. Sive, Canzebrafishbeusedas amodel to study theneurodevelopmentalcauses of autism? Genes Brain Behav. 2 (2003) 268–281.
[26] U.S. Environmental Protection Agency, www.epa.gov.[27] U.S. E.P.A., Health effects test guidelines OPPTS 870.6200 Neurotoxicity Screening
Battery, (1998).[28] U.S. EPA, Health effects test guidelines OPPTS 870.6300 Developmental Neurotoxicity
study, (1998).