neurophysiological evidence for enhanced tactile acuity in...
TRANSCRIPT

NeuroImage 162 (2017) 23–31
Contents lists available at ScienceDirect
NeuroImage
journal homepage: www.elsevier .com/locate/neuroimage
Neurophysiological evidence for enhanced tactile acuity in early blindnessin some but not all haptic tasks
Ane Gurtubay-Antolin a,b,*, Antoni Rodríguez-Fornells a,b,c
a Cognition and Brain Plasticity Group, Bellvitge Biomedical Research Institute- IDIBELL, 08097, L'Hospitalet de Llobregat, Barcelona, Spainb Dept. of Cognition, Development and Education Psychology, Campus Bellvitge, University of Barcelona, L'Hospitalet de Llobregat, Barcelona 08097, Spainc Catalan Institution for Research and Advanced Studies (ICREA), 08010, Barcelona, Spain
A R T I C L E I N F O
Keywords:BlindnessHaptic object recognition (HOR)TouchShapeTexture
* Corresponding author. Cognition and Brain PlasticityLlobregat, Barcelona, 08097, Spain.
E-mail address: [email protected] (A. Gurtubay
http://dx.doi.org/10.1016/j.neuroimage.2017.08.054Received 15 July 2017; Received in revised form 11 AugAvailable online 24 August 20171053-8119/© 2017 Elsevier Inc. All rights reserved.
A B S T R A C T
Previous research assessing the presence of enhanced tactile skills in early-blind (EB) population obtained con-flicting results. Most of the studies relied on behavioral measures with which different mechanisms leading to thesame outcome go unnoticed. Moreover, the scarce electrophysiological research that has been conducted focusedexclusively on the processing of microgeometric properties. To clarify the extent of superior tactile abilities in EBsusing high-density multichannel electrophysiological recordings, the present study compared the electrophysio-logical correlates of EBs and sighted controls (CON) in two tactile discrimination tasks that targeted micro-geometric (texture) and macrogeometric (shape) properties. After a restricted exploration (haptic glance),participants judged whether a touched stimulus corresponded to an expected stimulus whose name had beenpreviously presented aurally. In the texture discrimination task, differences between groups emerged at ~75 ms(early perceptual processing stages) whereas we found no between-group differences during shape discrimination.Furthermore, for the first time, we were able to determine the latency at which EBs started to discriminate micro-(EB: 170 ms; CON: 230 ms) and macrogeometric (EB: 250 ms; CON: 270 ms) properties. Altogether, the resultssuggest different electrophysiological signatures during texture (but not shape) discrimination in EBs, possiblydue to cortical reorganization in occipital areas and their increased connectivity with S1.
1. Introduction
Neural and behavioral consequences of blindness are still underdebate. On one hand, visual deprivation is related to the atrophy of el-ements of the visual system (Pan et al., 2007; Noppeney et al., 2005)which may lead to perceptual maladjustments in the remaining modal-ities, in particular those with spatial components (e.g., audition andtouch). Since localization tasks in these senses benefit from visual cali-bration, it has been observed that blind Braille readers tend to mislocatetactile stimuli (Sterr et al., 2003) and performworse in sound localizationtasks (Lewald, 2002). Moreover, unsighted children underperform inhaptic orientation discrimination (Gori et al., 2010) and auditory spatialtasks (Gori et al., 2013; Vercillo et al., 2016; Cappagli et al., 2017). Onthe other hand, it is assumed that a sensory deficit will lead to enhancedabilities when using the spared senses as a consequence of corticalreorganization in regions associated with the spared modalities as well asin areas initially responsible for the absent sense. In this line, superior
Unit, IDIBELL University of Barcel
-Antolin).
ust 2017; Accepted 20 August 2017
performance of EBs compared to sighted individuals has been describedin grating orientation tasks (Van Boven, Hamilton, Kauffman, Keenanand Pascual-Leone, 2000; Goldreich and Kanics, 2003), vibrotactileperception (Wan et al., 2010), 2D-angle differentiation tasks with apredefined exploration (Alary et al., 2008) and discrimination of surfaceswith raised dots (Alary et al., 2009). However, other studies assessing thepresence of enhanced tactile skills in EB population obtained alternativeresults. EBs were not found to outperform in orientation discriminationof gratings, vibrotactile perception, discrimination of braille-like dotpatterns (Alary et al., 2009; Grant et al., 2000) or smoothness judgmentswith active or passive exploration (Heller, 1989).
Several authors point to individual differences in the use of explor-atory strategies and to task-specific effects as an explanation for thediscrepant results obtained by the previous studies. Even considering thatthe natural strategies for acquiring somatosensory information abouttexture and shape are lateral motion and contour following (Lederman andKlatzky, 1987), a brief haptic exposure without active exploration
ona, Basic Psychology Dept., Bellvitge Campus, University of Barcelona, L'Hospitalet de

A. Gurtubay-Antolin, A. Rodríguez-Fornells NeuroImage 162 (2017) 23–31
(termed ‘haptic glance’), (Klatzky and Lederman, 1995) is enough toidentify previously presented stimuli eliminating individual differencesin the exploration. Likewise, a superior performance of EBs in certaintactile tasks is not mandatorily associatedwith possessing enhanced skillsin all the tasks pertaining to the haptic modality. Taking into account thattactile object recognition seems to depend on parallel information pro-cessing of micro- (e.g. texture) and macrogeometric attributes (such asshape) (Bohlhalter et al., 2002), it is plausible that EBs show differentabilities in the processing of micro- and macrogeometric properties.Differences between blind and sighted population in the preferred sen-sory modality to encode each type of property support this idea, sincevision is the dominant sense to encode shape-relevant information insighted population while both sighted and EBs use haptics to encodetexture-related information (Lederman and Klatzky, 1987; Ledermanet al., 1996).
Importantly, former studies investigating the presence of superiorsomatosensory abilities in EBs relied almost exclusively on behavioralmeasures and up to present, very few researches have analyzed theneurophysiological correlates of tactile processing in EBs. Brain electricalactivity (assessed by event-related brain potentials, ERPs) may contributein the clarification of the results for various reasons. First, plasticitymechanisms may be present at multiple levels (e.g. molecular, neural orbehavioral). Thus, superior tactile abilities (such as a higher speed ofsomatosensory processing in EBs compared to sighted) may be identifiedat the neurophysiological level despite not leading to different perfor-mance between groups. Second, neurophysiological data can providetemporal and topographical information of events assessing differencesin the mechanisms underlying haptic discrimination in each group aswell as identifying the processing stage at which EBs process tactile in-formation distinct to sighted.
Seminal work investigating haptic processing in blind populationusing electrophysiological measures revealed that blind individualspresented shorter latencies in the somatosensory N1 event-related po-tential (ERP) component during a tactile oddball task with Braille-likedotted patterns (Roder et al., 1996). This result suggests a more effi-cient processing of information in the blind group in this modality.However, this research pooled together early- and late-blind participants,whose neural development has been seen to vary moderately betweenthem since the extent of cortical reorganization depends on the timing ofthe onset of blindness (Voss et al., 2010; Merabet and Pascual-Leone,2010). In addition, results obtained in a tactile spatial attention taskdetermined that EBs differed between attended and non-attendedvibrotactile stimuli 6 ms earlier than sighted population as indexed bythe peak amplitude of the P100 component (Forster et al., 2007). To note,the stimuli used in the former electrophysiological studies focused onmicrogeometric properties and no research has yet focused on the tactileprocessing of macrogeometric properties in EBs, in order to compare the
Table 1Demographic characteristics of early blind participants and control samples. The ‘LP’ column indithe age of blindness onset and the duration of blindness until present (years). ‘Education’ represweek Braille’ details how many hours a week the subjects dedicate to Braille reading (at presen
Age & Gender Cause of blindness LP
EB 1 24 M Congenital glaucoma & retinal detachment NoEB 2 30 F Microphthalmia & Congenital cataracts YesEB 3 28 F Premature retinopathy YesEB 4 30 F Congenital glaucoma YesEB 5 31 F Leber's congenital amaurosis YesEB 6 46 F Atrophy of the optic nerve NoEB 7 29 M Bilateral retinoblastoma NoEB 8 53 M Atrophy of the optic nerve NoEB 9 35 F Bilateral retinoblastoma NoEB 10 35 F Bilateral retinoblastoma YesEB 11 23 M Premature retinopathy NoEB 12 52 F Bilateral retinoblastoma NoEB 13 43 M Premature retinopathy YesEB 14 19 M Bilateral retinoblastoma NoCon 29 (±9) 9F – –
24
processing of both types of attributes.The purpose of the present study was to investigate for the first time
whether a group of EBs and sighted participants showed similar elec-trophysiological correlates in two haptic discrimination tasks targetingmicrogeometric (texture) and macrogeometric (shape) properties.Importantly, the use of high-density multichannel EEG recordings (64locations) permitted a more precise delineation of cortical activitycompared to previous work. Furthermore, restricted exploratory pro-cedures have enable to control for individual differences in the explor-atory procedures. In line with previously reported results, we expectedthe EB group to show a reduction in the time required for texturediscrimination, whereas we hypothesized that such temporal advantagecould be reduced in the shape discrimination task (possibly due to the useof supplementary visual mechanisms in sighted controls).
2. Materials and methods
2.1. Participants
14 early blind (EB) (7 women, mean ± SD, age ¼ 35.7 ± 10.9 years)and 15 sighted controls (CON) (9 women, mean age ¼ 29.3 ± 9.0 years)took part in the experiment. The two groups were matched by age(p ¼ 0.1) and years of education (p ¼ 0.8). With the exception of oneblind subject with well managed epilepsy, no subjects had neurologicaldisorders. The inclusion criteria for the EB group included right hand-edness, less than 10% of visual residual abilities (as determined by ONCEstandards for visual acuity and visual field), blindness onset before 5years of age (the age at which synaptic density in the visual cortex rea-ches adult levels) (Johnson, 1997) and the ability to avoid blinks and tocontrol eye movements for 3 s. The latter requirement was the mostexclusive criterion and 8 EB subjects could not participate in the studydue to it. The EB group was heterogeneous with respect to the degree ofBraille reading and light perception level. Blindness of cerebral originwas an exclusion criterion (see Table 1 for further demographic infor-mation). Three congenitally blind participants were excluded from theERP analysis and two of them were also excluded from the behavioralanalysis. EB4 was only removed from the ERP analysis due to excessivemuscular artifacts. She performed the tasks correctly so she was includedin the behavioral analysis. EB10 was rejected from both the ERP and thebehavioral analyses due to residual abilities to read with a very highcontrast and magnifiers, despite reporting 3% of residual visual abilities.EB14 was also removed from both the ERP and the behavioral analysesbecause he did not perform the shape discrimination task for time rea-sons and consequently, we could not test differences between tasks. Theexperiment was undertaken with the understanding and written consentof each participant and was approved by the local ethics committee inaccordance with the declaration of Helsinki.
cates whether the subjects have light perception. The ‘onset’ and ‘duration’ columns refer toents the years of education. ‘Braille duration’ refers to the years spent reading Braille. ‘Hrs/t). EB ¼ Early blind, Con ¼ sighted controls. M ¼ Male, F ¼ Female.
Onset Duration Education Braille duration Hrs/week Braille
0 24 14 19 00 30 15 25 10 28 22 24 10 30 12 26 00 31 19 25 31.5 44.5 23 41 64 25 24 24 100 53 7 37 14 31 20 30 11 34 19 – –
0 23 20 19 00 50 36 47 140 43 19 38 400 19 16 15 1– – 20 (±4) – –

Fig. 1. A) Trial procedure with the duration of each step. B) Illustration of the exploratory procedure used in the texture-task: participants slid their hand through the vertical stick untiltouching the object with three fingertips –as an entity- and following the contact with the object they were not allowed to perform any movement. C) Photographs and illustration of theexploratory procedure used in the shape-task: the three fingers moved independently (see also Gurtubay-Antolin et al., 2015).
A. Gurtubay-Antolin, A. Rodríguez-Fornells NeuroImage 162 (2017) 23–31
2.2. Haptic stimuli and procedure
Participants sat on a comfortable chair with the right arm extended ona table. In the texture-task, a wooden rectangle (size: 5 cm � 5 cm) wascovered with ten textures (cotton, cork, sackcloth, sandpaper, sponge,scourer, corduroy, suede, paper and velvet). The texture-stimuli wereselected according to previous research where the most dominant attri-bute to identify these objects was their texture (Lederman and Klatzky,1990, 1993) and a texture-notebook used for cognitive-interventionpurposes in Alzheimer patients (Pe~na-Casanova, 1999). Metallic mate-rials were ruled out to exclude temperature as an informative factor. Inthe shape-task, ten previously used 2D wooden geometrical objects weremanufactured: racket, circle, square, triangle, arrow, flower, crown,heart, star and lightning (see Gurtubay-Antolin et al., 2015). To note, thestimuli used in the shape and in the texture discrimination task were hadsimilar sizes. This set of objects was chosen to be identifiable with only 3contact points and at a single grasp. All the stimuli were easily identifi-able based on the discriminability index (d’), which was above 1.79 in allcases. The discriminability index is defined as the standardized score of ahit minus the standardized value of a false alarm (hit: correct answer in acongruent trial – e.g. participant reports touching velvet when the ex-pected texture is velvet; false alarm: incorrect answer in an incongruenttrial –e.g. participant reports touching velvet when the expected textureis cotton). Sighted participants were not allowed to see the objects duringthe entire experimental study. We obstructed vision by placing an opaquescreen between the subject and the object.
Prior to the experiment, participants underwent a learning-trainingphase to become familiar with the stimuli and learn to identify them.In this phase, free haptic exploration was allowed. Both experimentaltasks had the same procedure (see Fig. 1a), and in order to minimizedifferences in the exploratory method, all participants conducted thesame constrained exploration (haptic glance) which consisted in contactwith the object with 3 fingertips for ~3 s. The only difference betweenthe tasks was the haptic exploration used in order to identify the object.In the texture-experiment, participants touched the textures with the
25
fingertips of the index, middle and annular fingers. They contacted theobject following a vertical movement guided by a stick (see Fig. 1b). Allthree fingers were tied together in order to avoid any lateral motionalong the surface to extract further information. In the shape discrimi-nation task, the haptic exploration consisted in touching the shapes atthree specific locations (contact points), after sliding three fingers (thumb,index and middle) through three rails that were attached to the table (seeFig. 1c). Contact points were the same for each object, preventing the useof their location to discriminate objects. Thus, the three fingers alwayshad the same initial and final positions (more detailed information ispresented in Gurtubay-Antolin et al., 2015).
At the beginning of each trial, subjects placed the fingers in the initialposition. The name of one of the stimuli was delivered through head-phones followed by a fixation cross (for sighted participants) for 1 s.Since the majority of the blind participants had light perception, a fixa-tion light was used in order to avoid eye movements. An auditory cue wasthen presented for 40 ms, indicating that the three-finger movementtowards the figure could begin. In the texture-task, participants slid theirfingers through the vertical stick, and in the shape-task the fingers weremoved along the three rails attached to the table, to reach the stimulus. Inhalf of the trials the word delivered by the headphones corresponded tothe object touched (congruent), and in the other 50% of trials the objectdid not match the name (incongruent). For each of the 10 objects, 9repetitions of their congruent trial and 9 incongruent trials were pre-sented. The incongruent trials were a combination of each stimulus (e.g‘Stimulus 1’) with the remaining stimuli (e.g. ‘Stimulus 1’-‘Stimulus 2’,‘Stimulus 1’-‘Stimulus 3’, …, ‘Stimulus 1’-‘Stimulus 10’, with the formerstimulus the one heard through the headphones and the latter, thetouched object). All the trials were randomly presented. Three secondsafter the first auditory cue a second auditory cue indicated that aresponse had to be emitted, requesting the participants to press ‘Yes’ or‘No’, considering whether the object that they were touching corre-sponded to the name of the previously heard object (see Fig. 1a). Par-ticipants were requested to delay their motor response for 3s in order toavoid contamination of the EEG signal from motor related ERP-

A. Gurtubay-Antolin, A. Rodríguez-Fornells NeuroImage 162 (2017) 23–31
components. The Yes-No choice was made by pressing one of twokeyboard buttons with the left hand. The response button was counter-balanced across participants.
The experimental session consisted of 180 trials performed in 4different blocks, interleaved by resting periods. Each block consisted ofthree series of 15 trials. The total duration of each experiment wasapproximately 80 min. Finger movements were recorded using aninfrared motion capture system (CMS-30P, Zebris, Isny, Germany) with aspatial resolution of 0.1 mm to measure the time at which subjectsreached the object (contact time). A sampling frequency of 200 Hz wasused in the texture-task and 66 Hz in the shape-task. The difference be-tween the sampling frequencies of the movement recording in the twotasks is due to the number sensors that are necessary to record themovements of the fingers. Since the three fingers were tied together inthe texture modality in order to prevent lateral movements along thesurface, the three fingers moved like an entity and only one sensor wasrequired. In contrast, each finger moved independently in the shapemodality, and thus three sensors were attached to the three fingers of thesubject's right hand. Data recording began 100 ms before the auditorycue and ended 3 s after. Contact-time with the object (CT) was defined asthe time when the absolute velocity of the first finger reaching the objectwas lower than 5% of its peak velocity. The use of different exploratoryprocedures in each task renders it impossible to compare the time courseof somatosensory processing between tasks. In the texture task, the threefingers exploring the object moved as an entity and no movement wasperformed after contact-time, isolating the somatosensory processing inthe ERPs. In contrast, the three fingers moved independently in the shapediscrimination task, and since contact-time was defined as the arrival ofthe first finger to the object, further movements (corresponding to thearrival of the second and the third fingers) were executed after contact-time. Hence, in the shape task, the ERPs reflected motor execution (of thelast two fingers to reach the object) in addition to somatosensory pro-cessing. Importantly, we could have chosen to define contact-time as thelast finger reaching the object (as we did indeed in our previous study,Gurtubay-Antolin et al., 2015). However, triggering ERP responses basedon the last contacted finger did not reflect information related to earlysomatosensory processing occurring after the first two fingers contactedthe object. Notice that the information provided by the first two fingerswhen contacting the object might be crucial in incongruent trials wherethe first two fingers could provide sufficient information to classify thetrial as an incongruent trial.
2.3. Behavioral analysis
As we sought to have as many trials as possible in order to obtainreliable averages for the electrophysiological analysis, we required par-ticipants to be very accurate. Participants' data was only analyzed when aminimum threshold of correct responses was achieved during thetraining phase: 87% and 90%, for the texture and the shape taskrespectively. The number of correct responses was entered into a mixedmodel ANOVA with two within-subject factors [congruency (congruentvs. incongruent) and task (texture vs. shape)] and a between-subjectsvariable [group (controls vs. EB)]. Since differences between groups inthe number of correct responses might not arise because the accuracy wasforced to be extremely high, we decided to assess differences on thediscriminability index (for which no threshold was required). We con-ducted a two-way repeated measures ANOVA on the discriminabilityindex with ‘group’ and ‘task’ as factors. In case marginally significantinteractions were found, within subject related samples t-test whereconducted between tasks.
2.4. Multichannel EEG recordings and analysis
High-density EEG recordings were acquired from 64 scalp electrodes(Electro-Cap International) using Brain-Vision Recorder software(version 1.3; Brain Products, Munich, Germany). Data was analyzed with
26
EEGLAB (Delorme and Makeig, 2004) and MATLAB (The Mathworks,Inc., Munich, Germany). In addition, we used FieldTrip (http://www.ru.nl/neuroimaging/fieldtrip) (Oostenveld et al., 2011) to run cluster-basedpermutation tests on the data. Electrode positions were based on thestandard 10/20 positions (Jasper, 1958): Fpz/1/2, AF3/4,Fz/1/2/3/4/5/6/7/8, FCz/1/2/3/4/5/6, Cz,/1/2/3/4/5/6, T7/8,CPz/1/2/3/4/5/6, Tp7/8, Pz/1/2/3/4/5/6/7/8, POz/1/2/3/4/5/6,Oz/1/2. Trials with incorrect responses or with a response-time higherthan 2s were removed from the analysis. Eye movements and blinks weremonitored by electrodes placed on the external canthus and theinfraorbital ridge of the right eye. All scalp electrodes were referencedoffline to the average of the reference electrodes, placed at the right andleft mastoid. Electrode impedances were kept below 5 kΩ. The EEG signalwas sampled at 250 Hz and filtered with a bandpass of 0.03–45 Hz(half-amplitude cut-offs). Trials with base-to-peak electrooculogram(EOG) amplitude of more than 75 μV, amplifier saturation, or a baselineshift exceeding 200 μV/s were automatically rejected (Cunillera et al.,2008). These criteria removed electrocardiogram (ECG) contaminationin most of the participants. After visually inspecting all the trials and inorder to remove trials with remaining ocular artifacts, independentcomponent analysis (ICA) (Delorme et al., 2007) was conducted in threesubjects where the previous rejection was not enough to remove ECGcontamination. Again, all extracted epochs were visually inspected.Contact-locked ERPs for artifact-free trials (in the (i) congruent, (ii)incongruent and (iii) all -congruent þ incongruent-conditions) wereaveraged over epochs of 850 ms, from 50 ms pre-contact to 800 mspost-contact. To obtain reliable averages, we required each congruencycondition to have a minimum of 50 trials per participant.
Due to fundamental differences in the exploratory method, weanalyzed each task separately. From the entire set of scalp electrodes, weselected 45 electrodes that excluded frontopolar and anterior frontalelectrodes as well as electrodes in the edges of the cap (F7/8, T7/8, Tp7/8, P7/8) since muscular artifacts (neck rigidity and facial tension) usuallyaffect these sites. In each task, we submitted amplitude values where thedifference between congruent and incongruent trials seemed maximum(texture: 200–400 ms interval; shape: 300–500 ms) to a mixed-modelANOVA with two within-subject factors [congruency (congruent vs.incongruent) and electrode (45 levels)] and a between-subjects variable(group). Based on previous results obtained in the same shape-experiment (where the ‘electrode’ x ‘congruency’ interaction was foundto be highly significant) (Gurtubay-Antolin et al., 2015) we expected tofind similar results suggesting differences in the topographical distribu-tion of the incongruency effect. When the assumption of sphericity wasnot met the Greenhouse-Geisser correction was applied (Jennings andWood, 1976) when the epsilon estimate of sphericity was lower than 0.75(Girden, 1992). For full disclosure, the Huyhn-Feldt correction (Huynhand Feldt, 1976) is also reported in case the results differed between bothtypes of correction. The p-values under these corrections are reported aspGG and pHF respectively. In case a significant interaction with the‘electrode’ factor was found, the electrodes were assumed to be inde-pendent between them. Likewise, in case a significant interactioninvolving the factor ‘group’ was found, we proceeded to analyse eachgroup separately.
Within each group and for each task separately, the onset and offsetlatencies of the incongruency effect (latency at which both congruencyconditions start to differ) for each electrode were determined via astepwise series of one-tailed serial t-tests (step size ¼ 4 ms). The onsetlatencies were defined as the point at which more than 10 consecutive t-tests showed a significant difference from zero (t ¼ 2.063) (Gurtu-bay-Antolin et al., 2015). In addition, we analyzed the topographicaldistribution of the voltage within the 100 ms time-window following theonset of the incongruence effect and we run cluster-based permutationtests on the data to control the family-wise error rate due to multipletesting (Maris and Oostenveld, 2007). First both conditions (congruentand incongruent) were compared for every sample (channel, time) with adependent samples t-test. All samples with a t-value larger than 0.05 were
A. Gurtubay-Antolin, A. Rodríguez-Fornells NeuroImage 162 (2017) 23–31
selected and then clustered on the basis of temporal and spatial adja-cency. Taking the sum of the t-values within every cluster, cluster-levelstatistics were calculated and the maximum was taken as the test statis-tic to evaluate the effect of the experimental conditions in thattime-window (100ms interval after the onset of the incongruence effect).The Monte Carlo method with 1000 random draws was used to calculatethe significance probability and identify significant clusters with ap-value under the critical alpha-level of 0.05.
To derive a topographical visualization of the voltage sources, wetransformed the contact-locked averaged ERP waveforms into reference-free current source density (CSD) estimates (in μV/cm2, headradius ¼ 10 cm) (Perrin et al., 1989; Kayser and Tenke, 2006) andfocused on the CSD estimates in a 100 ms time-window after the onset ofthe incongruency effect. The same procedure was used to address dif-ferences between groups in each task. The onset latency of the differencesbetween groups was again defined as the point at which more than 10consecutive t-tests showed a significant difference from zero and thetopographical distribution of the voltage within the 100 ms time-windowfollowing the onset of the differences was analyzed. Again in case dif-ferences were found, we focused on the CSD estimates in a 100 ms time-window after the onset of differences between groups. In order to analysethe topographical distribution, cluster-based permutation tests were alsoapplied to the CSD estimates.
3. Results
3.1. Behavioral results
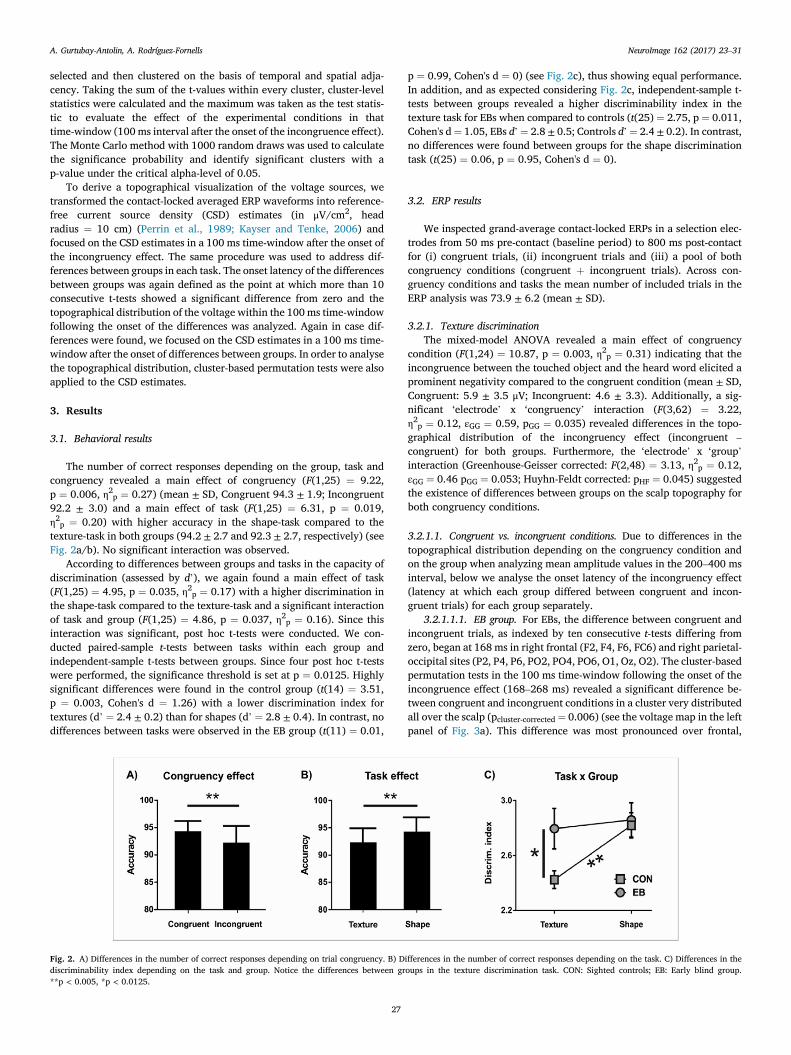
The number of correct responses depending on the group, task andcongruency revealed a main effect of congruency (F(1,25) ¼ 9.22,p ¼ 0.006, η2p ¼ 0.27) (mean ± SD, Congruent 94.3 ± 1.9; Incongruent92.2 ± 3.0) and a main effect of task (F(1,25) ¼ 6.31, p ¼ 0.019,η2p ¼ 0.20) with higher accuracy in the shape-task compared to thetexture-task in both groups (94.2 ± 2.7 and 92.3 ± 2.7, respectively) (seeFig. 2a/b). No significant interaction was observed.
According to differences between groups and tasks in the capacity ofdiscrimination (assessed by d’), we again found a main effect of task(F(1,25) ¼ 4.95, p ¼ 0.035, η2p ¼ 0.17) with a higher discrimination inthe shape-task compared to the texture-task and a significant interactionof task and group (F(1,25) ¼ 4.86, p ¼ 0.037, η2p ¼ 0.16). Since thisinteraction was significant, post hoc t-tests were conducted. We con-ducted paired-sample t-tests between tasks within each group andindependent-sample t-tests between groups. Since four post hoc t-testswere performed, the significance threshold is set at p ¼ 0.0125. Highlysignificant differences were found in the control group (t(14) ¼ 3.51,p ¼ 0.003, Cohen's d ¼ 1.26) with a lower discrimination index fortextures (d’ ¼ 2.4 ± 0.2) than for shapes (d’ ¼ 2.8 ± 0.4). In contrast, nodifferences between tasks were observed in the EB group (t(11) ¼ 0.01,
Fig. 2. A) Differences in the number of correct responses depending on trial congruency. B) Ddiscriminability index depending on the task and group. Notice the differences between gr**p < 0.005, *p < 0.0125.
27
p ¼ 0.99, Cohen's d ¼ 0) (see Fig. 2c), thus showing equal performance.In addition, and as expected considering Fig. 2c, independent-sample t-tests between groups revealed a higher discriminability index in thetexture task for EBs when compared to controls (t(25) ¼ 2.75, p ¼ 0.011,Cohen's d¼ 1.05, EBs d’¼ 2.8 ± 0.5; Controls d’¼ 2.4 ± 0.2). In contrast,no differences were found between groups for the shape discriminationtask (t(25) ¼ 0.06, p ¼ 0.95, Cohen's d ¼ 0).
3.2. ERP results
We inspected grand-average contact-locked ERPs in a selection elec-trodes from 50 ms pre-contact (baseline period) to 800 ms post-contactfor (i) congruent trials, (ii) incongruent trials and (iii) a pool of bothcongruency conditions (congruent þ incongruent trials). Across con-gruency conditions and tasks the mean number of included trials in theERP analysis was 73.9 ± 6.2 (mean ± SD).
3.2.1. Texture discriminationThe mixed-model ANOVA revealed a main effect of congruency
condition (F(1,24) ¼ 10.87, p ¼ 0.003, η2p ¼ 0.31) indicating that theincongruence between the touched object and the heard word elicited aprominent negativity compared to the congruent condition (mean ± SD,Congruent: 5.9 ± 3.5 μV; Incongruent: 4.6 ± 3.3). Additionally, a sig-nificant ‘electrode’ x ‘congruency’ interaction (F(3,62) ¼ 3.22,η2p ¼ 0.12, εGG ¼ 0.59, pGG ¼ 0.035) revealed differences in the topo-graphical distribution of the incongruency effect (incongruent –
congruent) for both groups. Furthermore, the ‘electrode’ x ‘group’interaction (Greenhouse-Geisser corrected: F(2,48) ¼ 3.13, η2p ¼ 0.12,εGG ¼ 0.46 pGG ¼ 0.053; Huyhn-Feldt corrected: pHF ¼ 0.045) suggestedthe existence of differences between groups on the scalp topography forboth congruency conditions.
3.2.1.1. Congruent vs. incongruent conditions. Due to differences in thetopographical distribution depending on the congruency condition andon the group when analyzing mean amplitude values in the 200–400 msinterval, below we analyse the onset latency of the incongruency effect(latency at which each group differed between congruent and incon-gruent trials) for each group separately.
3.2.1.1.1. EB group. For EBs, the difference between congruent andincongruent trials, as indexed by ten consecutive t-tests differing fromzero, began at 168 ms in right frontal (F2, F4, F6, FC6) and right parietal-occipital sites (P2, P4, P6, PO2, PO4, PO6, O1, Oz, O2). The cluster-basedpermutation tests in the 100 ms time-window following the onset of theincongruence effect (168–268 ms) revealed a significant difference be-tween congruent and incongruent conditions in a cluster very distributedall over the scalp (pcluster-corrected ¼ 0.006) (see the voltage map in the leftpanel of Fig. 3a). This difference was most pronounced over frontal,
ifferences in the number of correct responses depending on the task. C) Differences in theoups in the texture discrimination task. CON: Sighted controls; EB: Early blind group.

A. Gurtubay-Antolin, A. Rodríguez-Fornells NeuroImage 162 (2017) 23–31
parietal-occipital and occipital electrodes (F2, F4, Fz, O2, PO6) [F2:t(10) ¼ 5.04, Cohen's d ¼ 0.53; F4: t(10) ¼ 4.41, Cohen's d ¼ 0.54; Fz:t(10) ¼ 4.21, Cohen's d ¼ 0.44; O2: t(10) ¼ 4.11, Cohen's d ¼ 0.60; PO6:t(10) ¼ 3.98, Cohen's d ¼ 0.62]. Despite observing such a distributedvoltage, the scalp distribution of the CSDmap revealed that the sources ofactivity were localized at right parietal-occipital electrodes (P4, P6, PO4,PO6, O1, Oz, O2) with the maximum effect in O2, PO6, Oz and PO4 [O2:t(10) ¼ 3.47, puncorrected ¼ 0.006, Cohen's d ¼ 0.58; PO6: t(10) ¼ 3.22,puncorrected ¼ 0.009, Cohen's d ¼ 0.45; Oz: t(10) ¼ 3.19,puncorrected ¼ 0.009, Cohen's d ¼ 0.42; PO4: t(10) ¼ 3.01,puncorrected ¼ 0.013, Cohen's d ¼ 0.42] (see the CSD map in the left panelof Fig. 3a). The white dots indicate the electrodes that were significantlydifferent in that interval at puncorrected < 0.05.
3.2.1.1.2. Sighted controls. In sighted controls, congruent andincongruent trials started to differ at 228 ms at midline central-parietallocations (CP1, CPz, CP2, P1, Pz, P2). The cluster-based permutationtests in the 100 ms time-window following the onset of the incongruenceeffect (228–328 ms) revealed a significant difference between congruentand incongruent conditions in a cluster distributed over central-parietalelectrodes (pcluster-corrected ¼ 0.02) [P5: t(14) ¼ 3.47, Cohen's d ¼ 0.37;P3: t(14)¼ 3.22, Cohen's d¼ 0.53; P1: t(14)¼ 3.19, Cohen's d¼ 0.57; Pz:t(14) ¼ 3.19, Cohen's d ¼ 0.60] (see the voltage map in the right panel ofFig. 3a). The scalp distribution of the CSD map localized the sources ofthe activity at slightly right-lateralized central and parietal locations (Cz,C2, CP1, CPz, CP2, CP4, Pz, P2) (pcluster-corrected ¼ 0.02) [CP2:t(14) ¼ 4.06, Cohen's d ¼ 0.10; CPz: t(14) ¼ 3.16, Cohen's d¼ 0.29; CP4:t(14) ¼ 2.99, Cohen's d ¼ 0.22] (see the CSD map in the right panelof Fig. 3a).
Fig. 3. A) Three–dimensional isovoltage topographical mappings (V) and the scalp dis-tribution of the current source density (CSD), for the (i) congruent, (ii) incongruent and(iii) incongruent-congruent conditions in the texture discrimination task during a 100 mstime-window after the onset of discrimination. The number below each topographical mapcorresponds to the scale used (in μV units for voltage and μV/cm2 for CSD). The black dotsindicate the electrodes that were significantly different (pcluster-corrected < 0.05) betweencongruent and incongruent trials during the 100 ms time-window after the onset ofdiscrimination. The white dots indicate the electrodes that were significantly different inthat interval at puncorrected < 0.05. B) Grand-average contact-locked event-related potential(ERP) waveforms for congruent and incongruent conditions as well as the differencewaveform (Incong.-Cong.; solid line) at PO4 and CP2 sites. The gray area indicates thetime interval when the 2 congruency conditions differed statistically. CON: Sighted con-trols; CSD: Current source density; EB: Early blind group; I–C: incongruent-congruent; Sh:Shape; Tx: Texture; V: Voltage.
28
3.2.1.2. EB group vs. sighted controls. The following section analyzes theonset latency of between group differences pooling together all trials(congruent þ incongruent), since the electrophysiological activity cor-responding to early stages of somatosensory processing is filtered out inthe substraction of congruent from incongruent trials.
According to serial t-tests, differences between groups were found toarise at 76 ms frontocentral sites (FCz, FC2, Cz). Independent sample t-tests revealed that activity at frontal and frontocentral locations wassignificantly higher for EBs in the 100 ms-interval following the onset ofthe differences between groups (76–176 ms) [FC6: t(24) ¼ 2.43,puncorrected ¼ 0.023, Cohen's d ¼ 0.99; FCz: t(24) ¼ 2.33,puncorrected ¼ 0.028, Cohen's d ¼ 0.95; Fz: t(24) ¼ 2.23,puncorrected ¼ 0.035, Cohen's d ¼ 0.91; FC2: t(24) ¼ 2.20,puncorrected ¼ 0.037, Cohen's d ¼ 0.90] (see voltage map in Fig. 4a and b).The CSD maps during the 76–176 ms interval revealed that the previousfrontocentral differences corresponded to the location of the sources ofthe activity (Fz, FCz, F1, F2, Cz, CPz, F6, F4 CP6) (pcluster-corrected¼ 0.004)[Fz: t(24) ¼ 3.97, Cohen's d ¼ 1.59; FCz: t(24) ¼ 3.19, Cohen's d ¼ 1.24;F1: t(24) ¼ 3.09, Cohen's d ¼ 1.24; F2: t(24) ¼ 3.03, Cohen's d ¼ 1.20](see CSD map of substraction in Fig. 4a). In addition, right occipital [O2:t(24) ¼ �3.09, puncorrected ¼ 0.005, Cohen's d ¼ �1.30; PO6:t(24) ¼ �2.70, puncorrected ¼ 0.012, Cohen's d ¼ �1.11; PO4:t(24) ¼ �2.09, puncorrected ¼ 0.021, Cohen's d ¼ �0.85] and central-parietal [CP3, t(24) ¼ �2.48, puncorrected ¼ 0.020, Cohen's d ¼ �1.02]sites were seen to corresponded to current sinks.
3.2.2. Shape discriminationThe mixed-model ANOVA in the shape discrimination task revealed a
main effect of congruency condition (F(1,24) ¼ 13.92, p ¼ 0.001,
Fig. 4. A) Texture discrimination: Three-dimensional isovoltage topographical mappings(V) and the scalp distribution of the current source density (CSD), for the pool of bothcongruency conditions for the (i) sighted controls and (ii) early blind groups as well as (iii)their substraction–axial and coronal views– in a 100 ms time-window (76–176 ms) afterthe onset of the differences between groups. The black dots indicate the electrodes thatwere significantly different (pcluster-corrected < 0.05) between groups during the time-interval reported above. The white dots indicate the electrodes that were significantlydifferent in that interval at puncorrected < 0.05. B) Grand-average contact-locked event-related potential (ERP) waveforms for (i) controls (green line), (ii) EBs (red line) and(iii) their difference (black line) at Fz, C2A and O2 electrodes for the texture discrimi-nation task. The gray area indicates the time interval where the 2 groups statisti-cally differed.

A. Gurtubay-Antolin, A. Rodríguez-Fornells NeuroImage 162 (2017) 23–31
η2p ¼ 0.37) with incongruent trials showing overall more negative valuesthan the congruent trials (mean ± SD, Congruent: 4.5 ± 3.6 μV; Incon-gruent: 3.0 ± 3.6). A significant ‘electrode’ x ‘congruency’ interaction(F(3,73) ¼ 5.11, η2p ¼ 0.18, εGG ¼ 0.69, pGG ¼ 0.003) reflected differ-ences in the topographical distribution of the incongruency effect.Although we did not find any significant interaction with the factor‘group’, for comparison purposes only, an analogous analysis to the oneconducted for the texture discrimination task (section 1 of the results)will be performed.
3.2.2.1. Congruent vs. incongruent conditions3.2.2.1.1. EB group. In EBs, serial t-test revealed that differences
between both congruency conditions started at 248 ms at right parietalsites (P6, PO6). A right central-parietal negativity extended up to oc-cipital regions in the 100 ms time-window following the onset of theincongruence effect (248–348 ms) (see the voltage map in the left panelof Fig. 5a and b). However, the difference between congruent andincongruent conditions in this time-interval did not survive the correc-tion for multiple comparisons. The maximum effect was found in (P06,P6, PO4 and O2) [PO6: t(10) ¼ 2.75, puncorrected ¼ 0.020, Cohen'sd ¼ 0.51; P6: t(10) ¼ 2.72, puncorrected ¼ 0.021, Cohen's d ¼ 0.58; PO4:t(10) ¼ 2.54, puncorrected ¼ 0.029, Cohen's d ¼ 0.43; O2: t(10) ¼ 2.53,puncorrected ¼ 0.030, Cohen's d ¼ 0.40]. The sinks of the electrical activitywere identified at right parietal sites [P6: t(10) ¼ 2.78,puncorrected ¼ 0.019, Cohen's d ¼ 0.02; CP6: t(10) ¼ 2.60,puncorrected ¼ 0.026, Cohen's d ¼ 0.31] (see CSD voltage map in the leftpanel of Fig. 5a).
3.2.2.1.2. Sighted controls. Sighted participants started to discrimi-nate congruent and incongruent trials at 272 ms at right frontocentral
Fig. 5. A) Three–dimensional isovoltage topographical mappings (V) and the scalp dis-tribution of the current source density (CSD), for the (i) congruent, (ii) incongruent and(iii) incongruent-congruent conditions in the shape discrimination task in a 100 ms time-window after the onset of discrimination. The number below each topographical mapcorresponds to the scale used (in μV units for voltage and μV/cm2 for CSD). The black dotsindicate the electrodes that were significantly different (pcluster-corrected < 0.05) betweencongruent and incongruent trials during the 100 ms time-window after the onset ofdiscrimination. The white dots indicate the electrodes that were significantly different inthat interval at puncorrected < 0.05. B) Grand-average contact-locked event-related potential(ERP) waveforms for congruent and incongruent conditions as well as the differencewaveform (Incong.-Cong.; solid line) at P6 and C2 sites. The gray area indicates the timeinterval when the 2 congruency conditions differed statistically. CON: Sighted controls;CSD: Current source density; EB: Early blind group; I–C: incongruent-congruent; Sh:Shape; Tx: Texture; V: Voltage.
29
(FC4, FC6), central (C2, C4, C6) and central-parietal sites (CP2, CP4, P6.Over the following 100 ms (272–372 ms) the topographical distributionshowed a very widespread activity with nearly all scalp electrodescontributing to differ between both congruency conditions) (pcluster-corrected ¼ 0.002) (see the voltage map in the right panel of Fig. 5a and b).This incongruence effect was maximum at right central-parietal elec-trodes (CP6, P6, P4) [CP6: t(14) ¼ 5.28, Cohen's d ¼ 0.53; P6:t(14) ¼ 5.21, Cohen's d ¼ 0.56; P4: t(14) ¼ 5.16, Cohen's d ¼ 0.48]. TheCSD maps during the 272–372 ms interval revealed that Cz, CPz, CP2, C2and CP1 corresponded to the sinks of the electrical activity (pcluster-corrected ¼ 0.026) [Cz: t(14) ¼ 3.63, Cohen's d ¼ 0.20; CPz: t(14) ¼ 2.50,Cohen's d ¼ 0.23; CP2: t(14) ¼ 2.45, Cohen's d ¼ 0.23] (see CSD map inthe right panel of Fig. 5a).
3.2.2.2. EB group vs. sighted controls. No differences between groupswere found when pooling together all trials (congruent þ incongruent).
4. Discussion
The present research analyzed neurophysiological differences ontactile processing between a group of EB individuals and sighted controlsin two haptic discrimination tasks targeting microgeometric (texture)and macrogeometric (shape) properties. In line with previous researchreporting superior tactile abilities in EBs during the processing ofmicrogeometric attributes (Van Boven et al., 2000; Goldreich and Kanics,2003), our behavioral data showed that EBs presented superior dis-criminability abilities in a texture discrimination task compared tosighted controls. Importantly, no differences between groups were foundin the capacity to discriminate shapes. The specific neural signaturesunderlying the enhanced skills found in the EB group during texturediscrimination were assessed by electrophysiological measures, revealingthat EBs started to present more positive cortical activity at frontocentrallocations (and more negative values at occipital sites) around 75 ms.Moreover, the comparison of congruent and incongruent trials allowedus to determine the onset of the discrimination process in EBs for bothmicro- (EB: 170 ms) and macrogeometric (EB: 250ms) properties (see forsimilar approaches, Thorpe et al., 1996; Rodríguez-Fornells et al., 2002).
The temporal information and the spatial distribution of the corticalactivity corresponding to differences between groups are important inorder to understand the mechanisms leading EBs to have enhanced skillsduring the processing of microgeometric properties. Taking into accountthat somatosensory information can be delivered to the cortex within arange of 15–30 ms (Mauguiere et al., 1999; Palva et al., 2005) and thatthe time required to discriminate expected and unexpected textures is atleast 170ms (according to the results reported here), the latency at whichthe first group differences appear (~75 ms) might correspond to initialstages of somatosensory processing carried out in primary sensory re-gions. In accordance with this notion, scalp recorded somatosensory ERPcomponents within the first 100 ms were found to be generated in theprimary somatosensory area (S1) (Allison et al., 1992). Only after120 ms, the neural generators of somatosensory evoked potentials werelocated in higher order sensory regions (e.g., secondary somatosensoryareas). Thus, according to this temporal pattern, one of the underlyingreasons contributing to a more efficient processing in EBs during texturediscrimination might be related to cortical reorganization occurring inregions associated with the intact modalities (e.g., somatosensory), suchas an enlarged representation of the reading finger in the S1 of Braillereaders (Pascual-Leone and Torres, 1993; Sterr et al., 1998). The spatialdistribution of the differences between groups converges with this idea,since the source density maps revealed bilateral differences betweengroups in presumably somatosensory areas, at central locations (seeFig. 4). Still, it seems unlikely that the group differences found duringtexture discrimination were solely driven by enlarged representations inS1, since this would also lead to differences during shape discriminationconsidering that all types of somatosensory input are first conveyed to S1.

A. Gurtubay-Antolin, A. Rodríguez-Fornells NeuroImage 162 (2017) 23–31
Plastic reorganization in EBs could also occur in areas initiallyresponsible for the deprived sense since occipital areas (normallyrecruited for visual processing in sighted population) have been shown tosubserve tactile processing (Burton et al., 2006; Pietrini et al., 2004;Sadato et al., 1996). Importantly, the involvement of occipital regions inEBs has been related to the processing of both micro- (Braille reading)and macrogeometric properties (width and angle discrimination) (Sadatoet al., 1998). Our results support this idea bearing in mind that theincongruence effect elicited a prominent negativity at occipital regions inthe EB group in both discrimination tasks (see Figs. 3 and 5). Likewise,we found differences between groups at right occipital sites with EBspresenting more negative values than sighted controls pooling togetherall conditions (see Fig. 4). Similar posterior negative deflections presentin EBs have been previously reported during tactile oddball tasks (Roderet al., 1996), tactile reading tasks (Uhl et al., 1991) and tactile mentalimagery (Uhl et al., 1994), associating these patterns of occipital re-sponses with both high-level cognitive processing and low-level sensorydiscrimination. Lastly, cortico-cortical connections could as well mediatecrossmodal plasticity in blind individuals considering that increasedconnectivity between S1 and occipital cortices has been previously re-ported in EBs (Wittenberg et al., 2004).
While the above-mentioned speaks on the relevance of occipital areasin EBs during somatosensory processing (for both micro- and macro-geometric properties), occipital areas seem to be equally relevant insighted population for the processing of macrogeometric attributes as aresult of visual mechanisms. Importantly, in sighted population thepreferred sensory modality to encode shape-relevant information isvision, whereas texture is mainly encoded using touch (Lederman andKlatzky, 1987; Lederman et al., 1996). These two factors may account forthe absence of differences between groups in the shape discriminationtask. Thus, in EBs somatosensory and visual (due to cortical reorgani-zation) areas seem to be highly active during texture and shape pro-cessing. However, during shape discrimination in sighted individualssimilar occipital activations might be related to visual mechanisms.Notably, the topographical maps for the incongruence effect in the shapediscrimination task highly resemble between groups (see Fig. 5) and thisresemblance is not shared in the texture-task (Fig. 3). Visual imagery andshared visuo-tactile shape representations are some of the visual strate-gies from which sighted participants could benefit.
Evidence supporting the role of visual imagery in haptic shapeperception comes from studies in which individual differences in thedegree of haptic shape-selective activity in the right LOC have been seento correlate with ratings of imagery-vividness (Zhang et al., 2004) andactivations evoked by visual imagery were found to be more correlatedwith those evoked by the haptic perception of familiar (compared tounfamiliar) shapes (Lacey et al., 2010). Effective connectivity analysesconverged with these findings showing that visual imagery and hapticperception of familiar shapes activated similar networks whereas unfa-miliar shape perception did not (Deshpande et al., 2010) (for a review seeLacey and Sathian, 2014). Furthermore, the lateral occipital tactile-visualarea (LOtv) is thought to store bimodal shape representations that can beaccessed either by vision or haptics (Amedi et al., 2001; Amedi et al.,2002). In this line, visual representations available in sighted individualscould be used to enrich bimodal object-representation stored in this re-gion, and because this improved representation is shared across bothmodalities, the haptic system might benefit from it during the hapticdiscrimination process. As these shared representations are specific forobjects but not for textures, our results match well with the idea thatcompensatory mechanisms are present only during shape processing.However, the present study lacks direct evidence concerning the role ofvisual representations during shape discrimination and further studieswould be needed to address this issue. Similar to other studies (Lacey andCampbell, 2006; Lawson et al., 2015), the access to visual representationsduring haptic discrimination could be blocked conducting a concurrentor dual task since spatial coding has been found to be of great importanceto maintain accurate haptic shape representations (Lawson et al., 2015).
30
Summing up, this is the first study to show early differences betweenEB and sighted individuals in the electrophysiological signatures oftexture (but not shape) discrimination and we hypothesize that the lackof differences between groups in the shape discrimination task might beexplained by similar occipital activations in EBs (due to cortical reorga-nization related to visual deprivation) and in sighted controls (due tovisual mechanisms).
Competing interests
The authors declare no disclosure of financial interests or potentialconflict of interest.
Acknowledgements
The authors thank all the people that participated in the study, theCatalan Organization for the integration blind people (ACIC), the Na-tional Organization of Spanish blind people (ONCE) and David Cucurellfor his help during the recordings. This work was supported by a Spanishgovernment grant to ARF (PSI2015-69178-P) and a predoctoral grant(MINECO-FPI program) from the Spanish government awarded to AGA.
References
Alary, F., Duquette, M., Goldstein, R., Elaine, C.C., Voss, P., La Buissonniere-Ariza, V.,et al., 2009. Tactile acuity in the blind: a closer look reveals superiority over thesighted in some but not all cutaneous tasks. Neuropsychologia 47, 2037–2043.
Alary, F., Goldstein, R., Duquette, M., Chapman, C.E., Voss, P., Lepore, F., 2008. Tactileacuity in the blind: a psychophysical study using a two-dimensional anglediscrimination task. Exp. Brain Res. 187, 587–594.
Allison, T., McCarthy, G., Wood, C.C., 1992. The relationship between human long-latency somatosensory evoked potentials recorded from the cortical surface and fromthe scalp. Electroencephalogr. Clin. Neurophysiol. 84, 301–314.
Amedi, A., Jacobson, G., Hendler, T., Malach, R., Zohary, E., 2002. Convergence of visualand tactile shape processing in the human lateral occipital complex. Cereb. Cortex 12,1202–1212.
Amedi, A., Malach, R., Hendler, T., Peled, S., Zohary, E., 2001. Visuo-haptic object-relatedactivation in the ventral visual pathway. Nat. Neurosci. 4, 324–330.
Bohlhalter, S., Fretz, C., Weder, B., 2002. Hierarchical versus parallel processing in tactileobject recognition: a behavioural-neuroanatomical study of aperceptive tactileagnosia. Brain 125, 2537–2548.
Burton, H., McLaren, D.G., Sinclair, R.J., 2006. Reading embossed capital letters: an fMRIstudy in blind and sighted individuals. Hum. Brain Mapp. 27, 325–339.
Cappagli, G., Cocchi, E., Gori, M., 2017. Auditory and proprioceptive spatial impairmentsin blind children and adults. Dev. Sci. 20.
Cunillera, T., Gomila, A., Rodriguez-Fornells, A., 2008. Beneficial effects of word finalstress in segmenting a new language: evidence from ERPs. BMC.Neurosci. 9, 23.
Delorme, A., Makeig, S., 2004. EEGLAB: an open source toolbox for analysis of single-trialEEG dynamics including independent component analysis. J. Neurosci. Methods 134,9–21.
Delorme, A., Sejnowski, T., Makeig, S., 2007. Enhanced detection of artifacts in EEG datausing higher-order statistics and independent component analysis. Neuroimage 34,1443–1449.
Deshpande, G., Hu, X., Lacey, S., Stilla, R., Sathian, K., 2010. Object familiarity modulateseffective connectivity during haptic shape perception. Neuroimage 49, 1991–2000.
Forster, B., Eardley, A.F., Eimer, M., 2007. Altered tactile spatial attention in the earlyblind. Brain Res. 1131, 149–154.
Girden, E.R., 1992. ANOVA: Repeated Measures (Quantitative Applications in the SocialSciences). By MLews-beck. SAGE Publications, Newbury Park, California.
Goldreich, D., Kanics, I.M., 2003. Tactile acuity is enhanced in blindness. J. Neurosci. 23,3439–3445.
Gori, M., Sandini, G., Martinoli, C., Burr, D., 2010. Poor haptic orientation discriminationin nonsighted children may reflect disruption of cross-sensory calibration. Curr. Biol.20, 223–225.
Gori, M., Sandini, G., Martinoli, C., Burr, D.C., 2013. Impairment of auditory spatiallocalization in congenitally blind human subjects. Brain 137, 288–293.
Grant, A.C., Thiagarajah, M.C., Sathian, K., 2000. Tactile perception in blind Braillereaders: a psychophysical study of acuity and hyperacuity using gratings and dotpatterns. Percept. Psychophys. 62, 301–312.
Gurtubay-Antolin, A., Rodriguez-Herreros, B., Rodriguez-Fornells, A., 2015. The speed ofobject recognition from a haptic glance: event-related potential evidence.J. Neurophysiol. 113, 3069–3075.
Heller, M.A., 1989. Texture perception in sighted and blind observers. Percept.Psychophys. 45, 49–54.
Huynh, H., Feldt, L.S., 1976. Estimation of the Box correction for degrees of freedom fromsample data in randomized block and split-plot designs. J. Educ. Stat. 1, 69–82.
Jasper, H.H., 1958. The ten twenty electrode system of the international federation.Electroencephalogr. Clin. Neurophysiol. 10, 371–375.

A. Gurtubay-Antolin, A. Rodríguez-Fornells NeuroImage 162 (2017) 23–31
Jennings, R.J., Wood, C.C., 1976. The þøΓÇ�EAdjustment procedure forRepeatedΓÇ�EMeasures analyses of variance. Psychophysiology 13, 277–278.
Johnson, M., 1997. Proceeding of the Medical Image Computing and Computer-assistedInterventation (MICCAI98). Blackwell, Cambridge, MA.
Kayser, J., Tenke, C.E., 2006. Principal components analysis of laplacian waveforms as agenetic method for identifying ERP generator patterns: I. Evaluation with auditoryoddball tasks. Clin. Neurophysiol. 117, 348–368.
Klatzky, R.L., Lederman, S.J., 1995. Identifying objects from a haptic glance. Percept.Psychophys. 57, 1111–1123.
Lacey, S., Campbell, C., 2006. Mental representation in visual/haptic crossmodalmemory: evidence from interference effects. Q. J. Exp. Psychol. 59, 361–376.
Lacey, S., Flueckiger, P., Stilla, R., Lava, M., Sathian, K., 2010. Object familiaritymodulates the relationship between visual object imagery and haptic shapeperception. Neuroimage 49, 1977–1990.
Lacey, S., Sathian, K., 2014. Visuo-haptic multisensory object recognition, categorization,and representation. Front. Psychol. 5, 730.
Lawson, R., Fernandes, A.M., Albuquerque, P.B., Lacey, S., 2015. Remembering Touch:Using Interference Tasks to Study Tactile and Haptic Memory. In: Mechanisms ofSensory Working Memory: Attention and Perfomance XXV, vol. 239.
Lederman, S.J., Klatzky, R.L., 1987. Hand movements: a window into haptic objectrecognition. Cogn. Psychol. 19, 342–368.
Lederman, S.J., Klatzky, R.L., 1990. Haptic classification of common objects: knowledge-driven exploration. Cogn. Psychol. 22, 421–459.
Lederman, S.J., Klatzky, R.L., 1993. Extracting object properties through hapticexploration. Acta Psychol. (Amst) 84, 29–40.
Lederman, S.J., Summers, C., Klatzky, R.L., 1996. Cognitive salience of haptic objectproperties: role of modality-encoding bias. Perception 25, 983–998.
Lewald, J., 2002. Vertical sound localization in blind humans. Neuropsychologia 40,1868–1872.
Maris, E., Oostenveld, R., 2007. Nonparametric statistical testing of EEG- and MEG-data.J. Neurosci. Methods 164, 177–190.
Mauguiere, F., Allison, T., Babiloni, C., Buchner, H., Eisen, A.A., Goodin, D.S., et al., 1999.Somatosensory evoked potentials. The Int. Fed. Clin. Neurophysiol. 52(Electroencephalogr. Clin. Neurophysiol. Suppl), 79–90.
Merabet, L.B., Pascual-Leone, A., 2010. Neural reorganization following sensory loss: theopportunity of change. Nat. Rev. Neurosci. 11, 44–52.
Noppeney, U., Friston, K.J., Ashburner, J., Frackowiak, R., Price, C.J., 2005. Early visualdeprivation induces structural plasticity in gray and white matter. Curr. Biol. 15,R488–R490.
Oostenveld, R., Fries, P., Maris, E., Schoffelen, J.M., 2011. FieldTrip: open sourcesoftware for advanced analysis of MEG, EEG, and invasive electrophysiological data.Comput. Intell. Neurosci. 2011, 156869.
Palva, S., Linkenkaer-Hansen, K., Naatanen, R., Palva, J.M., 2005. Early neural correlatesof conscious somatosensory perception. J. Neurosci. 25, 5248–5258.
Pan, W.J., Wu, G., Li, C.X., Lin, F., Sun, J., Lei, H., 2007. Progressive atrophy in the opticpathway and visual cortex of early blind Chinese adults: a voxel-based morphometrymagnetic resonance imaging study. Neuroimage 37, 212–220.
Pascual-Leone, A., Torres, F., 1993. Plasticity of the sensorimotor cortex representation ofthe reading finger in Braille readers. Brain 116 (Pt 1), 39–52.
31
Pe~na-Casanova, J., 1999. Intervenci�on cognitiva en la enfermedad del Alzheimer.Fundaci�on La Caixa, Barcelona.
Perrin, F., Pernier, J., Bertrand, O., Echallier, J.F., 1989. Spherical splines for scalppotential and current density mapping. Electroencephalogr. Clin. Neurophysiol. 72,184–187.
Pietrini, P., Furey, M.L., Ricciardi, E., Gobbini, M.I., Wu, W.H., Cohen, L., et al., 2004.Beyond sensory images: object-based representation in the human ventral pathway.Proc. Natl. Acad. Sci.U.S.A 101, 5658–5663.
Roder, B., Rosler, F., Hennighausen, E., Nacker, F., 1996. Event-related potentials duringauditory and somatosensory discrimination in sighted and blind human subjects.Brain Res. Cogn. Brain Res. 4, 77–93.
Rodríguez-Fornells, A., Kurzbuch, A.R., Münte, T.F., 2002. Time course of error detectionand correction in humans: neurophysiological evidence. J. Neurosci. 22 (22),9990–9996.
Sadato, N., Pascual-Leone, A., Grafman, J., Deiber, M.P., Ibanez, V., Hallett, M., 1998.Neural networks for Braille reading by the blind. Brain 121 (Pt 7), 1213–1229.
Sadato, N., Pascual-Leone, A., Grafman, J., Ibanez, V., Deiber, M.P., Dold, G., et al., 1996.Activation of the primary visual cortex by Braille reading in blind subjects. Nature380, 526–528.
Sterr, A., Green, L., Elbert, T., 2003. Blind Braille readers mislocate tactile stimuli. Biol.Psychol. 63, 117–127.
Sterr, A., Muller, M.M., Elbert, T., Rockstroh, B., Pantev, C., Taub, E., 1998. Perceptualcorrelates of changes in cortical representation of fingers in blind multifinger Braillereaders. J. Neurosci. 18, 4417–4423.
Thorpe, S, Fize, D, Marlot, C., 1996. Speed of processing in the human visual system.Nature 381 (6582), 520–522.
Uhl, F., Franzen, P., Lindinger, G., Lang, W., Deecke, L., 1991. On the functionality of thevisually deprived occipital cortex in early blind persons. Neurosci. Lett. 124 (2),256–259.
Uhl, F., Kretschmer, T., Lindinger, G., Goldenberg, G., Lang, W., Oder, W., Deecke, L.,1994. Tactile mental imagery in sighted persons and in patients suffering fromperipheral blindness early in life. Electroencephalography Clin. Neurophysiol. 91 (4),249–255.
Van Boven, R.W., Hamilton, R.H., Kauffman, T., Keenan, J.P., Pascual-Leone, A., 2000.Tactile spatial resolution in blind braille readers. Neurology 54, 2230–2236.
Vercillo, T., Burr, D., Gori, M., 2016. Early visual deprivation severely compromises theauditory sense of space in congenitally blind children. Dev. Psychol. 52, 847–853.
Voss, P., Collignon, O., Lassonde, M., Lepore, F., 2010. Adaptation to sensory loss. Wiley.Interdiscip. Rev. Cogn. Sci. 1, 308–328.
Wan, C.Y., Wood, A.G., Reutens, D.C., 2010. Congenital blindness leads to enhancedvibrotactile perception. Neuropsychologia 48, 631–635.
Wittenberg, G.F., Werhahn, K.J., Wassermann, E.M., Herscovitch, P., Cohen, L.G., 2004.Functional connectivity between somatosensory and visual cortex in early blindhumans. Eur. J. Neurosci. 20, 1923–1927.
Zhang, M., Weisser, V.D., Stilla, R., Prather, S.C., Sathian, K., 2004. Multisensory corticalprocessing of object shape and its relation to mental imagery. Cogn. Affect. Behav.Neurosci 4, 251–259.