neural network models of categorical...
TRANSCRIPT

Neural Network Models of
Categorical Perception
Presented by Jin Huang
Paper by R.I. Damper and S.R. Harnad
University of Southampton

Overview• Background
•What is categorical Perception
•Formants
•VOT(Voice onset time)
•ABX test
•Characterization of CP
•Early characterization of CP
•Signal Detection and Criterion-Setting Theories
•Neural Models of CP
•BSB
•TRACE
•Competitive Learning and Category Detecting Neurons
•Back-Propagation
•Categorization of Stop Consonants by Neural Networks
•Stimuli and Pre-Processing
•BSB
•BP
•Synthetic CP and Signal Detection Theory
•Implication of Synthetic CP
•Conclusions and Future work

What is categorical perception?
Categorical perception is the experience of percept invariance in
sensory phenomena that can be varied along a continuum.
Within a particular part of the continuum, the percepts are perceived as
the same, with a sharp change of identity at the position of the
continuum where there is identify change.
Multiple views of a face, for example, are mapped onto a common
identity, visually distinct objects such as cars are mapped into the
same category and distinct speech tokens are identified as belonging
to the same phonetic distinct and separate percept.
Categorical perception is opposed to continuous perception, the
perception of different sensory phenomena as being located on a
smooth continuum.

Early Characterizations from
speech CP
The study of speech perception has been almost
synonymous with the study of categorical perception.
Then…
Liberman et al. (1957) investigated the perception of
syllable-initial stop consonants (/b/, /d/ and /g/)
varying in place of articulation, cued by second-
formant transition.
Liberman, Delattre and Cooper (1958) went on to
study the voiced/voiceless contrast cued by first-
formant (F1) cutback, or voice onset time (VOT).
Confused?

What is the formants?
The peaks that are observed in the spectrum envelope are called formants
A spectrogram plots frequency (vertical) against time (horizontal) with sound level in grey-scale. The horizontal axis is time, dark represents high power, and the horizontal bands in the broad band M0 section clearly show four broad peaks in the spectral envelope

What is the formants?
The peaks that are observed in the spectrum envelope are called formants

And VOT?
VOT, is a feature of the production of consonants. It is defined as the length of time that passes between when a consonant is released and when voicing, the vibration of the vocal folds, begins.
Voice onset time
+ Aspirated: pen, ten, Ken
0 Tenuis(unaspirated): spun, stun,
skunk
− Voiced: bin, den, gone,

And ABX test?
A subject is presented with two known samples (sample A, the reference, and sample B, an alternative), and one unknown sample X, for three samples total. X is randomly selected from A and B, and the subject identifies X as being either A or B.
then the null hypothesis cannot be rejected and it cannot be proven that there is a perceptible difference between samples A and B.

Perception of stop
consonants(1957)
Perception was found to be
categorical, in that a steep
labeling function and a peaked
discrimination function (in an
ABX task) were observed, with
the peak at the phoneme
boundary corresponding to the
50% point of the labeling curve
Generated by the
Haskins Laboratories
parallel resonance
synthesizer.

Perception of stop
consonants(1957)As the place of articulation moves
back in the vocal tract from bilabial
(for a / ba–pa / VOT continuum)
through alveolar (/da–ta /) to velar
(/ga–ka /), so the boundary moves
from about 25ms VOT through
about 35ms to approximately
42ms
CP is more than merely bisecting a
continuum, at least not linearly
(otherwise the boundary should be
at mid-range in all three cases).

Early Characterization of CP
Mean identification functions obtained for bilabial, alveolar and velar
synthetic VOT series for human listeners and chinchillas.
Perception is not the feature that only human has.
CP of animals

The four features of CP:The emerging classical characterization of CP has been
neatly summarized by Treisman, Faulkner, Naish and
Rosner (1995) as encompassing four features:
A sharp category boundary
A corresponding discrimination peak
The predictability of discrimination
function from identification
And resistance to contextual effects
Criticism…

Signal Detection and Criterion-
setting Theories•When and how categorization happens?
•The classical notions of CP are ambiguous about which of
the representations are categorical: Information passed
between sensory and decision processes could be
categorical or contiguous.
•SDT clearly separates measures of sensitivity form measures
of response bias
•Another problem is : Is the internal criterion fixed or can it shift
as experience changes?
•The answer is yes according to CST.
•―A sensory system resets the response criterion between
each trial according to the ―the latest information available
to about its own sensory performance and the
environment.‖

Signal Detection and Criterion-
setting Theories
•The transformation of stimulus to response can be seen as a two-stage
process of a sensory operation followed by a decision operation. This is
consistent with signal detection theory‘s separation of sensitivity and
response bias measures.
•there are two routes from sensory processing to decision: one
continuous (X) and the other discrete (X )

Prediction of Discrimination from
IdentificationFor judgements involving just two categories, where the prior probability
of each is equal, the proportion correct in discrimination is predicted as
where pA is the probability of identifying the A stimulus as one of the two
categories, pB is the probability of identifying the B stimulus as that same
category, and the guessing probability is 0.5.

Association Model
We wish to associate the pattern
f with the pattern g so that later
presentation of fi alone will give
rise to gi .
Then
Typo? P5
Assuming f is mutually orthogonal, and |f|=1. So we get:

Auto Association Model
Instead of associating from inputs to outputs, the model directly
associate inputs to themselves.
Look familiar? Eigenvector.

Auto Association Model
Instead of associating from inputs to outputs, the model directly
associate inputs to themselves.
Look familiar? This is eigenvector.
Then any random input vector(non-orthogonal) could be expressed
as linear combination of the eigenvectors. And the output can be
interpreted as how commonly(kj) the corresponding eigenvector is
presented.

Another extension, saturation
•So the feedback connection matrix is trying to store the
eigenvectors of the inputs.
•And the positive feedback will soon saturate all units.
•The units will converge to some stable states.
•The final stable states corresponding to some corners of a
hypercube in its N-dimensional state space are the eigenvectors of
feedback matrix.
•This is the reason why this model is called brain-state-in-a-box.

Simulation
Simulation: 8-dimensional inputs, 2 eigenvectors, connection matrix
initialized by the two eigenvectors. Then inputs to the model
consisted of equally spaced between prototype eigenvectors
adding some Gaussian noises.
Then the response of the model was recorded as the proportion of
final states that are labeled to 0. As the standard deviation grows, it is
more likely to converge to unlabeled corner(rubbish state).

ABX task•This is a simple two-class problem considering only whether two
inputs to the net are discriminable if they converged to different
states.
•If they converge to the same states, a guess was made with
probability 0.5.
•Reaction time(the number of iterations required to converge)
increases while the inputs are closer to the category boundary.
•And this model is ―quite usable‖ even with non-orthogonal inputs.
Why? (Inputs vectors will invoke corresponding similar unit, with
positive feed back, the most similar vector stored in the connection
matrix will grow until saturate, thus converge to most common
similar vector.)

Trace ModelThree layers:
1. Word layer
2. Phoneme layer
3. Feature layer
Three kinds of connections:
1. Feed-forward excitatory
connections(Bottom-up);
2. Lateral Inhibitory
connections;
3. Feedback excitatory
connections from word to
phoneme layer(Top-
down).
http://maglab.psy.uconn.edu/jtrace/
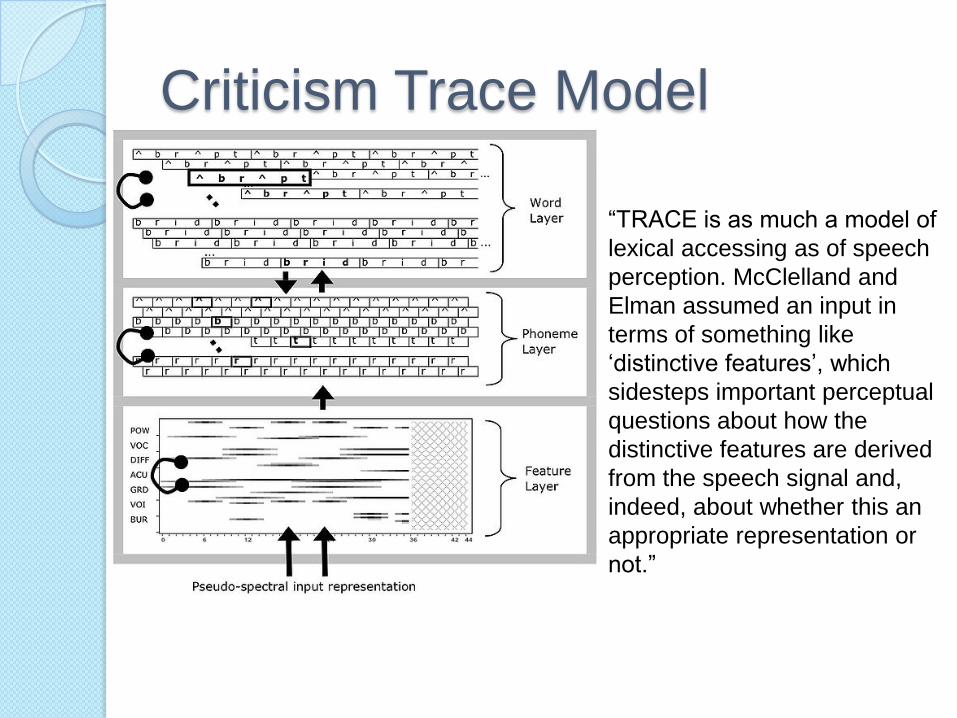
Criticism Trace Model
―TRACE is as much a model of
lexical accessing as of speech
perception. McClelland and
Elman assumed an input in
terms of something like
‗distinctive features‘, which
sidesteps important perceptual
questions about how the
distinctive features are derived
from the speech signal and,
indeed, about whether this an
appropriate representation or
not.‖

Criticism Trace Model
Grossberg(1986): ―Categorical perception can . . . be anticipated
whenever adaptive filtering interacts with sharply competitive tuning, not
just in speech recognition experiments.‖

Criticism Trace Model
Quinlan(1991) accordingly makes the following criticism of TRACE:
―Indeed, k determined the shape of the identification functions . . . A
rather uncharitable conclusion . . . is that the model has been fixed up to
demonstrate categorical perception . . . Categorical perception does not
follow from any of the a priori functional characteristics of the net‖
Labeling functions after
post-processing using
Luce‘s choice model
with k = 5, and ABX
discrimination curve.

Back-propagationA back-propagation net with 8 input units, 2 - 12 hidden units and 8 or 9 output
units was used. The net's task was to learn to sort 8 "lines" into 2 categories (let
us call them "short" and "long").
Pre-categorization discrimination function was generated from "auto-
association―.
Different nets were trained, separately for each of the 6 representations of the 8
lines, to produce as output exactly the same pattern they received as input.
Inter-stimulus distances for all pairs of the 8 lines were then calculated as the
Euclidean distance between the vectors of hidden unit activations for each pair
of lines.
After auto-association the trained weights for the connections between the
hidden layer and the output layer were reloaded. The net was then given a
double task Auto-association (again) and categorization.
Then the distances above are calculated again. Then A CP effect was defined
as a decrease in within-category inter-stimulus distances and/or an increase in
between-category inter-stimulus distances relative to the auto-association-alone
baseline.

Back-propagation inputs codingCoding pattern is like this:
Place-coded: 00010000 Thermometer-coded: 11110000
Coarse- place-coded : 0, 0.001, 0.1, 0.99, 0.1, 0.001, 0, 0
Coarse-thermometer-coded: 0.9 0.99 0.99 0.90 0.1 0.001 0 0
Lateral-inhibitory-coarse- place-coded : 0.1 0.1 0.001 0.99 0.001 0.1 0.1 0.1
Lateral-inhibitory-coarse- thermometer-coded : 0.8 0.9 0.9 0.99 0.001 0.1 01 0.1
The strongest effect was obtained with the least iconic, most
arbitrary (place) code.
Hidden units more than two doesn‘t help a lot.
This implies that CP is not merely a byproduct of information
compression by the hidden layer. Nor was CP a result of over-
learning to extreme values.

Competitive learning and
category detecting neurons
A laboratory experiment with human
subjects in which stimuli from a novel
dimension were categorically
perceived(“The proportion of A relative
to B” dimension)
The stimuli were created by
interpolating (morphing) seven curves
between two randomly selected Bezier
endpoint curves.

Competitive learning and
category detecting neurons
A picture of curves are created with 128x128 pixels filtered by Gabor filter
with four orientations. Four overlapping receptive field with 6x6x4=144
components extracts local features.
A layer of hidden neurons is determined by radial basis function. which
become specialized for particular stimulus regions(“feature detecting
neurons”).

Competitive learning and
category detecting neuronsFor each category k, there is an associative classification node k, with
activation given by(f is sigmoid function):
Again the probability of responding category k is determined by
Luce‘s rule(k is fixed this time):
Gradient descent is used for learning:

Competitive learning and
category detecting neuronsSimulation were performed with input patters drawn from 28 points on
the morphed continuum.
And the cut-off(boundary) was placed between stimuli 10 and 1 for
left-split, and 18,19 for right split. In both cases, CP was observed.
Goldstone did not make a strict comparison of their human and
simulation data, because of the different numbers of curves in the two
continua studied. However, the form of their results can make
credible models of learned categorization.

Categorization of Stop
Consonants by Neural NetworkMotivation: Neural models of synthetic CP reviewed thus far have
all taken their inputs from artificial or novel dimensions, whereas the
vast majority of real CP studies have used speech stimuli—most
often stop consonants (or, more correctly, simplified analogs of such
sounds)
Goal: Consider the categorization of stop consonants by a variety
of neural models.
It is of considerable interest to ascertain if neural models of CP
reproduce this effect as emergent behavior.

Stimuli and Pre-processing
Gold standard stimuli with VOT varying in 10ms steps from 0 to
80ms, simulating English bilabial(/ba-pa), alveolar(/da-ta/) and
velar(/ga-ka/) syllables.
The stimuli were pre-processed for presentation to the various
nets using a computational model of the peripheral auditory
system.
The output of the auditory model is a neurogram (or neural
spectrogram) depicting the time of firing of a set of 128 simulated
auditory nerve fibers.
Spikes are counted in a 12x16 bin region stretching from 25ms to
95ms in 10ms steps in the time dimension and from 1 to 128 in
steps of 8 in the frequency (fiber CF index) dimension.

Brain-state-in-a-box model
Categorical perception of voice-onset time in the brain-state-in-a-box model
Left: Labeling functions for bilabial, alveolar and velar series. Right: One-step ABX
discrimination functions. (Obtained using same procedure with1977 Anderson‘s BSB)
Composite labeling functions for the alveolar series for humans, chinchillas and neural networks.
Left: Brain-state-in-a-box neural model. Right: Multi-layer perceptron

Back-propagation NetworkAs with the BSB model (and paralleling the animal experiments of
Kuhl and Miller, 1978), the net is trained on the 0ms and 80ms
endpoints and generalization is then tested using the full range of
VOT stimuli.
Each of the three nets had 192 input units, a number (n) of hidden
units, and a single output unit (with sigmoidal activation function)
to act as a voiced/unvoiced detector.
On only one exceptional
occasion was a hidden-
unit coding arrived at for
which h1 and h2 for the
different endpoints were
not both different

Back-propagation Network
Labeling function
•Typical labeling functions (from the seven of each) obtained by
averaging output activations over the 50 stimulus presentations at each
VOT value for the three nets.
•These are in excellent agreement with the literature at least in the case
of the alveolar and velar stimuli

Back-propagation Network
Discrimination function
Let the absolute difference in activation between the X and A
inputs be |X – A| ; similarly |X – B|. The classification rule is
then:
•But |X – A| and |X –B| were occasionally almost indistinguishable in
simulations, in that they differed only in the 4th or 5th decimal place.
•To avoid making the simulation too sensitive to round-off errors, we
therefore introduced a guessing threshold, g. X was only classified by
the rule above when
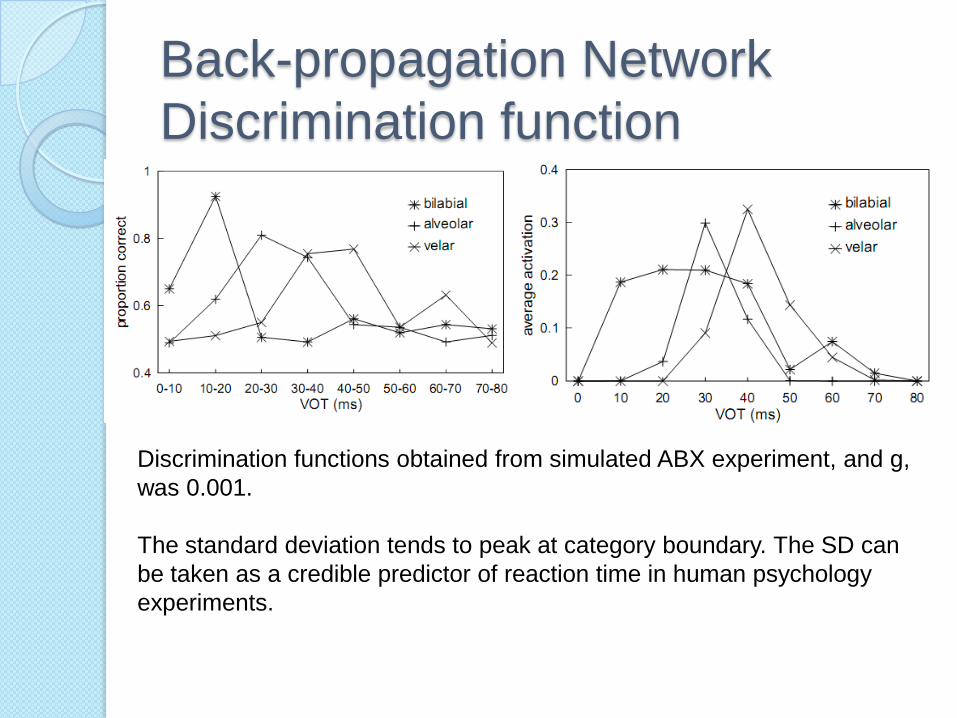
Back-propagation Network
Discrimination function
Discrimination functions obtained from simulated ABX experiment, and g,
was 0.001.
The standard deviation tends to peak at category boundary. The SD can
be taken as a credible predictor of reaction time in human psychology
experiments.

Implication of Synthetic CP•Synthetic CP is an emergent property of learning systems in general then
why are strong CP effects not always found?
•No priori knowledge about category boundary:
• Predetermined by the labels supplied during training.
• At the center of the continuum
• The inputs:
• The potential for categorization must be implicit in the physical
stimulus continuum and its encoding schema.
• What is supposed to be a ‗continuum‘ is actually not. In other
words, what is supposed to be one-dimensional continuum(only
VOT and features perfectly correlated with it vary) is actually
multidimensional.

Conclusions & Future work• Neural nets provide an under-explored yet revealing way of studying CP.
• In, early studies of CP, low-threshold theories assumes a mapping of sensory
stimuli to discrete internal states. But for more modern methods, signal
detection theory, assumes a continuous internal representation.
• CP is not a special mode of perception, it is an emergent property of learning
systems in general, and their interaction with the stimulus continuum mediated
by sensory transduction and/or early perceptual processing.
• Precise time seems unnecessary for the credible modeling of VOT perception.
The 9192-component neural spike-counting procedure avoids this. But what
would happen if applying inputs directly without intervening.
• To use real speech
• Analyses to determine aspects of peripheral auditory transformation which
are essential to simulating boundary movement with place of articulation.

Thank you, any questions,
comments?