network performance score - mobile wireless testing
TRANSCRIPT

White paper | Version 01.00 | Dr. Jens Berger, Johanna Sochos, Dr. Marija Stoilkovic
NETWORK PERFORMANCE SCORE

22
CONTENTS1 Introduction .........................................................................................................................4
2 Basic structure ....................................................................................................................5
3 Voice telephony ...................................................................................................................63.1 Voice telephony contributors ...................................................................................................... 6
3.1.1 Accessibility and retainability – success ratio .................................................................................. 63.1.2 Call setup time ................................................................................................................................... 63.1.3 Perceptual objective listening quality analysis (POLQA) in line with ITU-T P.863 ............................ 7
3.2 Contributors transformation to a percentage scale .................................................................... 8
4 Data services .......................................................................................................................94.1 Data transfer services ................................................................................................................. 9
4.1.1 Availability/accessibility – HTTP UL/DL success ratio ..................................................................... 94.1.2 Data transfer performance – HTTP DL/UL throughput .................................................................. 104.1.3 Data transfer services – contribution and weighting ..................................................................... 11
4.2 Video streaming services .......................................................................................................... 114.2.1 Typical video streaming service structure ....................................................................................... 124.2.2 Video streaming services performance contributors ...................................................................... 124.2.3 Video streaming services – contribution and weighting ................................................................ 13
4.3 HTTP browsing and social media ............................................................................................. 134.3.1 HTTP browsing ................................................................................................................................ 134.3.2 Browsing/social media – contribution and weighting .................................................................... 15
5 Regions and final aggregation categorization ...................................................................16
6 Point score application ......................................................................................................17
7 Summary ...........................................................................................................................20
Appendix A ........................................................................................................................21
A-1 Testing HTTP browsing in benchmarking campaigns .......................................................21A-1.1 Introduction .............................................................................................................................. 21A-1.2 Selection criteria for websites .................................................................................................. 21A-1.3 Best practice for selecting websites ........................................................................................ 23A-1.4 Websites in benchmarking campaigns – statistical analysis ................................................. 23
A-2 Measurement scenarios ....................................................................................................25A-2.1 Job structures .......................................................................................................................... 26
A-2.1.1 Call session ..................................................................................................................................... 26A-2.1.2 Data session .................................................................................................................................... 26
A-2.2 Voice test settings .................................................................................................................... 27A-2.2.1 Double ended call settings .............................................................................................................. 27
A-2.3 Data test settings ..................................................................................................................... 27A-2.3.1 Ping testing ..................................................................................................................................... 27A-2.3.2 Data transfer testing ....................................................................................................................... 28A-2.3.3 Video streaming service testing ...................................................................................................... 30A-2.3.4 HTTP browsing and social media service testing ........................................................................... 30
A-2.4 Rohde & Schwarz measurement systems ................................................................................. 31A-2.5 NPS campaign setup in SmartBenchmarker ............................................................................ 33A-2.6 Postprocessing ......................................................................................................................... 35

Rohde & Schwarz | White paper Network Performance Score 3
Appendix B .......................................................................................................................37
B-1 Network performance score (NPS V1.0) ..........................................................................37B-1.1 KPIs, weightings and thresholds .............................................................................................. 37B-1.2 Maximum scoring points per category ..................................................................................... 38B-1.3 Improvement in points .............................................................................................................. 39B-1.4 Abbreviations ............................................................................................................................ 41
Customer support ..............................................................................................................42Technical support – where and when you need it .................................................................... 42Up-to-date information and upgrades ...................................................................................... 42Regional contact ....................................................................................................................... 42
This white paper describes the structure and application of an integrated and transparent methodology to characterize mobile network performance.

4
1 INTRODUCTIONThe perceived technical performance of a network depends on how satisfied users are with the quality and availability of telecommunications services. Smartphones are not only used for telephony and text messaging services; today, they are predominately used for over-the-top (OTT) data services.
There is a demand for an efficient method of calculating an overall score that reflects the perceived technical performance of a network or one of its subsets, such as a region, a period of time or a technology. The method described here considers and weights the key performance indicators (KPI) for a wide range of services that are essential for and rep-resentative of the service quality and combines them into an overall performance score. This score can be calculated for individual regions such as cities, highways and popular areas. The scores of the individual regions are then aggregated in an overall network per-formance score.
There are two approaches to aggregation: ► Applying a scaling of 0 % to 100 % to each level. This allows direct comparison of individual regions or service types and is used for benchmarking purposes.
► Assigning points to each individual subscore instead of applying a scaling. The maximum number of points for a KPI or a subscore is defined by its weighting in the overall score based on the weighting of the service category, e.g. telephony or data, and the weighting of the regional category, e.g. city or road. All points are accumulated to determine the overall score in points. This point scale (from 0 to 1000) can be considered a network optimization tool since it makes it easy to identify the best place to improve the overall performance.
Between these two scales, there is a transformation of the applied weightings for the in-dividual services. Section 2 Basic structure to section 5 Regions and final aggregation categorization explain the KPIs used and the structure of the score based on the percent-age score. The point score is explained separately in section 6 Point score application.
The scoring mechanism allows very efficient comparison of operators in a market, of dif-ferent measurement campaigns in regions and countries, or before and after deploy-ment of new technology or software. The transparent structure of the score allows effi-cient drilldown to the region, service or even the KPIs responsible for a nonoptimal overall score.
The scoring methodology is in line with the current state of the ETSI TR 103 559 V1.1.1 and is available in Rohde & Schwarz mobile network testing (MNT) products as network performance score version 1.1.
This score only takes into account the technical performance of the services; other dimen-sions of user satisfaction such as billing, tariffs and support quality are not considered.

Rohde & Schwarz | White paper Network Performance Score 5
2 BASIC STRUCTUREThe structure of the network performance score is highly transparent and consists of dif-ferent layers of weighting and accumulation.
On the technical side, the score is based on telephony and data services subscores, each of which is scaled separately from 0 % to 100 %. Each of these two subscores consists of a set of comprehensive KPIs or contributors. Today, the subscores have weightings of 40 % telephony and 60 % data services and form a complete network score.
Fig. 1: Network performance score basic structure
It is possible to apply an additional intermediate weighting layer that gives different weightings for individual regions and categories such as cities, connecting roads, hotspots and rural areas. The weighted and cumulative scores for the subregions again range from 0 % to 100 %.
Fig. 2: Network performance score subregions
The number, categorization and weighting of these regions is flexible and can be defined to meet regional or national needs. This regional categorization is described in section 5 Regions and final aggregation categorization.
0 % to 100 %
0 % to 100 %40 %
Telephony
0 % to 100 %
60 %
Data services
0 % to 100 %
x
Cities
Tele
phon
y
Data
ser
vice
s
0 % to 100 % 0 % to 100 %
y
Connecting roads
Tele
phon
y
Data
ser
vice
s
0 % to 100 %
z
Spots
Tele
phon
y
Data
ser
vice
s
...

6
3 VOICE TELEPHONYThe telephony subscore is based on the end-user experience of telephony services. Service availability, accessibility, retainability and performance are evaluated to determine the score.
3.1 Voice telephony contributorsThe contributors (KPIs) for telephony performance are:
► Call setup success ratio (CSSR) ► Call drop ratio (CDR) ► Call setup time (CST) average ► CST > 15 s ratio ► CST 10th percentile ► Voice mean opinion score (MOS) average ► Voice MOS < 1.6 ratio ► Voice MOS 90th percentile
The contributors are described in more detail in the following.
3.1.1 Accessibility and retainability – success ratioCall setup success ratio (CSSR) is the percentage of all attempts to make a call that result in a connection to the dialed number. Typical ratios are between 90 % and 100 %.
CSSR is a straightforward calculation:
Note: Successfully established calls include completed calls and established but dropped calls. Attempts include completed, dropped and failed calls.
Call drop ratio (CDR) is the percentage of telephone calls that were cut off due to tech-nical reasons before the speaking parties finished their conversation and before one of them intentionally hung up. This KPI is measured as a percentage of all successfully es-tablished calls. Typical scores are < 10 %.
The formula only considers completed and dropped calls as successfully established:
3.1.2 Call setup timeIn Rohde & Schwarz SwissQual measurement systems, the call setup time (CST) is taken from the application layer. The CST is the time interval from the point when the user starts dialing until the call is reported as connected to the user. It takes into account both the telephone software’s configuration and processing times, and results in a setup time as perceived by the user.
Note: There is a difference between the CST described above and the shorter call setup times measured at the signaling level.
Call setup time (CST) average is the overall average performance of the network or of the applied selection of measurements. This value is calculated as the average of all mea-sured CSTs for all completed and dropped calls.
Number of successfully established callsCSSR = Number of attempts
Number of dropped callsCDR = Number of completed + Number of dropped calls

Rohde & Schwarz | White paper Network Performance Score 7
CST > 15 s ratio is a KPI used to identify poor performers. Usually, the contribution of this KPI is important due to fact that users have a very negative perception when some-thing goes wrong while they consider exceptional service as the norm.
CST 10th percentile is the threshold below which the shortest 10 % of CST values fall. This score rewards best performers and gives an indication of the shortest CST reachable in a technology or region. The 10 % percentile value also indicates a good practice expec-tation of what is possible with respect to the CST for a region, technology or weighting.
3.1.3 Perceptual objective listening quality analysis (POLQA) in line with ITU-T P.863To assess the speech quality provided by mobile operators, three KPIs are defined based on the ITU-T P.863 (POLQA) MOS. ITU-T P.863 is used in its super-wideband/fullband mode to access HD voice/wideband channels correctly. The applied ITU-T P.863 algorithm considers the full audio spectrum applied to EVS-SWB and FB codecs as deployed in VoLTE.
The POLQA scores are evaluated per speech sample, each call delivering multiple individ-ual scores into the analysis in both directions of the conversation (half-duplex).
The absolute POLQA score depends on the test speech signal used. It is recommended to use reference signals specified in ITU P.501 Annex D and apply the same signal for all measurements in a campaign for comparison reasons. A good example is the English test sample “EN_fm_P501”, which is part of the Rohde & Schwarz system installation.
Voice MOS average measures the overall, average speech quality performance of a network or a selection of measurements. This KPI is the plain average of all considered POLQA scores without any further preselection, exclusion or weighting. Typical MOS scores are around 3.0 for narrowband channels and 3.5 to 3.7 for wideband (HD voice) channels.
Note: Silence in the audio channel is not part of the mean opinion score (MOS); it is in-directly considered, either by failed calls due to silence or by dropped calls where silence typically occurs shortly before a call drops.
Voice MOS < 1.6 ratio is the ratio of very bad speech samples. Considering the strong negative perception of low quality, this score explicitly penalizes high ratios of bad samples.
Voice MOS 90th percentile is the threshold above which the best 10 % of voice MOS values fall. It rewards good performers, keeping in mind that users perceive very good performance very positively. It also gives an indication of the MOS scores that are attain-able with a given setup or technology (based on the applied selection of measurement data).
8
3.2 Contributors transformation to a percentage scaleThe described contributors are scaled according to their original units, i.e. seconds for the CST, MOS for speech quality and percentage for all ratios. To ensure the transparency and comparability of the actual contribution of each contributor/KPI to the voice telephony subscore, each contributor is also scaled on a percentage scale.
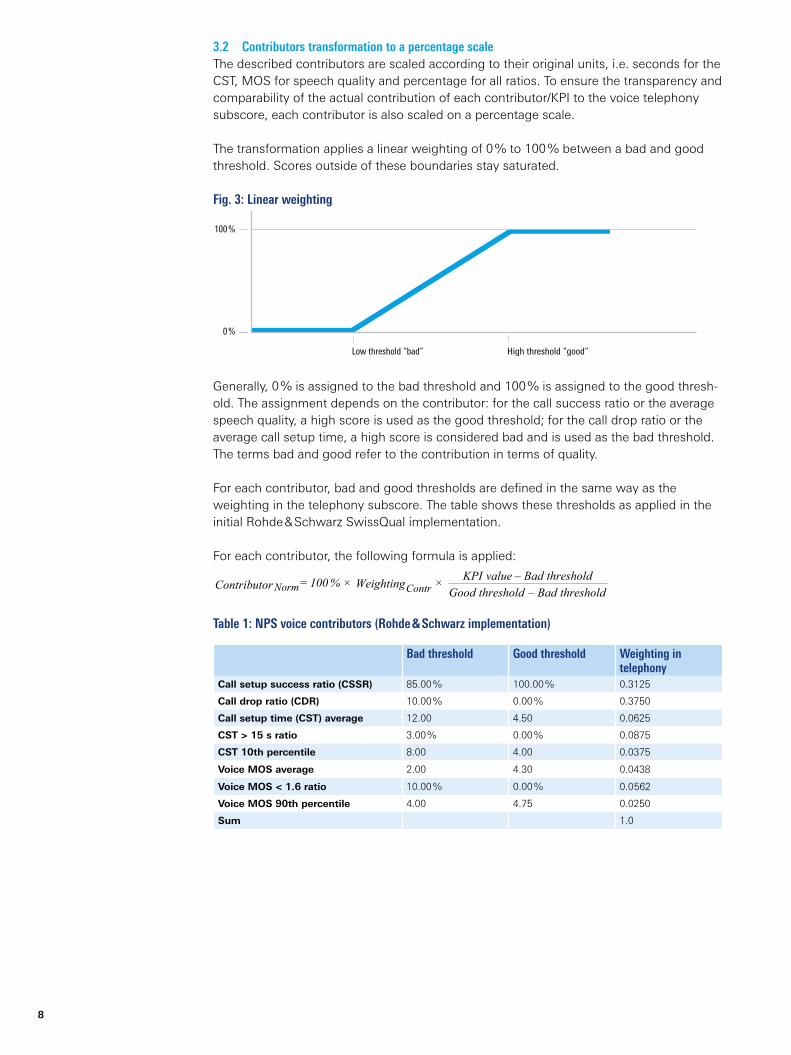
The transformation applies a linear weighting of 0 % to 100 % between a bad and good threshold. Scores outside of these boundaries stay saturated.
Fig. 3: Linear weighting
Generally, 0 % is assigned to the bad threshold and 100 % is assigned to the good thresh-old. The assignment depends on the contributor: for the call success ratio or the average speech quality, a high score is used as the good threshold; for the call drop ratio or the average call setup time, a high score is considered bad and is used as the bad threshold. The terms bad and good refer to the contribution in terms of quality.
For each contributor, bad and good thresholds are defined in the same way as the weighting in the telephony subscore. The table shows these thresholds as applied in the initial Rohde & Schwarz SwissQual implementation.
For each contributor, the following formula is applied:
Table 1: NPS voice contributors (Rohde & Schwarz implementation)
Bad threshold Good threshold Weighting in telephony
Call setup success ratio (CSSR) 85.00 % 100.00 % 0.3125
Call drop ratio (CDR) 10.00 % 0.00 % 0.3750
Call setup time (CST) average 12.00 4.50 0.0625
CST > 15 s ratio 3.00 % 0.00 % 0.0875
CST 10th percentile 8.00 4.00 0.0375
Voice MOS average 2.00 4.30 0.0438
Voice MOS < 1.6 ratio 10.00 % 0.00 % 0.0562
Voice MOS 90th percentile 4.00 4.75 0.0250
Sum 1.0
0 %
100 %
Low threshold “bad” High threshold “good”
Norm ContrKPI value – Bad threshold = 100 % × × WeightingContributor Good threshold – Bad threshold

Rohde & Schwarz | White paper Network Performance Score 9
4 DATA SERVICESThe data services subscore consists of three areas of contributors addressing different types of services and characterizing different types of requests in a network:
► (Plain) data transfer (HTTP) (25 %) ► Video streaming (22 %) ► HTTP browsing (38 %) and social media (15 %)
Similar to voice telephony, each area consists of a set of individual contributors quantify-ing the typical midrange, rewarding outstanding performers and giving an extra bonus for operators with little or no bad performance.
4.1 Data transfer servicesThe plain data transfer performance is calculated by HTTP download and upload. Availability/accessibility and transfer performance are separated.
For availability/accessibility, a file of a fixed size is completely downloaded.
For the transfer performance, multiple connections are opened and the transfer rate is measured for a given time. This test is also known as the capacity test.
The individual contributors to this area are: ► HTTP UL/DL success ratio ► HTTP DL throughput average ► HTTP DL throughput 10th percentile ► HTTP DL throughput 90th percentile ► HTTP UL throughput average ► HTTP UL throughput 10th percentile ► HTTP UL throughput 90th percentile
4.1.1 Availability/accessibility – HTTP UL/DL success ratio The HTTP UL/DL success ratio measures the data service availability/accessibility. It is the ratio of successfully completed tests (completed downloads and uploads) to all started tests. It rates both nonavailability and incomplete uploads and downloads in one score.
Successfully completed tests are tests with ErrorCode = 0 (state = success). Attempts include successfully completed tests and tests with ErrorCode ≠ 0 (state = test timeout, HTTP request timeout, file transfer failed, etc.).
The applied settings for the HTTP UL/DL tests are: ► Uplink
– File size: 2 Mbyte – Timeout for completion: 40 s (requires min. 0.4 Mbit/s)
► Downlink: – File size: 5 Mbyte – Timeout for completion: 40 s (requires min. 1.0 Mbit/s)
Number of successfully completed testsHTTP UL / DL success ratio = Number of attempts

10
4.1.2 Data transfer performance – HTTP DL/UL throughput Data throughput is what users experience most of the time while using a data service. It depends on many protocol issues such as transmission schemes (slower schemes are used at longer distances from the access point due to better redundancy), packet retrans-mission and packet size. The typical throughput is often lower due to traffic sharing inside the same network or cell, interference or even limited fixed line capacity from the base station onwards.
The total duration of an HTTP transfer test is set to 10 s with a connection lost timeout of 3 s and transfer duration of 7 s (see Table 15: HTTP DL test – multi-connection and Table 16: HTTP UL test – multi-connection). These parameters are the same for both upload and download tests. The active transfer duration starts only after all configured TCP sock-ets have been connected.
As an indicator of the average data throughput, the mean data rate (MDR) is calculated. For an HTTP transfer test, the MDR is calculated as the sum of all transferred bytes during the test’s active transfer period divided by the transfer time. It is calculated separately for upload and download data.
In the calculation, all tests with ErrorCode = 0 are considered. Tests where the TCP con-nection could not be established for any or all sockets, tests for which the server is not re-sponding (ErrorCode ≠ 0) or tests classified as system release are excluded.
HTTP DL/UL throughput average is the main score and quantifies the average transfer rate in Mbit/s across a network or an applied selection of measurement data.
HTTP DL/UL throughput 10th percentile is a KPI that measures the poor performance of a network, i.e. the data rate below which the worst 10 % of transfers fall. It is used to con-sider the negative perception if there is a very slow transfer that is not well considered in the average throughput.
Example:There are 100 DL tests, 85 with 120 Mbit/s and 15 with just 0.5 Mbit/s. The average MDR is considered good at 102 Mbit/s even if 15 % of the tests have a much lower value. The 10 % percentile MDR indicates this with a score of 0.5 Mbit/s. Consequently, such a net-work is rated lower than one having consistently 102 Mbit/s in all tests.
HTTP DL/UL throughput 90th percentile is a KPI that evaluates the good performance of the network, i.e. the best 10 % of transfers are above this value. The goal of this KPI is to find the maximum performance of the network or the selected measurements. The 90 % percentile value is preferred over the absolute maximum (which is just a single test) and is considered a more reliable KPI for showing the network’s full capacity.
all mean data rates per testMean data rate per test = Number of tests
∑
all mean data rates per testHTTP DL / UL throughput average = Number of tests
∑
Rohde & Schwarz | White paper Network Performance Score 11
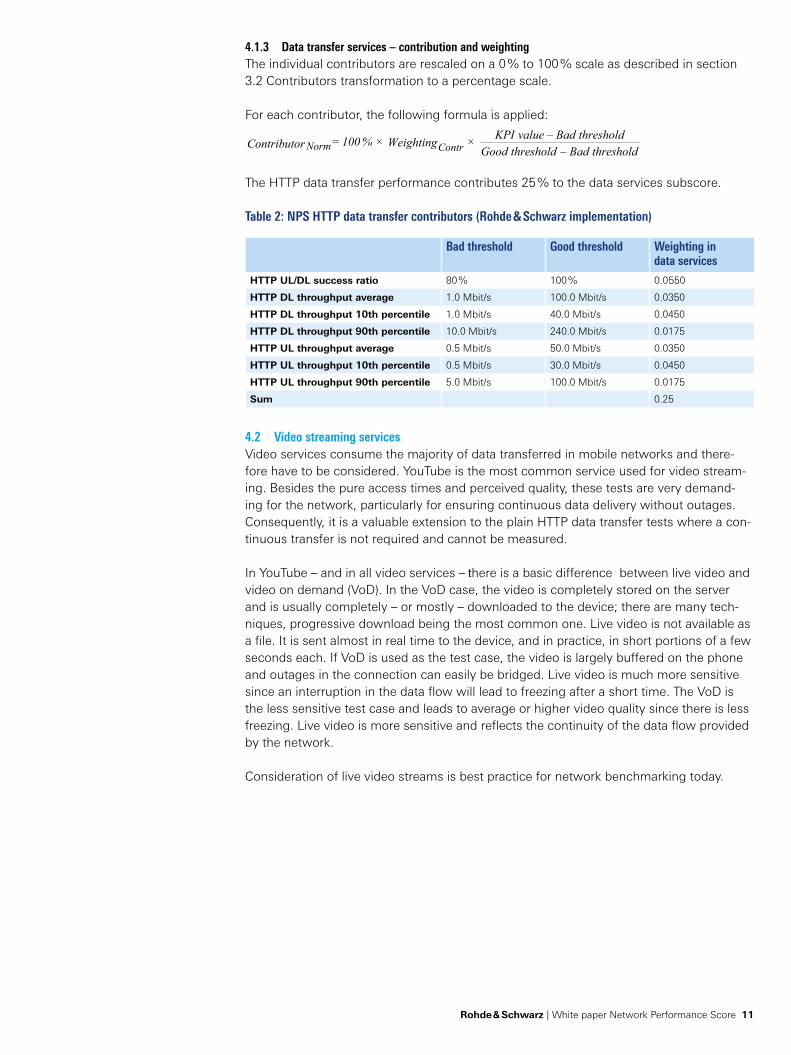
4.1.3 Data transfer services – contribution and weightingThe individual contributors are rescaled on a 0 % to 100 % scale as described in section 3.2 Contributors transformation to a percentage scale.
For each contributor, the following formula is applied:
The HTTP data transfer performance contributes 25 % to the data services subscore.
Table 2: NPS HTTP data transfer contributors (Rohde & Schwarz implementation)
Bad threshold Good threshold Weighting in data services
HTTP UL/DL success ratio 80 % 100 % 0.0550
HTTP DL throughput average 1.0 Mbit/s 100.0 Mbit/s 0.0350
HTTP DL throughput 10th percentile 1.0 Mbit/s 40.0 Mbit/s 0.0450
HTTP DL throughput 90th percentile 10.0 Mbit/s 240.0 Mbit/s 0.0175
HTTP UL throughput average 0.5 Mbit/s 50.0 Mbit/s 0.0350
HTTP UL throughput 10th percentile 0.5 Mbit/s 30.0 Mbit/s 0.0450
HTTP UL throughput 90th percentile 5.0 Mbit/s 100.0 Mbit/s 0.0175
Sum 0.25
4.2 Video streaming servicesVideo services consume the majority of data transferred in mobile networks and there-fore have to be considered. YouTube is the most common service used for video stream-ing. Besides the pure access times and perceived quality, these tests are very demand-ing for the network, particularly for ensuring continuous data delivery without outages. Consequently, it is a valuable extension to the plain HTTP data transfer tests where a con-tinuous transfer is not required and cannot be measured.
In YouTube – and in all video services – there is a basic difference between live video and video on demand (VoD). In the VoD case, the video is completely stored on the server and is usually completely – or mostly – downloaded to the device; there are many tech-niques, progressive download being the most common one. Live video is not available as a file. It is sent almost in real time to the device, and in practice, in short portions of a few seconds each. If VoD is used as the test case, the video is largely buffered on the phone and outages in the connection can easily be bridged. Live video is much more sensitive since an interruption in the data flow will lead to freezing after a short time. The VoD is the less sensitive test case and leads to average or higher video quality since there is less freezing. Live video is more sensitive and reflects the continuity of the data flow provided by the network.
Consideration of live video streams is best practice for network benchmarking today.
Norm ContrKPI value – Bad threshold = 100 % × × WeightingContributor Good threshold – Bad threshold

12
4.2.1 Typical video streaming service structureEach YouTube streaming test can be divided into two phases: the video access phase and the video playout phase. The video access phase starts with the video request and contin-ues until the first picture is displayed. This time is measured by the KPI video setup time or time to first picture (TTFP). Video setup time is the time interval from the point when a request to play a video is made to the moment when the video starts to play. It mea-sures the overall performance of the network in terms of accessibility to video streaming services.
Fig. 4: Typical video streaming service structure
After the playout starts, the perceived video quality is considered as the main contributor. The perceived video quality is determined by compression artifacts, rescaling effects, low-er frame rates and freezing (stalling) during the display. The perceived quality is measured by ITU J.343.1 and combines all possible degradations into one video MOS on a common scale from 1 to 5. ITU J.343.1 is especially recommended by ETSI TS 102250-2 for evalu-ating mobile streaming services. The testing methodology for YouTube and other video streaming services is described in ETSI TR 101578.
4.2.2 Video streaming services performance contributorsThe contributors (KPIs) for video stream performance are:
► Video success ratio ► Video setup average ► Video setup > 10 s ratio ► Video MOS average ► Video MOS 10th percentile
Video success ratio considers all tests that achieve the defined display time of the video. These tests are classified as completed. The typical display time applied for live YouTube streams is 45 s.
Attempts include tests with the following states: completed, failed and dropped.
The status failed or dropped is defined by timeouts because unlike for telephony, there is no ongoing signaling information available. A video streaming test is considered as failed if no picture is displayed within a defined timeout (connection timeout). This timeout de-fines therefore the maximum length of the video access phase. A timeout value of 30 s is used. A video streaming test is considered as dropped if 15 s of subsequent freezing (vid-eo pause) is observed. This stream lost timeout is considered the maximum time a viewer is willing to wait for the video to resume.
Video requested
First video packet arrivesPrebuffering
DNSConnect to server
Access phase Video playout phase
Start displayingVideo finished Displaying stopped by user
Number of successfully completed tests Video success ratio = Number of attempts
# test status Completed Video success ratio = # test status Completed + Failed + Dropped

Rohde & Schwarz | White paper Network Performance Score 13
Video setup average is the average value of all measured times to first picture (TTFP) for all completed and dropped tests. It quantifies the average length of the video access phase.
Video setup > 10 s ratio is the ratio of attempts where TTFP lasts longer than 10 s. This performance is considered to have a negative impact on the user experience and the per-ceived degradation.
Video MOS average is calculated for all successfully completed tests. It is defined as the average of already averaged video MOS (ITU J.341) per test. It incorporates all visible degradations during the video display into a MOS.
Video MOS 10th percentile is the threshold below which the lowest 10 % of video MOS values fall. This KPI evaluates poor network performance in terms of video quality. The percentile values focus on bad and very good performers. This KPI is calculated tak-ing into account only completed tests.
4.2.3 Video streaming services – contribution and weightingThe individual contributors are rescaled on a 0 % to 100 % scale as described in section 3.2 Contributors transformation to a percentage scale.
For each contributor, the following formula is applied:
The performance of video streaming services contributes 22 % to the data services subscore.
Table 3: NPS video streaming contributors (Rohde & Schwarz implementation)
Bad threshold Good threshold Weighting in data services
Video success ratio 80.0 % 100.0 % 0.1276
Video MOS average 3.0 4.5 0.0363
Video MOS 10th percentile 2.0 4.0 0.0363
Video setup average 7.0 s 2.0 s 0.0099
Video setup > 10 s ratio 5.0 % 0.0 % 0.0099
Sum 0.22
4.3 HTTP browsing and social mediaWeb browsing and social media apps are heavily used by today’s subscribers. They con-tribute much less to the amount of transferred data than video, but users spend consid-erable time using such services and therefore their performance is essential for the per-ceived network performance.
4.3.1 HTTP browsingHTTP browsing tests access (public) websites. They can be static like the well-known Kepler page or dynamic like usual webpages from commercial providers. Static means pages where all content (text, pictures, videos, etc.) is fixed and stored on one server. A dynamic page is a website where content changes regularly based on access and is spread across many locations and servers. A typical dynamic website, e.g. a popular newspaper, consists of several hundred items to download in individual connections from (different) servers.
Norm ContrKPI value – Bad threshold = 100 % × × WeightingContributor Good threshold – Bad threshold

14
Compared to a plain (multithreaded) HTTP download from a dedicated server, the HTTP browsing test includes problems in the wider core network and especially the content delivery network (CDN), and best reflects the user’s perception. The performance of HTTP browsing not only depends on the performance of the mobile network, but also on indi-vidual constellations of the CDN behind it. For a fair test, many different webpages have to be tested to have a good mix while connecting to external servers in the CDN.
The HTTP browsing tests considered in this scoring methodology should access a set of different pages. This set has to be a mix of static and dynamic pages where the Alexa rat-ing gives a valid indication of the most popular websites.
No matter what pages are used, all HTTP tests are considered equally by the contributors (KPIs) for HTTP browsing performance:
► Browsing success ratio ► Browsing duration average ► Activity duration > 6 s ratio
Browsing success ratio is the ratio of data tests with status OK (ErrorCode = 0) to all tests. The status OK is given if a website (including all items) is downloaded completely and does not exceed the time limit (typically set to 15 s). The criterion for failing an HTTP browsing test is ErrorCode ≠ 0 (status: test timeout, cancelled, etc.).
Browsing duration average is a KPI that measures network performance in HTTP browsing tests. It is the average of the download times for all successfully downloaded pages. In an HTTP browsing test, multiple DNSs are requested, multiple items are down-loaded and typically redirections are required.
Unlike HTTP transfer, browsing is not performed in a controlled environment. The select-ed live internet pages often result in different transfer times. A well-chosen set of different pages minimizes this problem by averaging as explained above.
Browsing duration > 6 s ratio is a KPI that measures the percentage of webpages that were downloaded in a time interval longer than 6 s and shorter than the 15 s test timeout. It provides a further distinction between operators.
Social media app testsFacebook and Dropbox are typical examples of social media. However, the principle can be applied to other services, too.
To mimic a typical Facebook or Dropbox user, the test includes different typical sub-sequent tasks or actions before leaving the site and finishing the test. A social media session can involve actions such as opening the home page, opening several posts, commenting on posts, liking posts and creating posts.
To take into account posting to social media in this scoring methodology, the test in-cludes creating or uploading a post that includes transferring a 1 Mbyte media file.
Since most social media actions only transfer a minimal amount of data, the throughput is not an important indicator. Instead, the main results of the test are the durations of the individual actions and the entire session and the action success rates.
The test success ratio (task completed in a defined time) and the data transfer time for uploading the 1 Mbyte file are used as contributors.
Number of successful tests Browsing success ratio = Number of successful tests + Number of failed tests

Rohde & Schwarz | White paper Network Performance Score 15
This test is similar to an HTTP transfer test. Therefore, it is not necessary to extract more KPIs from this test. The critical part of this test – compared to plain HTTP transfer tests – is the performance of the connection to the Facebook or Dropbox server and the potential data rate restrictions imposed by the server/network in case of traffic.
Social media success ratio is the ratio of data tests with status OK (ErrorCode = 0) to all tests. ErrorCode = 0 is assigned to all tests completed without exceeding the time limit (defined timeout = 30 s). The criterion for failed tests is ErrorCode ≠ 0 (status: cancelled, service unavailable; test result: initialization failed, test timeout, service unavailable, etc.).
Social media duration average measures the network (including the CDN) and server performance in this application test. It differs from HTTP browsing tests in that only one DNS request is sent and only a single object is uploaded to one location. It differs from HTTP transfer upload in that the server is a third-party server and may, like the content delivery network, apply its own data transfer restrictions.
This KPI is calculated for successfully completed tests only (ErrorCode = 0, status OK).
Social media duration > 15 s ratio is a KPI that measures the percentage of uploads that were performed in a time interval longer than 15 s and shorter than the 30 s test timeout. It contributes to more objective scoring by introducing a further distinction between operators.
4.3.2 Browsing/social media – contribution and weightingThe individual contributors are rescaled on a 0 % to 100 % scale as described in section 3.2 Contributors transformation to a percentage scale.
For each contributor, the following formula is applied:
The performance of HTTP browsing contributes 38 % and the performance of the social media applications contributes 15 % to the data services subscore.
Table 4: NPS HTTP browsing and social media contributors
Bad threshold Good threshold Weighting in data services
Browsing success ratio 80.0 % 100.0 % 0.25333
Browsing duration average 6.0 s 1.0 s 0.10857
Browsing duration > 6 s ratio 15.0 % 0.00 % 0.01810
Social media
Social media success ratio 80.0 % 100.0 % 0.100005
Social media duration average 15.0 s 3.0 s 0.042855
Social media duration > 15 s ratio 5.00 % 0.00 % 0.00714
Sum 0.53
Number of successful tests Social media success ratio = Number of successful tests + Number of failed tests
Norm ContrKPI value – Bad threshold = 100 % × × WeightingContributor Good threshold – Bad threshold

16
5 REGIONS AND FINAL AGGREGATION CATEGORIZATION
If a drive or walk test for collecting field measurements is performed, the collected data and its density for individual regions is defined by the measurement time spent for each region. It is inefficient to adjust the measurement time to exactly reflect the number of subscribers or the traffic in these regions.
Regional categorization of measurement campaigns in a postprocessing and aggregation step allows customers to weight the measurement results according to the importance of each region. This importance can be defined by the traffic in the individual regions, the number of subscribers, the existence of service level agreements (SLA) with customers or areas where the law or authorities request mobile coverage.
This regional categorization can be seen as an intermediate weighting layer where the network performance score is calculated separately for each regional category, weighted according to the importance of each region and then aggregated to a final score.
Typical examples of such categories are: ► Big cities ► Medium and small towns ► Connecting roads ► Highways ► Rural areas ► Trains and public transport ► Popular areas (sightseeing, tourism) ► Hotspots (stadiums, malls, airports, downtown areas)
Depending on the operators or the country, not all categories apply. In addition, the score’s reliability depends on the available number of measurements: if there are only a limited number of measurements, using fewer categories leads to more reliable scores.
There are advantages to applying this regional weighting as a separate layer during post-processing. The first one is the flexible assignment of categories and weightings; different views can be applied, e.g. one based on traffic and another based on the number of sub-scribers. Another advantage is that in the case of nonoptimal performance, it is possible to immediately drill down to the underperforming category or region.
A region or category can be assigned during data collection by assigning campaigns to predefined categories and/or by reporting markers if regions change while driving. Regions can be also defined in postprocessing by selecting them based on the date/time, geolocation, technology or other criteria.
The architecture of the implementation allows different weightings on the lower layers based on the regional category. This means that an individual weighting for telephony and data can be applied for each region. The contribution of individual KPIs and their thresh-olds can be adjusted according to regions to serve special customer needs. For public use, it is recommended to use the same low-layer weightings for all regional categories for transparency reasons.

Rohde & Schwarz | White paper Network Performance Score 17
6 POINT SCORE APPLICATIONThe point score is based on exactly the same KPIs and thresholds as the percentage score. Instead of scaling the subscores (e.g. of telephony or cities) from 0 % to 100 % on each level, the number of achievable points is specified and implicitly contains all later ap-plied weightings.
Example:Consider a 2 % call drop ratio in the road category (see section 3.2 Contributors transfor-mation to a percentage scale).
On the percentage scale, this 2 % CDR would be rated as 80 % after applying the thresh-olds and the linear equation formula. This 80 % would contribute 80 % × 0.375 = 30 % to the telephony score.
If telephony is weighted by 40 % in the mixed telephony and data score, the CDR contrib-utes 30 % × 0.4 = 12 % to the overall percentage score for the road category that is the next aggregation layer.
If the road category is weighted by 25 % in the overall network performance score, the 2 % CDR in the road category contributes 12 % × 0.25 = 3 % to the overall percentage.
There is a direct dependency between the percentage and the point scale at this final level. A percentage score e.g. of 91.5 % is equivalent to 915 points. In the example, the contribution of the 2 % CDR in the road category is equivalent to 30 points (3 %). The maximum number of points to be reached by CDR in the road category would be 37.5 (0 % CDR ⇒ 100 % × 0.375 × 0.4 × 0.25 = 3.75 % ⇒ 37.5 points).
If individual categories weightings are defined, the number of points the categories contribute to the overall network performance score can be directly calculated and presented.
The following tables present the contributions of all individual KPIs to the overall net-work performance score based on the individual weightings for the measured regional categories.
Table 5: NPS voice contributors category weighting
Weighting in telephony
Max. points for regional category weighting in % (weighting for telephony in overall: 40 %)
100 50 40 30 25 20 10
Call setup success ratio (CSSR)
0.3125 125 62.5 50.0 37.5 31.25 25.0 12.50
Call drop ratio (CDR) 0.3750 150 75 60.0 45 37.5 30.0 15.00
Call setup time (CST) average
0.0625 25 12.5 10.0 7.5 6.25 5.0 2.50
CST > 15 s ratio 0.0875 35 17.5 14.0 10.5 8.75 7.0 3.50
CST 10th percentile 0.0375 15 7.5 6.0 4.5 3.75 3.0 1.50
Voice MOS average 0.0438 17.5 8.75 7.0 5.3 4.38 3.5 1.75
Voice MOS < 1.6 ratio 0.0562 22.5 11.25 9.0 6.7 5.62 4.5 2.25
Voice MOS 90th percentile
0.0250 10 5.0 4.0 3.0 2.5 2.0 1.00
Sum telephony 1.0 400 200 160 120 100 80 40

18
Using the previous example, the maximum number of points for the call drop ratio in the road category is 37.5, see column 25 in table 5. The table shows that the maximum num-ber of points to be reached with telephony services in total and across all categories is 400.
The following table shows the maximum scoring points for data services. In total, data services can contribute up to 600 points and e.g. data transfer can contribute 150 points.
Table 6: NPS data contributors category weighting
Weighting in data services
Max. points for regional category weighting in % (weighting for data services in overall 60 %)
100 50 40 30 25 20 10
Data transfer
HTTP UL/DL success ratio
0.0550 33.0 16.5 13.2 9.9 8.3 6.6 3.30
HTTP DL throughput average
0.035 21.0 10.5 8.4 6.3 5.3 4.2 2.10
HTTP DL throughput 10th percentile
0.045 27.0 13.5 10.8 8.1 6.8 5.4 2.70
HTTP DL throughput 90th percentile
0.0175 10.5 5.3 4.2 3.2 2.6 2.1 1.05
HTTP UL throughput average
0.035 21.0 10.5 8.4 6.3 5.3 4.2 2.10
HTTP UL throughput 10th percentile
0.045 27.0 13.5 10.8 8.1 6.8 5.4 2.70
HTTP UL throughput 90th percentile
0.0175 10.5 5.3 4.2 3.2 2.6 2.1 1.05
Sum data transfer 0.25 150.0 75.0 60.0 45.0 37.5 30.0 15.0
Video streaming
Video success ratio 0.1276 76.6 38.3 30.6 23.0 19.1 15.3 7.66
Video MOS average 0.0363 21.8 10.9 8.7 6.5 5.4 4.4 2.18
Video MOS 10th percentile
0.0363 21.8 10.9 8.7 6.5 5.4 4.4 2.18
Video setup average 0.0099 5.9 3.0 2.4 1.8 1.5 1.2 0.59
Video setup > 10 s ratio 0.0099 5.9 3.0 2.4 1.8 1.5 1.2 0.59
Sum video streaming 0.22 132.0 66.0 52.8 39.6 33.0 26.4 13.2
HTTP browsing and social media
Browsing success ratio 0.25333 152.0 76.0 60.8 45.6 38.0 30.4 15.20
Browsing duration average
0.10857 65.1 32.6 26.1 19.5 16.3 13.0 6.51
Browsing duration > 6 s ratio
0.0181 10.9 5.4 4.3 3.3 2.7 2.2 1.09
Social media
Success ratio 0.100005 60.0 30.0 24.1 18.0 15.0 12.1 6.00
Social media duration average
0.042855 25.75 12.88 10.28 7.7 6.4 5.2 2.58
Social media duration > 15 s ratio
0.00714 4.25 2.12 1.62 1.30 1.10 0.8 0.43
Sum browsing/social media
0.53 318.0 159.0 127.2 95.4 79.5 63.6 31.80
Sum data services 1 600 300 240 180 150 120 60
The following tables give an indication of the improvement in points if a KPI is changed across all regions by a certain margin. It is anticipated that the improvement will stay between the bad and good limit. An improvement outside the limits will have no effect due to saturation.

Rohde & Schwarz | White paper Network Performance Score 19
The following formula is applied:
Table 7: NPS voice available improvement potential
Weighting in telephony
Weighting in overall
Maximum points
KPI Improvement in points (in overall score)
Bad limit
Good limit
Changes KPI by
Call setup success ratio (CSSR)
0.3125 0.1250 125 85 % 100 % 0.1 % 0.8
Call drop ratio (CDR) 0.3750 0.1500 150 10 % 0 % –0.1 % 1.5
Call setup time (CST) average
0.0625 0.0250 25 12 s 4.5 s –1 s 3.3
CST > 15 s ratio 0.0875 0.0350 35 3 % 0 % –1 % 11.7
CST 10th percentile 0.0375 0.0150 15 8 s 4 s –1 s 3.8
Voice MOS average 0.0438 0.0175 17.5 2 4.3 0.1 MOS 0.8
Voice MOS < 1.6 ratio 0.0562 0.0225 22.5 10 % 0 % –1 % 2.2
Voice MOS 90th percentile
0.0250 0.0100 10 4 4.75 0.1 MOS 1.3
Table 8: NPS data available improvement potential
Weighting in data services
Weighting in overall
Maximum points
KPI Improvement in points (in overall score)
Bad limit
Good limit
Changes KPI by
HTTP UL/DL success ratio
0.055 0.033 33 80 % 100 % 1.0 % 1.65
HTTP DL throughput average
0.035 0.021 21 1 Mbit/s100 Mbit/s
1 Mbit/s 0.21
HTTP DL throughput 10th percentile
0.045 0.027 27 1 Mbit/s 40 Mbit/s 1 Mbit/s 0.7
HTTP DL throughput 90th percentile
0.0175 0.011 10.5 10 Mbit/s240 Mbit/s
1 Mbit/s 0.05
HTTP UL throughput average
0.035 0.021 210.5 Mbit/s
50Mbit/s 1 Mbit/s 0.4
HTTP UL throughput 10th percentile
0.045 0.027 270.5 Mbit/s
30 Mbit/s 1 Mbit/s 0.9
HTTP UL throughput 90th percentile
0.0175 0.011 10.5 5 Mbit/s100 Mbit/s
1 Mbit/s 0.2
Video success ratio 0.1276 0.077 76.6 80 % 100 % 1.0 % 3.85
Video MOS average 0.0363 0.022 21.8 3 4.5 0.1 MOS 1.5
Video MOS 10th percentile
0.0363 0.022 21.8 2 4 0.1 MOS 1.1
Video setup average 0.0099 0.006 5.9 7.0 s 2.0 s –1 s 1.2
Video setup > 10 s ratio
0.0099 0.006 5.9 5 % 0 % –1.0 % 1.2
Browsing success ratio
0.25333 0.152 152 80 % 100 % 1.0 % 7.6
Browsing duration average
0.10857 0.065 65.1 6.0 s 1.0 s –1 s 13
Browsing duration > 6 s ratio
0.0181 0.011 10.9 15 % 0 % 1% 0.73
Social media success ratio
0.100005 0.060 60.0 80 % 100 % 1.0 % 3.0
Social media duration average
0.042855 0.02575 25.75 15 s 3 s –1 s 2.14
Social media duration > 15 s ratio
0.00714 0.004 4.25 5 % 0 % 1 % 0.8
Change in KPI Improvement in points = 1000 points × × Weightingin overall Good limit – Bad limit

20
7 SUMMARYThis white paper reflects the status of the specification for a network performance score in Rohde & Schwarz mobile network testing postprocessing. It is in line with the published STQ standard ETSI TR 103559 V1.1.1 (dated August 22, 2019). It will be updated to in-clude new scientific findings, field experience and best practice approaches as well as standardization activities.
From the analysis documented in this white paper, it can be seen that a robust and scal-able methodology for quantifying a network’s performance on a local, regional or national scale can be produced by taking into account all factors that affect the delivery of servic-es to end users and applying appropriate weighting.
The value of such a methodology is that mobile network performance can be expressed in a single, integrated metric that can be independently and transparently compared on a national and international level. These results can be used to develop a program of net-work improvement actions to achieve the desired level of performance.
When defining and executing a benchmarking campaign, careful consideration must be given to the test sites, routes, test devices and performance test websites to ensure a truly representative evaluation.

Rohde & Schwarz | White paper Network Performance Score 21
APPENDIX A
A-1 TESTING HTTP BROWSING IN BENCHMARKING CAMPAIGNS
A-1.1 IntroductionHTTP browsing is one of the most used web applications in mobile networks. Consequently, testing HTTP browsing is a core metric for benchmarking quality of ex-perience (QoE); it is weighted strongly in the overall network performance score that describes a network’s performance in general.
When testing HTTP browsing, several factors need to be considered, including suc-cess ratio and access, download times (which depend heavily on the website structure) and the connections to the content delivery network (CDN). Today’s popular websites are highly dynamic, which means that content and advertisements change within short periods of time. Therefore, multiple different websites are included in benchmarking cam-paigns to diversify and average the sites’ individual behaviors.
Typically, five to eight different websites are used in one benchmarking campaign. They are continuously observed and can be replaced if the applied rules are no longer met.
A-1.2 Selection criteria for websitesTesting HTTP browsing provides metrics for the user’s QoE. Therefore, highly popular websites should be selected. Popularity can be determined on a global or on a local mar-ket level. The public website Alexa regularly reports the 500 most popular global websites (www.alexa.com/topsites) and country websites (www.alexa.com/topsites/countries).
Depending on the focus of a benchmarking campaign, only global or only local favorites can be selected for testing. It is best practice to have a mix of global and local favorites. Examples of global favorites are www.google.com and www.wikipedia.org; examples of local favorites are local newspapers, newsfeeds, sports and common local services such as banks.
Websites to be included in a measurement campaign are preferably among the top rank-ing sites listed on Alexa. Technically, the websites should have an average complexity and meet the following criteria; otherwise, one of the next highest ranking websites should be chosen.
Criteria include: ► Websites of services that are predominantly accessed via a dedicated app on a smartphone should not be selected. For example, Facebook, YouTube and similar websites/services are typically not accessed through a mobile browser and should not be used for mobile benchmarking campaigns.
► Websites with a very simple structure and a small amount of data should not be selected. Examples include login and landing pages that offer a service or further selection only. A user would consider such pages as service access points and not browsing experiences.

22
► Websites with a very large amount of data should not be selected if a large portion of the downloaded data is unnecessary for readability or perceived completeness. For example websites with an exceptional number of advertisements. Some KPIs for HTTP browsing are based on the complete download of the website (download complete as criterion). This criterion will not meet the user’s experience since a user would perceive the website as complete in a shorter period of time than when the technical criterion download complete is reached.
► Websites with embedded (long) videos should be avoided. Videos usually already start to play after the first seconds of content are downloaded, but the remaining content continues to be downloaded while the video is being played (progressive download). A complete download would not reflect the user’s experience since the perceived readiness is a much shorter time.
► Websites with embedded live videos must be avoided. Live videos trigger an ongoing, continuous download of video data. The website cannot be downloaded completely and the technical criterion would always fail even when the website is perceived as complete by a user.
► Websites with perpetual, subsequent replacement of objects must be avoided, e.g. a succession of pictures or videos. The website cannot be downloaded completely and the criterion would fail even when the website is perceived as complete by a user.
► No website should be selected that is a subpage/subsite of another already selected website, i.e. two websites stored on the same server.
► No website should be selected where the content is legally suspicious or contains harmful, racist or sexist content
Results obtained by using websites that do not meet the above criteria or whose content changes so that they no longer meet the above criteria are invalidated during postpro-cessing and used neither in the reporting nor to calculate the network performance score.
Since websites may have to be changed during a measurement campaign, it is not a giv-en that the same websites will be used throughout the entire campaign. Regular screen-ing and the potential replacement of websites ensure the use of websites that adhere to the predefined selection criteria and that measurement results are as close as possible to the user’s perception while browsing.
For each campaign, we decided to include two of the most popular websites such as www.google.com and www.wikipedia.org. If available, a Google website with a local do-main should be chosen. The remaining websites are chosen for their complexity to reflect the distribution of a large population of websites.
Based on the statistical analysis presented in A-1.4 Websites in benchmarking campaigns – statistical analysis, the following size and resource based selection criteria apply:
► When selecting five websites – Two (global) websites with a size < 500 kbyte (google.*, wikipedia.org) – Two local websites with a size of 1000 kbyte to 2000 kbyte and > 40 resources – One local website with a size > 2500 kbyte but < 4000 kbyte and > 60 resources
► When selecting eight websites – Two (global) websites with a size < 500 kbyte (google.*, wikipedia.org) – One local website with a size > 500 kbyte but < 1000 kbyte and > 20 resources – Three local websites with a size of 1000 kbyte to 2000 kbyte and > 40 resources – One local website with a size > 2500 kbyte but < 4000 kbyte and > 60 resources – One local website with a size > 4000 kbyte but < 6000 kbyte and > 60 resources
A couple of spare websites of appropriate size and complexity also have to be selected so that websites can be changed during a campaign in case a chosen website no longer ful-fills the defined criteria.

Rohde & Schwarz | White paper Network Performance Score 23
A-1.3 Best practice for selecting websitesThere is an established procedure for the selection and continuous use of websites in benchmarking campaigns:
► Definition of test cases and measurement campaigns: During the definition of a measurement campaign, a set of websites is selected and proposed by Rohde & Schwarz MNT. These websites must fulfill the selection criteria as listed above when accessed from the Rohde & Schwarz MNT office in Switzerland.
► Precampaign local test measurements: Since content and especially advertisements are delivered individually for the local market and differently for individual MNOs, prior to starting the measurement campaign the selected websites have to be checked in the local market to ensure that they meet the above listed selection criteria by using subscriptions of local providers. Measurement files have to be provided and the list has to be confirmed by Rohde & Schwarz MNT experts. If confirmation fails, alternative websites have to be proposed and tested.
► In-campaign sanity checks: Contents of websites are subject to regular change. It can easily happen that a website suddenly no longer fulfills the selection criteria. The local test team is obliged to monitor whether there are any severe changes in the measurement results.
A good practice is to monitor the success ratio for the selected websites. In environments with good RF coverage, the success ratio is > 90 % when downloading a website within the defined timeout (typically 15 s). If the success ratio falls below this threshold within an observation period of a few hours, the Rohde & Schwarz MNT experts have to be in-formed and – if possible – the website will need to be replaced by another one. In addi-tion, measurement files have to be provided on short notice for offline analysis.
A-1.4 Websites in benchmarking campaigns – statistical analysis For the previously described reasons, a certain number of websites have to be tested in the benchmarking campaign in order to provide relevant data for assessing the user experience.
Based on our statistical analysis of more than 200 Alexa websites in June and July 2018, the following conclusions have been drawn:
► The size distribution of the most popular webpages decreases exponentially. 73 % of all webpages are smaller than 2 Mbyte and 83.5 % are smaller than 3 Mbyte. Most of the small websites are simply landing pages of search engines, social networks, email login pages, etc. These landing and login pages will not be used in benchmarking campaigns in accordance with the criteria defined in A-1.2 Selection criteria for websites.

24
Fig. 5: Distribution of website sizes in kbyte
► A typical website consists of text content and several web resources, such as images, external JavaScript files, external style sheets and other related files. The website is correctly rendered in the web browser only if each of the resources is successfully downloaded and parsed. Ideally, it is desirable to reduce the number of HTTP requests made or required to display the website completely. The reason for this is that several often time-consuming processes happen when downloading web resources. The average number of resources (http requests) is approximately 74 across all tested websites. 75 % of all tested websites have less than 100 resources.
Fig. 6: Distribution of resources in websites
0 to 5
00
500 t
o 100
0
1000
to 15
00
1500
to 20
00
2000
to 25
00
2500
to 30
00
3000
to 35
00
3500
to 40
00
4500
to 50
00
5500
to 60
00
6000
to 65
00
6500
to 70
00
7500
to 80
00
> 8000
Rela
tive
occu
rrenc
e in
% 30
25
20
15
10
5
0
5000
to 55
00
4500
to 45
00
7000
to 75
00
Website size in kbyte
Distribution number of resources in websites
0 to 2
0
20 to
40
40 to
60
60 to
80
80 to
100
100 t
o 120
120 t
o 140
140 t
o 160
160 t
o 180
200 t
o 220
220 t
o 240
240 t
o 260
260 t
o 280
280 t
o 300
> 300
Rela
tive
occu
rrenc
e in
% 30
25
20
15
10
5
0
180 t
o 200
Number of resources in websites

Rohde & Schwarz | White paper Network Performance Score 25
Fig. 7: Distribution of images in websites
A-2 MEASUREMENT SCENARIOSThe main test scenarios include:
► Typical call (120 s call duration/180 s call window) ► Data sessions (different scenarios) ► Capacity test (voice and data sessions – stress test for all operators)
The methodology used and the measurement setup define the voice and data scenarios to be followed during data collection to obtain meaningful results for:
► Accessibility (e.g. call setup time (CST)) ► Retainability (e.g. call drop ratio (CDR)) ► Integrity (e.g. handover success ratio (HOSR)) ► Air interface logging ► Voice call testing ► Speech testing POLQA, narrowband and wideband ► Video streaming (intrusive and non-intrusive) such as YouTube
There are many other KPIs registered during the drive test and the collected data can be accessed via a very convenient interface on the SmartAnalytics report platform.
The displayed settings are used in the Rohde & Schwarz measurement system.
0 to 1
0
10 to
20
20 to
30
30 to
40
40 to
50
50 to
60
60 to
70
70 to
80
90 to
100
110 t
o 120
120 t
o 130
130 t
o 140
> 150
Rela
tive
occu
rrenc
e in
%
30
25
20
15
10
5
0
100 t
o 110
80 to
90
140 t
o 150
40
35
Number of images in websites

26
A-2.1 Job structures
A-2.1.1 Call sessionThe call session consists of a sync action and a double ended call with speech quality evaluation.
Fig. 8: Call session
A-2.1.2 Data sessionFor the data session, it is possible to choose between a simple setup with one session that contains all tests and five browsing URLs or a more complex setup with interleaving of three similar sessions where the fast converging capacity test is only part of the first session and a larger set of browsing URLs can be tested. In the interleaved mode, session 1 is followed by session 2 and then session 3 and then the overall set is repeated. There is a sync action for each subsession.
Table 9: Data session
Session 1 Potential session 2 Potential session 3sync sync sync
preload ping 800 byte preload ping 800 byte preload ping 800 byte
ping ping ping
HTTP DL test – single connection HTTP DL test – single connection (FDFS)
HTTP DL test – single connection
wait (3 s) wait (3 s) wait (3 s)
HTTP UL test – single connection HTTP UL test – single connection HTTP UL test – single connection
wait (3 s) wait (3 s) wait (3 s)
browsing page 1 small (global) browsing page 1 small (global) browsing page 1 small (global)
browsing page 2 small (global) browsing page 2 small (global) browsing page 2 small (global)
browsing page 3 medium (local) browsing page 6 medium (local) browsing page 9 medium (local)
browsing page 4 medium (local) browsing page 7 medium (local) browsing page 10 medium (local)
browsing page 5 large (local) browsing page 8 large (local) browsing page 11 large (local)
wait (3 s) wait (3 s) wait (3 s)
– video streaming live video streaming live
– wait (3 s) wait (3 s)
Dropbox transfer Dropbox transfer Dropbox transfer
wait (3 s)
HTTP UL test – multiple connections – –
wait (3 s) – –
HTTP DL test – multiple connections – –
wait (15 s)

Rohde & Schwarz | White paper Network Performance Score 27
A-2.2 Voice test settings
A-2.2.1 Double ended call settings
Table 10: Double ended call settings
Parameter Comment Value
AlgorithmITU-T P.863 POLQA in its super-wideband mode as defined in section 3.1.3
POLQA (WB)
Reference file default, standardized voice sample English (US) P 501
Call duration default 120 s
Call direction default A to B
Sample direction default half-duplex
Sample frequency to ensure even A to B versus B to A sample rate 11 s
Save wave files to optimize measurement file size on low quality
Low quality threshold to optimize measurement file size 2.5
Exclude call setup time from call duration
to ensure the requested call duration
checked
Window duration default 180 s
Pause durationto avoid a second call in the same window
180 s
First call setup delay default 3 s
Maximum call setup time default 30 s
Guard time default 10 s
Call alerting timeout default 0 s
Call answer timeout default 0 s
No call setup time default 30 s
Pause after failed callto avoid a second call in the same window
180 s
Pause after maximum failed callsto avoid a second call in the same window
180 s
No connection timeout default 600 s
Maximum failed calls default 1
A-2.3 Data test settings
A-2.3.1 Ping testing
Table 11: Preload ping
Parameter Comment ValueHost server needs to be defined URL to be defined
Number of pings default 5
Interval default 1000 ms
Packet size large packets for preloading 800 byte
Timeout default 2 s
Minimum test duration default 0
Maximum test durationshorter than default to not waste too much time
15 s

28
Table 12: Ping
Parameter Comment ValueHost server needs to be defined URL to be defined
Number of pings many small fast pings in a row 25
Interval many small fast pings in a row 10 ms
Packet size default 32 byte
Timeout default 2 s
Minimum test duration default 0
Maximum test durationshorter than default to not waste too much time
30 s
A-2.3.2 Data transfer testing
Table 13: HTTP DL test – single connection
Parameter Comment ValueURL 5 Mbyte as defined in section 4.1.1 5 Mbyte file, URL to be defined
Username default
Password default
Minimum test durationso that the high number of tests un-der very good network conditions are not given an unfair advantage
5
Maximum test duration 40 s as defined in section 4.1.1 40 s
Maximum setup time default 30 s
Transfer typecomplete download as defined in section 4.1
full
Fixed duration no need if transfer type = full –
Force DNS lookupallows the calculation of DNS reso-lution time even if the host name is already cached
checked
Table 14: HTTP UL test – single connection
Parameter Explanation ValueURL server needs to be defined URL to be defined
Username default
Password default
Upload size 2 Mbyte as defined in section 4.1.1 2
Upload size unit 2 Mbyte as defined in section 4.1.1 Mbyte
Minimum test durationso that the high number of tests un-der very good network conditions are not given an unfair advantage
5
Maximum test duration 40 s as defined in section 4.1.1 40 s
Maximum setup time default 30 s
Transfer typecomplete download as defined in section 4.1
full
Fixed duration no need if transfer type = full –
Transfer method default put
Force DNS lookupallows the calculation of DNS reso-lution time even if the host name is already cached
checked
Rohde & Schwarz | White paper Network Performance Score 29
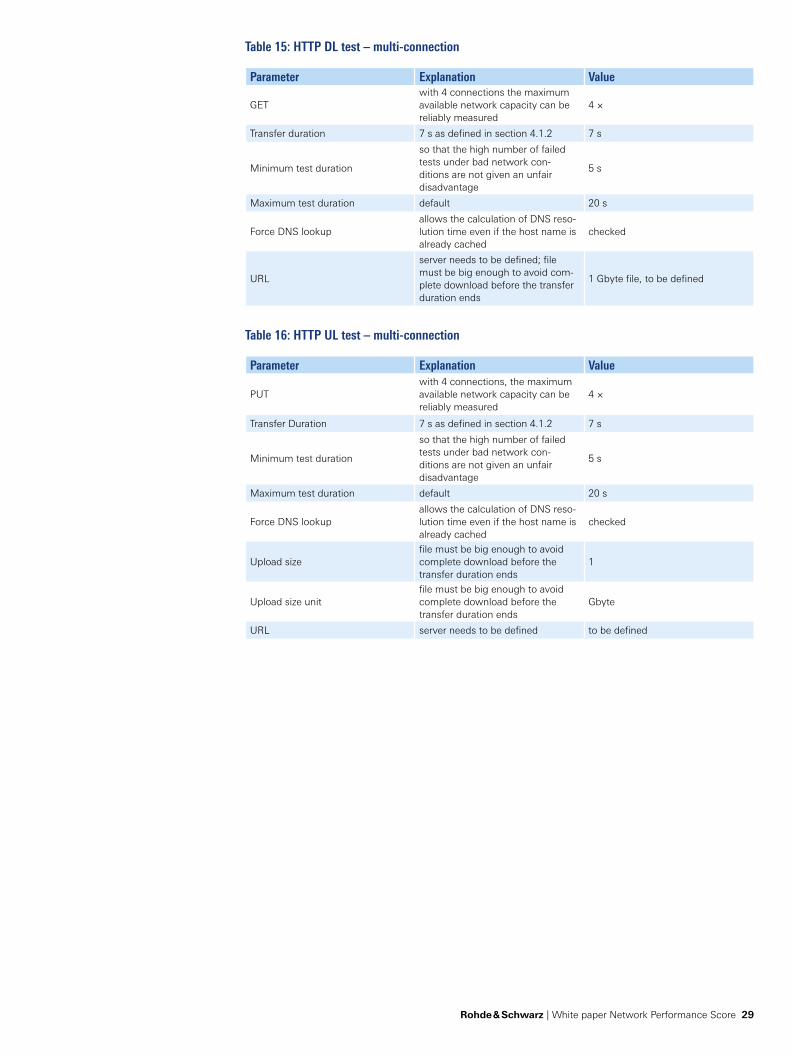
Table 15: HTTP DL test – multi-connection
Parameter Explanation Value
GETwith 4 connections the maximum available network capacity can be reliably measured
4 ×
Transfer duration 7 s as defined in section 4.1.2 7 s
Minimum test duration
so that the high number of failed tests under bad network con-ditions are not given an unfair disadvantage
5 s
Maximum test duration default 20 s
Force DNS lookupallows the calculation of DNS reso-lution time even if the host name is already cached
checked
URL
server needs to be defined; file must be big enough to avoid com-plete download before the transfer duration ends
1 Gbyte file, to be defined
Table 16: HTTP UL test – multi-connection
Parameter Explanation Value
PUTwith 4 connections, the maximum available network capacity can be reliably measured
4 ×
Transfer Duration 7 s as defined in section 4.1.2 7 s
Minimum test duration
so that the high number of failed tests under bad network con-ditions are not given an unfair disadvantage
5 s
Maximum test duration default 20 s
Force DNS lookupallows the calculation of DNS reso-lution time even if the host name is already cached
checked
Upload sizefile must be big enough to avoid complete download before the transfer duration ends
1
Upload size unitfile must be big enough to avoid complete download before the transfer duration ends
Gbyte
URL server needs to be defined to be defined
30
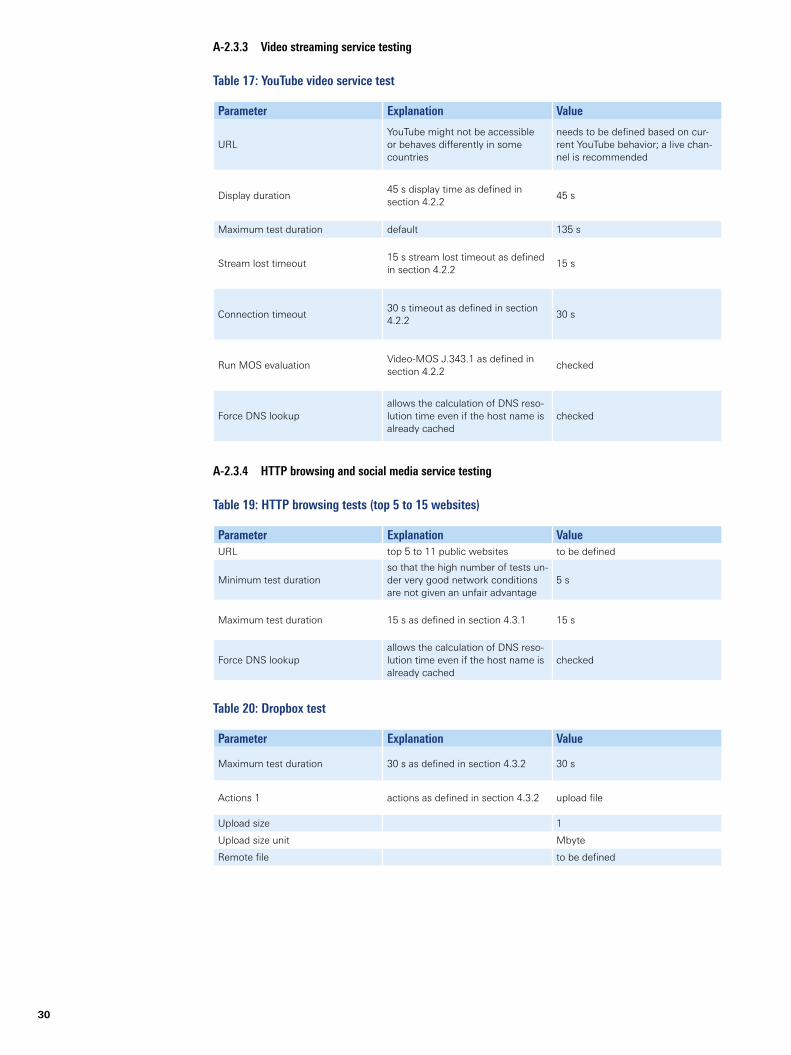
A-2.3.3 Video streaming service testing
Table 17: YouTube video service test
Parameter Explanation Value
URLYouTube might not be accessible or behaves differently in some countries
needs to be defined based on cur-rent YouTube behavior; a live chan-nel is recommended
Display duration45 s display time as defined in section 4.2.2
45 s
Maximum test duration default 135 s
Stream lost timeout15 s stream lost timeout as defined in section 4.2.2
15 s
Connection timeout30 s timeout as defined in section 4.2.2
30 s
Run MOS evaluationVideo-MOS J.343.1 as defined in section 4.2.2
checked
Force DNS lookupallows the calculation of DNS reso-lution time even if the host name is already cached
checked
A-2.3.4 HTTP browsing and social media service testing
Table 19: HTTP browsing tests (top 5 to 15 websites)
Parameter Explanation ValueURL top 5 to 11 public websites to be defined
Minimum test durationso that the high number of tests un-der very good network conditions are not given an unfair advantage
5 s
Maximum test duration 15 s as defined in section 4.3.1 15 s
Force DNS lookupallows the calculation of DNS reso-lution time even if the host name is already cached
checked
Table 20: Dropbox test
Parameter Explanation Value
Maximum test duration 30 s as defined in section 4.3.2 30 s
Actions 1 actions as defined in section 4.3.2 upload file
Upload size 1
Upload size unit Mbyte
Remote file to be defined

Rohde & Schwarz | White paper Network Performance Score 31
A-2.4 Rohde & Schwarz measurement systemsSmartBenchmarker is a solution for drive test based quality of experience benchmarking campaigns.
SmartBenchmarker is an innovative benchmarking and network testing tool that delivers precise and accurate measurement data for a vast set of network technologies. Robust and tough by design, it functions under and withstands the most extreme conditions.
SmartBenchmarker’s cutting-edge features enable strategic network investment deci-sions by allowing operators to fairly compare and assess service quality based on state-of-the-art standards, including ITU/ETSI.
SmartBenchmarker, successor of Diversity Benchmarker II, makes it possible to more efficiently test and compare voice and data services. Fully 4G/LTE MIMO capable and prepared for LTE-Advanced, it offers a wide range of integrated mobile devices and scanners.
For more information, see:https://www.rohde-schwarz.com/us/product/smartbenchmarker-productstart-page_63493-528256.html
Fig. 9: SmartBenchmarker
32
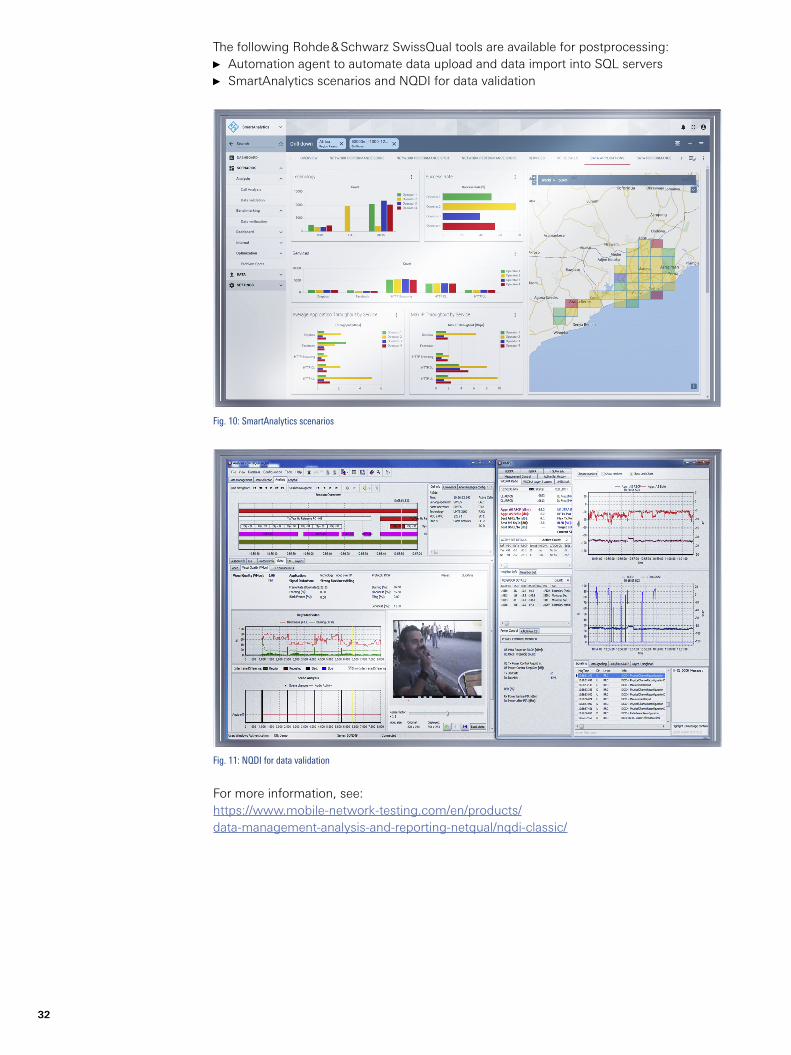
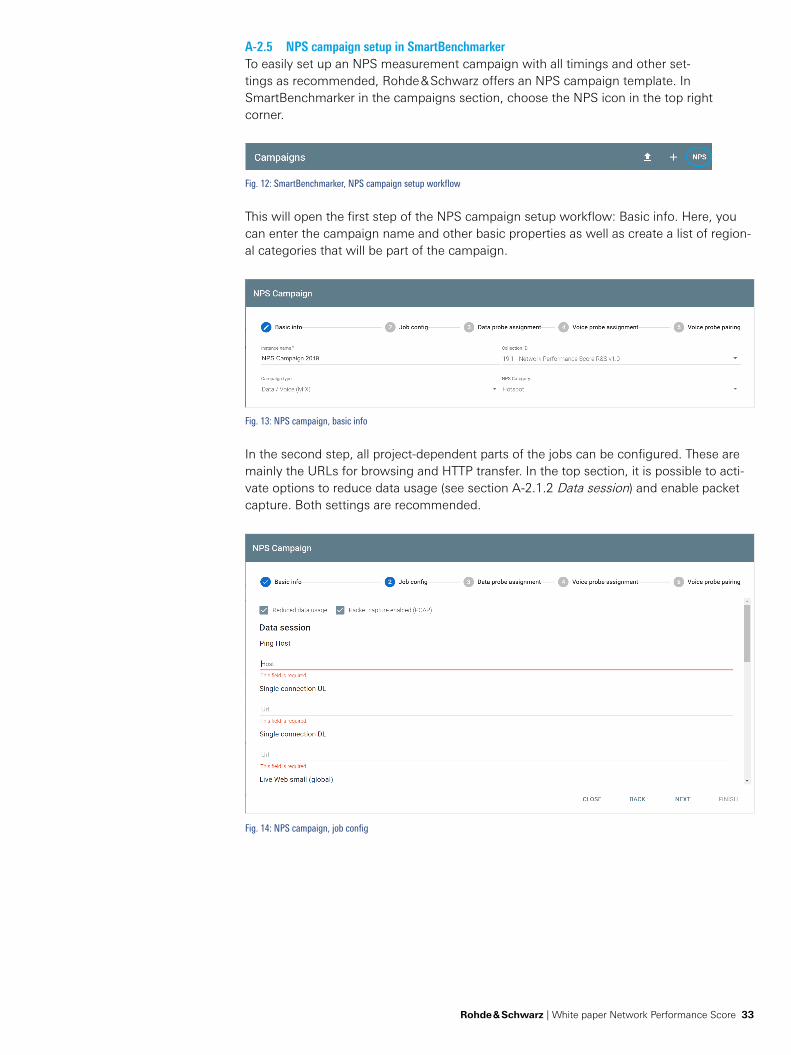
The following Rohde & Schwarz SwissQual tools are available for postprocessing: ► Automation agent to automate data upload and data import into SQL servers ► SmartAnalytics scenarios and NQDI for data validation
Fig. 10: SmartAnalytics scenarios
Fig. 11: NQDI for data validation
For more information, see:https://www.mobile-network-testing.com/en/products/data-management-analysis-and-reporting-netqual/nqdi-classic/
Rohde & Schwarz | White paper Network Performance Score 33
A-2.5 NPS campaign setup in SmartBenchmarkerTo easily set up an NPS measurement campaign with all timings and other set-tings as recommended, Rohde & Schwarz offers an NPS campaign template. In SmartBenchmarker in the campaigns section, choose the NPS icon in the top right corner.
Fig. 12: SmartBenchmarker, NPS campaign setup workflow
This will open the first step of the NPS campaign setup workflow: Basic info. Here, you can enter the campaign name and other basic properties as well as create a list of region-al categories that will be part of the campaign.
Fig. 13: NPS campaign, basic info
In the second step, all project-dependent parts of the jobs can be configured. These are mainly the URLs for browsing and HTTP transfer. In the top section, it is possible to acti-vate options to reduce data usage (see section A-2.1.2 Data session) and enable packet capture. Both settings are recommended.
Fig. 14: NPS campaign, job config

34
In the following steps, probes can be assigned to the data and voice jobs. After complet-ing step 5, voice probe pairing, press the FINISH button. All needed campaigns and jobs are created automatically.
Fig. 15: NPS campaign, voice probe pairing
The newly created items appear in the job and campaign lists. It is possible to edit them manually afterwards, but then they lose their status of being NPS compliant. A warning is displayed in the edit screen.
Fig. 16: Update campaign
For detailed instructions, see the SmartBenchmarker manual.

Rohde & Schwarz | White paper Network Performance Score 35
A-2.6 PostprocessingSmartAnalytics calculates the NPS for the overall network and can drill it down by use case, service, technology and other variables. It is not only an integrated quality score for the overall network quality, it is also the ideal entry point into deeper analysis for network optimization because the NPS makes it obvious at first glance where the most potential for improvement can be found.
SmartAnalytics offers many ways to display the NPS and the contributing KPIs, including the full list of KPIs and the remaining potential on a point scale.
Fig. 17: Network performance score
Fig. 18: Network performance score by category

36
Fig. 19: Voice KPIs
Fig. 20: Data KPIs

Rohde & Schwarz | White paper Network Performance Score 37
APPENDIX B
B-1 NETWORK PERFORMANCE SCORE (NPS V1.0) B-1.1 KPIs, weightings and thresholdsIn this section, KPIs of the first version of NPS (NPS V1.0) are given in both percentages and point scale.
The main differences between NPS V1.0 and NPS V1.1 are: ► New thresholds for HTTP UL/L throughput KPIs ► Introduction of two new KPIs as defined by ETSI TR 103559 V1.1.1; activity duration for HTTP browsing test and social media test
► TCP round trip time (RTT) in HTTP browsing test replaced by activity duration KPI, keeping the same weighting
► The weightings of the social media KPIs modified to be in line with ETSI TR 103559 V1.1.1
Table 21: NPS V1.0 voice contributors (Rohde & Schwarz implementation)
Bad threshold Good threshold Weighting in telephony
Call setup success ratio (CSSR) 85.00 % 100.00 % 0.3125
Call drop ratio (CDR) 10.00 % 0.00 % 0.3750
Call setup time (CST) average 12.00 4.50 0.0625
CST > 15 s ratio 3.00 % 0.00 % 0.0875
CST 10th percentile 8.00 4.00 0.0375
Voice MOS average 2.00 4.30 0.0438
Voice MOS < 1.6 ratio 10.00 % 0.00 % 0.0562
Voice MOS 90th percentile 4.00 4.75 0.0250
Sum 1.0
Table 22: NPS V1.0 HTTP data transfer contributors (Rohde & Schwarz implementation)
Bad threshold Good threshold Weighting in data services
HTTP UL/DL success ratio 80 % 100 % 0.0550
HTTP DL throughput average 2.0 Mbit/s 50.0 Mbit/s 0.0350
HTTP DL throughput 10th percentile 2.0 Mbit/s 10.0 Mbit/s 0.0450
HTTP DL throughput 90th percentile 10.0 Mbit/s 120.0 Mbit/s 0.0175
HTTP UL throughput average 0.5 Mbit/s 35.0 Mbit/s 0.0350
HTTP UL throughput 10th percentile 0.5 Mbit/s 4.0 Mbit/s 0.0450
HTTP UL throughput 90th percentile 5.0 Mbit/s 45 Mbit/s 0.0175
Sum 0.25

38
Table 23: NPS V1.0 video streaming contributors (Rohde & Schwarz implementation)
Bad threshold Good threshold Weighting in data services
Video success ratio 80.0 % 100.0 % 0.1276
Video MOS average 3.0 4.5 0.0363
Video MOS 10th percentile 2.0 4.0 0.0363
Video setup average 7.0 s 2.0 s 0.0099
Video setup > 10 s ratio 5.0 % 0.0 % 0.0099
Sum 0.22
Table 24: NPS V1.0 HTTP browsing and social media contributors (Rohde & Schwarz implementation)
Bad threshold Good threshold Weighting in data services
Browsing success ratio 80.0 % 100.0 % 0.25333
Browsing duration average 6.0 s 1.0 s 0.10857
Round trip time (RTT) 150 ms 30 ms 0.01810
Social media
Social media success ratio 80.0 % 100.0 % 0.09375
Social media duration average 15.0 3.0 0.05625
Sum 0.53
B-1.2 Maximum scoring points per categoryThe following tables present the contributions of all individual KPIs to the overall network performance score V1.0 by considering the individual weightings for the regions where they are measured.
Table 25: NPS V1.0 voice contributors category weighting
Weighting in telephony
Max. points for regional category weighting in % (weighting for telephony in overall: 40 %)
100 50 40 30 25 20 10
Call setup success ratio (CSSR)
0.3125 125 62.5 50.0 37.5 31.25 25.0 12.50
Call drop ratio (CDR) 0.3750 150 75 60.0 45 37.5 30.0 15.00
Call setup time (CST) average
0.0625 25 12.5 10.0 7.5 6.25 5.0 2.50
CST > 15 s ratio 0.0875 35 17.5 14.0 10.5 8.75 7.0 3.50
CST 10th percentile 0.0375 15 7.5 6.0 4.5 3.75 3.0 1.50
Voice MOS average 0.0438 17.5 8.75 7.0 5.3 4.38 3.5 1.75
Voice MOS < 1.6 ratio 0.0562 22.5 11.25 9.0 6.7 5.62 4.5 2.25
Voice MOS 90th percentile
0.0250 10 5.0 4.0 3.0 2.5 2.0 1.00
Sum telephony 1.0 400 200 160 120 100 80 40
The following table shows the maximum scoring points for data services. In total, data services can contribute up to 600 points and e.g. data transfer can contribute 150 points.

Rohde & Schwarz | White paper Network Performance Score 39
Table 26: NPS V1.0 data contributors category weighting
Weighting in data services
Max. points for regional category weighting in % (weighting for data services in overall 60 %)
100 50 40 30 25 20 10
Data transfer
HTTP UL/DL success ratio
0.0550 33.0 16.5 13.2 9.9 8.3 6.6 3.30
HTTP DL throughput average
0.035 21.0 10.5 8.4 6.3 5.3 4.2 2.10
HTTP DL throughput 10th percentile
0.045 27.0 13.5 10.8 8.1 6.8 5.4 2.70
HTTP DL throughput 90th percentile
0.0175 10.5 5.3 4.2 3.2 2.6 2.1 1.05
HTTP UL throughput average
0.035 21.0 10.5 8.4 6.3 5.3 4.2 2.10
HTTP UL throughput 10th percentile
0.045 27.0 13.5 10.8 8.1 6.8 5.4 2.70
HTTP UL throughput 90th percentile
0.0175 10.5 5.3 4.2 3.2 2.6 2.1 1.05
Sum data transfer 0.25 150.0 75.0 60.0 45.0 37.5 30.0 15.0
Video streaming
Video success ratio 0.1276 76.6 38.3 30.6 23.0 19.1 15.3 7.66
Video MOS average 0.0363 21.8 10.9 8.7 6.5 5.4 4.4 2.18
Video MOS 10th percentile
0.0363 21.8 10.9 8.7 6.5 5.4 4.4 2.18
Video setup average 0.0099 5.9 3.0 2.4 1.8 1.5 1.2 0.59
Video setup > 10 s ratio
0.0099 5.9 3.0 2.4 1.8 1.5 1.2 0.59
Sum video streaming 0.22 132.0 66.0 52.8 39.6 33.0 26.4 13.2
HTTP browsing and social media
Browsing success ratio 0.25333 152.0 76.0 60.8 45.6 38.0 30.4 15.20
Browsing duration average
0.10857 65.1 32.6 26.1 19.5 16.3 13.0 6.51
Round trip time (RTT) 0.0181 10.9 5.4 4.3 3.3 2.7 2.2 1.09
Social media
Success ratio 0.09375 56.3 28.1 22.5 16.9 14.1 11.3 5.63
Social media duration average
0.05625 33.8 16.9 13.5 10.1 8.4 6.8 3.38
Sum browsing/ social media
0.53 318.0 159.0 127.2 95.4 79.5 63.6 31.80
Sum data services 1 600 300 240 180 150 120 60
B-1.3 Improvement in pointsThe following tables give an indication of the improvement in points if a KPI is changed across all regions by a certain margin. It is anticipated that the improvement stays between the bad and good limit. An improvement outside the limits will have less or no effect due to saturation.
The following formula is applied:
Change in KPI Improvement in points = 1000 points × × Weightingin overall Good limit – Bad limit

40
Table 27: NPS V1.0 voice available improvement potential
Weighting in telephony
Weighting in overall
Maximum points
KPI Improvement in points (in overall score)
Bad limit
Good limit
Changes KPI by
Call setup success ratio (CSSR)
0.3125 0.1250 125 85 % 100 % 0.1 % 0.8
Call drop ratio (CDR) 0.3750 0.1500 150 10 % 0 % –0.1 % 1.5
Call setup time (CST) average
0.0625 0.0250 25 12 s 4.5 s –1 s 3.3
CST > 15 s ratio 0.0875 0.0350 35 3 % 0 % –1 % 11.7
CST 10th percentile 0.0375 0.0150 15 8 s 4 s –1 s 3.8
Voice MOS average 0.0438 0.0175 17.5 2 4.3 0.1 MOS 0.8
Voice MOS < 1.6 ratio
0.0562 0.0225 22.5 10 % 0 % -–1 % 2.2
Voice MOS 90th percentile
0.0250 0.0100 10 4 4.75 0.1 MOS 1.3
Table 28: NPS V1.0 data available improvement potential
Weighting in data services
Weighting in overall
Maximum points
KPI Improvement in points (in overall score)
Bad limit
Good limit
Changes KPI by
HTTP UL/DL success ratio
0.055 0.033 33 80 % 100 % 1.0 % 1.65
HTTP DL throughput average
0.035 0.021 21 2 Mbit/s50 Mbit/s
1 Mbit/s 0.44
HTTP DL throughput 10th percentile
0.045 0.027 27 2 Mbit/s10 Mbit/s
1 Mbit/s 3.375
HTTP DL throughput 90th percentile
0.0175 0.011 10.510 Mbit/s
120 Mbit/s
1 Mbit/s 0.1
HTTP UL throughput average
0.035 0.021 210.5 Mbit/s
35 Mbit/s
1 Mbit/s 0.60
HTTP UL throughput 10th percentile
0.045 0.027 270.5 Mbit/s
4 Mbit/s 1 Mbit/s 7.7
HTTP UL throughput 90th percentile
0.0175 0.011 10.5 5 Mbit/s45 Mbit/s
1 Mbit/s 0.4
Video success ratio 0.1276 0.077 76.6 80 % 100 % 1.0 % 3.85
Video MOS average 0.0363 0.022 21.8 3 4.5 0.1 MOS 1.5
Video MOS 10th percentile
0.0363 0.022 21.8 2 4 0.1 MOS 1.1
Video setup average 0.0099 0.006 5.9 7.0 s 2.0 s –1 s 1.2
Video setup > 10 s ratio
0.0099 0.006 5.9 5 % 0 % –1.0 % 1.2
Browsing success ratio
0.25333 0.152 152 80 % 100 % 1.0 % 7.6
Browsing duration average
0.10857 0.065 65.1 6.0 s 1.0 s –1 s 13
Round trip time (RTT)
0.0181 0.011 10.9 150 ms 30 ms –10 ms 0.73
Social media success ratio
0.09375 0.056 56.3 80 % 100 % 1.0 % 2.8
Social media duration average
0.05625 0.034 33.8 15 s 3 s –1 s 2.8

Rohde & Schwarz | White paper Network Performance Score 41
B-1.4 Abbreviations
Abbreviation Designation
3GPP3rd generation partnership project: globally recognized specifications and standards for GSM and eventually 3G network deployments
CA carrier aggregation: technology used in LTE to improve data throughput
DC dual carrier: technology used in WCDMA to improve data throughput
CSFB
circuit switched fallback: technology that allows LTE devices to fall back to WCDMA networks in order to establish phone calls when VoLTE is not available.
CSFB was specified in 3GPP Release 8. CSFB requires a software upgrade of the operator’s core and radio network.
CSFB is often seen as an interim solution for LTE operators. Voice over LTE (VoLTE) is considered to be the long-term goal for the delivery of voice services on LTE networks.
ETSIEuropean Telecommunications Standards Institute: independent, nonprofit, standard-ization organization in the telecommunications industry with members across five continents.
EU end user
GSMglobal system for mobile communications: normally operating in 900 MHz and 1800 MHz bands
IRATinter-radio access technology: allows handover and cell change between different technologies, such as 3G and 2G depending on the covered area of each technology.
ITU-T International Telecommunication Union – Telecommunication Standardization Sector
KPI key performance indicator
KQI key quality indicator
MNO mobile network operator
MIMO
multiple input, multiple output: antenna technology for wireless communications in which multiple antennas are used at both the transmitter and the destination receiver. The antennas at each end of the communications circuit are combined to minimize errors and optimize data speed.
NGN next generation network
NP network performance
NQDInetwork quality data investigator (NQDI Classic): postprocessing system that maxi-mizes the potential of data collected by QualiPoc and diversity products for network and service optimization and benchmarking
OpCo operating company related to the customer group
OMG object management group
PM performance monitoring
QoS quality of service
RFS ready for service
RATradio access technology: the underlying physical connection method for a wireless based communications network. Many UEs support several RATs in one device such as Bluetooth®, Wi-Fi, 2G, 3G or LTE.
SA service availability
SPoC single point of contact
SUA service unavailability
UE user equipment (usually mobile phones, smartphones or modems)
WCDMA wideband code division multiple access. ITU IMT-2000 family of 3G standards.
The Bluetooth® word mark and logos are registered trademarks owned by Bluetooth SIG, Inc. and any use of such marks by Rohde & Schwarz is under license.

42
CUSTOMER SUPPORTTechnical support – where and when you need itFor quick, expert help with any Rohde & Schwarz product, contact one of our customer support centers. A team of highly qualified engineers will provide telephone support and work with you to find a solution to your query regarding applications or any aspect of operating and programming Rohde & Schwarz equipment.
Up-to-date information and upgradesTo keep your instrument up to date and stay informed about new relevant application notes, simply send an email to the customer support center stating your instrument and your request. We will make sure you get the information you need.
Regional contactEurope, Africa, Middle East Phone +49 89 4129 [email protected]
North America Phone 1-888-TEST-RSA (1-888-837-8772)[email protected]
Latin AmericaPhone [email protected]
Asia/PacificPhone +65 65 13 04 [email protected]
ChinaPhone +86-800-810-8228 /[email protected]

Rohde & Schwarz | White paper Network Performance Score 43
3608
.177
5.52
01.
00 P
DP
1 e
n
Regional contact ► Europe, Africa, Middle East | +49 89 4129 12345
► North America | 1 888 TEST RSA (1 888 837 87 72)
► Latin America | +1 410 910 79 88
► Asia Pacific | +65 65 13 04 88
► China | +86 800 810 82 28 | +86 400 650 58 96
Rohde & SchwarzThe Rohde & Schwarz electronics group offers innovative solutions in the following business fields: test and mea-surement, broadcast and media, secure communications, cybersecurity, monitoring and network testing. Founded more than 80 years ago, the independent company which is headquartered in Munich, Germany, has an extensive sales and service network with locations in more than 70 countries.
www.rohde-schwarz.com
R&S® is a registered trademark of Rohde & Schwarz GmbH & Co. KG
Trade names are trademarks of the owners
PD 3608.1775.52 | Version 01.00 | December 2019 (jr)
White paper | Network Performance Score
Data without tolerance limits is not binding | Subject to change
© 2019 Rohde & Schwarz GmbH & Co. KG | 81671 Munich, Germany
Mobile network testingThe company’s broad and diverse product portfolio for mobile network testing addresses every test scenario in the network lifecycle – from base station installation to network acceptance and network benchmarking, from op-timization and troubleshooting to interference hunting and spectrum analysis, from IP application awareness to QoS and QoE of voice, data, video and app-based services. www.rohde-schwarz.com/mnt
3608177552